1. Report Overview
1.1 Global Natural Gas Storage Market Overview
1.2 Market Structure Overview and Market Definition
1.3 Why You Should Read This Report
1.4 How This Report Delivers
1.5 Key Questions Answered by This Analytical Report Include:
1.6 Who is This Report For?
1.7 Methodology
1.7.1 Primary Research
1.7.2 Secondary Research
1.7.3 Market Evaluation & Forecasting Methodology
1.8 Frequently Asked Questions (FAQ)
1.9 Associated Visiongain Reports
1.10 About Visiongain
2. Introduction to the Natural Gas Storage Market
2.1 Natural Gas Storage Market Structure
2.2 Natural Gas Storage Market Definition
2.3 Natural Gas Storage Industry Analysis
2.4 Natural Gas Storage Value Chain Analysis
3. Global Natural Gas Storage Market 2017-2027
3.1 Global Natural Gas Storage Market Forecasts 2017-2027
3.2 Market Scope Analysis of Natural Gas Storage
3.3 Global Natural Gas Storage Market Drivers and Restraints
4. Natural Gas Storage Submarkets Forecasts 2017-2027
4.1 Natural Gas Storage Submarket by Type of Storage Forecasts 2017-2027
4.1.1 Global Above Ground Storage Natural Gas Storage Forecasts 2017-2027
4.1.2 Global Underground Storage Natural Gas Storage Forecasts 2017-2027
4.1.3 Storage Type Submarket Driver and Restraints
4.1.4 The U.S. Planned Storage Type Greenfield Projects
4.1.5 The U.S. Planned Storage Type Expansion Projects
4.2 Natural Gas Storage Submarket by Type of Technology Forecasts 2017-2027
4.2.1 Global LNG Tankers Natural Gas Storage Forecasts 2017-2027
4.2.2 Salt Caverns Technology Type Natural Gas Storage Forecasts 2017-2027
4.2.3 Aquifers Technology Type Natural Gas Storage Forecasts 2017-2027
4.2.4 Depleted Oil and Gas Reservoirs & Rock Caverns Technology Type Natural Gas Storage Forecasts 2017-2027
4.2.5 Technology Type Submarket Driver and Restraints
4.2.6 Global Natural Gas Projects by Technology
5. Leading National Natural Gas Storage Market Forecasts 2017-2027
5.1 The U.S. Natural Gas Storage Market 2017-2027
5.1.1 The U.S Gas Storage Market Forecast 2017-2027
5.1.2 The U.S. Natural Gas Storage Submarket Forecast 2017-2027
5.1.3 The U.S. Natural Gas Storage Market Analysis
5.2 Canada Natural Gas Storage Market 2017-2027
5.2.1 Canada Gas Storage Market Forecast 2017-2027
5.2.2 Canada Natural Gas Storage Submarket Forecast 2017-2027
5.2.3 Canada Natural Gas Storage Market Analysis
5.3 Russia Natural Gas Storage Market 2017-2027
5.3.1 Russia Gas Storage Market Forecast 2017-2027
5.3.2 Russia Natural Gas Storage Submarket Forecast 2017-2027
5.3.3 Russia Natural Gas Storage Market Analysis
5.4 Ukraine Natural Gas Storage Market 2017-2027
5.4.1 Ukraine Gas Storage Market Forecast 2017-2027
5.4.2 Ukraine Natural Gas Storage Submarket Forecast 2017-2027
5.4.3 Ukraine Natural Gas Storage Market Analysis
5.5 Germany Natural Gas Storage Market 2017-2027
5.5.1 Germany Gas Storage Market Forecast 2017-2027
5.5.2 Germany Natural Gas Storage Submarket Forecast 2017-2027
5.5.3 Germany Natural Gas Storage Market Analysis
5.6 Italy Natural Gas Storage Market 2017-2027
5.6.1 Italy Gas Storage Market Forecast 2017-2027
5.6.2 Italy Natural Gas Storage Submarket Forecast 2017-2027
5.6.3 Italy Natural Gas Storage Market Analysis
5.7 Rest of Europe Natural Gas Storage Market 2017-2027
5.7.1 Rest of Europe Gas Storage Market Forecast 2017-2027
5.7.2 Rest of Europe Natural Gas Storage Submarket Forecast 2017-2027
5.7.3 Rest of Europe Natural Gas Storage Market Analysis
5.8 China Natural Gas Storage Market 2017-2027
5.8.1 China Gas Storage Market Forecast 2017-2027
5.8.2 China Natural Gas Storage Submarket Forecast 2017-2027
5.8.3 China Natural Gas Storage Market Analysis
5.9 Japan Natural Gas Storage Market 2017-2027
5.9.1 Japan Gas Storage Market Forecast 2017-2027
5.9.2 Japan Natural Gas Storage Submarket Forecast 2017-2027
5.9.3 Japan Natural Gas Storage Market Analysis
5.10 Rest of Asia Pacific Natural Gas Storage Market 2017-2027
5.10.1 Rest of Asia-Pacific Gas Storage Market Forecast 2017-2027
5.10.2 Rest of Asia Pacific Natural Gas Storage Submarket Forecast 2017-2027
5.10.3 Rest of Asia Pacific Natural Gas Storage Market Analysis
5.11 Iran Natural Gas Storage Market 2017-2027
5.11.1 Iran Gas Storage Market Forecast 2017-2027
5.11.2 Iran Natural Gas Storage Submarket Forecast 2017-2027
5.11.3 Iran Natural Gas Storage Market Analysis
5.12 Argentina Natural Gas Storage Market 2017-2027
5.12.1 Argentina Gas Storage Market Forecast 2017-2027
5.12.2 Argentina Natural Gas Storage Submarket Forecast 2017-2027
5.12.3 Argentina Natural Gas Storage Market Analysis
5.13 Others Natural Gas Storage Market 2017-2027
5.13.1 The Natural Gas Storage Market Forecast 2017-2027
5.13.2 Others Natural Gas Storage Submarket Forecast 2017-2027
5.13.3 Others Natural Gas Storage Market Analysis
6. PESTEL Analysis of the Natural Gas Storage Market
6.1 Political Impact of Natural Gas Storage Market
6.2 Economical Impact of Natural Gas Storage Market
6.3 Social Impact of Natural Gas Storage Market
6.4 Technological Impact of Natural Gas Storage Market
6.5 Environmental Impact of Natural Gas Storage Market
6.6 Legal Impact of Natural Gas Storage Market
7. Expert Opinion
7.1 Assistant Manager, Pipeline Operations, Oil and Natural Gas Corporation Limited (ONGC), India
7.1.1 Market Volume in terms of Billion Cubic Meters (BCM)
7.1.2 Key Drivers and Restraints Natural Gas Storage Market
7.1.3 Key Storage Type Facilities and Growth Rte
7.1.4 Leading Regions and Companies in the Natural Gas Storages Market
7.1.5 Overall Growth Rate, Globally
8. Leading Companies in Natural Gas Storage Market
8.1 Spectra Energy Corporation
8.2 Chiyoda Corporation
8.3 Gazprom
8.4 Niska Gas Storage Partners LLC
8.5 Centrica Storage Ltd.
8.6 TransCanada Corporation
8.7 Engie S.A.
8.8 Enbridge Gas Distribution Inc.
8.9 Cardinal Gas Storage Partners LLC
8.10 NAFTA A.S
9. Conclusions and Recommendations
9.1 Key Findings
9.2 Outlook for the Natural Gas Storage Market
10. Glossary
Appendices
List of Tables
Table 1.1 Natural Gas Storage Market by Regional Market Forecast 2017-2027 (MCM, AGR %, CAGR)
Table 3.1 Global Natural Gas Storage Market, by Region Forecast 2017-2027 (MCM, AGR %, CAGR %, Cumulative)
Table 3.2 Global Natural Gas Storage Market Drivers and Restraints
Table 4.1 Global Natural Gas Storage Market ,by Storage Type Forecast 2017-2027 (MCM, AGR %, CAGR %, Cumulative)
Table 4.2 Global Above Ground Storage Natural Gas Storage Market by Forecast 2017-2027 (MCM, AGR %, CAGR %, Cumulative)
Table 4.3 Global Underground Storage Natural Gas Storage Market by Forecast 2017-2027 (MCM, AGR %, CAGR %, Cumulative)
Table 4.4 Storage Type Submarket Drivers and Restraints
Table 4.5 The U.S. Planned Storage Type Planned Projects
Table 4.6 The U.S. Planned Storage Type Expansion Projects
Table 4.7 Global Natural Gas Storage Market, by Technology Type Forecast 2017-2027 (MCM, AGR %, Cumulative)
Table 4.8 Global LNG Tankers Natural Gas Storage Market Forecast 2017-2027 (MCM, AGR, CAGR, Cumulative)
Table 4.9 Global Salt Cavern Natural Gas Storage Market Forecast 2017-2027 (MCM, AGR, CAGR, Cumulative)
Table 4.10 Global Aquifers Natural Gas Storage Market Forecast 2017-2027 (MCM, AGR, CAGR, Cumulative)
Table 4.11 Global Depleted Oil and Gas Reservoirs & Rock Caverns Natural Gas Storage Market Forecast 2017-2027 (MCM, AGR, CAGR, Cumulative)
Table 4.12 Technology Type Submarket Drivers and Restraints
Table 4.13 Global Technology Type Projects, Country, Facility Location/Project Name, Status, Start-Up Year, Technology Type, Onshore/Offshore, Operator, Working Gas, and Withdrawal Technique
Table 5.1 Leading National Natural Gas Storage Market Forecast by Submarket 2017-2027 (MCM, AGR)
Table 5.2 The U.S. Natural Gas Storage Market by Forecast 2017-2027 (MCM, AGR %, CAGR %, Cumulative)
Table 5.3 The U.S. Natural Gas Storage Market, by Storage Type Forecast 2017-2027 (MCM, AGR %, CAGR %, Cumulative)
Table 5.4 The U.S. Natural Gas Storage Market, by Technology Forecast 2017-2027 (MCM, AGR %, CAGR %, Cumulative)
Table 5.5 Canada Natural Gas Storage Market by Forecast 2017-2027 (MCM, AGR %, CAGR %, Cumulative)
Table 5.6 Canada Natural Gas Storage Market, by Storage Type Forecast 2017-2027 (MCM, AGR %, CAGR %, Cumulative)
Table 5.7 Canada Natural Gas Storage Market, by Technology Forecast 2017-2027 (MCM, AGR %, CAGR %, Cumulative)
Table 5.8 Russia Natural Gas Storage Market by Forecast 2017-2027 (MCM, AGR %, CAGR %, Cumulative)
Table 5.9 Russia Natural Gas Storage Market, by Storage Type Forecast 2017-2027 (MCM, AGR %, CAGR %, Cumulative)
Table 5.10 Russia Natural Gas Storage Market, by Technology Forecast 2017-2027 (MCM, AGR %, CAGR %, Cumulative)
Table 5.11 Ukraine Natural Gas Storage Market by Forecast 2017-2027 (MCM, AGR %, CAGR %, Cumulative)
Table 5.12 Ukraine Natural Gas Storage Market, by Storage Type Forecast 2017-2027 (MCM, AGR %, CAGR %, Cumulative)
Table 5.13 Ukraine Natural Gas Storage Market, by Technology Forecast 2017-2027 (MCM, AGR %, CAGR %, Cumulative)
Table 5.14 Germany Natural Gas Storage Market by Forecast 2017-2027 (MCM, AGR %, CAGR %, Cumulative)
Table 5.15 Germany Natural Gas Storage Market, by Storage Type Forecast 2017-2027 (MCM, AGR %, CAGR %, Cumulative)
Table 5.16 Germany Natural Gas Storage Market, by Technology Forecast 2017-2027 (MCM, AGR %, CAGR %, Cumulative)
Table 5.17 Italy Natural Gas Storage Market by Forecast 2017-2027 (MCM, AGR %, CAGR %, Cumulative)
Table 5.18 Italy Natural Gas Storage Market, by Storage Type Forecast 2017-2027 (MCM, AGR %, CAGR %, Cumulative)
Table 5.19 Italy Natural Gas Storage Market, by Technology Forecast 2017-2027 (MCM, AGR %, CAGR %, Cumulative)
Table 5.20 Rest of Europe Natural Gas Storage Market by Forecast 2017-2027 (MCM, AGR %, CAGR %, Cumulative)
Table 5.21 Rest of Europe Natural Gas Storage Market, by Storage Type Forecast 2017-2027 (MCM, AGR %, CAGR %, Cumulative)
Table 5.22 Rest of Europe Natural Gas Storage Market, by Technology Forecast 2017-2027 (MCM, AGR %, CAGR %, Cumulative)
Table 5.23 China Natural Gas Storage Market by Forecast 2017-2027 (MCM, AGR %, CAGR %, Cumulative)
Table 5.24 China Natural Gas Storage Market, by Storage Type Forecast 2017-2027 (MCM, AGR %, CAGR %, Cumulative)
Table 5.25 China Natural Gas Storage Market, by Technology Forecast 2017-2027 (MCM, AGR %, CAGR %, Cumulative)
Table 5.26 Japan Natural Gas Storage Market by Forecast 2017-2027 (MCM, AGR %, CAGR %, Cumulative)
Table 5.27 Japan Natural Gas Storage Market, by Storage Type Forecast 2017-2027 (MCM, AGR %, CAGR %, Cumulative)
Table 5.28 Japan Natural Gas Storage Market, by Technology Forecast 2017-2027 (MCM, AGR %, CAGR %, Cumulative)
Table 5.29 Rest of Asia Pacific Natural Gas Storage Market by Forecast 2017-2027 (MCM, AGR %, CAGR %, Cumulative)
Table 5.30 Rest of Asia Pacific Natural Gas Storage Market, by Storage Type Forecast 2017-2027 (MCM, AGR %, CAGR %, Cumulative)
Table 5.31 Rest of Asia Pacific Natural Gas Storage Market, by Technology Forecast 2017-2027 (MCM, AGR %, CAGR %, Cumulative)
Table 5.32 Iran Natural Gas Storage Market by Forecast 2017-2027 (MCM, AGR %, CAGR %, Cumulative)
Table 5.33 Iran Natural Gas Storage Market, by Storage Type Forecast 2017-2027 (MCM, AGR %, CAGR %, Cumulative)
Table 5.34 Iran Natural Gas Storage Market, by Technology Forecast 2017-2027 (MCM, AGR %, CAGR %, Cumulative)
Table 5.35 Argentina Natural Gas Storage Market by Forecast 2017-2027 (MCM, AGR %, CAGR %, Cumulative)
Table 5.36 Argentina Natural Gas Storage Market, by Storage Type Forecast 2017-2027 (MCM, AGR %, CAGR %, Cumulative)
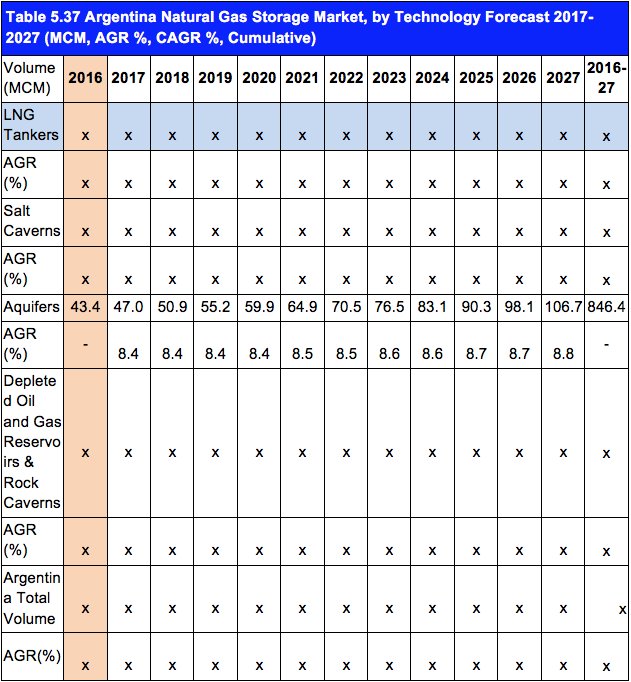
Table 5.37 Argentina Natural Gas Storage Market, by Technology Forecast 2017-2027 (MCM, AGR %, CAGR %, Cumulative)
Table 5.38 Others Natural Gas Storage Market by Forecast 2017-2027 (MCM, AGR %, CAGR %, Cumulative)
Table 5.39 Others Natural Gas Storage Market, by Storage Type Forecast 2017-2027 (MCM, AGR %, CAGR %, Cumulative)
Table 5.40 Others Natural Gas Storage Market, by Technology Forecast 2017-2027 (MCM, AGR %, CAGR %, Cumulative)
Table 6.1 PESTEL Analysis, Natural Gas Storage Market
Table 8.1 Spectra Energy Corporation Profile 2015 (Market Entry, Public/Private, Headquarter, Total Company Sales $bn, Change in Revenue, Geography, Key Market, Company Sales from Natural Gas Storage Market, Listed on, Products/Services Strongest Business Region, Business Segment in the Market, Submarket Involvement, No. of Employees)
Table 8.2 Spectra Energy Corporation Total Company Revenue 2011-2015 ($bn, AGR %)
Table 8.3 Chiyoda Corporation Profile 2015(Market Entry, Public/Private, Headquarter, Total Company Sales $mn, Change in Revenue, Geography, Key Market, Company Sales from Natural Gas Storage Market, Listed on, Products/Services Strongest Business Region, Business Segment in the Market, Submarket Involvement, No. of Employees)
Table 8.4 Chiyoda Corporation, Total Company Sales 2012-2015 ($bn, AGR %)
Table 8.5 Gazprom Profile 2015(Market Entry, Public/Private, Headquarter, Total Company Sales $bn, Change in Revenue, Geography, Key Market, Company Sales from Natural Gas Storage Market, Listed on, Products/Services Strongest Business Region, Business Segment in the Market, Submarket Involvement, No. of Employees)
Table 8.6 Gazprom Total Company Sales 2011-2015 ($bn, AGR %)
Table 8.7 Niska Gas Storage Partners LLC Profile 2015(Market Entry, Public/Private, Headquarter, Total Company Sales $mn, Change in Revenue, Geography, Key Market, Company Sales from Natural Gas Storage Market, Listed on, Products/Services Strongest Business Region, Business Segment in the Market, Submarket Involvement, No. of Employees)
Table 8.8 Niska Gas Storage Partners LLC Total Company Sales 2012-2016 ($mn, AGR %)
Table 8.9 Centrica Storage Ltd. Company Profile 2015 (Market Entry, Public/Private, Headquarter, Total Company Sales US$m, Change in Revenue, Geography, Key Market, Company Sales from Natural Gas Storage Market, Listed on, Products/Services Strongest Business Region, Business Segment in the Market, Submarket Involvement, No. of Employees)
Table 8.10 Centrica Storage Ltd. Total Company Sales 2011-2015 ($bn, AGR %)
Table 8.11 TransCanada Corporation Company Profile 2015 (Market Entry, Public/Private, Headquarter, Total Company Sales $mn, Change in Revenue, Geography, Key Market, Company Sales from Natural Gas Storage Market, Listed on, Products/Services Strongest Business Region, Business Segment in the Market, Submarket Involvement, No. of Employees)
Table 8.12 TransCanada Corporation Total Company Sales 2011-2015 ($bn, AGR %)
Table 8.13 TransCanada Corporation, Near, Medium, and Long-Term Planned Projects
Table 8.14 Engie S.A. Company Profile 2015(Market Entry, Public/Private, Headquarter, Total Company Sales US$m, Change in Revenue, Geography, Key Market, Company Sales from Natural Gas Storage Market, Listed on, Products/Services Strongest Business Region, Business Segment in the Market, Submarket Involvement, No. of Employees)
Table 8.15 Engie S.A., Total Company Sales 2011-2015 ($bn, AGR %)
Table 8.16 Enbridge Gas Distribution Inc. Profile 2015(Market Entry, Public/Private, Headquarter, Total Company Sales US$m, Change in Revenue, Geography, Key Market, Company Sales from Natural Gas Storage Market, Listed on, Products/Services Strongest Business Region, Business Segment in the Market, Submarket Involvement, No. of Employees)
Table 8.17 Cardinal Gas Storage Partners LLC Profile 2015(Market Entry, Public/Private, Headquarter, Total Company Sales $mn, Change in Revenue, Geography, Key Market, Company Sales from Natural Gas Storage Market, Listed on, Products/Services Strongest Business Region, Business Segment in the Market, Submarket Involvement, No. of Employees)
Table 8.18 NAFTA A.S. Profile 2015 (Market Entry, Public/Private, Headquarter, Total Company Sales $bn, Change in Revenue, Geography, Key Market, Company Sales from Natural Gas Storage Market, Listed on, Products/Services Strongest Business Region, Business Segment in the Market, Submarket Involvement, No. of Employees)
List of Figures
Figure 1.1 Natural Gas Storage Market by Regional Market Share Forecast 2017, 2022, 2027 (% Share)
Figure 2.1 Global Natural Gas Storage Market Segmentation Overview
Figure 2.2 Global Energy Usage, % Share, By Fuel Type, 2016
Figure 2.3 Historical and Projected Global Energy Demand (1980-2030)
Figure 2.4 Historical Henry Hub Natural Gas Spot Pricing (Jan 2012- Dec 2016)
Figure 2.5 Global Natural Gas Storage Market, Value Chain Analysis
Figure 3.1 Global Natural Gas Storage Market Forecast 2017-2027 (MCM, AGR %)
Figure 3.2 Natural Gas Storage Market by Regional Market Share Forecast 2017, 2022, 2027 (% Share)
Figure 3.3 Global Natural Gas Storage Market, Market Attractiveness, By Region
Figure 4.1 Global Storage Type Submarket Forecast 2017-2027 (MCM, AGR%)
Figure 4.2 Global Natural Gas Storage Market by Storage Type Share Forecast 2017, 2022, 2027 (% Share)
Figure 4.3 Natural Gas Storage Market, By Above Ground Storage, Forecast 2017-2027 (MCM, AGR%)
Figure 4.4 Global Natural Gas Storage Market, By Underground Storage, Forecast 2017-2027 (MCM, AGR%)
Figure 4.5 Technology Type Submarket Forecast 2017-2027 (MCM, AGR)
Figure 4.6 Natural Gas Storage Market by Technology Type Share Forecast 2017, 2022, 2027 (%Share)
Figure 4.7 Global Natural Gas Storage Market, By LNG Tankers Forecast 2017-2027 (MCM, AGR)
Figure 4.8 Global Natural Gas Storage Market, By Salt Caverns Forecast 2017-2027 (MCM, AGR)
Figure 4.9 Global Natural Gas Storage Market, By Aquifers Forecast 2017-2027 (MCM, AGR)
Figure 4.10 Global Natural Gas Storage Market, By Depleted Oil and Gas Reservoirs & Rock Caverns Forecast 2017-2027 (MCM, AGR)
Figure 5.1 Leading Regional Players in Natural Gas Storage Share, 2017
Figure 5.2 Leading Regional Players in Natural Gas Storage Share, 2022
Figure 5.3 Leading Regional Players in Natural Gas Storage, Share, 2027
Figure 5.4 Total Proved Natural Gas Reserves, by Region (Tcf), 2014
Figure 5.5 Total Natural Gas Production, by Region (Tcf), 2014
Figure 5.6 Total Natural Gas Consumption, by Region (Tcf), 2014
Figure 5.7 The U.S. Natural Gas Storage Market Forecast 2017-2027 (MCM, AGR %)
Figure 5.8 Canada Natural Gas Storage Market Forecast 2017-2027 (MCM, AGR %)
Figure 5.9 Canada Natural Gas Usage, by Sector, 2015
Figure 5.10 Russia Natural Gas Storage Market Forecast 2017-2027 (MCM, AGR %)
Figure 5.11 Ukraine Natural Gas Storage Market Forecast 2017-2027 (MCM, AGR %)
Figure 5.12 Germany Natural Gas Storage Market Forecast 2017-2027 (MCM, AGR %)
Figure 5.13 Italy Natural Gas Storage Market Forecast 2017-2027 (MCM, AGR %)
Figure 5.14 Rest of Europe Natural Gas Storage Market Forecast 2017-2027 (MCM, AGR %)
Figure 5.15 China Natural Gas Storage Market Forecast 2017-2027 (MCM, AGR %)
Figure 5.16 Japan Natural Gas Storage Market Forecast 2017-2027 (MCM, AGR %)
Figure 5.17 Rest of Asia Pacific Natural Gas Storage Market Forecast 2017-2027 (MCM, AGR %)
Figure 5.18 Iran Natural Gas Storage Market Forecast 2017-2027 (MCM, AGR %)
Figure 5.19 Argentina Natural Gas Storage Market Forecast 2017-2027 (MCM, AGR %)
Figure 5.20 Others Natural Gas Storage Market Forecast 2017-2027 (MCM, AGR %)
Figure 8.1 Spectra Energy Corporation, % Revenue Share, by Business Segment, 2015
Figure 8.2 Spectra Energy Corporation Total Company Revenue, ($bn & AGR %), 2011-2015
Figure 8.3 Chiyoda Corporation, % Revenue Share, by Business Segment, 2015
Figure 8.4 Chiyoda Corporation Company Revenue, ($bn& AGR %), 2012-2016
Figure 8.5 Gazprom, % Revenue Share, by Business Segment, 2015
Figure 8.6 Gazprom, Revenue, ($bn & AGR %), 2011-2015
Figure 8.7 Niska Gas Storage Partners LLC, % Revenue Share, by Gas Storage Contracts Segment, 2016
Figure 8.8 Niska Gas Storage Partners LLC, % Revenue Share, by Country Segment, 2016
Figure 8.9 Niska Gas Storage Partners LLC, by Gas Storage Capacity (BCF) Growth, 2014-2016
Figure 8.10 Niska Gas Storage Partners LLC, Revenue, ($mn & AGR %), 2011-2015
Figure 8.11 Centrica Storage Ltd., % Revenue Share, by Business Segment, 2016
Figure 8.12 Centrica Storage Ltd., % Revenue Share, by Regional Segment, 2015
Figure 8.13 Centrica Storage Ltd., Revenue, ($bn & AGR %), 2011-2015
Figure 8.14 TransCanada Corporation, % Revenue Share, by Business Segment, 2015
Figure 8.15 TransCanada Corporation Revenue, ($bn & AGR %), 2011-2015
Figure 8.16 Engie S.A., % Revenue Share, by Business Segment, 2015
Figure 8.17 Engie S.A., % Revenue Share, by Regional Segment, 2015
Figure 8.18 Engie S.A., Revenue, ($bn, AGR %), 2011-2015
Figure 8.19 Enbridge Gas Distribution Inc., % Share by Number of Active Customers, 2015