Visiongain has calculated that the global Offshore Oil & Gas Decommissioning market will see a capital expenditure (CAPEX) of $6,551.9 mn in 2018. Read on to discover the potential business opportunities available.
One of the major challenges faced by the oil and gas industry worldwide is the prevalence of low oil prices. Low oil prices worldwide have negatively affected the oil and gas industry
With such established global offshore oil and gas fields, decommissioning becomes increasingly pertinent. As global offshore oil and gas fields mature, ageing structures must be removed. With the average lifetime of an offshore oil and gas field in the region of 25 to 40 years, this leaves many global structures in need of decommissioning.
The cost involved in the decommissioning varies from project to project and coast to coast. The majority of costs are associated with the jacket, topside and subsea structure removal phases and well P&A.
Decommissioning projects are highly complex, lengthy and expensive; the process involves many different stages and can take more than a decade to complete. With such environmental, economic and social pressures, the offshore decommissioning market is set to drastically increase, creating substantial business opportunities along the way.
Visiongain’s global Offshore Oil & Gas Decommissioning market report can keep you informed and up to date with the developments in the market, across four different regions: The Gulf of Mexico and North America, the North Sea, Asia Pacific and Rest of the World
With reference to this report, it details the key investments trend in the global market, subdivided by regions, capital and operational expenditure and project type. Through extensive secondary research and interviews with industry experts, visiongain has identified a series of market trends that will impact the Offshore Oil & Gas Decommissioning market over the forecast timeframe.
The report will answer questions such as:
– How is the offshore oil & gas decommissioning market evolving?
– What is driving and restraining the offshore oil & gas decommissioning market?
– What are the estimated market shares of each segment of the overall offshore oil & gas decommissioning market in 2018?
– How will each offshore oil & gas decommissioning submarket segment grow over the forecast period and how much revenue will these submarkets account for in 2028?
– How will the market shares for each offshore oil & gas Decommissioning submarket develop from 2018 to 2028?
– What will be the main driver for the overall market from 2018 to 2028?
– Will leading offshore oil & gas decommissioning markets broadly follow the macroeconomic dynamics, or will individual national markets outperform others?
– How will the market shares of the national markets change by 2028 and which geographical region will lead the market in 2028?
– Who are the leading players and what are their prospects over the forecast period?
– How will the industry evolve during the period between 2018 and 2028?
Five Reasons Why You Must Order and Read This Report Today:
1) The report provides forecasts for the Global Offshore Oil & Gas Decommissioning market, by TYPE, for the period 2018-2028
– Well P&A CAPEX 2018-2028
– Jackside & Topside Removal CAPEX 2018-2028
– Others CAPEX 2018-2028
2) The report also forecasts and analyses the global Offshore Oil & Gas Decommissioning market by Regions from 2018-2028
– Gulf of Mexico and North America CAPEX 2018-2028
– North Sea CAPEX 2018-2028
– Asia-Pacific CAPEX 2018-2028
– Rest of the World CAPEX 2018-2028
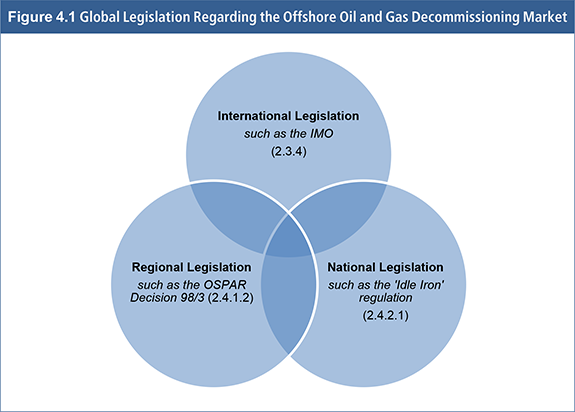
3) The report reveals global regulations and agreements affecting the Offshore Oil and Gas Decommissioning Industry:
4) The report includes Leading Companies in the Offshore Oil & Gas Decommissioning Market Companies which have been broken down into three groups:
– Companies with Offshore Assets
– Decommissioning Contractors
– Decommissioning Consultancies
5) The report provides detailed profiles of the leading companies operating within the Offshore Oil & Gas Decommissioning market:
– Apache Corporation
– BP
– Canadian Natural Resources (CNR)
– Chevron Corporation
– ConocoPhillips
– Eni
– ExxonMobil Corporation
– Petronas
– PTTEP Australasia
– Royal Dutch Shell
– Statoil
– Total S.A.
– AF Gruppen (The AF Group)
– Aker Solutions
– Allseas Group
– AMEC
– Baker Hughes
– Cal Dive International
– Cutting Underwater Technologies (CUT)
– Halliburton
– Heerema Marine Contractors (HMC)
– Mactech Inc.
– Mammoet Salvage
– Oceaneering (Norse Cutting and Abandonment)
– Pipeline Services International (PSI)
– Proserv
– Saipem
– SapuraAcergy
– Schlumberger
– Stork Technical Services
– Subsea 7
– Technip
– TETRA Technologies, Inc.
– Weatherford International
– Wild Well Control
– Wood Group
– BMT Cordah
– Bureau Veritas
– Eric Faulds Associates, Ltd.
– Genesis Oil and Gas Consultants Ltd.
– Optimus
– PB Consultants
– Ramboll
– Reverse Engineering Services, Ltd (RESL)
– TSB Offshore
– WorleyParsons
This independent 141-page report guarantees you will remain better informed than your competitors. With 104 tables and figures examining the Offshore Oil & Gas Decommissioning market space, the report gives you a direct, detailed breakdown of the market. PLUS, Capital expenditure by Type and by Region, as well as in-Depth profiles of Companies that will keep your knowledge that one step ahead of your rivals.
This report is essential reading for you or anyone in the Oil and Gas sector. Purchasing this report today will help you to recognise those important market opportunities and understand the possibilities there. I look forward to receiving your order.
Visiongain is a trading partner with the US Federal Government
CCR Ref number: KD4R6
1. Report Overview
1.1 Global Offshore Oil & Gas Decommissioning Market Overview
1.2 Global Offshore Oil & Gas Decommissioning Market Segmentation
1.3 Market Definition
1.4 How This Report Delivers
1.5 Key Questions Answered by This Analytical Report Include:
1.6 Why You Should Read This Report?
1.7 Who is This Report For?
1.8 Methodology
1.9 Frequently Asked Questions (FAQ)
1.10 Associated Visiongain Reports
1.11 About Visiongain
2. Introduction and Brief History of Offshore Oil & Gas Decommissioning
2.1 What are the stages of Offshore Oil & Gas Decommissioning?
2.1.1 Project Planning and Permitting
2.1.2 Well Plugging and Abandonment (P&A)
2.1.3 Pipeline Cleaning and Decommissioning
2.1.4 Jacket and Topsides Removal
2.1.5 Onshore Disposal
2.1.6 Site Clearance
2.1.7 Continued Monitoring
3. Global Offshore Oil & Gas Decommissioning Market: What are the Market Dynamics of the Global Market for Offshore Oil & Gas Decommissioning?
3.1 Drivers and Restraints
3.2 Drivers: What are the Factors Promoting the Growth in the Offshore Oil & Gas Decommissioning Market?
3.2.1 Aging of Oil and Gas Fields and Offshore Infrastructure
3.2.2 Declining Crude Oil Prices
4. Global Regulations Regarding the Offshore Oil and Gas Decommissioning Industry
4.1 1958 Geneva Convention on the Continental Shelf
4.2 1972 London Dumping Convention
4.3 1982 United Nations (UN) Law of the Sea Convention
4.4 International Maritime Organization (IMO) Guidelines
5. Offshore Oil & Gas Decommissioning Markets Forecasts By Type 2018-2028
5.1 Offshore Oil & Gas Decommissioning of Well P&A Market Forecast 2018 2028
5.2 Jackside & Topside Removal Offshore Oil & Gas Decommissioning Market Forecast 2018 2028
5.3 Other Offshore Oil & Gas Decommissioning Market Forecast 2018 2028
6. Offshore Oil & Gas Decommissioning Market Forecast By Region 2018-2028
6.1 Which Geographic Regional Offshore Oil & Gas Decommissioning Markets Share Forecast 2018-2028
6.2 Gulf of Mexico and North America Offshore Oil & Gas Decommissioning Market Forecast 2018-2028
6.2.1 North American Regulations
6.2.2 Notice to Lessees and Operators on “Idle Iron”
6.2.3 National Artificial Reef Plan
6.2.4 What is the Structure of the Gulf of Mexico Offshore Oil and Gas Decommissioning Market?
6.2.5 What are the Market Dynamics of the Gulf of Mexico Offshore Oil and Gas Decommissioning Market?
6.2.5.1 The Impact of Ageing Offshore Structures
6.2.5.2 How Strong Regulations have had a Role to Play in the Growth of the Offshore Decommissioning Market in the Gulf of Mexico?
6.2.5.3 Hurricane Damage
6.2.5.4 The Impact of Rigs-to-Reef
6.2.5.5 Has Experience and Skills Led to Market Growth in the Gulf of Mexico?
6.2.5.6 Growth of Unconventional Energy Resources – the Shale Oil and Gas Revolution
6.2.5.7 The Impact of Investments to Prolong the Life of the Fields
6.2.5.8 Permitting Process – Has this Prolonged the Offshore Decommissioning Procedure?
6.2.6 What is the Scenario of Offshore Oil & Gas Decommissioning in Gulf of Mexico and North America Market by Type?
6.2.7 Which is the Largest Market among the Gulf of Mexico and North America Offshore Oil & Gas Decommissioning Market 2018-2028?
6.2.7.1 The Gulf of Mexico Offshore Oil & Gas Decommissioning Market Forecast 2018-2028
6.2.7.2 Rest of NAFTA Offshore Oil & Gas Decommissioning Market Forecast 2018-2028
6.3 North Sea Offshore Oil & Gas Decommissioning Market Forecast 2018-2028
6.3.1 Characteristics of the North Sea Offshore Oil and Gas Decommissioning Market
6.3.2 Historical Trends in the North Sea Offshore Oil and Gas Decommissioning Market
6.3.3 European Regulations
6.3.3.1 The Marine Strategy Framework Directive
6.3.3.2 The Oslo/Paris (OSPAR) Agreements
6.3.3.3 EU Water Framework Directive
6.3.3.4 EU Habitats and Birds Directives
6.3.3.5 United Kingdom Regulations
6.3.3.5.1 The Petroleum Act 1998
6.3.3.5.2 Energy Act 2008
6.3.3.6 Norwegian Regulations
6.3.3.6.1 The Petroleum Activities Act 1996
6.3.3.6.2 The Pollution Control Act
6.3.4 What is the Scenario of Offshore Oil & Gas Decommissioning in the North Sea Market by Type?
6.3.5 Which is the Largest Market among the North Sea Offshore Oil & Gas Decommissioning Market 2018-2028?
6.3.5.1 UK North Sea Offshore Oil & Gas Decommissioning Market Forecast 2018-2028
6.3.5.2 Norwegian North Sea Offshore Oil & Gas Decommissioning Market Forecast 2018-2028
6.3.5.3 Rest of North Sea Offshore Oil & Gas Decommissioning Market Forecast 2018-2028
6.4 Asia-Pacific Offshore Oil & Gas Decommissioning Market Forecast 2018-2028
6.4.1 Characteristics of the Asia-Pacific Offshore Oil and Gas Decommissioning Market
6.4.2 What are the Dynamics in Asia-Pacific’s Offshore Oil & Gas Decommissioning Market?
6.4.2.1 Substantial Number of Ageing Structures
6.4.2.2 What are the Decommissioning Conditions in Asia-Pacific?
6.4.2.3 The Limitations of Regulation
6.4.2.4 Lack of Training, Expertise, Equipment and Facilities
6.4.2.5 Deepwater Development and Increasing Production – an Obstruction to Offshore Decommissioning?
6.4.2.6 NOC Control and Budgets
6.4.3 What is the Scenario of Offshore Oil & Gas Decommissioning in the Asia-Pacific Market by Type?
6.4.4 Which is the Largest Market among the Asia-Pacific Offshore Oil & Gas Decommissioning Market?
6.4.4.1 China Offshore Oil & Gas Decommissioning Market Forecast 2018-2028
6.4.4.2 Japan Offshore Oil & Gas Decommissioning Market Forecast 2018-2028
6.4.4.3 Australia Offshore Oil & Gas Decommissioning Market Forecast 2018-2028
6.4.4.4 Rest of APAC Offshore Oil & Gas Decommissioning Market Forecast 2018-2028
6.5 RoW Offshore Oil & Gas Decommissioning Market Forecast 2018-2028
6.5.1 What is the Scenario of Offshore Oil & Gas Decommissioning in the RoW market by Type?
6.5.2 Which is the Largest Market among the RoW Offshore Oil & Gas Decommissioning Market?
6.5.2.1 Latin America Offshore Oil & Gas Decommissioning Market Forecast 2018-2028
6.5.2.2 Middle East and Africa Offshore Oil & Gas Decommissioning Market Forecast 2018-2028
7. PEST Analysis of the Global Offshore Oil and Gas Decommissioning Market
8. Leading Companies in the Offshore Oil & Gas Decommissioning Market
8.1 Oil and Gas Companies with Offshore Assets
8.1.1 Apache Corporation
8.1.2 BP
8.1.3 Canadian Natural Resources (CNR)
8.1.4 Chevron Corporation
8.1.5 ConocoPhillips
8.1.6 Eni
8.1.7 ExxonMobil Corporation
8.1.8 Petronas
8.1.9 PTTEP Australasia
8.1.10 Royal Dutch Shell
8.1.11Statoil
8.1.12 Total S.A.
8.2 Decommissioning Contractors
8.2.1 AF Gruppen (The AF Group)
8.2.2 Aker Solutions
8.2.3 Allseas Group
8.2.4 AMEC
8.2.5 Baker Hughes
8.2.6 Cal Dive International
8.2.7 Cutting Underwater Technologies (CUT)
8.2.8 Halliburton
8.2.9 Heerema Marine Contractors (HMC)
8.2.10 Mactech Inc.
8.2.11 Mammoet Salvage
8.2.12 Oceaneering (Norse Cutting and Abandonment)
8.2.13 Pipeline Services International (PSI)
8.2.14 Proserv
8.2.15 Saipem
8.2.16 SapuraAcergy
8.2.17 Schlumberger
8.2.18 Stork Technical Services
8.2.19 Subsea 7
8.2.20 Technip
8.2.21 TETRA Technologies, Inc.
8.2.22 Weatherford International
8.2.23 Wild Well Control
8.2.24 Wood Group
8.3 Decommissioning Consultancies
8.3.1 BMT Cordah
8.3.2 Bureau Veritas
8.3.3 Eric Faulds Associates, Ltd.
8.3.4 Genesis Oil and Gas Consultants Ltd.
8.3.5 Optimus
8.3.6 PB Consultants
8.3.7 Ramboll
8.3.8 Reverse Engineering Services, Ltd (RESL)
8.3.9 TSB Offshore
8.3.10 WorleyParsons
9. Conclusions and Recommendations
9.1 Key Findings
9.2 Recommendations
10. Glossary
Appendix
Associated Visiongain Reports
Visiongain Report Sales Order Form
Appendix A
Appendix B
Visiongain Report Evaluation Form
List of Tables
Table 1.1 Regional Offshore Oil & Gas Decommissioning Markets Forecasts ($Mn, AGR (%), 2018-2028
Table 5.1 Global Offshore Oil & Gas Decommissioning Market by Type Forecast ($Mn, AGR (%), CAGR (%), 2017-2022
Table 5.2 Global Offshore Oil & Gas Decommissioning Market by Type Forecast ($Mn, AGR (%), CAGR (%), 2023-2028
Table 5.3 Global Well P&A Offshore Oil & Gas Decommissioning Market Forecast ($Mn), AGR (%), CAGR (%), 2017-2022
Table 5.4 Global Well P&A Offshore Oil & Gas Decommissioning Market Forecast ($Mn), AGR (%), CAGR (%), 2023-2028
Table 5.5 Global Jackside & Topside Removal Offshore Oil & Gas Decommissioning Market Forecast ($Mn), AGR (%), CAGR (%), 2017-2022
Table 5.6 Global Jackside & Topside Removal Offshore Oil & Gas Decommissioning Market Forecast ($Mn), AGR (%), CAGR (%), 2023-2028
Table 5.7 Global Other Offshore Oil & Gas Decommissioning Market Forecast ($Mn), AGR (%), CAGR (%), 2017-2022
Table 5.8 Global Other Offshore Oil & Gas Decommissioning Market Forecast ($Mn), AGR (%), CAGR (%), 2023-2028
Table 6.1 Regional Offshore Oil & Gas Decommissioning Markets Forecasts ($Mn), AGR (%), 2017-2022
Table 6.2 Regional Offshore Oil & Gas Decommissioning Markets Forecasts ($Mn), AGR (%), 2023-2028
Table 6.3 Gulf of Mexico and North America Offshore Oil & Gas Decommissioning Market Forecast ($Mn), AGR (%), CAGR (%), 2017-2022
Table 6.4 Gulf of Mexico and North America Offshore Oil & Gas Decommissioning Market Forecast ($Mn), AGR (%), CAGR (%), 2023-2028
Table 6.5 Gulf of Mexico and North America Offshore Oil & Gas Decommissioning Market by Type Forecast ($Mn), AGR (%), CAGR (%), 2017-2022
Table 6.6 Gulf of Mexico and North America Offshore Oil & Gas Decommissioning Market by Type Forecast ($Mn), AGR (%), CAGR (%), 2023-2028
Table 6.7 The Gulf of Mexico Offshore Oil & Gas Decommissioning Market Forecast ($Mn), AGR (%), CAGR (%), 2017-2022
Table 6.8 The Gulf of Mexico Offshore Oil & Gas Decommissioning Market Forecast ($Mn), AGR (%), CAGR (%), 2023-2028
Table 6.9 Rest of NAFTA Offshore Oil & Gas Decommissioning Market Forecast ($Mn), AGR (%), CAGR (%), 2017-2022
Table 6.10 Rest of NAFTA Offshore Oil & Gas Decommissioning Market Forecast ($Mn), AGR (%), CAGR (%), 2023-2028
Table 6.11 North Sea Offshore Oil & Gas Decommissioning Market Forecast ($Mn), AGR (%), CAGR (%), 2017-2022
Table 6.12 North Sea Offshore Oil & Gas Decommissioning Market Forecast ($Mn), AGR (%), CAGR (%), 2023-2028
Table 6.13 North Sea Offshore Oil & Gas Decommissioning Market by Type Forecast ($Mn), AGR (%), CAGR (%), 2017-2022
Table 6.14 North Sea Offshore Oil & Gas Decommissioning Market by Type Forecast ($Mn), AGR (%), CAGR (%), 2023-2028
Table 6.15 UK North Sea Offshore Oil & Gas Decommissioning Market Forecast ($Mn), AGR (%), CAGR (%), 2017-2022
Table 6.16 UK North Sea Offshore Oil & Gas Decommissioning Market Forecast ($Mn), AGR (%), CAGR (%), 2023-2028
Table 6.17 Norwegian North Sea Offshore Oil & Gas Decommissioning Market Forecast ($Mn), AGR (%), CAGR (%), 2017-2022
Table 6.18 Norwegian North Sea Offshore Oil & Gas Decommissioning Market Forecast ($Mn), AGR (%), CAGR (%), 2023-2028
Table 6.19 Rest of North Sea Offshore Oil & Gas Decommissioning Market Forecast ($Mn), AGR (%), CAGR (%), 2017-2022
Table 6.20 Rest of North Sea Offshore Oil & Gas Decommissioning Market Forecast ($Mn), AGR (%), CAGR (%), 2023-2028
Table 6.21 Asia-Pacific Offshore Oil & Gas Decommissioning Market Forecast ($Mn), AGR (%), CAGR (%), 2017-2022
Table 6.22 Asia-Pacific Offshore Oil & Gas Decommissioning Market Forecast ($Mn), AGR (%), CAGR (%), 2023-2028
Table 6.23 Asia-Pacific Offshore Oil & Gas Decommissioning Market by Type Forecast ($Mn), AGR (%), CAGR (%), 2017-2022
Table 6.24 Asia-Pacific Offshore Oil & Gas Decommissioning Market by Type Forecast ($Mn), AGR (%), CAGR (%), 2023-2028
Table 6.25 China Offshore Oil & Gas Decommissioning Market Forecast ($Mn), AGR (%), CAGR (%), 2017-2022
Table 6.26 China Offshore Oil & Gas Decommissioning Market Forecast ($Mn), AGR (%), CAGR (%), 2023-2028
Table 6.27 Japan Offshore Oil & Gas Decommissioning Market Forecast ($Mn), AGR (%), CAGR (%), 2017-2022
Table 6.28 Japan Offshore Oil & Gas Decommissioning Market Forecast ($Mn), AGR (%), CAGR (%), 2023-2028
Table 6.29 Australia Offshore Oil & Gas Decommissioning Market Forecast ($Mn), AGR (%), CAGR (%), 2017-2022
Table 6.30 Australia Offshore Oil & Gas Decommissioning Market Forecast ($Mn), AGR (%), CAGR (%), 2023-2028
Table 6.31 Rest of APAC Offshore Oil & Gas Decommissioning Market Forecast ($Mn), AGR (%), CAGR (%), 2017-2022
Table 6.32 Rest of APAC Offshore Oil & Gas Decommissioning Market Forecast ($Mn), AGR (%), CAGR (%), 2023-2028
Table 6.33 RoW Offshore Oil & Gas Decommissioning Market Forecast ($Mn), AGR (%), CAGR (%), 2017-2022
Table 6.34 RoW Offshore Oil & Gas Decommissioning Market Forecast ($Mn), AGR (%), CAGR (%), 2023-2028
Table 6.35 RoW Offshore Oil & Gas Decommissioning Market by Type Forecast ($Mn), AGR (%), CAGR (%), 2017-2022
Table 6.36 RoW Offshore Oil & Gas Decommissioning Market by Type Forecast ($Mn), AGR (%), CAGR (%), 2023-2028
Table 6.37 Latin America Offshore Oil & Gas Decommissioning Market Forecast ($Mn), AGR (%), CAGR (%), 2017-2022
Table 6.38 Latin America Offshore Oil & Gas Decommissioning Market Forecast ($Mn), AGR (%), CAGR (%), 2023-2028
Table 6.39 Middle East and Africa Offshore Oil & Gas Decommissioning Market Forecast ($Mn), AGR (%), CAGR (%), 2017-2022
Table 6.40 Middle East and Africa Offshore Oil & Gas Decommissioning Market Forecast ($Mn), AGR (%), CAGR (%), 2023-2028
List of Figures
Figure 1.1 Offshore Oil & Gas Decommissioning by Type Market Forecast (AGR (%), 2018-2028
Figure 1.2 Leading Offshore Oil & Gas Decommissioning Market Players
Figure 1.3 Global Offshore Oil & Gas Decommissioning Market Segmentation
Figure 2.1 Stages in Offshore Oil and Gas Decommissioning?
Figure 3.1 Global Offshore Oil & Gas Decommissioning Market Drivers and Restraints 2018-2028
Figure 3.2 Monthly WTI and Brent Oil Prices (January 2014 – July 2017)
Figure 4.1 Global Legislation Regarding the Offshore Oil and Gas Decommissioning Market
Figure 5.1 Global Offshore Oil & Gas Decommissioning Market Forecast ($Mn, AGR (%), 2018-2028
Figure 5.2 Global Well P&A Offshore Oil & Gas Decommissioning Market by Region Forecast ($Mn, AGR (%), 2018-2028
Figure 5.3 Global Jackside & Topside Removal Offshore Oil & Gas Decommissioning Market by Region Forecast ($Mn), AGR (%), 2018-2028
Figure 5.4 Global Other Offshore Oil & Gas Decommissioning Market by Region Forecast ($Mn), AGR (%), 2018-2028
Figure 6.1 Regional Offshore Oil & Gas Decommissioning Markets Forecasts ($Mn, AGR (%), 2018-2028
Figure 6.2 Regional and Leading National Offshore Oil & Gas Decommissioning Markets Forecasts (AGR (%), 2018-2028
Figure 6.3 Regional Offshore Oil & Gas Decommissioning Markets Share Forecast (% Share), 2018
Figure 6.4 Regional Offshore Oil & Gas Decommissioning Markets Share Forecast (% Share), 2023
Figure 6.5 Regional Offshore Oil & Gas Decommissioning Markets Share Forecast (% Share), 2028
Figure 6.6 Gulf of Mexico and North America Offshore Oil & Gas Decommissioning Market Forecast ($Mn), AGR (%), 2018-2028
Figure 6.7 Gulf of Mexico and North America Offshore Oil & Gas Decommissioning Market Share Forecast (% Share), 2018, 2023 and 2028
Figure 6.8 Gulf of Mexico and North America Offshore Oil & Gas Decommissioning Market Forecast ($Mn), AGR (%), 2018-2028
Figure 6.9 Gulf of Mexico and North America Offshore Oil & Gas Decommissioning Market By Country (% Share), 2018
Figure 6.10 The Gulf of Mexico Offshore Oil & Gas Decommissioning Market Forecast ($Mn), AGR (%), 2018-2028
Figure 6.11 The Gulf of Mexico Offshore Oil & Gas Decommissioning Market Share Forecast (% Share), 2018, 2023 and 2028
Figure 6.12 Rest of NAFTA Offshore Oil & Gas Decommissioning Market Forecast ($Mn), AGR (%), 2018-2028
Figure 6.13 Rest of NAFTA Offshore Oil & Gas Decommissioning Market Share Forecast (% Share), 2018, 2023 and 2028
Figure 6.14 North Sea Offshore Oil & Gas Decommissioning Market Forecast ($Mn), AGR (%), 2018-2028
Figure 6.15 North Sea Offshore Oil & Gas Decommissioning Market Share Forecast (% Share), 2018, 2023 and 2028
Figure 6.16 North Sea Offshore Installations by Country (%) 2018
Figure 6.17 North Sea Offshore Oil & Gas Decommissioning Market Forecast ($Mn), AGR (%), 2018-2028
Figure 6.18 North Sea Offshore Oil & Gas Decommissioning Market By Country (% Share), 2018
Figure 6.19 UK North Sea Offshore Oil & Gas Decommissioning Market Forecast ($Mn), AGR (%), 2018-2028
Figure 6.20 UK North Sea Offshore Oil & Gas Decommissioning Market Share Forecast (% Share), 2018, 2023 and 2028
Figure 6.21 Norwegian North Sea Offshore Oil & Gas Decommissioning Market Forecast ($Mn), AGR (%), 2018-2028
Figure 6.22 Norwegian North Sea Offshore Oil & Gas Decommissioning Market Share Forecast (% Share), 2018, 2023 and 2028
Figure 6.23 Rest of North Sea Offshore Oil & Gas Decommissioning Market Forecast ($Mn), AGR (%), 2018-2028
Figure 6.24 Rest of North Sea Offshore Oil & Gas Decommissioning Market Share Forecast (% Share), 2018, 2023 and 2028
Figure 6.25 Asia-Pacific Offshore Oil & Gas Decommissioning Market Forecast ($Mn), AGR (%), 2018-2028
Figure 6.26 Asia-Pacific Offshore Oil & Gas Decommissioning Market Share Forecast (% Share), 2018, 2023 and 2028
Figure 6.27 Asia-Pacific Offshore Oil & Gas Decommissioning Market Forecast ($Mn), AGR (%), 2018-2028
Figure 6.28 Asia-Pacific Offshore Oil & Gas Decommissioning Market By Country (% Share), 2018
Figure 6.29 China Offshore Oil & Gas Decommissioning Market Forecast ($Mn), AGR (%), 2018-2028
Figure 6.30 China Offshore Oil & Gas Decommissioning Market Share Forecast (% Share), 2018, 2023 and 2028
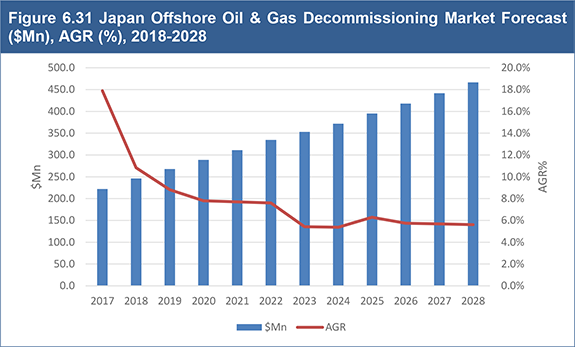
Figure 6.31 Japan Offshore Oil & Gas Decommissioning Market Forecast ($Mn), AGR (%), 2018-2028
Figure 6.32 Japan Offshore Oil & Gas Decommissioning Market Share Forecast (% Share), 2018, 2023 and 2028
Figure 6.33 Australia Offshore Oil & Gas Decommissioning Market Forecast ($Mn), AGR (%), 2018-2028
Figure 6.34 Australia Offshore Oil & Gas Decommissioning Market Share Forecast (% Share), 2018, 2023 and 2028
Figure 6.35 Rest of APAC Offshore Oil & Gas Decommissioning Market Forecast ($Mn), AGR (%), 2018-2028
Figure 6.36 Rest of APAC Offshore Oil & Gas Decommissioning Market Share Forecast (% Share), 2018, 2023 and 2028
Figure 6.37 RoW Offshore Oil & Gas Decommissioning Market Forecast ($Mn), AGR (%), 2018-2028
Figure 6.38 RoW Offshore Oil & Gas Decommissioning Market Share Forecast (% Share), 2018, 2023 and 2028
Figure 6.39 RoW Offshore Oil & Gas Decommissioning Market Forecast ($Mn), AGR (%), 2018-2028
Figure 6.40 RoW Offshore Oil & Gas Decommissioning Market By Region (% Share), 2018
Figure 6.41 Latin America Offshore Oil & Gas Decommissioning Market Forecast ($Mn), AGR (%), 2018-2028
Figure 6.42 Latin America Offshore Oil & Gas Decommissioning Market Share Forecast (% Share), 2018, 2023 and 2028
Figure 6.43 Middle East and Africa Offshore Oil & Gas Decommissioning Market Forecast ($Mn), AGR (%), 2018-2028
Figure 6.44 Middle East and Africa Offshore Oil & Gas Decommissioning Market Share Forecast (% Share), 2018, 2023 and 2028