Industries > Pharma > Medical Devices Leader Series: Top In Vitro Diagnostics (IVD) Companies 2019-2029
Medical Devices Leader Series: Top In Vitro Diagnostics (IVD) Companies 2019-2029
Danaher Corporation, Abbott Laboratories, Bio-Rad Laboratories, Roche, Siemens AG, Sysmex, Other Companies
The global in vitro diagnostics (IVD) market is estimated to have reached $69.2bn in 2018. The largest sector of the IVD market in 2018 was point of care diagnostics segment, generating sales of $19.4bn in 2018, which accounted for 28.0% of overall IVD sales.
How this report will benefit you
Read on to discover how you can exploit the future business opportunities emerging in this sector.
In this brand new 204-page report you will receive 180 charts– all unavailable elsewhere.
The 204-page report provides clear detailed insight into the leading in vitro diagnostics (IVD) companies. Discover the key drivers and challenges affecting the market.
By ordering and reading our brand-new report today you stay better informed and ready to act.
Report Scope
• In Vitro Diagnostics (IVD) revenues in 2017 and 2018 by Class:
• Point-of-Care
• Clinical Chemistry
• Immunochemistry
• Hematology
• Microbiology
• Genetic Testing
• Others
• In Vitro Diagnostics (IVD) revenue forecast for 2019, 2024 and 2029 by Class:
• Point-of-Care
• Clinical Chemistry
• Immunochemistry
• Hematology
• Microbiology
• Genetic Testing
• Others
• This report profiles and discusses the selected leading in vitro diagnostics (IVD) companies:
• Abbott Laboratories
• Arkray, Inc.
• Becton, Dickinson and Company (BD)
• bioMérieux SA
• Bio-Rad Laboratories, Inc.
• Dako (Agilent Technologies)
• Danaher Corporation
• Genomic Health
• Laboratory Corporation of America (LabCorp)
• MDxHealth
• Myriad Genetics
• QIAGEN
• Roche
• Siemens AG
• Sysmex Corporation
• Thermo Fisher Scientific
• Other companies
• This report discusses sales and recent performance analysis, key products, strengths and challenges, historical revenues, revenue forecast, market share forecast, mergers and acquisition (M&A) activity, strategic collaborations
• Analysis of factors that drive and restrain the in vitro diagnostics (IVD) market.
• Key Questions Answered by this Report:
• Who are the leading IVD manufacturers?
• What factors are driving and restraining growth for the leading IVD manufacturers?
• How have the leading IVD manufacturers performed financially in recent years?
• Which IVD manufacturers will experience revenue growth over the coming years?
• What are the strength and weakness of the leading IVD manufacturers?
• What strategies have IVD manufacturers been implementing for sales growth in recent years?
Visiongain’s study is intended for anyone requiring commercial analyses for the leading in vitro diagnostics (IVD) companies. You find data, trends and predictions.
Buy our report today Medical Devices Leader Series: Top In Vitro Diagnostics (IVD) Market Analysis : Danaher Corporation, Abbott Laboratories, Bio-Rad Laboratories, Roche, Siemens AG, Sysmex, Other Companies.
Visiongain is a trading partner with the US Federal Government
CCR Ref number: KD4R6
Do you have any custom requirements we can help you with? Any need for specific country, geo region, market segment or specific company information? Contact us today, we can discuss your needs and see how we can help: sara.peerun@visiongain.com
1. Report Overview
1.1 How This Report Delivers Information
1.2 Main Questions This Report Answers
1.3 Who is This Report for?
1.4 Methods of Research and Analysis
1.5 Frequently Asked Questions (FAQs)
1.6 Associated Visiongain Reports
1.7 About Visiongain
2. An Introduction to In Vitro Diagnostics
2.1 The In Vitro Diagnostics Market
2.1.1 The In Vitro Diagnostics Market in 2018
2.2 What are In Vitro Diagnostic (IVD) Tests?
2.3 Classifying In Vitro Diagnostics
2.3.1 The US Classification
2.3.2 The EC (European Commission) Classification
2.3.3 Regulatory Issues in the IVD Market
2.3.3.1 Regulation of IVD Tests
2.3.3.2 Lack of Clarity Can Be Costly
2.4 Types of IVD Test
2.4.1 Point of Care Diagnostics
2.4.2 Clinical Chemistry
2.4.3 Microbiology
2.4.3.1 Regulatory Differences with IVD Microbiology Tests
2.4.4 Haematology
2.4.5 Immunochemistry
2.4.6 Genetic Testing
2.5 The IVD Market: Overall Revenue Forecast to 2029
2.5.1 Market Drivers, 2019-2029
2.5.2 Market Restraints, 2019-2029
2.5.3 Future of the IVD Industry
2.6 Company Comparison
2.6.1 Fragmented Market
2.6.2 IVD Market: Leading Manufacturers in 2018
3. The Leading US in Vitro Diagnostic Companies, 2019-2029
3.1 Danaher Corporation
3.1.1 Sales and Recent Performance Analysis
3.1.2 Diagnostics
3.1.3 Key Products
3.1.4 Danaher Manufacturing Capabilities
3.1.5 Danaher IVD Segment: Strengths and Challenges
3.1.6 Danaher’s Life Sciences and Diagnostics Revenues
3.1.7 IVD Revenue Forecast, 2018-2029
3.1.8 Recent Mergers and Acquisition (M&A) Activity
3.2 Abbott Laboratories
3.2.1 Sales and Recent Performance Analysis
3.2.2 Abbott: Diagnostics Segment
3.2.2.1 In Vitro Diagnostics Products
3.2.3 Abbott IVD Segment: Strengths and Challenges
3.2.4 Abbott Diagnostics Historical Revenues, 2015-2017
3.2.5 IVD Revenue Forecast, 2019-2029
3.2.6 Recent M&A Activity and Strategic Collaborations
3.2.6.1 Collaboration with GSK
3.2.6.2 Collaboration with Merck
3.2.6.3 Acquisition of Alere, Inc.
3.3 Bio-Rad Laboratories, Inc.
3.3.1 Sales and Recent Performance Analysis
3.3.2 Clinical Diagnostics
3.3.2.1 In Vitro Diagnostics
3.3.3 IVD Revenue 2018
3.3.4 IVD Revenue Forecast, 2019-2029
3.3.5 Recent M&A Activity and Strategic Collaborations
3.3.6 Potential Bio-Rad Labs Takeover Seen in Near-Term
3.4 Becton, Dickinson and Company
3.4.1 Global Presence
3.4.2 Distribution
3.4.3 R&D
3.4.4 Sales and Recent Performance Analysis
3.4.4.1 Historical Sales Performance Analysis
3.4.5 BD Diagnostics Revenue
3.4.6 IVD Revenue Forecast, 2019-2029
3.4.7 Recent M&A Activity and Strategic Collaborations
3.5 Thermo Fisher Scientific
3.5.1 Historical Sales and Recent Performance Analysis
3.5.2 Clinical Diagnostics
3.5.3 Key Products
3.5.4 Thermo Fisher’s Manufacturing Capabilities
3.5.5 Thermo Fisher’s Diagnostics Revenues
3.5.6 IVD Revenue Forecast 2019-2029
3.5.7 Recent Mergers and Acquisition Activity
4. The Leading European In Vitro Diagnostic Companies, 2019-2029
4.1 Hoffmann-La Roche Ltd.
4.1.1 Global Presence
4.1.2 Sales and Recent Performance Analysis
4.1.3 Roche Diagnostics
4.1.4 R&D Capabilities
4.1.5 Growing Portfolio of Diagnostic Products
4.1.5.1 Exploring Strategies in the Neurological Sector
4.1.6 IVD Revenue Forecast 2019-2029
4.1.7 Recent M&A Activity and Strategic Collaborations
4.2 Siemens AG
4.2.1 Sales and Recent Performance, 2017
4.2.2 Siemens Healthcare
4.2.2.1 Siemens Diagnostics
4.2.2.2 Outperforming the Market
4.2.2.3 In Vitro Diagnostics
4.2.3 IVD Revenue Forecast 2019-2029
4.2.4 Recent M&A Activity and Strategic Collaborations
4.2.4.1 Partnership with ViiV Healthcare
4.2.4.2 Partnership with Tocagen
4.2.4.3 Acquisition of Fast Track Diagnostics
4.3 bioMérieux S.A.
4.3.1 Sales and Recent Performance, 2017
4.3.2 IVD Revenue Forecast 2019-2029
4.3.3 Recent M&A Activity and Strategic Collaborations
4.3.3.1 Partnership with GSK
4.3.3.2 Partnership with Ipsen
4.3.3.3 Partnership with Institute Merieux and Institute Pasteur
4.3.3.4 Collaboration with Hospices Civils de Lyon
4.3.3.5 Acquisition of ARGENE
4.3.3.6 Equity Interest in Knome
5. The Leading Japanese In Vitro Diagnostic Companies, 2019-2029
5.1 Sysmex Corporation
5.1.1 Global Presence and Distribution
5.1.2 Sales and Recent Performance Analysis
5.1.3 Sysmex Diagnostics
5.1.4 IVD Revenue Forecast 2019-2029
5.1.5 Recent M&A Activity and Strategic Collaborations
5.1.5.1 Acquisition of Katakura’s Research Institute of Biological Science
5.1.5.2 Collaboration with IDEXX Labs to Expand into Animal Diagnostics
5.2 Arkray, Inc.
5.2.1 Global Presence
5.2.2 R&D
5.2.3 IVD Product Portfolio
5.2.4 Sales and Recent Performance Analysis
5.2.5 IVD Revenue Forecast 2019-2029
6. Emerging In Vitro Diagnostic Companies, 2018
6.1 Pipeline and Other Companies: An Overview, 2018
6.2 Other Prominent In Vitro Diagnostic Players
6.3 Dako (Agilent Technologies)
6.3.1 Sales and Recent Performance Analysis
6.3.2 M&A Activity and Other Key Developments
6.4 Genomic Health, Inc.
6.4.1 Sales and Recent Performance Analysis
6.4.2 R&D Capabilities
6.4.2.1 TAILORx Clinical Trial
6.4.2.2 RxPonder Trial
6.4.2.3 Partnership with Oncomed
6.5 Laboratory Corporation of America (LabCorp)
6.5.1 Sales and Recent Performance Analysis
6.5.2 In Vitro Diagnostics
6.6 Recent M&A Activity and Other Key Developments
6.6.1 Non-Exclusive License Agreement with Merck
6.6.2 Acquisition of Genzyme Genetics
6.6.3 Partnership with ARCA Biopharma
6.7 MDxHealth, Inc.
6.7.1 Sales and Recent Performance Analysis, 2017
6.7.2 R&D Capabilities
6.7.3 In Vitro Diagnostics
6.7.3.1 PharmacoMDx
6.7.3.2 PredictMDx for Brain Cancer
6.7.3.3 PredictMDx for Colon Cancer
6.7.3.4 Partnership with GSK
6.8 Myriad Genetics, Inc.
6.8.1 Sales and Recent Performance Analysis
6.8.2 R&D Capabilities
6.8.3 In Vitro Diagnostics
6.8.3.1 Myriad RBM
6.8.4 M&A Activity and Recent Partnerships
6.8.4.1 Agreement with BioMarin Pharmaceutical
6.8.4.2 Acquisition of Myriad RBM
6.8.4.3 Strategic Debt Investment in Crescendo Bioscience
6.8.4.4 Agreement with Cephalon
6.8.4.5 Agreement with PharmaMar
6.9 QIAGEN N.V.
6.9.1 Sales and Recent Performance Analysis
6.9.2 Continued Expansion in the Emerging Markets
6.9.3 R&D Capabilities
6.9.3.1 More than 15 Projects to Co-Develop and Market Diagnostic Products
6.9.3.2 Provider of Choice for Molecular Diagnostic Tools
6.9.4 Recent M&A Activity and Other Developments
6.9.4.1 Acquisition of Cellestis Ltd.
6.9.4.2 Acquisition of Ipsogen
6.9.4.3 Partnership with Pfizer
6.9.4.4 Partnership with Eli Lilly
7. Other In-Vitro Diagnostic Companies, 2018
7.1 Hologic, Inc.
7.1.1 Sales and Recent Performance Analysis
7.1.2 In Vitro Diagnostics
7.1.3 Recent M&A Activity and Strategic Collaborations
7.2 Bayer AG
7.2.1 Sales and Recent Performance Analysis
7.2.2 In Vitro Diagnostics
7.2.3 Recent M&A Activity and Strategic Collaborations
7.3 Transasia Bio-Medicals Ltd.
7.3.1 In Vitro Diagnostics
7.3.2 Recent M&A Activity and Strategic Collaborations
7.4 PerkinElmer, Inc.
7.4.1 Sales and Recent Performance Analysis
7.4.2 In Vitro Diagnostics
7.4.3 Recent M&A Activity and Strategic Collaborations
7.5 DiaSorin S.p.A.
7.5.1 Sales and Recent Performance Analysis
7.5.2 In Vitro Diagnostics
7.5.3 Recent M&A Activity and Strategic Collaborations
7.6 Koninklijke Philips N.V.
7.6.1 Sales and Recent Performance Analysis
7.6.2 In Vitro Diagnostics
7.6.3 Recent M&A Activity and Strategic Collaborations
7.7 Illumina, Inc.
7.7.1 Sales and Recent Performance Analysis
7.7.2 In Vitro Diagnostics
7.7.3 Recent M&A Activity and Strategic Collaborations
7.8 Kem-en-tec Diagnostics A/S
7.8.1 In Vitro Diagnostics
7.8.2 Recent M&A Activity and Strategic Collaborations
8. Conclusions
8.1 In Vitro Diagnostics: Attractive Segment of the Healthcare Market
8.2 Big Pharma Dominated the IVD Market in 2018
8.3 The Rise of ‘Generic Medical Devices’
8.4 What Will Succeed in the IVD Market?
8.5 Small Companies Can Have a Big Impact on the Industry and Market to 2029
Appendices
Associated Visiongain Reports
Visiongain Report Sales Order Form
Appendix A
About Visiongain
Appendix B
Visiongain report evaluation form
List of Tables
Table 2.1 IVD Revenues ($bn) and Market Shares (%) by Class, 2017-2018
Table 2.2 Advantages and Disadvantages of POC Diagnostics
Table 2.3 IVD Tests: Overall World Market and Submarket Revenue Forecasts ($bn), 2018, 2019, 2024 & 2029
Table 2.4 Leading Manufacturers: IVD Market Share (%), 2018
Table 2.5 Leading Companies in the IVD Market: Net Sales ($bn) and Market Shares (%), 2018
Table 3.1 Danaher: Key Facts
Table 3.2 Danaher: Net Sales ($bn) and Revenue Shares (%) by Business Segment, 2017
Table 3.3 Danaher: Life Sciences & Diagnostics Revenue ($bn), AGR (%), 2015-2017
Table 3.4 Danaher: IVD Revenue ($bn), Growth (%), CAGR (%), Market Share (%), Forecast 2019-2029
Table 3.5 Abbott: Key Facts
Table 3.6 Abbott: Net Sales ($bn) and Revenue Shares (%) by Business Segment, 2017
Table 3.7 Abbott: Revenues ($bn) and Revenue Shares (%) by Geographical Region, 2017
Table 3.8 Abbott: Diagnostics Revenue ($bn), AGR (%), 2015-2017
Table 3.9 Abbott: IVD Revenue ($bn), Growth (%), CAGR (%), Market Share (%), Forecast 2019-2029
Table 3.10 Bio-Rad: Key Facts
Table 3.11 Bio-Rad: Clinical Diagnostics Revenue ($bn), AGR (%) 2015-2017
Table 3.12 Bio-Rad: IVD Revenue Forecast ($bn), Growth (%), CAGR (%), Market Share (%) 2019-2029
Table 3.13 BD: Key Facts
Table 3.14 Becton Dickinson: Net Sales ($bn) and Revenue Shares (%) by Sector, 2017
Table 3.15 BD: Diagnostics Revenue ($bn), AGR (%) 2015-2017
Table 3.16 BD: IVD Revenue ($bn), Growth (%), CAGR (%), Market Share (%), Forecast 2019-2029
Table 3.17 Thermo Fisher: Key Facts
Table 3.18 Thermo Fisher: IVD Sales ($bn), AGR (%), 2015-2017
Table 3.19 Thermo Fisher: IVD Revenue ($bn), Growth (%), CAGR (%), Market Share (%), Forecast 2019-2029
Table 4.1 Roche: Key Facts
Table 4.2 Roche: Revenue ($bn) and Revenue Shares (%) by Sector, 2017
Table 4.3 Roche Diagnostics: Revenue ($bn) and Revenue Shares (%) by Sector, 2017
Table 4.4 Roche Diagnostics: Marketed Diagnostic Products
Table 4.5 Roche: IVD Revenue ($bn), Growth (%), CAGR (%), Market Share (%), Forecast 2019-2029
Table 4.6 Siemens: Key Facts
Table 4.7 Siemens: Revenue ($bn) and Revenue Shares (%) by Sector, 2017
Table 4.8 Siemens: Revenue ($bn) and Revenue Shares (%) by Region, 2017
Table 4.9 Siemens: IVD Revenue ($bn), Growth (%), CAGR (%), Market Share (%), Forecast 2019-2029
Table 4.10 bioMérieux: Key Facts
Table 4.11 bioMérieux: Revenue ($bn) and Revenue Shares (%) by Sector, 2017
Table 4.12 bioMérieux: Clinical Applications Revenue ($bn) and Revenue Shares (%) by Sector, 2017
Table 4.13 bioMérieux: IVD Revenue ($bn), Growth (%), CAGR (%), Market Share (%), Forecast 2019-2029
Table 5.1 Sysmex: Key Facts
Table 5.2 Sysmex: Revenue ($bn) by Sector, 2017
Table 5.3 Sysmex: IVD Revenue ($bn), Growth (%), CAGR (%), Market Share (%), Forecast 2019-2029
Table 5.4 Arkray: Key Facts
Table 5.5 Arkray: IVD Revenue ($bn), Growth (%), CAGR (%), Market Share (%), Forecast 2019-2029
Table 6.1 Agilent: Revenue ($bn) and Revenue Shares (%) by Sector, 2017
Table 6.2 Dako: Marketed Diagnostic Products, 2017
Table 6.3 Genomic Health: Revenue ($m) and Revenue Shares (%) by Reporting Segment, 2017
Table 6.4 Genomic Health: R&D Expense ($m) and R&D Expense as a Percentage of Sales (%), 2013-2017
Table 6.5 LabCorp: Revenues ($bn) and Revenue Shares (%) by Reporting Segment, 2017
Table 6.6 Selected List of LabCorp’s Menu of Diagnostic Products, 2017
Table 6.7 MDxHealth: Revenue ($m) and Revenue Shares (%) by Reporting Segment, 2017
Table 6.8 MDxHealth: In Vitro Diagnostics Pipeline, 2017
Table 6.9 Myriad: Revenue ($m) and Revenue Shares (%) by Sector, 2017
Table 6.10 Myriad Molecular Diagnostics: Revenue ($m) and Revenue Shares (%) by Product, 2017
Table 6.11 Myriad Molecular Diagnostics: Revenue ($m) and Revenue Shares (%) by Sector, 2017
Table 6.12 Myriad: Biomarker Product Portfolio, 2017
Table 6.13 Myriad: Diagnostic Products, 2017
Table 6.14 QIAGEN: Revenue ($m) and Revenue Shares (%) by Customer Class, 2017
Table 6.15 QIAGEN: Revenue ($m) and Revenue Shares (%) by Region, 2017
Table 6.16 QIAGEN: Selected List of Co-development Projects
Table 6.17 QIAGEN: Selected Marketed Diagnostic Products
Table 6.18 QIAGEN: Recent M&A Activity
Table 6.19 Other Companies Operating in the IVD Market, 2018
Table 7.1 Hologic, Inc.: Key Facts
Table 7.2 Hologic, Inc.: Revenue ($bn) and Revenue Shares (%) by Reporting Segment, 2017
Table 7.3 Hologic, Inc.: Product Revenue ($bn) and Revenue Shares (%) by Reporting Segment, 2017
Table 7.4 Hologic, Inc.: Clinical Diagnostics Revenue ($bn), AGR (%) 2015-2017
Table 7.5 Bayer AG: Key Facts, 2017
Table 7.6 Bayer AG: Revenue ($bn) and Revenue Shares (%) by Reporting Segment, 2017
Table 7.7 Transasia Bio-Medicals Ltd: Key Facts, 2017
Table 7.8 PerkinElmer, Inc.: Key Facts, 2017
Table 7.9 PerkinElmer, Inc.: Revenue ($bn) and Revenue Shares (%) by Reporting Segment, 2017
Table 7.10 PerkinElmer, Inc.: Product Revenue ($bn) and Revenue Shares (%) by Reporting Segment, 2017
Table 7.11 PerkinElmer, Inc.: Clinical Diagnostics Revenue ($bn), AGR (%) 2015-2017
Table 7.12 DiaSorin: Key Facts, 2017
Table 7.13 DiaSorin: Revenue ($m) and Revenue Shares (%) by Geography, 2017
Table 7.14 Koninklijke Philips N.V.: Key Facts, 2017
Table 7.15 Koninklijke Philips N.V.: Revenue ($bn) and Revenue Shares (%) by Reporting Segment, 2017
Table 7.16 Koninklijke Philips N.V.: Diagnosis & Treatment Revenue ($bn), AGR (%) 2015-2017
Table 7.17 Koninklijke Philips N.V.: Diagnosis & Treatment Product Revenue ($bn) and Revenue Shares (%) by Reporting Segment, 2017
Table 7.18 Illumina, Inc.: Key Facts
Table 7.19 Illumina, Inc.: Revenue ($bn) and Revenue Shares (%) by Reporting Segment, 2017
Table 7.20 Kem-en-tec Diagnostics A/S: Key Facts
Table 8.1 Leading IVD Manufacturers by Company Type, 2018
List of Figures
Figure 2.1 IVD Market ($bn) by Class 2018
Figure 2.2 IVD: Overall Market ($bn) Forecast, 2018, 2019, 2024 & 2029
Figure 2.3 IVD Market: Drivers and Restraints, 2019-2029
Figure 2.4 Leading Companies in the IVD Market: Net Sales ($bn), 2018
Figure 2.5 Leading Companies in the IVD Market: (% Share), 2018
Figure 3.1 Danaher: Net Sales ($bn) by Business Segment, 2017
Figure 3.2 Danaher: Revenue Shares (%) by Business Segment, 2017
Figure 3.3 Danaher: IVD Revenue ($bn) Forecast, AGR (%), 2019-2029
Figure 3.4 Danaher: IVD Market Share (%), 2019-2029
Figure 3.5 Abbott: Net Sales ($bn) by Business Segment, 2017
Figure 3.6 Abbott: Revenue Shares (%) by Business Segment, 2017
Figure 3.7 Abbott: Revenues ($bn) by Region, 2017
Figure 3.8 Abbott: Revenue Shares (%) by Region, 2017
Figure 3.9 Abbott: IVD Revenue ($bn) Forecast, AGR (%), 2019-2029
Figure 3.10 Abbott: IVD Market Share (%), 2019-2029
Figure 3.11 Bio-Rad: Historical Diagnostics Revenues ($bn) 2014-2017
Figure 3.12 Bio-Rad: Revenue Shares (%) by Business Segment, 2017
Figure 3.13 Bio-Rad: Revenue Shares (%) by Region, 2017
Figure 3.14 Bio-Rad: IVD Revenue Forecast ($bn), AGR (%), 2019-2029
Figure 3.15 Bio-Rad: IVD Market Share (%), 2019-2029
Figure 3.16 Becton Dickinson: Revenue Shares (%) by Sector, 2017
Figure 3.17 BD: Company Revenue ($bn), 2015-2017
Figure 3.18 BD IVD Revenue Forecast ($bn), AGR (%), 2019-2029
Figure 3.19 BD: IVD Market Share (%), 2019-2029
Figure 3.20 Thermo Fisher: IVD Net Sales ($bn), 2015-2017
Figure 3.21 Thermo Fisher: Revenue Shares (%) by Sector, 2017
Figure 3.22 Thermo Fisher: IVD Revenue ($bn) Forecast, AGR (%), 2019-2029
Figure 3.23 Thermo Fisher: IVD Market Share (%), 2019-2029
Figure 3.24 Thermo Fisher: Mergers & Acquisitions
Figure 4.1 Roche: Revenues ($bn) by Sector, 2017
Figure 4.2 Roche: Revenue Shares (%) by Sector, 2017
Figure 4.3 Roche Diagnostics: Revenues ($bn) by Sector, 2017
Figure 4.4 Roche Diagnostics: Revenue Shares (%) by Sector, 2017
Figure 4.5 Roche: IVD Revenue ($bn), AGR (%), Forecast, 2019-2029
Figure 4.6 Roche: IVD Market Share (%), 2019-2029
Figure 4.7 Siemens: Revenue Shares (%) by Sector, 2017
Figure 4.8 Siemens Healthcare: Revenue Shares (%) by Region, 2017
Figure 4.9 Siemens: IVD Revenue ($bn), AGR (%), Forecast 2019-2029
Figure 4.10 Siemens: IVD Market Share (%), 2019-2029
Figure 4.11 bioMérieux: Revenue ($bn) by Sector, 2017
Figure 4.12 bioMérieux: Revenue Shares (%) by Sector, 2017
Figure 4.13 bioMérieux: Clinical Applications Revenue ($bn) by Sector, 2017
Figure 4.14 bioMérieux: Clinical Applications Revenue Shares (%) by Sector, 2017
Figure 4.15 bioMérieux: IVD Revenue ($bn), AGR (%), Forecast, 2019-2029
Figure 4.16 bioMérieux: IVD Market Share (%), 2019-2029
Figure 5.1 Sysmex: Revenues ($bn) by Sector, 2017
Figure 5.2 Sysmex: Revenue Shares (%) by Sector, 2017
Figure 5.3 Sysmex: Net Sales (%) by Geographical Region, 2017
Figure 5.4 Sysmex: IVD Revenue ($bn) Forecast, AGR (%), 2019-2029
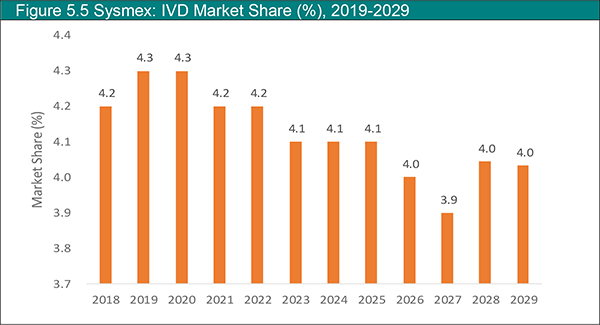
Figure 5.5 Sysmex: IVD Market Share (%), 2019-2029
Figure 5.6 Arkray: IVD Revenue ($bn) Forecast, (AGR %), 2019-2029
Figure 5.7 Arkray: IVD Market Share (%), 2019-2029
Figure 6.1 Agilent: Revenue ($bn) by Sector, 2017
Figure 6.2 Dako: Revenue Shares (%) by Sector, 2017
Figure 6.3 Genomic Health: Historical Revenues ($m) and Net Income ($m), 2013-2017
Figure 6.4 Genomic Health: Revenue Shares (%) by Reporting Segment, 2017
Figure 6.5 Genomic Health: Historical R&D Expense ($m) and R&D as a Percentage of Net Sales (%), 2013-2017
Figure 6.6 LabCorp: Historical Revenue ($bn), Profit ($bn), 2013-2017
Figure 6.7 LabCorp: Revenues ($bn) by Reporting Segment, 2017
Figure 6.8 LabCorp: Revenue Shares (%) by Reporting Segment, 2017
Figure 6.9 MDxHealth: Revenues ($m) by Reporting Segment, 2017
Figure 6.10 MDxHealth: Revenue Shares (%) by Reporting Segment, 2017
Figure 6.11 Myriad: Historical Net Revenues ($m), 2013-2017
Figure 6.12 Myriad: Revenue Shares (%) by Sector, 2017
Figure 6.13 Myriad Molecular Diagnostics: Revenue Shares (%) by Product, 2017
Figure 6.14 Myriad Molecular Diagnostics: Revenue Shares (%) by Sector, 2017
Figure 6.15 Myriad: Historical R&D Investments ($m), 2013-2017
Figure 6.16 QIAGEN: Historical Revenue ($bn), Net Income ($bn), 2013-2017
Figure 6.17 QIAGEN: Revenues ($m) by Customer Class, 2017
Figure 6.18 QIAGEN: Revenue Shares (%) by Customer Class, 2017
Figure 6.19 QIAGEN: Revenue Shares (%) by Region, 2017
Figure 6.20 QIAGEN: Historical R&D Expense ($m) and R&D Expense as a Percentage of Net Revenue (%), 2013-2017
Figure 7.1 Hologic, Inc.: Historical Revenues ($bn) and Net Income ($bn), 2013-2017
Figure 7.2 Hologic, Inc.: Revenue Shares (%) by Reporting Segment, 2017
Figure 7.3 Hologic, Inc.: Revenue Shares (%) by Reporting Segment, 2017
Figure 7.4 Hologic, Inc.: Revenue Shares (%) by Region, 2017
Figure 7.5 Hologic, Inc.: Diagnostics Revenue Shares (%), 2017
Figure 7.6 Bayer AG: Historical Revenues ($bn) and Net Income ($bn), 2013-2017
Figure 7.7 Bayer AG: Revenue Shares (%) by Reporting Segment, 2017
Figure 7.8 Bayer AG: Revenue Shares (%) by Region, 2017
Figure 7.9 PerkinElmer, Inc.: Historical Revenues ($bn), 2013-2017
Figure 7.10 PerkinElmer, Inc.: Revenue Shares (%) by Reporting Segment, 2017
Figure 7.11 PerkinElmer, Inc.: Revenue Shares (%) by Reporting Segment, 2017
Figure 7.12 PerkinElmer, Inc.: Revenue Shares (%) by Region, 2017
Figure 7.13 PerkinElmer, Inc.: Diagnostics Revenue Shares (%), 2017
Figure 7.14 DiaSorin: Historical Revenues ($m), 2013-2017
Figure 7.15 DiaSorin: Revenue Shares (%) by Region, 2017
Figure 7.16 Koninklijke Philips N.V.: Historical Revenues ($bn), 2013-2017
Figure 7.17 Koninklijke Philips N.V.: Revenue Shares (%) by Reporting Segment, 2017
Figure 7.18 Koninklijke Philips N.V.: Revenue Shares (%) by Region, 2017
Figure 7.19 Koninklijke Philips N.V.: Diagnosis & Treatment Revenue ($b), 2017
Figure 7.20 Koninklijke Philips N.V.: Diagnosis & Treatment Revenue ($bn) by Product, 2017
Figure 7.21 Koninklijke Philips N.V.: Diagnosis & Treatment Revenue Shares (%) by Product, 2017
Figure 7.22 Illumina, Inc.: Historical Revenues ($bn) and Net Income ($bn), 2013-2017
Figure 7.23 Illumina, Inc.: Revenue Shares (%) by Reporting Segment, 2017
Figure 7.24 Illumina, Inc.: Revenue Shares (%) by Region, 2017
Figure 8.1 IVD Market: Overall World Revenue ($bn), (AGR%) 2019-2029
Figure 8.2 IVD Market: Revenue ($bn) Forecasts, 2018, 2019, 2024, and 2029
AB SCIEX
Abbott Laboratories
AbD Serotec
Agilent Technologies
Alacris Theranostics GmbH
Alere
Amoy Diagnostics Co. Ltd
Analytical Informatics, Inc.
Arca biopharma
ARGENE
Arkray, Inc.
Astute Medical
Bayer
Beckman Coulter
Becton Dickinson
BioFire Diagnostics, LLC
BioMarin Pharmaceutical Inc.
bioMérieux
Bio-Rad Laboratories
Bristol-Myers Squibb
C. R. Bard, Inc.
Calbiotech Group of Companies
CareFusion
Carmel Pharma AB
Cartagenia
Cell Signaling Technology
Celldex Therapeutics
Cellestis Ltd.
Cellular Research
Cephalon
Cepheid
Chugai Pharmaceuticals
Clearbridge BioMedics
Constitutional Medical, Inc. (CMI)
Crescendo Bioscience
Dako
Danaher
DiaMed Holding
Diasis Diagnostik Sistemler Ticaret Ve Sanayi A.S.
DiaSorin S.p.A.
Diesse
Dionex
Eli Lilly
Epitomics
EQT
Erba Diagnostics Mannheim GmbH Group
Erba -Transasia
eScreen Inc.
EskoArtwork
European Commission (EC)
Fast Track Diagnostics (FTD)
Focus Diagnostics
Food and Drug Administration (FDA)
Furuno Electric Co., Ltd.
GenCell Biosystems
Genentech
Genetic Analysis
Genomic Health
Genzyme Genetics
GlaxoSmithKline (GSK)
GnuBIO Inc.
Grifols
Haliodx
Hologic, Inc.
Illumina, Inc.
Inostics Inc.
Institut Merieux
InterMune
Ipsogen S.A.
IRIS International
JEOL Ltd.
Johnson & Johnson
Kappa Biosystems, Inc.
Katakura Industries Co., Ltd.
Kem-En-Tec Diagnostics
Knome, Inc.
Koninklijke Philips N.V.
LabIndia
Laboratory Corporation of America (LabCorp)
Laetus
Leica Microsystems
Life Technologies
LipoScience, Inc.
Lyon Civil Hospitals
Maxmat SA
MDS
MDxHealth
Medica
Merck & Co.
Merck KGaA
Monogram Biosciences
MorphoSys AG
Myriad Genetics
Navman Wireless
Nobel Biocare
NovioGendix Holding B.V.
Oncomed
Oxford University
Pall
Pasteur Sanofi Diagnostics
PerkinElmer, Inc.
Pfizer
Phadia
Pharma Mar
Phenomenex
PreAnalytiX GmbH
Propel Labs
QIAGEN
Quest Diagnostics
Remote Diagnostic Technologies (RDT)
Roche
Rules-Based Medicine Inc.
Schering Plough
Seahorse Bioscience
Siemens AG
Siemens Healthcare GmbH
Siemens Healthineers
Sividon Diagnostics
St. Jude Medical
Sysmex
Sysmex Corporation
Sysmex Inostics GmBH
Thermo Fisher
Thermo Fisher Scientific
TOA Corporation
TOA Medical Electronics
Tocagen
Transasia Bio-Medicals Ltd.
Tulip Diagnostics Private Ltd.
Unisensor
Van Andel Research Institute
Vanadis Diagnostics, AB
Ventana
ViiV Healthcare
VSS Monitoring
XOS
X-Rite
Download sample pages
Complete the form below to download your free sample pages for Medical Devices Leader Series: Top In Vitro Diagnostics (IVD) Companies 2019-2029
Related reports
-
Global Stem Cell Technologies and Applications Market 2019-2029
The global stem cell technologies and applications market is estimated to have reached $14bn in 2018 and is expected to...
Full DetailsPublished: 31 July 2019 -
Global Diagnostic Imaging Market Forecast 2019-2029
The global diagnostic imaging market is estimated to have reached $24.1bn in 2018. Ultrasound Imaging Systems segment held the largest...Full DetailsPublished: 20 September 2019 -
Drug Delivery Technologies Market Forecast 2019-2029
The Drug Delivery Technologies market is estimated to grow at a CAGR of 8.3% in the first half of the...
Full DetailsPublished: 27 February 2019 -
Global Alzheimer’s Disease Therapeutics and Diagnostics Market 2018-2028
The Alzheimer’s Disease Therapeutics and Diagnostics Market will reach $7.93bn in 2018. The Alzheimer’s Disease Therapeutics and Diagnostics Market is...
Full DetailsPublished: 18 June 2018 -
Needle-Free Delivery Technology Market 2018-2028
The global needle-free delivery technology market was valued at $1.7bn in 2017 and is estimated to reach $5.5bn by 2028,...Full DetailsPublished: 21 August 2018 -

Global Urology Devices Market Forecast 2019-2029
In 2018, the urology devices market is estimated at $6.9bn and is expected to grow at a CAGR of 6.1%...
Full DetailsPublished: 21 May 2019 -
Radiation Oncology Market Report 2020-2030
Much opportunity remains in this growing radiation oncology market. See how to exploit the opportunities
...Full DetailsPublished: 01 January 1970 -
Global Cancer Immunotherapy Market Forecast 2019-2029
The world cancer immunotherapy market is expected to grow at a CAGR of 11.4% in the second half of the...Full DetailsPublished: 21 January 2019 -
Molecular Diagnostics Market Report 2020-2030
Read on to discover the most lucrative areas in the industry and the future market prospects. Our new study lets...
Full DetailsPublished: 01 January 1970 -
Global Parkinson’s Disease Drug Market Forecast 2018-2028
Besides revenue forecasting to 2026, our new study provides you with recent results, growth rates, and market shares. We provide...
Full DetailsPublished: 22 January 2018
Download sample pages
Complete the form below to download your free sample pages for Medical Devices Leader Series: Top In Vitro Diagnostics (IVD) Companies 2019-2029
Do you have any custom requirements we can help you with?
Any specific country, geo region, market segment or specific company information?
Email us today, we can discuss your needs and see how we can help: jamie.roberts@visiongain.com
Would you like a free report overview of the report of your choice?
If so, please drop an email to Jamie Roberts stating your chosen report title to jamie.roberts@visiongain.com
Visiongain’s reports are based on comprehensive primary and secondary research. Those studies provide global market forecasts (sales by drug and class, with sub-markets and leading nations covered) and analyses of market drivers and restraints (including SWOT analysis) and current pipeline developments. To find out more about our reports methodology, please email jamie.roberts@visiongain.com
“Thank you for this Gene Therapy R&D Market report and for how easy the process was. Your colleague was very helpful and the report is just right for my purpose. This is the 2nd good report from Visiongain and a good price.”
Dr Luz Chapa Azuella, Mexico
American Association of Colleges of Pharmacy
American College of Clinical Pharmacy
American Pharmacists Association
American Society for Pharmacy Law
American Society of Consultant Pharmacists
American Society of Health-System Pharmacists
Association of Special Pharmaceutical Manufacturers
Australian College of Pharmacy
Biotechnology Industry Organization
Canadian Pharmacists Association
Canadian Society of Hospital Pharmacists
Chinese Pharmaceutical Association
College of Psychiatric and Neurologic Pharmacists
Danish Association of Pharmaconomists
European Association of Employed Community Pharmacists in Europe
European Medicines Agency
Federal Drugs Agency
General Medical Council
Head of Medicines Agency
International Federation of Pharmaceutical Manufacturers & Associations
International Pharmaceutical Federation
International Pharmaceutical Students’ Federation
Medicines and Healthcare Products Regulatory Agency
National Pharmacy Association
Norwegian Pharmacy Association
Ontario Pharmacists Association
Pakistan Pharmacists Association
Pharmaceutical Association of Mauritius
Pharmaceutical Group of the European Union
Pharmaceutical Society of Australia
Pharmaceutical Society of Ireland
Pharmaceutical Society Of New Zealand
Pharmaceutical Society of Northern Ireland
Professional Compounding Centers of America
Royal Pharmaceutical Society
The American Association of Pharmaceutical Scientists
The BioIndustry Association
The Controlled Release Society
The European Federation of Pharmaceutical Industries and Associations
The European Personalised Medicine Association
The Institute of Clinical Research
The International Society for Pharmaceutical Engineering
The Pharmaceutical Association of Israel
The Pharmaceutical Research and Manufacturers of America
The Pharmacy Guild of Australia
The Society of Hospital Pharmacists of Australia
Latest Pharma news
Visiongain Publishes Drug Delivery Technologies Market Report 2024-2034
The global Drug Delivery Technologies market is estimated at US$1,729.6 billion in 2024 and is projected to grow at a CAGR of 5.5% during the forecast period 2024-2034.
23 April 2024
Visiongain Publishes Cell Therapy Technologies Market Report 2024-2034
The cell therapy technologies market is estimated at US$7,041.3 million in 2024 and is projected to grow at a CAGR of 10.7% during the forecast period 2024-2034.
18 April 2024
Visiongain Publishes Automation in Biopharma Industry Market Report 2024-2034
The global Automation in Biopharma Industry market is estimated at US$1,954.3 million in 2024 and is projected to grow at a CAGR of 7% during the forecast period 2024-2034.
17 April 2024
Visiongain Publishes Anti-obesity Drugs Market Report 2024-2034
The global Anti-obesity Drugs market is estimated at US$11,540.2 million in 2024 and is expected to register a CAGR of 21.2% from 2024 to 2034.
12 April 2024
