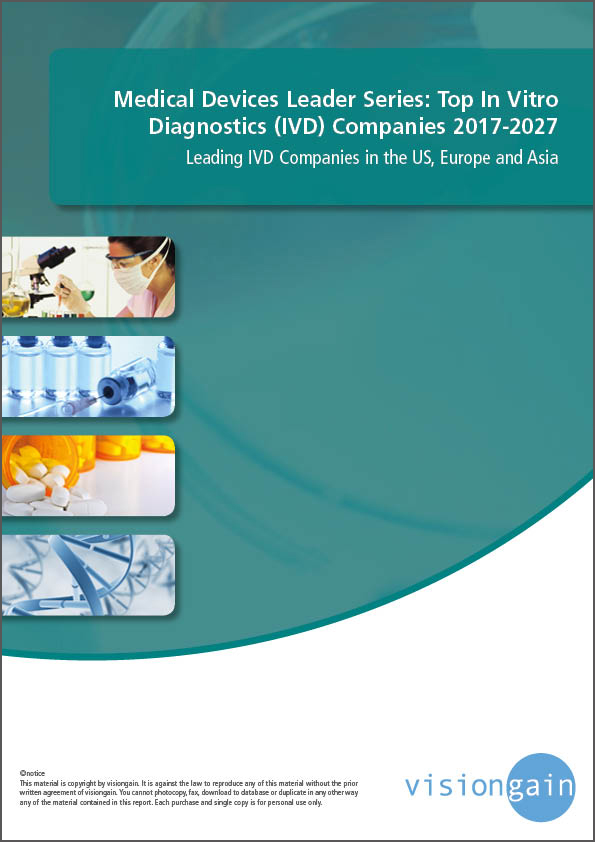
Industries > Pharma > Medical Devices Leader Series: Top In Vitro Diagnostics (IVD) Companies 2017-2027
Medical Devices Leader Series: Top In Vitro Diagnostics (IVD) Companies 2017-2027
Leading IVD Companies in the US, Europe and Asia
What does the future hold for companies of the in vitro diagnostics (IVD) industry? Visiongain’s new report Medical Devices Leader Series – Top In Vitro Diagnostics (IVD) Companies 2017-2027: Leading IVD Companies in the US, Europe and Asia shows you the prospects of leading IVD companies to 2027.
Visiongain predicts total revenues the global IVD market will grow from its 2016 level of $61.85bn to $122.9bn by 2027, representing a CAGR of 6.4% during the period 2016 to 2027.
Our report forecasts to 2027 the overarching IVD market and its main segments:
• Point-of-care (POC) tests
• Clinical chemistry
• Immunochemistry
• Haematological diagnostics
• Microbiological applications
• Genetic testing agents
• Other products

This report provides profiles, discussions and financial analyses – including revenue forecasts to 2027 – for top US IVD companies:
• Danaher
• Abbott Laboratories
• Johnson & Johnson (J&J)
• Bio-Rad
• Becton Dickinson
• Thermo Fisher Scientific
Our report shows you developments and revenue forecasts to 2027 for leading diagnostics companies based in Europe:
• Roche
• Siemens
• bioMérieux
This report also provides outlooks and revenue forecasts to 2027 for top Japanese companies developing and producing IVD tests:
• Sysmex
• Arkray
Our work assesses other companies progressing in that field. There you discover activities of these emerging players and their associated organisations:
• Dako (Agilent Technologies)
• Genomic Health
• Laboratory Corporation of America (LabCorp)
• MDxHealth
• Myriad Genetics
• QIAGEN
Our 185 page report provides 65 tables and 75 figures covering 7 different IVD submarkets, leading companies in the US, Europe and Asia.
Discover the most lucrative areas in the industry and the future market prospects. You will see financial results, industry trends, opportunities, and revenue predictions. The increasing prevalence of both chronic and infectious diseases will ensure that there is a great demand for use and innovation of IVDs over the next decade and beyond.
Visiongain is a trading partner with the US Federal Government
CCR Ref number: KD4R6
1. Report Overview
1.1 How This Report Delivers Information
1.2 Main Questions This Report Answers
1.3 Who is This Report For?
1.4 Methods of Research and Analysis
1.5 Frequently Asked Questions (FAQs)
1.6 Some Related Reports
1.7 About Visiongain
2. An Introduction to In Vitro Diagnostics
2.1 The In Vitro Diagnostics Market
2.1.1 The In Vitro Diagnostics Market in 2017
2.2 What are In Vitro Diagnostic (IVD) Tests?
2.3 Classifying In Vitro Diagnostics
2.3.1 The US Classification
2.3.2 The EC (European Commission) Classification
2.3.3 Regulatory Issues in the IVD Market
2.3.3.1 Regulation of IVD Tests
2.3.3.2 Lack of Clarity Can be Costly
2.4 Types of IVD Test
2.4.1 Point of Care Diagnostics
2.4.2 Clinical Chemistry
2.4.3 Microbiology
2.4.3.1 Regulatory Differences with IVD Microbiology Tests
2.4.4 Haematology
2.4.5 Immunochemistry
2.4.6 Genetic Testing
2.5 The IVD Market: Overall Revenue Forecast to 2027
2.5.1 Market Drivers, 2016-2027
2.5.2 Market Restraints, 2016-2027
2.5.3 Future of the IVD Industry
2.6 Company Comparison
2.6.1 Fragmented Market
2.6.2 IVD Market: Leading Manufacturers in 2016
3. The Leading US In Vitro Diagnostic Companies, 2016-2027
3.1 Danaher
3.1.1 Sales and Recent Performance Analysis
3.1.2 Life Sciences and Diagnostics
3.1.3 Key Products
3.1.4 Danaher Manufacturing Capabilities
3.1.5 Danaher IVD Segment: Strengths and Challenges
3.1.6 Danaher’s Life Sciences and Diagnostics Revenues
3.1.6.1 IVD Revenue Forecast, 2016-2027
3.1.7 Recent Mergers and Acquisition (M&A) Activity
3.2 Abbott Laboratories
3.2.1 Sales and Recent Performance Analysis
3.2.2 Abbott: Diagnostics Segment
3.2.2.1 In Vitro Diagnostics Products
3.2.3 Abbott IVD Segment: Strengths and Challenges
3.2.4 Abbott Diagnostics Historical Revenues, 2013-2015
3.2.5 IVD Revenue Forecast, 2016-2027
3.2.6 Recent M&A Activity and Strategic Collaborations
3.2.6.1 Collaboration with GSK
3.2.6.2 Collaboration with Merck
3.2.6.3 Acquisition of STARLIMS Technologies
3.2.6.4 Acquisition of Ibis Biosciences, Inc.
3.2.7 Plans to Separate into Two Publicly Traded Companies
3.3 Johnson & Johnson (J&J)
3.4 Bio-Rad
3.4.1 Sales and Recent Performance Analysis
3.4.2 Clinical Diagnostics
3.4.2.1 In Vitro Diagnostics
3.4.3 IVD Revenue 2015
3.4.4 IVD Revenue Forecast, 2017-2026
3.4.5 Recent M&A Activity and Strategic Collaborations
3.4.6 Potential Bio-Rad Labs Takeover Seen in Near-Term
3.5 Becton Dickinson
3.5.1 Global Presence
3.5.2 Distribution
3.5.3 R&D
3.5.4 Sales and Recent Performance Analysis
3.5.4.1 Historical Sales Performance Analysis
3.5.5 BD Diagnostics Revenue
3.5.6 IVD Revenue Forecast, 2017-2027
3.5.7 Recent M&A Activity and Strategic Collaborations
3.6 Thermo Fisher Scientific
3.6.1 Historical Sales and Recent Performance Analysis
3.6.2 Clinical Diagnostics
3.6.3 Key Products
3.6.4 Thermo Fisher’s Manufacturing Capabilities
3.6.5 Thermo Fisher’s Diagnostics Revenues
3.6.6 IVD Revenue Forecast 2016-2027
3.6.7 Recent Mergers and Acquisition Activity
3.6.7.1 Acquisition of Dionex and Phadia
4. The Leading European In Vitro Diagnostic Companies, 2016-2027
4.1 Roche
4.1.1 Global Presence
4.1.2 Sales and Recent Performance Analysis
4.1.3 Roche Diagnostics
4.1.4 R&D Capabilities
4.1.5 Growing Portfolio of Diagnostic Products
4.1.5.1 Exploring Strategies in the Neurological Sector
4.1.6 IVD Revenue Forecast 2016-2027
4.1.7 Recent M&A Activity and Strategic Collaborations
4.1.7.1 Roche Offers to Acquire Illumina to Strengthen its Leading Position in Diagnostics
4.2 Siemens
4.2.1 Sales and Recent Performance, 2015
4.2.2 Siemens Healthcare
4.2.2.1 Siemens Diagnostics
4.2.2.2 Outperforming the Market
4.2.2.3 In Vitro Diagnostics
4.2.3 IVD Revenue Forecast 2016-2027
4.2.4 Recent M&A Activity and Strategic Collaborations
4.2.4.1 Partnership with ViiV Healthcare
4.2.4.2 Partnership with Tocagen
4.3 bioMérieux
4.3.1 Sales and Recent Performance, 2015
4.3.2 IVD Revenue Forecast 2016-2027
4.3.3 Recent M&A Activity and Strategic Collaborations
4.3.3.1 Partnership with GSK
4.3.3.2 Partnership with Ipsen
4.3.3.3 Partnership with Institute Merieux and Institute Pasteur
4.3.3.4 Collaboration with Hospices Civils de Lyon
4.3.3.5 Acquisition of ARGENE
4.3.3.6 Equity Interest in Knome
5. The Leading Japanese In Vitro Diagnostic Companies, 2016-2027
5.1 Sysmex
5.1.1 Global Presence and Distribution
5.1.2 Sales and Recent Performance Analysis
5.1.3 Sysmex Diagnostics
5.1.4 IVD Revenue Forecast 2016-2027
5.1.5 Recent M&A Activity and Strategic Collaborations
5.1.5.1 Acquisition of Katakura’s Research Institute of Biological Science
5.1.5.2 Collaboration with IDEXX Labs to Expand into Animal Diagnostics
5.2 Arkray
5.2.1 Global Presence
5.2.2 R&D
5.2.3 IVD Product Portfolio
5.2.4 Sales and Recent Performance Analysis
5.2.5 IVD Revenue Forecast 2016-2027
6. Emerging In Vitro Diagnostic Companies, 2017
6.1 Pipeline and Other Companies: An Overview, 2017
6.2 Other Prominent In Vitro Diagnostic Players
6.3 Dako (Agilent Technologies)
6.3.1 Sales and Recent Performance Analysis
6.3.2 M&A Activity and Other Key Developments
6.4 Genomic Health
6.4.1 Sales and Recent Performance Analysis
6.4.2 R&D Capabilities
6.4.2.1 TAILORx Clinical Trial
6.4.2.2 RxPonder Trial
6.4.2.3 Partnership with Oncomed
6.5 Laboratory Corporation of America (LabCorp)
6.5.1 Sales and Recent Performance Analysis
6.5.2 In Vitro Diagnostics
6.6 Recent M&A Activity and Other Key Developments
6.6.1 Agreement with Medco Health Sciences
6.6.2 Acquisition of Monogram Biosciences
6.6.3 Non-Exclusive License Agreement with Merck
6.6.4 Acquisition of Genzyme Genetics
6.6.5 Partnership with ARCA Biopharma
6.7 MDxHealth
6.7.1 Sales and Recent Performance Analysis, 2015
6.7.2 R&D Capabilities
6.7.3 In Vitro Diagnostics
6.7.3.1 PharmacoMDx
6.7.3.2 PredictMDx for Brain Cancer
6.7.3.3 PredictMDx for Colon Cancer
6.7.3.4 Partnership with GSK
6.8 Myriad Genetics
6.8.1 Sales and Recent Performance Analysis
6.8.2 R&D Capabilities
6.8.3 In Vitro Diagnostics
6.8.3.1 Myriad RBM
6.8.4 M&A Activity and Recent Partnerships
6.8.4.1 Agreement with BioMarin Pharmaceutical
6.8.4.2 Acquisition of Myriad RBM
6.8.4.3 Strategic Debt Investment in Crescendo Bioscience
6.8.4.4 Agreement with Cephalon
6.8.4.5 Agreement with PharmaMar
6.9 QIAGEN
6.9.1 Sales and Recent Performance Analysis
6.9.2 Continued Expansion in the Emerging Markets
6.9.3 R&D Capabilities
6.9.3.1 More than 15 Projects to Co-Develop and Market Diagnostic Products
6.9.3.2 Provider of Choice for Molecular Diagnostic Tools
6.9.4 Recent M&A Activity and Other Developments
6.9.4.1 Acquisition of Cellestis Ltd.
6.9.4.2 Acquisition of Ipsogen
6.9.4.3 Partnership with Pfizer
6.9.4.4 Partnership with Eli Lilly
6.9.4.5 Acquisition of SABiosciences Corporation
6.9.4.6 Acquisition of DxS Ltd (Now QIAGEN Manchester)
6.9.4.7 Acquisition of Explera s.r.l
7. Conclusions
7.1 In Vitro Diagnostics: Attractive Segment of the Healthcare Market
7.2 Big Pharma Dominated the IVD Market in 2015
7.3 The Rise of ‘Generic Medical Devices’
7.4 What Will Succeed in the IVD Market?
7.5 Small Companies Can Have a Big Impact on the Industry and Market to 2027
Visiongain Report Sales Order Form
About Visiongain
Visiongain Report Evaluation Form
Table of Figures
Figure 2.1 IVD Market ($bn) by Class 2017
Figure 2.2 IVD: Overall Market ($bn) Forecast , 2016, 2017, 2021 & 2027
Figure 2.3 IVD Market: Drivers and Restraints, 2016-2027
Figure 2.4 Leading Companies in the IVD Market: Net Sales ($bn), 2016
Figure 2.5 Leading Companies in the IVD Industry: Market Shares (%), 2016
Figure 3.1 Danaher: Net Sales ($bn) by Business Segment, 2015
Figure 3.2 Danaher: Revenue Shares (%) by Business Segment, 2015
Figure 3.3 Danaher: IVD Revenue ($bn) Forecast, AGR (%), 2016-2027
Figure 3.4 Danaher: IVD Market Share (%), 2016-2027
Figure 3.5 Abbott: Net Sales ($bn) by Business Segment, 2015
Figure 3.6 Abbott: Revenue Shares (%) by Business Segment, 2015
Figure 3.7 Abbott IVD Historical Performance 2012-2015: Revenue ($bn), AGR (%)
Figure 3.8 Abbott: Revenues ($bn) by Region, 2015
Figure 3.9 Abbott: Revenue Shares (%) by Region, 2015
Figure 3.10 Abbott: IVD Revenue ($bn) Forecast, AGR (%), 2016-2027
Figure 3.11 Abbott: IVD Market Share (%), 2016-2027
Figure 3.12 Bio-Rad: Historical Diagnostics Revenues ($bn), AGR (%), 2013-2015
Figure 3.13 Bio-Rad: Revenue Shares (%) by Business Segment, 2015
Figure 3.14 Bio-Rad: Revenue Shares (%) by Region, 2015
Figure 3.15 Bio-Rad: IVD Revenue Forecast ($bn), AGR (%), 2016-2027
Figure 3.16 Bio-Rad: IVD Market Share (%), 2016-2027
Figure 3.17 BD: Company Revenue ($bn), 2013-2015
Figure 3.18 BD IVD Revenue Forecast ($bn), AGR (%), 2016-2027
Figure 3.19 BD: IVD Market Share (%), 2016-2027
Figure 3.20 Thermo Fisher: IVD Net Sales ($bn), 2013-2015
Figure 3.21 Thermo Fisher: Revenue Shares (%) by Sector, 2015
Figure 3.22 Thermo Fisher: IVD Revenue ($bn) Forecast, AGR (%), 2016-2027
Figure 3.23 Thermo Fisher: IVD Market Share (%), 2016-2027
Figure 3.24 Thermo Fisher: Mergers & Acquisitions
Figure 4.1 Roche: Revenues ($bn) by Sector, 2015
Figure 4.2 Roche: Revenue Shares (%) by Sector, 2015
Figure 4.3 Roche Diagnostics: Revenue Shares (%) by Region, 2015
Figure 4.4 Roche Diagnostics: Revenues ($bn) by Sector, 2015
Figure 4.5 Roche Diagnostics: Revenue Shares (%) by Sector, 2015
Figure 4.6 Roche: IVD Revenue ($bn), AGR (%), Forecast, 2016-2027
Figure 4.7 Roche: IVD Market Share (%), 2016-2027
Figure 4.8 Siemens: Revenue Shares (%) by Sector, 2015
Figure 4.9 Siemens Healthcare: Revenue Shares (%) by Region, 2015
Figure 4.10 Siemens: IVD Revenue ($bn), AGR (%), Forecast 2016-2027
Figure 4.11 Siemens: IVD Market Share (%), 2015-2027
Figure 4.12 bioMérieux: Revenue ($bn) by Sector, 2015
Figure 4.13 bioMérieux: Revenue Shares (%) by Sector, 2015
Figure 4.14 bioMérieux: Clinical Applications Revenue ($bn) by Sector, 2015
Figure 4.15 bioMérieux: Clinical Applications Revenue Shares (%) by Sector, 2015
Figure 4.16 bioMérieux: IVD Revenue ($bn), AGR (%), Forecast, 2016-2027
Figure 4.17 bioMérieux: IVD Market Share (%), 2016-2027
Figure 5.1 Sysmex: Revenues ($m) by Sector, 2015
Figure 5.2 Sysmex: Revenue Shares (%) by Sector, 2015
Figure 5.3 Sysmex: Net Sales (%) by Geographical Region, 2015
Figure 5.4 Sysmex: IVD Revenue ($bn) Forecast, AGR (%), 2016-2027
Figure 5.5 Sysmex: IVD Market Share (%), 2016-2027
Figure 5.6 Arkray: IVD Revenue ($bn) Forecast, AGR (%), 2016-2027
Figure 5.7 Arkray: IVD Market Share (%), 2015-2027
Figure 6.1 Aglient: Revenue ($bn) by Sector, 2015
Figure 6.2 Dako: Revenue Shares (%) by Sector, 2015
Figure 6.3 Genomic Health: Historical Revenues ($m) and Net Income ($m), 2011-2015
Figure 6.4 Genomic Health: Revenue Shares (%) by Reporting Segment, 2015
Figure 6.5 Genomic Health: Historical R&D Expense ($m) and R&D as a Percentage of Net Sales (%), 2011-2015
Figure 6.6 LabCorp: Historical Revenue ($bn), Profit ($bn), 2011-2015
Figure 6.7 LabCorp: Revenues ($bn) by Reporting Segment, 2015
Figure 6.8 LabCorp: Revenue Shares (%) by Reporting Segment, 2015
Figure 6.9 MDxHealth: Revenues ($m) by Reporting Segment, 2016
Figure 6.10 MDxHealth: Revenue Shares (%) by Reporting Segment, 2015
Figure 6.11 Myriad: Historical Net Revenues ($m), 2012-2016
Figure 6.12 Myriad: Revenue Shares (%) by Sector, 2016
Figure 6.13 Myriad Molecular Diagnostics: Revenue Shares (%) by Product, 2016
Figure 6.14 Myriad Molecular Diagnostics: Revenue Shares (%) by Sector, 2016
Figure 6.15 Myriad: Historical R&D Investments ($m), 2012-2016
Figure 6.16 QIAGEN: Historical Revenue ($m), Net Income ($m), 2011-2015
Figure 6.16 QIAGEN: Revenues ($m) by Customer Class, 2015
Figure 6.17 QIAGEN: Revenue Shares (%) by Customer Class, 2015
Figure 6.18 QIAGEN: Revenue Shares (%) by Region, 2015
Figure 6.19 QIAGEN: Historical R&D Expense ($m) and R&D Expense as a Percentage of Net Revenue (%), 2013-2015
Figure 7.1 IVD Market: Overall World Revenue ($bn), (AGR%) 2016-2027
Figure 7.2 Leading Market Segment: Revenue ($bn) Forecasts, 2016-2027
List of Tables
Table 2.1 IVD Revenues ($bn) and Market Shares (%) by Class, 2016-2017
Table 2.2 Advantages and Disadvantages of POC Diagnostics
Table 2.3 IVD Tests: Overall World Market and Submarket Revenue Forecasts ($bn), 2016, 2017, 2021 & 2027
Table 2.4 Leading Manufacturers: IVD Market Share (%), 2016
Table 2.5 Leading Companies in the IVD Market: Net Sales ($bn) and Market Shares (%), 2016
Table 3.1 Danaher: Key Facts, 2016
Table 3.2 Danaher: Net Sales ($bn) and Revenue Shares (%) by Business Segment, 2015
Table 3.3 Danaher: Life Sciences & Diagnostics Revenue ($bn), AGR (%) 2013-2015
Table 3.4 Danaher: IVD Revenue ($bn), Growth (%), CAGR (%), Market Share (%), Forecast 2016-2027
Table 3.5 Abbott: Key Facts, 2016
Table 3.6 Abbott: Net Sales ($bn) and Revenue Shares (%) by Business Segment, 2015
Table 3.7 Abbott: Revenues ($bn) and Revenue Shares (%) by Geographical Region, 2015
Table 3.8 Abbott: Diagnostics Revenue ($bn), AGR (%), 2013-2015
Table 3.9 Abbott: IVD Revenue ($bn), Growth (%), CAGR (%), Market Share (%), Forecast 2016-2027
Table 3.10 Johnson & Johnson: Key Facts, 2016
Table 3.11 Bio-Rad: Key Facts, 2017
Table 3.12 Bio-Rad: Clinical Diagnostics Revenue ($bn), AGR (%), 2013-2015
Table 3.13 Bio-Rad: IVD Revenue Forecast ($bn), Growth (%), CAGR (%), Market Share (%), 2016-2027
Table 3.14 BD: Key Facts, 2016
Table 3.15 Becton Dickinson: Net Sales ($bn) and Revenue Shares (%) by Sector, 2015
Table 3.16 BD: Diagnostics Revenue ($bn), AGR(%), 2013-2015
Table 3.17 BD: IVD Revenue Forecast ($bn) Growth (%), CAGR (%), Market Share (%), 2016-2027
Table 3.18 Thermo Fisher: Key Facts, 2016
Table 3.19 Thermo Fisher: IVD Sales ($bn), AGR (%), 2013-2015
Table 3.20 Thermo Fisher: Net Sales ($bn) and Revenue Shares by product segment (%) by Sector, 2015
Table 3.21 Thermo Fisher: IVD Revenue ($bn), Growth (%), CAGR (%), Market Share (%), Forecast 2016-2027
Table 4.1 Roche: Key Facts, 2016
Table 4.2 Roche: Revenue ($bn) and Revenue Shares (%) by Sector, 2015
Table 4.3 Roche Diagnostics: Revenue ($bn) and Revenue Shares (%), by Region, 2015
Table 4.4 Roche Diagnostics: Revenue ($bn) and Revenue Shares (%) by Sector, 2015
Table 4.5 Roche Diagnostics: Marketed Diagnostic Products
Table 4.6 Roche: IVD Revenue ($bn) Forecast, Growth (%), CAGR (%), Market Share (%) Forecast 2016-2027
Table 4.7 Siemens: Key Facts, 2016
Table 4.8 Siemens: Revenue ($bn) and Revenue Shares (%) by Sector, 2015
Table 4.9 Siemens: Revenue ($bn) and Revenue Shares (%) by Region, 2015
Table 4.10 Siemens: IVD Revenue ($bn), Growth (%), CAGR (%), Market Share (%), Forecast 2016-2027
Table 4.11 bioMérieux: Key Facts, 2016
Table 4.12 bioMérieux: Revenue ($bn) and Revenue Shares (%) by Sector, 2015
Table 4.13 bioMérieux: Clinical Applications Revenue ($bn) and Revenue Shares (%) by Sector, 2015
Table 4.14 bioMérieux: IVD Revenue ($bn), Growth (%), CAGR (%), Market Share (%), Forecast 2016-2027
Table 5.1 Sysmex: Key Facts, 2016
Table 5.2 Sysmex: Revenue ($m) by Sector, 2015
Table 5.3 Sysmex: IVD Revenue ($bn), Growth (%), CAGR (%), Market Share (%), Forecast 2016-2027
Table 5.4 Arkray: Key Facts, 2016
Table 5.5 Arkray: IVD Revenue ($bn), Growth (%), CAGR (%), Market Share (%), Forecast 2016-2027
Table 6.1 Aglient: Revenue ($bn) and Revenue Shares (%) by Sector, 2015
Table 6.2 Dako: Marketed Diagnostic Products, 2015
Table 6.4 Genomic Health: Revenue ($m) and Revenue Shares (%) by Reporting Segment, 2015
Table 6.5 Genomic Health: R&D Expense ($m) and R&D Expense as a Percentage of Sales (%), 2011-2015
Table 6.6 LabCorp: Revenues ($bn) and Revenue Shares (%) by Reporting Segment, 2015
Table 6.7 Selected List of LabCorp’s Menu of Diagnostic Products, 2015
Table 6.8 MDxHealth: Revenue ($m) and Revenue Shares (%) by Reporting Segment, 2015
Table 6.9 MDxHealth: In Vitro Diagnostics Pipeline, 2016
Table 6.10 Myriad: Revenue ($m) and Revenue Shares (%) by Sector, 2016
Table 6.11 Myriad Molecular Diagnostics: Revenue ($m) and Revenue Shares (%) by Product, 2016
Table 6.12 Myriad Molecular Diagnostics: Revenue ($m) and Revenue Shares (%) by Sector, 2016
Table 6.13 Myriad: Biomarker Product Portfolio, 2016
Table 6.14 Myriad: Diagnostic Products, 2016
Table 6.15 QIAGEN: Revenue ($m) and Revenue Shares (%) by Customer Class, 2015
Table 6.16 QIAGEN: Revenue ($m) and Revenue Shares (%) by Region, 2015
Table 6.17 QIAGEN: Selected List of Co-development Projects
Table 6.18 QIAGEN: Selected Marketed Diagnostic Products, 2015
Table 6.19 QIAGEN: Recent M&A Activity
Table 6.22 Other Companies Operating in the IVD Market, 2016
Table 7.1 Leading IVD Manufacturers by Company Type, 2016
3M
AB Sciex
Abbott Laboratories
AbbVie
Accuri Cytometers
Agilent Technologies
Alacris Theranostics GmbH
Alere
Amgen
Analytical Technologies
ARGENE
Arkray
AstraZeneca
Banner Alzheimer’s Institute
Bayer
Bayer Diagnostics
BD Pharmaceutical Systems
BD Technologies
Beckman Coulter
Becton, Dickinson and Company (BD)
BioMarin Pharmaceutical
bioMérieux
Bio-Rad
Boehringer Ingelheim
Bristol-Myers Squibb
Cancer Research Technology
Cardiogenics
Carmel Pharma AB
Celldex Therapeutics
Cellestis
Centre for Devices and Radiological Health (CDRH)
Cephalon
Claros Diagnostics
Clearstone Central Laboratories
CLIA laboratory
Clovis
Cole-Parmer
Crescendo Bioscience
Dako (Agilent Technologies)
Danaher
Dionex
DxS (Now QIAGEN Manchester)
Eli Lilly
ESE GmbH
Euronext Brussels
European Commission
European Diagnostic Manufacturers Association (EDMA)
European Union (EU)
Explera s.r.l
Fermentas
Fisher Scientific
Food and Drug Administration (US FDA)
Fujirebio
Furuno Electric Co.
Genentech
Genomic Health
GenProbe
Genzyme Genetics
GlaxoSmithKline (GSK)
Hoffman La Roche
Hologic
Ibis Biosciences
IDEXX Laboratories
IGEN International
Illumina
Institut Pasteur
Institute Merieux
Instrumentation Labs
Ipsen
Ipsogen
JEOL Ltd.
John Hopkins University
Johnson & Johnson (J&J)
Katakura Industries
KIESTRA Lab Automation
Knome
LabCorp
Laboratory Corporation of America (LabCorp)
Leica Biosystems
Life Technologies
Luminex
Lyon Civil Hospitals
MDS
MDxHealth
Medco Health Sciences
Merck & Co.
Mindray
Miraca Life Sciences
Monogram Biosciences
Myriad Genetics
Myriad RBM
Nalgene
Newcastle University
Novartis
Oncomed
OncoMethylome
Ortho-Clinical Diagnostics
Pfizer
Phadia
Pierce Protein Research
Polymedco Inc.
QIAGEN
QuantaLife
Quest Diagnostics
Radiometer
Response Biomedical Corporation
Roche
Roche Applied Science
Saladax
Schering Plough
SDIX
Siemens Healthcare
Sirigen Group Limited
STARLIMS Technologies
Surgipath
SWOG
Sysmex Corporation
Sysmex Group
Teva Pharmaceutical Industries
Thermo Fisher Scientific
Thermo Scientific
TOA Corporation
TOA Medical Electronics
Tocagen
Tosoh
Transasia Bio Medicals
Van Andel Research Institute
Ventana
Vermillion
ViiV Healthcare
Download sample pages
Complete the form below to download your free sample pages for Medical Devices Leader Series: Top In Vitro Diagnostics (IVD) Companies 2017-2027
Related reports
-
The Molecular Diagnostics (MDx) Market Forecast 2017-2027
The molecular diagnostics (MDx) market was worth $6.13bn in 2016 and is estimated to grow at a CAGR of 12.5%...Full DetailsPublished: 08 August 2017 -
Global Alzheimer’s Disease Therapeutics and Diagnostics Market 2018-2028
The Alzheimer’s Disease Therapeutics and Diagnostics Market will reach $7.93bn in 2018. The Alzheimer’s Disease Therapeutics and Diagnostics Market is...
Full DetailsPublished: 18 June 2018 -
Global Infusion Devices Market Forecast 2018-2028
The global infusion devices market was valued at $2.1bn in 2017 and is estimated to reach $3.9bn by 2028, growing...Full DetailsPublished: 16 August 2018 -

The Global Respiratory Inhalers Market 2017-2027
Our 181-page report provides 118 tables, charts, and graphs. Read on to discover the most lucrative areas in the industry...Full DetailsPublished: 21 March 2017 -
Needle-Free Delivery Technology Market 2018-2028
The global needle-free delivery technology market was valued at $1.7bn in 2017 and is estimated to reach $5.5bn by 2028,...Full DetailsPublished: 21 August 2018 -
Next-Generation Cancer Diagnostics Market Forecast 2017-2027
The next-generation cancer diagnostics market is expected to grow at a CAGR of 16.5% in the first half of the...
Full DetailsPublished: 10 May 2017 -
POC Diagnostics Market Forecast 2017-2027
Our 289-page report provides 161 tables, charts, and graphs. Read on to discover the most lucrative areas in the industry...Full DetailsPublished: 12 September 2017 -
In-Vitro Diagnostics World Market 2018-2028
The revenue of the in-vitro diagnostics market in 2017 was estimated at $63bn and was dominated by the Point of...
Full DetailsPublished: 11 September 2018 -

Global Pre-Filled Syringes Market Forecast 2017-2027
The global pre-filled syringes market is expected to grow at a moderate growth rate over the forecast period. The global...Full DetailsPublished: 31 March 2017 -
Global Respiratory Diagnostics Market Report 2017-2027
The global respiratory diagnostics market is expected to grow at a CAGR of 7.1% in the first half of the...Full DetailsPublished: 08 June 2017
Download sample pages
Complete the form below to download your free sample pages for Medical Devices Leader Series: Top In Vitro Diagnostics (IVD) Companies 2017-2027
Do you have any custom requirements we can help you with?
Any specific country, geo region, market segment or specific company information?
Email us today, we can discuss your needs and see how we can help: jamie.roberts@visiongain.com
Would you like a free report overview of the report of your choice?
If so, please drop an email to Jamie Roberts stating your chosen report title to jamie.roberts@visiongain.com
Visiongain’s reports are based on comprehensive primary and secondary research. Those studies provide global market forecasts (sales by drug and class, with sub-markets and leading nations covered) and analyses of market drivers and restraints (including SWOT analysis) and current pipeline developments. To find out more about our reports methodology, please email jamie.roberts@visiongain.com
“Thank you for this Gene Therapy R&D Market report and for how easy the process was. Your colleague was very helpful and the report is just right for my purpose. This is the 2nd good report from Visiongain and a good price.”
Dr Luz Chapa Azuella, Mexico
American Association of Colleges of Pharmacy
American College of Clinical Pharmacy
American Pharmacists Association
American Society for Pharmacy Law
American Society of Consultant Pharmacists
American Society of Health-System Pharmacists
Association of Special Pharmaceutical Manufacturers
Australian College of Pharmacy
Biotechnology Industry Organization
Canadian Pharmacists Association
Canadian Society of Hospital Pharmacists
Chinese Pharmaceutical Association
College of Psychiatric and Neurologic Pharmacists
Danish Association of Pharmaconomists
European Association of Employed Community Pharmacists in Europe
European Medicines Agency
Federal Drugs Agency
General Medical Council
Head of Medicines Agency
International Federation of Pharmaceutical Manufacturers & Associations
International Pharmaceutical Federation
International Pharmaceutical Students’ Federation
Medicines and Healthcare Products Regulatory Agency
National Pharmacy Association
Norwegian Pharmacy Association
Ontario Pharmacists Association
Pakistan Pharmacists Association
Pharmaceutical Association of Mauritius
Pharmaceutical Group of the European Union
Pharmaceutical Society of Australia
Pharmaceutical Society of Ireland
Pharmaceutical Society Of New Zealand
Pharmaceutical Society of Northern Ireland
Professional Compounding Centers of America
Royal Pharmaceutical Society
The American Association of Pharmaceutical Scientists
The BioIndustry Association
The Controlled Release Society
The European Federation of Pharmaceutical Industries and Associations
The European Personalised Medicine Association
The Institute of Clinical Research
The International Society for Pharmaceutical Engineering
The Pharmaceutical Association of Israel
The Pharmaceutical Research and Manufacturers of America
The Pharmacy Guild of Australia
The Society of Hospital Pharmacists of Australia
Don’t Miss Out!
Subscribe to receive the latest Industry news, trending insight and analysis straight to your inbox.Choose your preferences:
Latest Pharma news
Retinal Gene Therapy Market
The global Retinal Gene Therapy market is projected to grow at a CAGR of 9.6% by 2034
26 July 2024
HIV Drugs and Injectables Market
The global HIV Drugs & Injectables market is projected to grow at a CAGR of 4.6 % by 2034
24 July 2024
Digital Twin Technology in Pharmaceutical Manufacturing Market
The global Digital Twin Technology in Pharmaceutical Manufacturing market is projected to grow at a CAGR of 31.3% by 2034
23 July 2024
Specialty Pharma Market
The global Specialty Pharma market is projected to grow at a CAGR of 7.5% by 2034
22 July 2024
