The global meat substitutes market has experienced a rapid growth in recent years. Visiongain predicts that in 2018, the market will be worth $4.3bn. The market will grow to $5,810.4m by 2022 at a CAGR of 7.7%. Meat substitutes are a part of the wider free-from trend, which is driven by increasing concerns about meta consumption, and the health & wellness trend.
The growing global population is also a significant driver of the market. The UN projections show that by 2050, the global population will reach 8.9 billion people, increasing by 47% since 2000.
In this light, alternative sources of protein such a meat substitutes become an important factor in sustainable development. Considering that raising livestock requires a lot of water, land and animal feed, as well as producing a lot of waste, plant-based proteins are becoming a tool, which can potentially help to solve these problems.
The meat alternatives market is relatively small today, but all the factors analysed in this report illustrate that the industry will exhibit significant growth in the next ten years, providing excellent commercial opportunities.
Key benefits of purchasing this report
Learn About the Future Meat Substitutes Industry Outlook- The meat substitutes regional market forecasts will confirm and underpin your own analysis
Keep Up To Speed With Meat Substitutes Types – Find 7 submarket forecasts revealing which type will prevail
• Textured Vegetable Protein (TVP) meat substitutes forecast 2018-2028
• Mycoprotein (Quorn) meat substitutes forecast 2018-2028
• Pea Protein meat substitutes forecast 2018-2028
• Tofu meat substitutes forecast 2018-2028
• Tempeh meat substitutes forecast 2018-2028
• Seitan meat substitutes forecast 2018-2028
• Other meat substitutes forecast 2018-2028
Stay Informed About Meat Substitutes
• Read the latest meat substitutes industry news with fresh analysis of ‘Free From’ Meat-Free Analogues & Alternatives to maintain your competitive edge.
Save Time Researching The Competitive Landscape With Profiles of The 10 Leading Companies
• Amy’s Kitchen
• Atlantic Natural Foods
• Beyond Meat
• Blue Chip Group
• Fry Group Foods
• Hain Celestial
• Kellogg Company
• MGP Ingredients
• Monde Nissin
• Pinnacle Foods
Reinforce Your Business Case For Meat Substitutes
• Substantiate you research proposal with our regional forecasts from 2018-2028
• U.S. meat substitutes forecast 2018-2028
• Canada meat substitutes forecast 2018-2028
• Mexico meat substitutes forecast 2018-2028
• Brazil meat substitutes forecast 2018-2028
• Rest of Latin America meat substitutes forecast 2018-2028
• UK meat substitutes forecast 2018-2028
• Germany meat substitutes forecast 2018-2028
• Italy meat substitutes forecast 2018-2028
• France meat substitutes forecast 2018-2028
• Spain meat substitutes forecast 2018-2028
• Rest of Europe meat substitutes forecast 2018-2028
• China meat substitutes forecast 2018-2028
• India meat substitutes forecast 2018-2028
• ASEAN meat substitutes forecast 2018-2028
• ANZ meat substitutes forecast 2018-2028
• RoAPEJ meat substitutes forecast 2018-2028
• RoW meat substitutes forecast 2018-2028
Enhance Your Meat Substitutes Presentations Get Instant Meat Substitutes Market Intelligence
• Find 160 tables, charts & graphs that you can utilise to illustrate your point in your meat substitutes investment proposal.
Maintain An Advantage In Meat Substitutes
• Read the latest meat substitutes news, forecasts and analysis which will sustain your competitive edge.
Target readership
• All stakeholders within the food industry
• Meat substitutes companies
• Food manufacturers
• NPD specialists
• R&D staff
• Health food companies
• Food wholesalers
• Food retailers
• Ingredient suppliers
• Food technologists
• Food buyers
• Marketing staff
• Business development managers
• CEO’s
• Managers
• Analysts
• Consultancies
• Banks
• Government agencies
• Industry associations
Visiongain is a trading partner with the US Federal Government
CCR Ref number: KD4R6
1. Meat Substitutes Market Report Overview
1.1 Global Meat Substitutes Overview
1.2 Global Meat Substitutes Foods Market Segmentation
1.3 Market Definition
1.4 How This Report Delivers
1.5 Key Questions Answered by This Analytical Report Include:
1.6 Why You Should Read This Report
1.7 Methodology
1.8 Frequently Asked Questions (FAQ)
1.9 Associated Visiongain Reports
1.10 About Visiongain
2. Introduction to the Meat Substitutes Market
2.1 What Is the Difference Between the Meat-Free, Vegetarian and Vegan Diets?
2.2 Is A Meat-Free Diet Healthy?
2.2.1 Meat Consumption And Mortality
2.3 The Benefits Of A Plant-Based Protein Diet
2.3.1 Are Soybeans Magic?
2.3.2 Wheat Gluten Consumption Benefits
2.3.3 Why Gluten-Free Diets Are Popular?
2.4 Commercial Prospects Of The Free-From Trend
2.4.1 "Natural" Vs "Organic": Learn About The Prospects For Both Trends In The Meat Substitutes Market
3. Global Meat Substitutes Market Forecast 2017-2028
3.1 Global Meat Substitutes Market Forecast 2017-2028
3.2 Global Meat Substitutes Market Analysis
3.3 Global Meat Substitutes Market Drivers & Restraints 2017-2028
3.3.1 Global Meat Substitutes Market Drivers
3.3.2 Global Meat Substitutes Market Restraints
3.3.2.1 Lack of taste acceptability
3.3.2.2 Lack of choices
3.3.2.3 Nutrition Dillemma
3.3.2.4 Regional dynamics hindering growth
4. Leading Meat Substitutes Submarkets Forecast 2017-2028
4.1 Leading Meat Substitutes Submarkets Shares Forecast 2017,2022 & 2028
4.2 Textured Vegetable Protein Submarket Forecast 2017-2028
4.2.1 Textured Vegetable Protein Submarket Analysis
4.2.2 The Process Of TVP Manufacturing
4.3 Mycoprotein (Quorn) Submarket Forecast 2017-2028
4.3.1 Mycoprotein (Quorn) Submarket Analysis
4.3.2 Mycoprotein Manufacturing
4.4 Pea Protein Submarket Forecast 2017-2028
4.4.1 Pea Protein Submarket Analysis
4.5 Tofu Submarket Forecast 2017-2028
4.5.1 Tofu Submarket Analysis
4.6 Tempeh Submarket Forecast 2017-2028
4.6.1 Tempeh Submarket Analysis
4.7 Seitan Submarket Forecast 2017-2028
4.7.1 Seitan Submarket Analysis
4.8 Other Meat Substitutes Submarket Forecast 2017-2028
4.8.1 Other Meat Substitutes Submarket Analysis
5. Leading National Meat Substitutes Markets Forecasts 2017-2028
5.1 Leading National Meat Substitutes Markets Share Forecast 2017-2028
5.2 US Meat Substitutes Market Forecast 2017-2028
5.2.1 US Meat Substitutes Market Analysis
5.3 UK Meat Substitutes Market Forecast 2017-2028
5.3.1 UK Meat Substitutes Market Analysis
5.4 German Meat Substitutes Market Forecast 2017-2028
5.4.1 German Meat Substitutes Market Analysis
5.5 Italian Meat Substitutes Market Forecast 2017-2028
5.5.1 Italian Meat Substitutes Market Analysis
5.6 French Meat Substitutes Market Forecast 2017-2028
5.6.1 French Meat Substitutes Market Analysis
5.7 Rest of Europe Meat Substitutes Market Forecast 2017-2028
5.7.1 Rest of Europe Meat Substitutes Market Analysis
5.7.2 Is Insect Protein A New Trend In The Meat Substitutes Market?
5.8 Chinese Meat Substitutes Market Forecast 2017-2028
5.8.1 Chinese Meat Substitutes Market Analysis
5.9 Indian Meat Substitutes Market Forecast 2017-2028
5.9.1 Indian Meat Substitutes Market Analysis
5.9.2 Fast-Food Giant Adopts Meat Substitutes Menu
5.10 RoW Meat Substitutes Market Forecast 2017-2028
5.10.1 RoW Meat Substitutes Market Analysis
5.11 Canada Meat Substitutes Market Forecast 2017-2028
5.11.1 Canada Meat Substitutes Market Analysis
5.12 Mexico Meat Substitutes Market Forecast 2017-2028
5.12.1 Mexico Meat Substitutes Market Analysis
5.13 Brazil Meat Substitutes Market Forecast 2017-2028
5.13.1 Brazil Meat Substitutes Market Analysis
5.14 Rest of LATAM Meat Substitutes Market Forecast 2017-2028
5.14.1 Rest of LATAM Meat Substitutes Market Analysis
5.15 Spain Meat Substitutes Market Forecast 2017-2028
5.15.1 Spain Meat Substitutes Market Analysis
5.16 ASEAN Meat Substitutes Market Forecast 2017-2028
5.16.1 ASEAN Meat Substitutes Market Analysis
5.17 ANZ Meat Substitutes Market Forecast 2017-2028
5.17.1 ANZ Meat Substitutes Market Analysis
5.18 Rest of APEJ Meat Substitutes Market Forecast 2017-2028
5.18.1 Rest of APEJ Meat Substitutes Market Analysis
6. Leading Meat Substitutes Companies
6.1 Leading 3 Meat Substitutes Companies Revenue Shares 2016
6.2 Pinnacle Foods Overview
6.2.1 Pinnacle Foods Historic Revenue 2011-2016
6.2.2 Pinnacle Foods Meat Substitutes Sector (Gardein) Revenue Forecast 2017-2028
6.2.3 Pinnacle Foods Meat Substitutes Sector (Gardein) Analysis
6.2.4 Pinnacle Foods Regional Emphasis/Focus
6.2.5 Pinnacle Foods Mergers & Acquisitions
6.3 MGP Ingredients Overview
6.3.1 MGP Ingredients Historic Revenue 2011-2016
6.3.2 MGP Ingredients Meat Substitutes Sector Revenue Forecast 2017-2028
6.3.3 MGP Ingredients Meat Substitutes Sector Analysis
6.3.4 MGP Ingredients Mergers & Acquisitions
6.4 Monde Nissin Overview
6.4.1 Monde Nissin Enters The Meat Substitutes Market With Quorn Foods Acquisition
6.4.2 Monde Nissin Meat Substitutes Sector (Quorn Foods) Revenue Forecast 2017-2028
6.4.3 Monde Nissin Meat Substitutes Sector (Quorn Foods) Analysis
6.5 Kellogg Company Overview
6.5.1 Kellogg Company Historic Revenue 2011-2016
6.5.2 Kellogg Company Meat Substitutes Sector Revenue Forecast 2017-2028
6.5.3 Kellogg Company Meat Substitutes Sector Analysis
6.5.4 Kellogg Company Regional Emphasis/Focus
6.5.5 Kellogg Company Mergers & Acquisitions
6.6 Hain Celestial Overview
6.6.1 Hain Celestial Historic Revenue 2011-2016
6.6.2 Hain Celestial Meat Substitutes Sector Revenue Forecast 2017-2028
6.6.3 Hain Celestial Meat Substitutes Sector Analysis
6.6.4 Hain Celestial Mergers & Acquisitions
6.7 Beyond Meat
6.8 Amy's Kitchen
6.9 Blue Chip Group
6.10 Fry Group Foods
6.11 Atlantic Natural Foods
6.12 Other Leading Meat Substitutes Companies
7. Conclusions & Recommendations
7.1 Leading Meat Substitutes Companies
7.2 Leading Meat Substitutes Submarkets
7.2.1 Leading Meat Substitutes Products
7.3 Leading National Markets
7.4 Future Prospects For Companies In The Meat Substitutes Market
Glossary
Associated Visiongain Reports
Visiongain Report Sales Order Form
Appendix A
About visiongain
Appendix B
Visiongain report evaluation form
Table of Tables
Table 1.1 National Meat Substitutes Markets Forecasts ($m, AGR%, CAGR%), 2017-2028
Table 2.1 Consumer Attitude to Commonly Used In Food Ingredients
Table 3.1 Global Meat Substitutes Market Forecast ($m, AGR%, CAGR%), 2017-2028
Table 4.1 Leading Meat Substitutes Submarkets Forecast ($m, AGR%, CAGR%), 2017-2028
Table 4.2 Textured Vegetable Protein Submarket Forecast ($m, AGR%, CAGR%), 2017-2028
Table 4.3 TVP Nutritional Qualities In 100g, (Nutrient, % Presence)
Table 4.4 Mycoprotein (Quorn) Submarket Forecast ($m, AGR%, CAGR%), 2017-2028
Table 4.5 Pea Protein Submarket Forecast ($m, AGR%, CAGR%), 2017-2028
Table 4.6 Tofu Submarket Forecast ($m, AGR%, CAGR%), 2017-2028
Table 4.7 Types of Tofu (Type, Qualities)
Table 4.8 Tempeh Submarket Forecast ($m, AGR%, CAGR%), 2017-2028
Table 4.9 Tempeh Nutritional Qualities
(Nutrient, Daily Value %)
Table 4.10 Seitan Submarket Forecast ($m, AGR%, CAGR%), 2017-2028
Table 4.11 Other Meat Substitutes Submarket Forecast ($m, AGR%, CAGR%), 2017-2028
Table 5.1 Leading National Meat Substitutes Markets Forecasts ($m, AGR%, CAGR%), 2017-2028
Table 5.2 US Meat Substitutes Market Forecast ($m, AGR%, CAGR %), 2017-2028
Table 5.3 UK Meat Substitutes Market Forecast ($m, AGR%, CAGR %), 2017-2028
Table 5.4 German Meat Substitutes Market Forecast ($m, AGR%, CAGR %), 2017-2028
Table 5.5 Italian Meat Substitutes Market Forecast ($m, AGR%, CAGR %), 2017-2028
Table 5.6 French Meat Substitutes Market Forecast ($m, AGR%, CAGR %), 2017-2028
Table 5.7 Rest of Europe Meat Substitutes Market Forecast ($m, AGR%, CAGR %), 2017-2028
Table 5.8 Chinese Meat Substitutes Market Forecast ($m, AGR%, CAGR %), 2017-2028
Table 5.9 Indian Meat Substitutes Market Forecast ($m, AGR%, CAGR %), 2017-2028
Table 5.10 RoW Meat Substitutes Market Forecast ($m, AGR%, CAGR %), 2017-2028
Table 5.11 Canada Meat Substitutes Market Forecast ($m, AGR%, CAGR %), 2017-2028
Table 5.12 Mexico Meat Substitutes Market Forecast ($m, AGR%, CAGR %), 2017-2028
Table 5.13 Brazil Meat Substitutes Market Forecast ($m, AGR%, CAGR %), 2017-2028
Table 5.14 Rest of LATAM Meat Substitutes Market Forecast ($m, AGR%, CAGR %), 2017-2028
Table 5.15 Spain Meat Substitutes Market Forecast ($m, AGR%, CAGR %), 2017-2028
Table 5.16 ASEAN Meat Substitutes Market Forecast ($m, AGR%, CAGR %), 2017-2028
Table 5.17 ANZ Meat Substitutes Market Forecast ($m, AGR%, CAGR %), 2017-2028
Table 5.18 Rest of APEJ Meat Substitutes Market Forecast ($m, AGR%, CAGR %), 2017-2028
Table 6.1 Leading 3 Meat Substitutes Companies (Revenue ($m), Market Share%), 2016
Table 6.2 Pinnacle Foods Overview (Revenue $m, Market Share%), 2016
Table 6.3 Pinnacle Foods Business Segments, ($m, Market Share%), 2016
Table 6.4 Pinnacle Foods Historic Revenue ($m, AGR%), 2011-2016
Table 6.5 Pinnacle Foods Meat Substitutes Sector (Gardein) Revenue Forecast ($m, AGR %, CAGR%), 2017-2028
Table 6.6 Gardein Product Lines and Products, 2017
Table 6.7 Pinnacle Foods Mergers and Acquisitions Activity (Company, Business Focus, Completion date, Acquisition price)
Table 6.8 MGP Ingredients Overview (Revenue $m, Market Share%), 2016
Table 6.9 MGP Ingredients Business Segments, Revenue by Segments ($m, % Share), 2016
Table 6.10 MGP Ingredients Historic Revenue ($m, AGR%), 2011-2016
Table 6.11 MGP Ingredients Meat Substitutes Sector Revenue Forecast ($m, AGR %, CAGR%), 2017-2028
Table 6.12 MGP Ingredients Meat Substitutes Product Lines and Products, 2017
Table 6.13 MGP Ingredients Recent Mergers and Acquisitions Activity (Company, Business Focus, Completion date, Acquisition price)
Table 6.14 Monde Nissin Overview (Revenue $m, Market Share%), 2016
Table 6.15 Monde Nissin Meat Substitutes Sector (Quorn Foods) Revenue Forecast ($m, AGR %, CAGR%), 2017-2028
Table 6.16 Meat Substitutes Product Types and Products, 2017
Table 6.17 (Continued) Meat Substitutes Product Lines and Products, 2017
Table 6.18 Meat Substitutes Product Line and Products, 2017
Table 6.19 Kellogg Company Overview (Revenue $m, Market Share%), 2016
Table 6.20 Kellogg Company Business Segments, Revenue by Segment ($m, Share%), 2016
Table 6.21 Kellogg Company Historic Revenue ($m, AGR%), 2011-2016
Table 6.22 Kellogg Company Meat Substitutes Sector Revenue Forecast ($m, AGR %, CAGR%), 2017-2028
Table 6.23 Kellogg Company Meat Substitutes Product Brands and Product Lines, 2016
Table 6.24 Kellogg Company Recent Mergers and Acquisitions Activity (Company, Business Focus, Completion date, Acquisition price)
Table 6.25 Hain Celestial Overview (Revenue $m, Market Share%),2016
Table 6.26 Hain Celestial Business Segments, Revenue by Segment ($m, Share%), 2016
Table 6.27 Hain Celestial Sales by Product Category ($m, Market Share%), 2016
Table 6.28 Hain Celestial Historic Revenue ($m, AGR%), 2011-2016
Table 6.29 Hain Celestial Meat Substitutes Sector Revenue Forecast ($m, AGR %, CAGR%), 2017-2028
Table 6.30 Hain Celestial Meat Substitutes Product Brands and Product Lines, 2017
Table 6.31 Hain Celestial Recent Mergers and Acquisitions Activity (Company, Business Focus, Completion date, Acquisition price)
Table 6.32 Beyond Meat: Overview (HQ, Website), 2017
Table 6.33 Beyond Meat Substitutes Product Lines and Products, 2017
Table 6.34 Amy's Kitchen: Overview, 2017
Table 6.35 Amy's Kitchen Meat Substitutes Product Lines and Products, 2017
Table 6.36 Blue Chip Group: Overview, 2017
Table 6.37 Blue Chip Group Meat Substitutes Brand and Products, 2017
Table 6.38 Fry Group Foods: Overview, 2017
Table 6.39 Fry Group Foods Product Lines and Products, 2017
Table 6.40 Atlantic Natural Foods: Overview, 2017
Table 6.41 Atlantic Natural Foods Meat Substitutes Brands and Products, 2017
Table 6.42 Other Leading Companies In The Meat Substitutes Market (Company, Brand, Product/Service), 2017
Table 6.43 (Continued) Other Leading Companies In The Meat Substitutes Market (Company, Brand, Product/Service), 2017
Table 6.43 (Continued) Other Leading Companies In The Meat Substitutes Market (Company, Brand, Product/Service), 2017
Table 6.44 (Continued) Other Leading Companies In The Meat Substitutes Market (Company, Brand, Product/Service), 2017
Table 6.46 (Continued) Other Leading Companies In The Meat Substitutes Market (Company, Brand, Product/Service), 2017
Table 6.47 (Continued) Other Leading Companies In The Meat Substitutes Market (Company, Brand, Product/Service), 2017
Table of Figures
Figure 1.1 France Meat Substitutes Market Forecast ($m, AGR%), 2017-2028
Figure 1.2 Global Meat Substitutes Market Segmentation
Figure 3.1 Global Meat Substitutes Market Forecast ($m, AGR%), 2017-2028
Figure 3.2 Global Meat Substitutes Market Drivers & Restraints 2017-2028
Figure 4.1 Leading Meat Substitutes Submarkets Forecast ($m, AGR %), 2017-2028
Figure 4.2 Leading Meat Substitutes Submarkets Growth Rate Forecast (AGR %), 2017-2028
Figure 4.3 Leading Meat Substitutes Submarkets Forecast ($m, CAGR %, 2017-2028)
Figure 4.4 Leading Meat Substitutes Submarkets Shares Forecast (% Share), 2017
Figure 4.5 Leading Meat Substitutes Submarkets Shares Forecast (% Share), 2022
Figure 4.6 Leading Meat Substitutes Submarkets Shares Forecast (% Share), 2028
Figure 4.7 Textured Vegetable Protein Submarket Forecast ($m, AGR%), 2017-2028
Figure 4.8 Textured Vegetable Protein Submarket Share Forecast (% Share), 2017, 2022 and 2027
Figure 4.9 TVP Manufacturing Process
Figure 4.10 Mycoprotein (Quorn) Submarket Forecast ($m, AGR%), 2017-2028
Figure 4.11 Mycoprotein (Quorn) Submarket Share Forecast (% Share), 2017, 2022 and 2028
Figure 4.12 The Process Of Mycoprotein And Quorn Manufacturing
Figure 4.13 Pea Protein Submarket Forecast ($m, AGR%), 2017-2028
Figure 4.14 Pea Protein Submarket Share Forecast (% Share), 2017, 2022 and 2028
Figure 4.15 Tofu Submarket Forecast ($m, AGR%), 2017-2028
Figure 4.16 Tofu Submarket Share Forecast (% Share), 2017, 2022 and 2028
Figure 4.17 Tempeh Submarket Forecast ($m, AGR%), 2017-2028
Figure 4.18 Tempeh Submarket Share Forecast (% Share), 2017, 2022 and 2027
Figure 4.19 Seitan Submarket Forecast ($m, AGR%), 2017-2028
Figure 4.20 Seitan Submarket Share Forecast (% Share), 2017, 2022 and 2028
Figure 4.21 Other Meat Substitutes Submarket Forecast ($m, AGR%), 2017-2028
Figure 4.22 Other Meat Substitutes Submarket Share Forecast (% Share), 2017, 2022 and 2028
Figure 5.1 Leading National Meat Substitutes Markets Forecasts ($m), 2017-2028
Figure 5.2 Leading National Meat Substitutes Markets Forecasts ($m, 2016, CAGR %, 2017-2028)
Figure 5.3 Leading National Meat Substitutes Markets Share Forecast (% Share), 2017
Figure 5.4 Leading National Meat Substitutes Markets Share Forecast (% Share), 2022
Figure 5.5 Leading National Meat Substitutes Markets Share Forecast (% Share), 2028
Figure 5.6 US Meat Substitutes Market Forecast ($m, AGR%), 2017-2028
Figure 5.7 US Meat Substitutes Market Share Forecast (% Share), 2017, 2022 and 2027
Figure 5.8 UK Meat Substitutes Market Forecast ($m, AGR%), 2017-2028
Figure 5.9 UK Meat Substitutes Market Share Forecast (% Share), 2017, 2022 and 2027
Figure 5.10 German Meat Substitutes Market Forecast ($m, AGR%), 2017-2028
Figure 5.11 German Meat Substitutes Market Share Forecast (% Share), 2017, 2022 and 2027
Figure 5.12 Italian Meat Substitutes Market Forecast ($m, AGR%), 2017-2028
Figure 5.13 Italian Meat Substitutes Market Share Forecast (% Share), 2017, 2022, 2027
Figure 5.14 French Meat Substitutes Market Forecast ($m, AGR%), 2017-2028
Figure 5.15 French Meat Substitutes Market Share Forecast (% Share), 2017, 2022 and 2027
Figure 5.16 Rest of Europe Meat Substitutes Market Forecast ($m, AGR%), 2017-2028
Figure 5.17 Rest of Europe Meat Substitutes Market Share Forecast (% Share), 2017, 2022, 2027
Figure 5.18 Chinese Meat Substitutes Market Forecast ($m, AGR%), 2017-2028
Figure 5.19 Chinese Meat Substitutes Market Share Forecast (% Share), 2017, 2022 and 2027
Figure 5.20 Indian Meat Substitutes Market Forecast ($m, AGR%), 2017-2028
Figure 5.21 Indian Meat Substitutes Market Share Forecast (% Share), 2017, 2022 and 2027
Figure 5.22 RoW Meat Substitutes Market Forecast ($m, AGR%), 2017-2028
Figure 5.23 RoW Meat Substitutes Market Share Forecast (% Share), 2017, 2022 and 2027
Figure 5.24 Canada Meat Substitutes Market Share Forecast (% Share), 2017, 2022 and 2027
Figure 5.25 Canada Meat Substitutes Market Forecast ($m, AGR%), 2017-2028
Figure 5.26 Mexico Meat Substitutes Market Share Forecast (% Share), 2017, 2022 and 2027
Figure 5.27 Mexico Meat Substitutes Market Forecast ($m, AGR%), 2017-2028
Figure 5.28 Brazil Meat Substitutes Market Share Forecast (% Share), 2017, 2022 and 2027
Figure 5.29 Brazil Meat Substitutes Market Forecast ($m, AGR%), 2017-2028
Figure 5.30 Rest of LATAM Meat Substitutes Market Share Forecast (% Share), 2017, 2022 and 2027
Figure 5.31 Rest of LATAM Meat Substitutes Market Forecast ($m, AGR%), 2017-2028
Figure 5.32 Spain Meat Substitutes Market Share Forecast (% Share), 2017, 2022 and 2027
Figure 5.33 Spain Meat Substitutes Market Forecast ($m, AGR%), 2017-2028
Figure 5.34 ASEAN Meat Substitutes Market Forecast ($m, AGR%), 2017-2028
Figure 5.35 ASEAN Meat Substitutes Market Share Forecast (% Share), 2017, 2022 and 2027
Figure 5.36 ANZ Meat Substitutes Market Forecast ($m, AGR%), 2017-2028
Figure 5.37 ANZ Meat Substitutes Market Share Forecast (% Share), 2017, 2022 and 2027
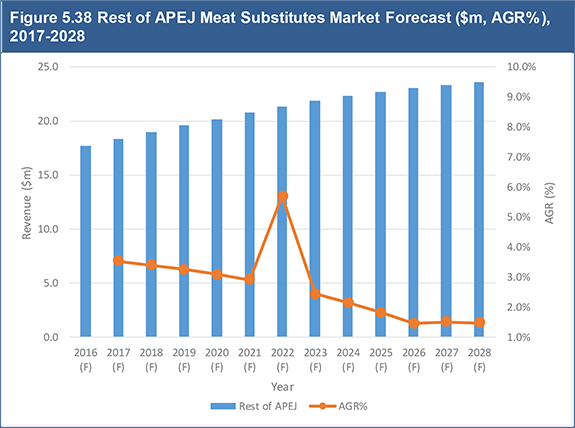
Figure 5.38 Rest of APEJ Meat Substitutes Market Forecast ($m, AGR%), 2017-2028
Figure 5.39 Rest of APEJ Meat Substitutes Market Share Forecast (% Share), 2017, 2022 and 2027
Figure 6.1 Leading 3 Meat Substitutes Companies Revenue From The Meat Substitutes Sector ($m), 2016
Figure 6.2 Leading 3 Meat Substitutes Companies Market Share in the Global Meat- Substitutes Market (% Share), 2016
Figure 6.3 Pinnacle Foods Historic Revenue ($m, AGR%), 2011-2016
Figure 6.4 Pinnacle Foods Meat Substitutes Sector (Gardein) Revenue Forecast ($m, AGR %), 2017-2028
Figure 6.5 Pinnacle Foods Regional Emphasis/ Focus (% Share), 2017
Figure 6.6 MGP Ingredients Historic Revenue ($m, AGR%), 2011-2016
Figure 6.7 MGP Ingredients Meat Substitutes Sector Revenue Forecast ($m, AGR %), 2017-2028
Figure 6.8 Monde Nissin Meat Substitutes Sector (Quorn Foods) Revenue Forecast ($m, AGR %), 2017-2028
Figure 6.9 Kellogg Company Historic Revenue ($m, AGR%), 2011-2016
Figure 6.10 Kellogg Company Meat Substitutes Sector Revenue Forecast ($m, AGR %), 2017-2028
Figure 6.11 Kellogg Company Regional Emphasis/ Focus (% Share), 2017
Figure 6.12 Hain Celestial Historic Revenue ($m, AGR%), 2011-2016 (till Q3)
Figure 6.13 Hain Celestial Meat Substitutes Sector Revenue Forecast ($m, AGR %), 2017-2028
Figure 7.1 Leading Meat Substitutes Submarkets Forecast ($m), 2017, 2022 and 2028
Figure 7.2 Leading National Meat Substitutes Markets Forecast ($m), 2017, 2022 and 2027

