The new report from business intelligence provider Visiongain offers an updated outlook for the global functional foods market and growing “superfood” trend. Visiongain assesses that the functional foods market will generate revenues of $84.8bn in 2020.
Rise in geriatric population is expected to boost the demand for functional food. Increasing age lowers the food intake and weakens the digestion hence functional food would be a better choice for old aged people as a mode of nutrition. For instance, according to the data published by United Nation in 2019, it estimated that globally around 982 million people are of age 60 or above, which comprise around 14% of the global population. The geriatric population (60 Years or above) is growing the rate of about 3% per year. Currently, Europe has the largest ratio of population aged 60 or over (around 25%). Furthermore, it was estimated that the number of older persons in the world is projected to be 1.4 billion in 2030 and 2.1 billion in 2050 and could rise to 3.1 billion in 2100. Change in dietary patterns with increased intake of energy dense foods and lack of physical activity has compelled the consumers to opt of functional foods. Moreover, growing health awareness among the consumers will further boost the growth of this industry.
Rise in disposable income and a greater awareness of functional products and ingredients, growth of the functional foods market in emerging countries is set to outpace that in developed countries. The growth of the population in China, India, Brazil and other developing countries, as well as an increasing middle class will largely contribute in the development of the health & wellness industry in regional markets, which consequently will trigger for the growth of the functional foods market. The regions of Asia-Pacific and South America offer good opportunities for the manufacturers of functional foods. In order to stay abreast in the market, companies need to innovate and appeal to the most recent consumer trends. “Superfoods” is one of these trends that will gain momentum during the forecast period.
Nearly 90% of American parents said that they buy functional foods or drinks for their children. Among numerous concerns, immunity is on the top of the list, followed by other issues such as cognitive development, digestive health, and vision. As a result, food companies are tapping this requirement by developing functional foods for kids that naturally promote heart health, healthy joints, and normal body weight for a healthy adult life.
However, supporting evidence-based health claims have become more challenging as regulators seek science behind claim specifications. For example, the FDA has published two guidance papers “Distinguishing Liquid Dietary Supplements from Beverages” and “Considerations Regarding Substances Added to Foods, Including Beverages and Dietary Supplements”. Both guidance papers aim to provide clarity on the labelling, packaging, composition, serving, size, recommended daily intake and the directions of use of supplements. The quality of functional foods continues to be of critical importance. For example, China has captured approximately 90% of the Vitamin C market in the US, and Chinese food safety has always been a concern. Moreover, the production areas of vitamins are one of the most polluted areas in China.
Now: “Functional Food Industry Boom: Chia, Flax and Quinoa Seeds Markets Witnessing Double Digit Growth.” This is an example of the business critical headline that you need to know about – and more importantly, you need to read Visiongain’s objective analysis of how this will impact your company and the industry more broadly. How are you and your company reacting to this news? Are you sufficiently informed?
How this report will benefit you
Read on to discover how you can exploit the future business opportunities emerging in the functional foods sector. Visiongain’s new study tells you and tells you NOW.
In this brand-new report, you will receive 217 in-depth tables, charts and graphs– all unavailable elsewhere.
The 206-page report provides clear detailed insight into the global functional foods market. It reveals the key drivers and challenges affecting the market.
By ordering and reading our brand-new report today you will be better informed and ready to act.
Report Scope
• Global functional foods market forecasts from 2020-2030
• Regional functional foods market forecasts from 2020-2030 covering
• North America
• South America
• Western Europe
• Eastern Europe
• Asia-Pacific
• Middle East and Africa
• Country level functional foods forecasts from 2020-2030 covering
• US
• Canada
• Mexico
• UK
• Germany
• Japan
• Brazil
• UAE
• India
• Australia & New Zealand
• RoW
• Functional foods submarket forecasts from 2020-2030 covering
• Functional Dairy
• Functional Bakery & Cereal
• Functional Baby Food
• Functional Fats & Oils
• Functional Meat, Fish & Eggs
• Other Functional Foods
• Analysis of the key factors driving growth in the global, regional and country level functional foods markets from 2020-2030
• Profiles and competitive positioning map of the leading 15 functional foods companies
• Abbott Laboratories
• ADM
• Arla
• BASF
• Danone
• Dean Foods
• General Mills
• Glanbia plc
• GlaxoSmithKline plc
• Kellogg
• Nestle
• Orkla Group
• PepsiCo
• Raisio Group
• Royal FrieslandCampina N.V.
How will you benefit from this report?
• This report will keep your functional foods knowledge base up to speed. Don’t get left behind
• This report will reinforce strategic decision decision-making based upon definitive and reliable market data
• You will learn how to exploit new functional foods technological trends
• You will be able to realise your company’s full potential within the market
• You will better understand the competitive landscape and identify potential new business opportunities & partnerships
Who should read this report?
• Anyone within the food industry & value chain
• Food manufacturers
• Ingredients suppliers
• Manufacturers of functional food
• Manufacturers of functional ingredients
• Manufacturers of free-from food
• Manufacturers of organic food
• Manufacturers of superfoods
• Health & wellness food distribution companies
• Healthy food distributors and manufacturers
• Food marketing and business analysis departments
• Investment analysts
• Investment consultancies
• Food industry investors
• Food market consultancy
• Governmental departments & agencies
• New product development (NPD) managers & Specialists
• Food buyers
• Clean-label food manufacturers
• CEO’s
• COO’s
• CIO’s
• Business development managers
• Marketing managers
• Food industry associations
Visiongain’s study is intended for anyone requiring commercial analyses for the functional foods market and leading companies. You will find data, trends and predictions.
Buy our report today Global Functional Foods Market : Analysing the “Superfoods” Trend and Forecasts for Functional Dairy, Bakery & Cereal, Baby Food, Fats & Oils, Meat, Fish & Eggs and Others Plus Profiles on the Leading Companies and Regional and Leading National Markets Analysis. Avoid missing out by staying informed – order our report now.
Visiongain is a trading partner with the US Federal Government
CCR Ref number: KD4R6
Do you have any custom requirements we can help you with? Any need for specific country, geo region, market segment or specific company information? Contact us today, we can discuss your needs and see how we can help: sara.peerun@visiongain.com
1. Report Overview
1.1 Global Functional Foods Market Overview
1.2 Global Functional Foods Market Segmentation
1.3 Market Definition
1.4 How This Report Delivers
1.5 Key Questions Answered By This Analytical Report Include:
1.6 Why You Should Read This Report
1.7 Methodology
1.8 Frequently Asked Questions (FAQ)
1.9 Associated Visiongain Reports
2. Introduction to The Functional Foods Market And The ‘Superfoods’ Trend
2.1 The Roots Of ‘Functional Food’
2.1.1 Plant-Derived Functional Foods
2.1.2 Animal-Derived Functional Foods
2.1.3 Microbial Functional Foods
2.1.4 Miscellaneous Functional Foods
2.2 Which Products Are Considered “Superfood”?
2.3 How Antioxidants Work?
2.4 The Types of Antioxidants
2.4.1 Antioxidant Enzymes
2.4.2 Antioxidant Vitamins
2.4.3 Fat Soluble Vitamins
2.4.4 Water Soluble Vitamins
2.4.5 Phytochemicals
2.5 What Is “Superfood” From The Legislative Point Of View: An Overlap With “Functional”Foods
2.5.1 EU Guidance On “Superfood” Claims Use
2.5.2 US DSHEA Regulation
2.5.3 Regulatory Framework in Latin America
2.5.4 Health Claim Regulations in Australia
2.5.5 Regulatory Scenario in India
2.5.6. Regulatory Scenario in China
2.5.7 Regulatory Scenario in Southeast Asia
2.6 Functional Food: The Differences In The Definition And The Market Sizing Approach
2.6.1 Where Do “Superfoods” Fit In?
2.7 Functional Food: The Differences In The Definition And The Market Sizing Approach
2.7.1 Establishing A Formal Definition For “Functional Food”
2.7.2 Challenges Due to the Absence of a Proper Definition
2.7.3 “Functional Food”: The Current Definition
2.7.4 Funcitonal Food Definition in Japan
2.7.5 Funcitonal Food Definition in Europe Region
2.7.6 Funcitonal Food Definition in the United States
3. Global Functional Foods Market Forecast 2020-2030
3.1 Global Functional Foods Market Analysis
3.2 Global Functional Foods Market Drivers and Restrains
3.3 Functional Foods Market Drivers
3.3.1 Healthy Lifestyle & New Dieting Patterns
3.3.2 Emerging Markets Provide Good Growth Opportunities
3.3.3 Low Cost Compared to Healthcare
3.3.4 Fastest Growing Customer Groups: Millennials
3.3.5 Fastest Growing Customer Groups: Kids
3.3.6 Fastest Growing Customer Groups: Women & Elderly
3.4 Functional Foods Market Restraints
3.4.1 Tougher Regulations
3.4.2 Product Safety Concerns
3.4.3 Doubts Over the Effectiveness of Functional Foods
3.4.4 Lack of Awareness regarding Functional Foods
3.5 Functional Food Versus Pharmaceuticals
3.6 Impact On Health Care and Society
3.5 Research Challenges For Functional Foods
4. Leading Functional Foods Submarket Forecasts 2020-2030
4.1 Health Benefits Claimed by Functional Food Products
4.1.1 Bone health
4.1.2 Musculoskeletal disease
4.1.3 Diabetes mellitus
4.1.4 Cardiovascular disease
4.1.5 Other Diet Components
4.1.6 Obesity
4.1.7 Physical Performance
4.1.8 Health And Well-Being In Ageing
4.1.9 Gastrointestinal Health
4.1.10 Immune Function
4.1.11 Early development and growth Mother’s diet
4.1.12 Diet of children and adolescents
4.2 Leading Functional Foods Submarkets Share Forecast 2019, 2025 and 2030
4.3 Functional Dairy Market Forecast 2020-2030
4.3.1 Functional Dairy Market Analysis 2020-2030
4.3.2 Can Cheese Become A “Superfood”?
4.3.3 Increasing lactose intolerance
4.3.4 Plant Based Dairy Alternatives Are on The Rise
4.4 Functional Bakery & Cereal Market Forecast 2020-2030
4.4.1 Functional Bakery & Cereal Market Analysis 2020-2030
4.4.2 Latest Trends in The Bakery Industry
4.4.3 A Fast Growth of The Functional Flours Market
4.4.4 Good Prospects in The Hot Cereals Segment
4.5 Functional Baby Food Market Forecast 2020-2030
4.5.1 Functional Baby Food Market Analysis 2020-2030
4.5.2 Superfoods for The Little Ones
4.6 Functional Fats & Oils Market Forecast 2020-2030
4.6.1 Functional Fats & Oils Market Analysis 2020-2030
4.6.2 Which Oils Are “Superfoods”?
4.7 Functional Meat, Fish & Eggs Market Forecast 2020-2030
4.7.1 Functional Meat, Fish & Eggs Market Analysis 2020-2030
4.7.2 Consumers’ Negative Attitude Towards Meat Consumption
4.7.3 Meat Consumption and Mortality
4.7.4 Approaches to Develop Functional Meats
4.8 Other Functional Foods Market Forecast 2020-2030
4.8.1 Other Functional Foods Market Analysis 2020-2030
5. Regional Functional Foods Markets Forecasts 2020-2030
5.1 Regional Functional Foods Market Share Forecast 2020-2030
5.2 Historical Distribution Of Regional Market Shares
5.3 North American Functional Foods Market Forecast 2020-2030
5.3.1 North American Functional Foods Market Analysis 2020-2030
5.4 South American Functional Foods Market Forecast 2020-2030
5.4.1 South American Functional Foods Market Analysis 2020-2030
5.5 Western European Functional Foods Market Forecast 2020-2030
5.5.1 Western European Functional Foods Market Analysis 2020-2030
5.6 Eastern European Functional Foods Market Forecast 2020-2030
5.6.1 Eastern European Functional Foods Market Analysis 2020-2030
5.7 Asia-Pacific Functional Foods Market Forecast 2020-2030
5.7.1 Asia-Pacific Functional Foods Market Analysis 2020-2030
5.8 MEA Functional Foods Market Forecast 2020-2030
5.8.1 MEA Functional Foods Market Analysis 2020-2030
6. Leading National Functional Foods Markets Forecasts 2020-2030
6.1 Leading National Functional Foods Market Share Forecast 2020-2030
6.2 US Functional Foods Market Forecast 2020-2030
6.2.1 US Functional Foods Market Analysis 2020-2030
6.3 Canadian Functional Foods Market Forecast 2020-2030
6.3.1 Canadian Functional Foods Market Analysis 2020-2030
6.4 Mexican Functional Foods Market Forecast 2020-2030
6.4.1 Mexican Functional Foods Market Analysis 2020-2030
6.4.2 Can Superfoods Help with Obesity Problems in Mexico?
6.5 Brazilian Functional Foods Market Forecast 2020-2030
6.5.1 Brazilian Functional Foods Market Analysis 2020-2030
6.6 UK Functional Foods Market Forecast 2020-2030
6.6.1 UK Functional Foods Market Analysis 2020-2030
6.7 German Functional Foods Market Forecast 2020-2030
6.7.1 German Functional Foods Market Analysis 2020-2030
6.8 Japanese Functional Foods Market Forecast 2020-2030
6.8.1 Japanese Functional Foods Market Analysis 2020-2030
6.9 UAE Functional Foods Market Forecast 2020-2030
6.9.1 UAE Functional Foods Market Analysis 2020-2030
6.10 China Functional Foods Market Forecast 2020-2030
6.10.1 China Functional Foods Market Analysis 2020-2030
6.11 India Functional Foods Market Forecast 2020-2030
6.11.1 India Functional Foods Market Analysis 2020-2030
6.11 Australia & New Zealand Functional Foods Market Forecast 2020-2030
6.11.1 Australia & New Zealand Functional Foods Market Analysis 2020-2030
6.12 RoW Functional Foods Market Forecast 2020-2030
6.12.1 RoW Functional Foods Market Analysis 2020-2030
7. Leading Companies in the Functional Foods Market
7.1 Abbott Laboratories Overview
7.1.1 Abbott Laboratories Recent Revenue 2013-2018
7.1.2 Abbott Laboratories Analysis
7.1.3 Abbott Laboratories Regional Emphasis/Focus
7.1.4 Abbott Laboratories Mergers & Acquisitions
7.2 Archer Daniels Midland (ADM) Overview
7.2.1 ADM Recent Revenue 2013-2018
7.2.2 ADM Analysis
7.2.3 ADM Regional Emphasis/Focus
7.2.4 ADM Mergers & Acquisitions
7.3 Arla Overview
7.3.1 Arla Recent Revenue 2013-2018
7.3.2 Arla Analysis
7.3.3 Arla Regional Emphasis/Focus
7.4 BASF Overview
7.4.1 BASF Recent Revenue 2014-2018
7.4.2 BASF Analysis
7.4.3 BASF Regional Emphasis/Focus
7.4.4 BASF Mergers & Acquisitions
7.5 Dean Foods Overview
7.5.1 Dean Foods Recent Revenue 2013-2018
7.5.2 Dean Foods Analysis
7.6 Danone Overview
7.6.1 Danone Recent Revenue 2013-2018
7.6.2 Danone Analysis
7.6.3 Danone Regional Emphasis/Focus
7.6.4 Danone Mergers & Acquisitions
7.7 General Mills Overview
7.7.1 General Mills Recent Revenue 2013-2019
7.7.2 General Mills Analysis
7.7.3 General Mills Regional Emphasis/Focus
7.7.4 General Mills Mergers & Acquisitions
7.8 Glanbia plc Overview
7.8.1 Glanbia plc Recent Revenue 2013-2018
7.8.2 Glanbia plc Analysis
7.8.3 Glanbia plc Regional Emphasis/Focus
7.8.4 Glanbia plc Mergers & Acquisitions
7.9 GlaxoSmithKline plc Overview
7.9.1 GlaxoSmithKline plc Recent Revenue 2013-2018
7.9.3 GlaxoSmithKline plc Geographical Spread of Employees 2018
7.10 Kellogg Overview
7.10.1 Kellogg Recent Revenue 2013-2018
7.10.2 Kellogg Analysis
7.10.3 Kellogg Regional Emphasis/Focus
7.10.4 Kellogg Mergers & Acquisitions
7.11 Nestle Overview
7.11.1 Nestle Recent Revenue 2013-2018
7.11.2 Nestle Analysis
7.11.3 Nestle Regional Emphasis/Focus
7.11.4 Nestle Mergers & Acquisitions
7.12 Orkla Group Overview
7.12.1 Orkla Group Recent Revenue 2013-2018
7.12.2 Orkla Group Geographical Spread of Employees 2018
7.13 PepsiCo Overview
7.13.1 PepsiCo Recent Revenue 2013-2018
7.13.2 PepsiCo Analysis
7.13.3 PepsiCo Regional Emphasis/Focus
7.14 Raisio Group Overview
7.14.1 Raisio Group Recent Revenue 2013-2018
7.14.2 Raisio Group Analysis
7.14.3 Raisio Group Regional Emphasis/Focus
7.14.4 Raisio Group Mergers & Acquisitions
7.15 Royal FrieslandCampina N.V. Overview
7.15.1 Royal FrieslandCampina N.V. Recent Revenue 2013-2018
7.15.2 Royal FrieslandCampina N.V. Analysis
7.15.3 Royal FrieslandCampina N.V. Regional Emphasis/Focus
7.15.4 Royal FrieslandCampina N.V. Key Developments in 2018
7.16 Other Leading Companies In The Functional Foods Market and the Superfoods Industry
8. Conclusions & Recommendations
8.1 Functional Foods Market Outlook
8.2 Self Diagnosed Consumers As A Target Buyer Of Functional Foods
8.3 E-Commerce and the Use of Internet
8.4 Taste and Convenience
8.5 Product Tailoring
8.6 Educating and Communicating with Consumers
8.7 Key Findings
8.7.1 Leading Functional Foods Submarkets
8.7.2 Leading Regional Functional Foods Markets
8.7.3 Leading National Functional Foods Markets
9. Glossary
Associated Visiongain Reports
Visiongain Report Sales Order Form
Appendix A
About Visiongain
Appendix B
Visiongain Report Evaluation Form
List of Tables
Table 1.1 Regional Functional Foods Markets Forecasts 2020-2030 ($bn, AGR%)
Table 2.1 Foods for Specific Health Use Products Approved by the Japanese MHLW (Specified Health Uses, Principal Ingredients)
Table 2.2 B Vitamins (Vitamin, Function, Dietary Source)
Table 2.3 EU Regulation on Nutrition And Health Claims Made On Food
Table 2.4 The List Of “Superfoods” (Product, Benefit)
Table 3.1 Global Functional Foods Market Forecast 2020-2030 ($bn, AGR%, CAGR%)
Table 4.1 Leading Functional Foods Submarket Forecasts 2020-2030 ($bn, AGR%)
Table 4.2 Functional Dairy Market Forecast 2020-2030 ($bn, AGR%, CAGR %)
Table 4.3 Functional Bakery & Cereal Market Forecast 2020-2030 ($bn, AGR%, CAGR %)
Table 4.4 Functional Baby Food Market Forecast 2020-2030 ($bn, AGR%, CAGR %)
Table 4.5 Functional Fats & Oils Market Forecast 2020-2030 ($bn, AGR%, CAGR %)
Table 4.6 Functional Meat, Fish & Eggs Market Forecast 2020-2030 ($bn, AGR%, CAGR %)
Table 4.7 Other Functional Foods Market Forecast 2020-2030 ($bn, AGR%, CAGR %)
Table 5.1 Regional Functional Foods Market Forecasts 2020-2030 ($bn, AGR %)
Table 5.2 North American Functional Foods Market Forecast 2020-2030 ($bn, AGR%, CAGR %)
Table 5.3 South American Functional Foods Market Forecast 2020-2030 ($bn, AGR%, CAGR %)
Table 5.4 Western European Functional Foods Market Forecast 2020-2030 ($bn, AGR%, CAGR %)
Table 5.5 Eastern European Functional Foods Market Forecast 2020-2030 ($bn, AGR%, CAGR %)
Table 5.6 Asia-Pacific Functional Foods Market Forecast 2020-2030 ($bn, AGR%, CAGR %)
Table 5.7 MEA Functional Foods Market Forecast 2020-2030 ($bn, AGR%, CAGR %)
Table 6.1 Leading National Functional Foods Markets Forecasts 2020-2030 ($bn, AGR %)
Table 6.2 US Functional Foods Market Forecast 2020-2030 ($bn, AGR%, CAGR %)
Table 6.3 Canadian Functional Foods Market Forecast 2020-2030 ($bn, AGR%, CAGR %)
Table 6.4 Mexican Functional Foods Market Forecast 2020-2030 ($bn, AGR%, CAGR %)
Table 6.5 Brazilian Functional Foods Market Forecast 2020-2030 ($bn, AGR%, CAGR %)
Table 6.6 UK Functional Foods Market Forecast 2020-2030 ($bn, AGR%, CAGR %)
Table 6.7 German Functional Foods Market Forecast 2020-2030 ($bn, AGR%, CAGR %)
Table 6.8 Japanese Functional Foods Market Forecast 2020-2030 ($bn, AGR%, CAGR %)
Table 6.9 UAE Functional Foods Market Forecast 2020-2030 ($bn, AGR%, CAGR %)
Table 6.10 China Functional Foods Market Forecast 2020-2030 ($bn, AGR%, CAGR %)
Table 6.11 India Functional Foods Market Forecast 2020-2030 ($bn, AGR%, CAGR %)
Table 6.12 RoW Functional Foods Market Forecast 2020-2030 ($bn, AGR%, CAGR %)
Table 7.1 Abbott Laboratories Overview 2018 (Total Revenue ($m), Ticker, HQ, IR Contact, Website)
Table 7.2 Abbott Laboratories Revenue by Business Segments 2018 ($m, % Share)
Table 7.3 Abbott Laboratories Recent Revenue 2013-2018 ($m, AGR %)
Table 7.4 Abbott Laboratories M&A (Company, Business Focus, Completion date, Currency, Acquisition price)
Table 7.5 ADM Overview (Total Revenue ($m), Ticker, HQ, IR Contact, Website) 2018
Table 7.6 ADM Revenue by Business Segment 2018 ($m, % Share)
Table 7.7 ADM Recent Revenue 2013-2018 ($m, AGR %)
Table 7.8 ADM Products/Services 2018 (Product/Service, Description)
Table 7.9 ADM M&A (Company, Business Focus, Completion date, Currency, Acquisition price)
Table 7.10 Arla Foods Overview 2018 (Total Revenue ($m), HQ, IR Contact, Website)
Table 7.11 Arla Business Segments and Revenue from the Segments 2018 ($m, % Share)
Table 7.12 Arla Revenue Split by Country 2018 ($m, % Share)
Table 7.13 Arla Recent Revenue 2013-2018 ($m, AGR%)
Table 7.14 Arla Brand/Products 2018 (Brand/Product, Description)
Table 7.15 BASF Overview 2018 (Total Revenue ($m), Ticker, HQ, IR Contact, Website)
Table 7.16 BASF Revenue by Business Segments 2018 ($m, % Share)
Table 7.17 BASF Recent Revenue 2013-2018 ($m, AGR %)
Table 7.18 BASF M&A (Company, Business Focus, Completion date, Currency, Acquisition price)
Table 7.19 Dean Foods Overview 2018 (Total Revenue ($m), Ticker, HQ, IR Contact, Website)
Table 7.20 Dean Food Revenue by Business Segments 2018 ($m, % Share)
Table 7.21 Dean Foods Recent Revenue 2013-2018 ($m, AGR %)
Table 7.22 Danone Overview 2018 (Total Revenue ($m), Ticker, HQ, IR Contact, Website)
Table 7.23 Danone Revenue by Business Segments 2018 ($bn, % Share)
Table 7.24 Danone Recent Revenue 2013-2018 ($m, AGR %)
Table 7.25 Danone M&A (Company, Business Focus, Completion date, Currency, Acquisition price)
Table 7.26 General Mills Overview 2018 (Total Revenue ($m), Ticker, HQ, IR Contact, Website)
Table 7.27 General Mills Revenue by Business Segments 2018 ($m, % Share)
Table 7.28 General Mills Sales by Product Category 2018 ($m, % Share)
Table 7.29 General Mills Recent Revenue 2013-2018 ($m, AGR%)
Table 7.30 General Mills M&A (Company, Business Focus, Completion date, Currency, Acquisition price)
Table 7.31 Glanbia plc Overview 2018 (Total Revenue ($m), Ticker, HQ, IR Contact, Website)
Table 7.32 Glanbia plc Revenue by Business Segments 2018 ($m, % Share)
Table 7.33 Glanbia plc Recent Revenue 2013-2018 ($m, AGR%)
Table 7.34 Glanbia plc M&A (Company, Business Focus, Completion date, Currency, Acquisition price)
Table 7.35 GlaxoSmithKline plc Overview 2018 (Total Revenue ($m), Ticker, HQ, IR Contact, Website)
Table 7.36 GlaxoSmithKline plc Revenue by Business Segments 2018 ($m, % Share)
Table 7.37 GlaxoSmithKline plc Revenue by Consumer Healthcare Segments 2018 (% Share)
Table 7.38 GlaxoSmithKline plc Recent Revenue 2013-2018 ($m, AGR%)
Table 7.39 Kellogg Overview 2018 (Total Revenue ($m), Ticker, HQ, IR Contact, Website)
Table 7.40 Kellogg Revenue by Business Segments 2018 ($m, % Share)
Table 7.41 Kellogg Revenue by Product Category 2018 ($m, % Share)
Table 7.42 Kellogg Recent Revenue 2013-2018 ($m, AGR %)
Table 7.43 Kellogg M&A (Company, Business Focus, Completion date, Currency, Acquisition price)
Table 7.44 Nestle Overview 2018 (Total Revenue ($m), Ticker, HQ, IR Contact, Website)
Table 7.45 Employees by Geographic Area 2018 (% Share)
Table 7.46 Nestle Products Revenue from Segments 2018 ($m, % Share)
Table 7.47 Nestle Recent Revenue 2013-2018 ($m, AGR %)
Table 7.48 Nestle M&A (Company, Business Focus, Completion date, Currency, Acquisition price)
Table 7.49 Orkla Group Overview 2018 (Total Revenue ($m), Ticker, HQ, IR Contact, Website)
Table 7.50 Orkla Group Revenue by Business Segments 2018 ($m, % Share)
Table 7.51 Orkla Group Recent Revenue 2013-2018 ($m, AGR %)
Table 7.52 PepsiCo Overview 2018 (Total Revenue ($m), Ticker, HQ, IR Contact, Website)
Table 7.53 PepsiCo Revenue by Business Segments 2018 ($m, % Share)
Table 7.54 PepsiCo Recent Revenue 2013-2018 ($m, AGR %)
Table 7.55 Raisio Group Overview 2018 (Total Revenue ($m), Ticker, HQ, IR Contact, Website)
Table 7.56 Raisio Group Revenue by Business Segments 2018 ($m, % Share)
Table 7.57 Raisio Group Recent Revenue 2013-2018 ($m, AGR %)
Table 7.58 Raisio Group M&A (Company, Business Focus, Completion date, Currency, Acquisition price)
Table 7.59 Royal FrieslandCampina N.V. Overview 2018 (Total Revenue ($m), Ticker, HQ, IR Contact, Website)
Table 7.60 Royal FrieslandCampina N.V. Recent Revenue 2013-2018 ($m, AGR %)
Table 7.61 Royal FrieslandCampina N.V. Key developments in 2018
Table 7.62 Other Leading Companies in The Functional Foods Market 2018 (Company Name, Product/Service)
Table 7.63 Leading Superfoods Companies 2018 (Company name, Product/Service)
List of Figures
Figure 1.1 UK Functional Foods Market Forecast 2020-2030 ($bn, AGR %)
Figure 1.2 Global Functional Foods Market Segmentation 2018
Figure 2.1 Natural Superfoods
Figure 2.2 Antioxidants at Work
Figure 2.3 Functional Food & Drink Market Segments 2018 ($bn)
Figure 2.4 The Overlap Of “Superfoods” With Other Food Markets
Figure 3.1 Global Functional Foods Market Forecast 2020-2030 ($bn, AGR%)
Figure 3.2 Global Functional Foods Market Drivers and Restrains
Figure 4.1 Leading Functional Foods Submarket Forecasts 2020-2030 ($bn, AGR %)
Figure 4.2 Leading Functional Foods Submarket AGR Forecasts 2020-2030 (AGR %)
Figure 4.3 Leading Functional Foods Submarkets Shares Forecast 2018 (% Share)
Figure 4.4 Leading Functional Foods Submarkets Shares Forecast 2025 (% Share)
Figure 4.5 Leading Functional Foods Submarkets Shares Forecast 2030 (% Share)
Figure 4.6 Functional Dairy Market Forecast 2020-2030 ($bn, AGR %)
Figure 4.7 Functional Dairy Market Share Forecast 2019, 2025 and 2030 (% Share)
Figure 4.8 Functional Bakery & Cereal Market Forecast 2020-2030 ($bn, AGR %)
Figure 4.9 Functional Bakery & Cereal Submarket Share Forecast 2019, 2025 and 2030 (% Share)
Figure 4.10 Functional Baby Food Market Forecast 2020-2030 ($bn, AGR %)
Figure 4.11 Functional Baby Food Market Share Forecast 2019, 2025 and 2030 (% Share)
Figure 4.12 Functional Fats & Oils Market Forecast 2020-2030 ($bn, AGR %)
Figure 4.13 Functional Fats & Oils Market Share Forecast 2019, 2025 and 2030 (% Share)
Figure 4.14 Functional Meat, Fish & Eggs Market Forecast 2020-2030 ($bn, AGR %)
Figure 4.15 Functional Meat, Fish & Eggs Market Share Forecast 2019, 2025 and 2030 (% Share)
Figure 4.16 Other Functional Foods Market Forecast 2020-2030 ($bn, AGR %)
Figure 4.17 Other Functional Foods Market Share Forecast 2019, 2025 and 2030 (% Share)
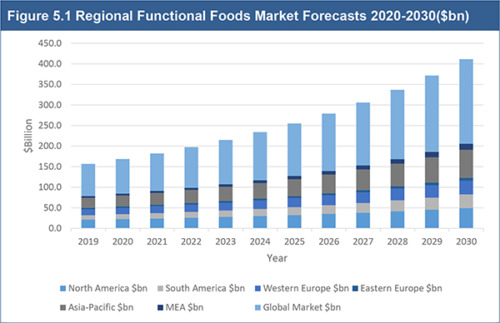
Figure 5.1 Regional Functional Foods Market Forecasts 2020-2030 ($bn, AGR %)
Figure 5.2 Regional Functional Foods Market AGR Forecasts 2020-2030 (AGR %)
Figure 5.3 Regional Functional Foods Market Share Forecast 2018 (% Share)
Figure 5.4 Regional Functional Foods Markets Share Forecast 2025 (% Share)
Figure 5.5 Regional Functional Foods Market Share Forecast 2030 (% Share)
Figure 5.6 Regional Functional Foods & Beverages Market Share Distribution 2002 (% Share)
Figure 5.7 Regional Functional Foods & Beverages Market Share Distribution 2008 (% Share)
Figure 5.8 North American Functional Foods Market Forecast 2020-2030 ($bn, AGR%)
Figure 5.9 North American Functional Foods Market Share Forecast 2019, 2025 and 2030 (% Share)
Figure 5.10 South American Functional Foods Market Forecast 2020-2030 ($bn, AGR %)
Figure 5.11 South American Functional Foods Market Share Forecast 2019, 2025 and 2030 (% Share)
Figure 5.12 Western European Functional Foods Market Forecast 2020-2030 ($bn, AGR %)
Figure 5.13 Western European Functional Foods Market Share Forecast 2019, 2025 and 2030 (% Share)
Figure 5.14 Eastern European Functional Foods Market Forecast 2020-2030 ($bn, AGR %)
Figure 5.15 Eastern European Functional Foods Market Share Forecast 2019, 2025 and 2030 (% Share)
Figure 5.16 Asia-Pacific Functional Foods Market Forecast 2020-2030 ($bn, AGR %)
Figure 5.17 Asia-Pacific Functional Foods Market Share Forecast 2019, 2025 and 2030 (% Share)
Figure 5.18 MEA Functional Foods Market Forecast 2020-2030 ($bn, AGR %)
Figure 5.19 MEA Functional Foods Market Share Forecast 2019, 2025 and 2030 (% Share)
Figure 6.1 Leading National Functional Foods Market Forecasts 2020-2030 ($bn, AGR %)
Figure 6.2 Leading National Functional Foods Market AGR Forecasts 2020-2030 (AGR %)
Figure 6.3 Leading National Functional Foods Market Share Forecast 2018 (% Share)
Figure 6.4 Leading National Functional Foods Market Share Forecast 2025 (% Share)
Figure 6.5 Leading National Functional Foods Market Share Forecast 2030 (% Share)
Figure 6.6 US Functional Foods Market Forecast 2020-2030 ($bn, AGR %)
Figure 6.7 US Functional Foods Market Share Forecast 2019, 2025 and 2030 (% Share)
Figure 6.8 Canadian Functional Foods Market Forecast 2020-2030 ($bn, AGR %)
Figure 6.9 Canadian Functional Foods Market Share Forecast 2019, 2025 and 2030 (% Share)
Figure 6.10 Mexican Functional Foods Market Forecast 2020-2030 ($bn, AGR %)
Figure 6.11 Mexican Functional Foods Market Share Forecast 2019, 2025 and 2030 (% Share)
Figure 6.12 Brazilian Functional Foods Market Forecast 2020-2030 ($bn, AGR %)
Figure 6.13 Brazilian Functional Foods Market Share Forecast 2019, 2025 and 2030 (% Share)
Figure 6.14 UK Functional Foods Market Forecast 2020-2030 ($bn, AGR %)
Figure 6.15 UK Functional Foods Market Share Forecast 2019, 2025 and 2030 (% Share)
Figure 6.16 German Functional Foods Market Forecast 2020-2030 ($bn, AGR %)
Figure 6.17 German Functional Foods Market Share Forecast 2019, 2025 and 2030 (% Share)
Figure 6.18 Japanese Functional Foods Market Forecast 2020-2030 ($bn, AGR %)
Figure 6.19 Functional Foods Market Share Forecast 2019, 2025 and 2030 (% Share)
Figure 6.20 UAE Functional Foods Market Forecast 2020-2030 ($bn, AGR %)
Figure 6.21 UAE Functional Foods Market Share Forecast 2019, 2025 and 2030 (% Share)
Figure 6.22 China Functional Foods Market Forecast 2020-2030 ($bn, AGR %)
Figure 6.23 China Functional Foods Market Share Forecast 2019, 2025 and 2030 (% Share)
Figure 6.24 India Functional Foods Market Forecast 2020-2030 ($bn, AGR %)
Figure 6.25 India Functional Foods Market Share Forecast 2019, 2025 and 2030 (% Share)
Figure 6.26 RoW Functional Foods Market Forecast 2020-2030 ($bn, AGR %)
Figure 6.27 RoW Functional Foods Market Share Forecast 2019, 2025 and 2030 (% Share)
Figure 7.1 Abbott Laboratories Revenue by Business Segments 2018 (% Share)
Figure 7.2 Abbott Laboratories Historic Revenue 2013-2018 ($m, AGR %)
Figure 7.3 Abbott Laboratories Regional Emphasis/ Focus 2018 (% Share)
Figure 7.4 ADM Revenue by Business Segment 2018 (% Share)
Figure 7.5 ADM Recent Revenue 2013-2018 ($m, AGR %)
Figure 7.6 ADM Regional Emphasis/Focus 2018 (% Share)
Figure 7.7 Arla Business Segments and Revenue from the Segments 2018 (% Share)
Figure 7.8 Arla Revenue by Country 2018 (% Share)
Figure 7.9 Arla Recent Revenue 2013-2018 ($m, AGR%)
Figure 7.10 BASF Revenue by Business Segments 2018 (% Share)
Figure 7.11 BASF Recent Revenue 2013-2018 ($m, AGR %)
Figure 7.12 BASF Regional Emphasis/ Focus 2018 (% Share)
Figure 7.13 Dean Food Revenue by Business Segments 2018 (% Share)
Figure 7.14 Dean Foods Historic Revenue 2013-2018 ($m, AGR%)
Figure 7.15 Danone Revenue by Business Segments 2018 ($bn, % Share)
Figure 7.16 Danone Recent Revenue 2013-2018 ($m, AGR %)
Figure 7.17 Danone Regional Emphasis/ Focus 2018 (% Share)
Figure 7.18 General Mills Revenue by Business Segments 2018 (% Share)
Figure 7.19 General Mills Sales by Product Category 2018 (% Share)
Figure 7.20 General Mills Recent Revenue 2013-2018 ($m, AGR%)
Figure 7.21 General Mills Regional Emphasis/ Focus 2018 (% Share)
Figure 7.22 Glanbia plc Historic Revenue 2013-2018 ($m, AGR%)
Figure 7.23 Glanbia plc Regional Emphasis/ Focus 2018 (% Share)
Figure 7.24 GlaxoSmithKline plc Revenue by Business Segments 2018 (% Share)
Figure 7.25 GlaxoSmithKline plc Revenue by Consumer Healthcare Business Segments 2018 (% Share)
Figure 7.26 GlaxoSmithKline plc Historic Revenue 2013-2018 ($m, AGR%)
Figure 7.27 GlaxoSmithKline plc Geographical Spread of Employees 2018 (% Share)
Figure 7.28 Kellogg Revenue by Business Segments 2018 ($m, % Share)
Figure 7.29 Kellogg Revenue by Product Category 2018 (% Share)
Figure 7.30 Kellogg Historic Revenue 2013-2018 ($m, AGR %)
Figure 7.31 Kellogg Regional Emphasis/ Focus 2018 (% Share)
Figure 7.32 Nestle Products Revenue from Segments 2018 (% Share)
Figure 7.33 Nestle Historic Revenue 2013-2018 ($m, AGR %)
Figure 7.34 Nestle Regional Emphasis/ Focus 2018 (% Share)
Figure 7.35 Nestle Sales by Country 2018 (% Share)
Figure 7.36 Orkla Group Revenue by Business Segments 2018 (% Share)
Figure 7.37 Orkla Group Historic Revenue 2013-2018 ($m, AGR%)
Figure 7.38 Orkla Group Regional Emphasis/ Focus 2018 (% Share)
Figure 7.39 PepsiCo Revenue by Business Segments 2018 (% Share)
Figure 7.40 PepsiCo Recent Revenue 2013-2018 ($m, AGR%)
Figure 7.41 PepsiCo Regional Emphasis/ Focus 2018 (% Share)
Figure 7.42 Royal FrieslandCampina N.V. Historic Revenue 2013-2018 ($m, AGR %)
Figure 7.43 Raisio Group Regional Emphasis/ Focus 2018 (% Share)
Figure 7.44 Royal FrieslandCampina N.V. Historic Revenue 2013-2018 ($m, AGR %)
Figure 7.45 Royal FrieslandCampina N.V. Regional Emphasis/ Focus 2018 (% Share)
Figure 8.1 Top 3 Largest Functional Foods Submarkets 2019, 2025 and 2030 ($bn)
Figure 8.2 Top 3 Fastest Growing Functional Foods Submarkets 2020-2030 (AGR %)
Figure 8.3 Top 3 Largest Regional Functional Foods Markets 2019, 2025 and 2030 ($bn)
Figure 8.4 Top 3 Fastest Growing Regional Functional Foods Markets 2020-2030 (AGR %)
Figure 8.5 Top 3 Largest National Functional Foods Markets 2019, 2025 and 2030 ($bn)
Figure 8.6 Top 3 Fastest Growing National Functional Foods Markets 2020-2030 (AGR %)

