Industries > Food and Drink > Alternative Sweeteners Market Report 2020-2030

Alternative Sweeteners Market Report 2020-2030
Forecasts by Product (High-Intensity Sweetener, High Fructose Syrup, Low-Intensity Sweetener), by Application (Beverages, Dairy & Frozen Desserts, Bakery Goods, Alternative Sweeteners & Snacks, Pharmaceuticals & Nutraceuticals, Others), by Distribution Channel (Online and Offline). PLUS Profiles of Leading Alternative Sweeteners Companies and Regional and Leading National Market Analysis AND COVID-19 Recovery Scenarios
Changing regulations and tax restrictions have led high-use sugar products to focus on marketing new goods of reduced and alternatively sweetened foodstuffs. Increased awareness of long-term illnesses associated with weight, and diabetes have led to greater consumer demand for alternatives. The majority of organic food product manufacturers utilize alternative sweeteners ingredients. So, with producer, consumer, health authorities and regulators targeting sugar usage, just how big is the alternative sweetener market set to become. This report tells you – TODAY.
You need to discover how this will impact the market today, and over the next 10 years:
• Our 353-page report provides 349 tables and 212 charts/graphs exclusively to you.
• The report highlights key lucrative areas in the industry so you can target them – NOW.
• Contains in-depth analyse of global, regional and national sales and growth
• Highlights for you the key successful trends, changes and revenue projections m,ade by your competitors
This report tells you TODAY how the Alternative Sweeteners market will develop in the next 10 years, and in-line with the variations in COVID-19 economic recession and bounce. This market is more critical now than at any point over the last 10 years.
Delivers exclusive COVID-19 variations economic data specific to your market.
This report tells you:
• Technological and structural changes occurring in the industry and how they effect you
• Key developments by alternative sweetener manufacturer
• How key players in the alternative sweeteners market are strategically increasing/ decreasing/ holding their positions?
• Financial aspect of key manufacturers operating in alternative sweeteners market
• Growth assessments within the alternative sweeteners industry during the forecast timeline?
This report is not available to everyone. Just a few of these reports exist. Make sure you get your copy immediately.
This report includes data analysis and invaluable insight into how COVID-19 will affect your industry. Access this report today.
To access the data contained in this document please email contactus@visiongain.com
Forecasts to 2030 and other analyses reveal the commercial prospects
• In addition to revenue forecasting to 2030, our new study provides you with recent results, growth rates, and market shares.
• You find original analyses, with business outlooks and developments.
• Discover qualitative analyses including market dynamics, (drivers, opportunities, restraints and challenges), SWOT Analysis, Porters Five Forces Analysis, PEST Analysis and Covid 19 impact analysis.
Discover sales predictions for the world market and submarkets
Alternative Sweeteners: Product
• High-Intensity Sweetener
• High Fructose Syrup
• Low-Intensity Sweetener
Alternative Sweeteners: Application
• Beverages
• Dairy & Frozen Desserts
• Bakery Goods
• Alternative Sweeteners & Snacks
• Pharmaceuticals & Nutraceuticals
• Others
Alternative Sweeteners: Distribution Channel
• Online
• Offline

In addition to the revenue predictions for the overall world market and segments, you will also find revenue forecasts for 5 regional and 7 leading national markets:
• North America:
• U.S.
• Rest of North America
• Europe:
• Germany
• United Kingdom
• Rest of Europe
• Asia Pacific:
• China
• India
• Rest of Asia Pacific
• Latin America:
• Brazil
• Rest of Latin America
• Middle East and Africa:
• South Africa
• Rest of Middle East and Africa
Need industry data? Please contact us today.
The report also includes profiles and for some of the leading companies in the Alternative Sweeteners Market, with a focus on this segment of these companies’ operations.
Leading companies and the potential for market growth
Overall world revenue for Alternative Sweeteners Market will surpass $xx million in 2020, our work calculates. We predict strong revenue growth through to 2030. Our work identifies which organizations hold the greatest potential. Discover their capabilities, progress, and commercial prospects, helping you stay ahead.
How the Alternative Sweeteners Market report helps you
In summary, our 353 pages report provides you with the following knowledge:
• Revenue forecasts to 2030 for Alternative Sweeteners Market, with forecasts for Product, Application and Distribution Channel, each forecasted at a global and regional level– discover the industry’s prospects, finding the most lucrative places for investments and revenues
• Revenue forecasts to 2030 for 5 regional and 9 key national markets – See forecasts for the Alternative Sweeteners market in North America, Europe, Asia-Pacific, Middle East and Africa and Latin America. Also forecasted is the market in the US, Brazil, South Africa, Germany, France, UK, China, India, and Japan, among other prominent economies.
• Prospects for established firms and those seeking to enter the market– including company profiles for 10 of the major companies involved in the Alternative Sweeteners Market. Some of the company’s profiled in this report includes Archer Daniels Midland Company, Cargill Incorporated, Ajinomoto Co., Inc., DuPont Nutrition & Health and Ingredion Incorporated.
Find quantitative and qualitative analyses with independent predictions. Receive information that only our report contains, staying informed with this invaluable business intelligence.
Information found nowhere else
With our newly report title, you are less likely to fall behind in knowledge or miss out on opportunities. See how our work could benefit your research, analyses, and decisions.
Visiongain’s study is for everybody needing commercial analyses for the alternative sweeteners Market and leading companies. You will find data, trends and predictions.
To access the data contained in this document please email contactus@visiongain.com
Buy our report today Alternative Sweeteners Market Report 2020-2030: Forecasts by Product (High-Intensity Sweetener, High Fructose Syrup, Low-Intensity Sweetener), by Application (Beverages, Dairy & Frozen Desserts, Bakery Goods, Alternative Sweeteners & Snacks, Pharmaceuticals & Nutraceuticals, Others), by Distribution Channel (Online and Offline). PLUS Profiles of Leading Alternative Sweeteners Companies and Regional and Leading National Market Analysis AND COVID-19 Recovery Scenarios. Avoid missing out by staying informed – order our report now.
Visiongain is a trading partner with the US Federal Government
CCR Ref number: KD4R6
Do you have any custom requirements we can help you with? Any need for a specific country, geo region, market segment or specific company information? Contact us today, we can discuss your needs and see how we can help: sara.peerun@visiongain.com
1.1. Global Alternative Sweeteners Market Overview
1.1.1. Global Alternative Sweeteners Market Segmentation
1.1.2. Alternative Sweeteners Market Definition
1.1.3. Definition of Material
1.1.4. Definition of Applications
1.1.5. Definition of Distribution Channel
1.2. Why You Should Read This Report
1.3. What This Report Delivers
1.4. Key Questions Answered By This Analytical Report Include:
1.5. Who is This Report For?
1.6. Methodology
1.6.1. Primary Research
1.6.2. Secondary Research
1.7. Market Evaluation & Forecasting Methodology
1.7.1. COIVD-19 Impact Recovery Pattern Analysis
1.7.2. V-Shaped Recovery
1.7.3. U-Shaped Recovery
1.7.4. W-Shaped Recovery
1.7.5. L-Shaped Recovery
1.7.6. Without Covid 19 Impact
1.8. Frequently Asked Questions (FAQs)
1.9. Associated Visiongain Reports
1.10. About Visiongain
2. Executive Summary
2.1. Segment Insights
2.2. Covid 19 Impact on Alternative Sweeteners Market
3. Global Alternative Sweeteners Market Outlook
3.1. Market Trend Analysis
3.1.1. Drivers
3.1.1.1. Large Number of Diabetic Population at Global Level
3.1.1.2. Demand from Food and Beverages Industries
3.1.1.3. Trend of Consuming Organic Food Product
3.1.2. Restraint
3.1.2.1. Ambiguity on Health Problems with Alternative Sweeteners Consumption
3.1.2.2. Low Consumer Awareness About Alternative Sweeteners
3.1.3. Opportunity
3.1.3.1. Demand of Alternative Sweeteners in Probiotic Product
3.1.3.2. Demand of Alternative Sweeteners in Low Carb Diet
3.2. SWOT Analysis
3.3. Industry analysis - Porter’s
3.3.1. Bargaining Power of Suppliers
3.3.2. Bargaining Power of Buyer
3.3.3. Threat of Substitute Products
3.3.4. Threat of Substitute New Entry
3.4. PEST Analysis
3.5. Covid-19 Impact Analysis
4. Global Alternative Sweeteners Market Size Forecast 2020-2030 by Product, (Post COVID-19)
4.1. Global Alternative Sweeteners Market for High-Intensity Sweetener Segment: Revenue Forecast 2020-2030, (Post COVID-19)
4.2. Increasing demand of high intensity sweeteners in concentrated food manufacturing segment is driving the market growth
4.2.1. Global Alternative Sweeteners Market Segment: COVID Recovery Forecasts – V Recovery
4.2.2. Global Alternative Sweeteners Market Segment: COVID Recovery Forecasts – U Recovery
4.2.3. Global Alternative Sweeteners Market Segment: COVID Recovery Forecasts – W Recovery
4.2.4. Global Alternative Sweeteners Market Segment: COVID Recovery Forecasts – L Recovery
4.2.5. Global Alternative Sweeteners Market Segment: COVID Recovery Forecasts – Without Covid 19 Impact
4.3. Global Alternative Sweeteners Market for High Fructose Syrup Segment: Revenue Forecast 2020-2030
4.4. HFCS is one of the most versatile ingredients on the market. It adds texture, helps keep color, maintains quality and enhances flavor in many foods and beverages.
4.4.1. Global Alternative Sweeteners Market Segment: COVID Recovery Forecasts – V Recovery
4.4.2. Global Alternative Sweeteners Market Segment: COVID Recovery Forecasts – U Recovery
4.4.3. Global Alternative Sweeteners Market Segment: COVID Recovery Forecasts – W Recovery
4.4.4. Global Alternative Sweeteners Market Segment: COVID Recovery Forecasts – L Recovery
4.4.5. Global Alternative Sweeteners Market Segment: COVID Recovery Forecasts – Without Covid 19 Impact
4.5. Global Alternative Sweeteners Market for Low-Intensity Sweetener Segment: Revenue Forecast 2020-2030
4.6. It is a natural sugar that is present in fruits, fruit juices, certain vegetables, and honey. In these forms, fructose sugars can be part of a healthful diet. It drives the market growth as a result of its natural formation.
4.6.1. Global Alternative Sweeteners Market Segment: COVID Recovery Forecasts – V Recovery
4.6.2. Global Alternative Sweeteners Market Segment: COVID Recovery Forecasts – U Recovery
4.6.3. Global Alternative Sweeteners Market Segment: COVID Recovery Forecasts – W Recovery
4.6.4. Global Alternative Sweeteners Market Segment: COVID Recovery Forecasts – L Recovery
4.6.5. Global Alternative Sweeteners Market Segment: COVID Recovery Forecasts – Without Covid 19 Impact
5. Global Alternative Sweeteners Market Size Forecast 2020-2030 by Application, (Post COVID-19)
5.1. Global Alternative Sweeteners Market for Beverages Segment: Revenue Forecast 2020-2030
5.2. Increasing demand of healthy beverage will create new opportunity in alternative sweeteners market.
5.2.1. Global Alternative Sweeteners Market Segment: COVID Recovery Forecasts – V Recovery
5.2.2. Global Alternative Sweeteners Market Segment: COVID Recovery Forecasts – U Recovery
5.2.3. Global Alternative Sweeteners Market Segment: COVID Recovery Forecasts – W Recovery
5.2.4. Global Alternative Sweeteners Market Segment: COVID Recovery Forecasts – L Recovery
5.2.5. Global Alternative Sweeteners Market Segment: COVID Recovery Forecasts – Without Covid 19 Impact
5.3. Global Alternative Sweeteners Market for Dairy & Frozen Desserts Segment: Recovery Forecasts 2020-2030
5.4. Improving heat shock tolerance. during transportation, frozen dessert is exposed to temperature changes which might cause a decline in its quality.
5.4.1. Global Alternative Sweeteners Market Segment: COVID Recovery Forecasts – V Recovery
5.4.2. Global Alternative Sweeteners Market Segment: COVID Recovery Forecasts – U Recovery
5.4.3. Global Alternative Sweeteners Market Segment: COVID Recovery Forecasts – W Recovery
5.4.4. Global Alternative Sweeteners Market Segment: COVID Recovery Forecasts – L Recovery
5.4.5. Global Alternative Sweeteners Market Segment: COVID Recovery Forecasts – Without Covid 19 Impact
5.5. Global Alternative Sweeteners Market for Bakery Goods Segment: Revenue Forecast 2020-2030
5.6. Home cooked healthy bakery product is improving in creating new market opportunity
5.6.1. Global Alternative Sweeteners Market Segment: COVID Recovery Forecasts – V Recovery
5.6.2. Global Alternative Sweeteners Market Segment: COVID Recovery Forecasts – U Recovery
5.6.3. Global Alternative Sweeteners Market Segment: COVID Recovery Forecasts – W Recovery
5.6.4. Global Alternative Sweeteners Market Segment: COVID Recovery Forecasts – L Recovery
5.6.5. Global Alternative Sweeteners Market Segment: COVID Recovery Forecasts – Without Covid 19 Impact
5.7. Global Alternative Sweeteners Market for Confectionery & Snacks Segment: Revenue Forecast 2020-2030
5.8. Product innovation in terms of processing, formulations, and packaging are the key factors driving the growth of the confectionery industry
5.8.1. Global Alternative Sweeteners Market Segment: COVID Recovery Forecasts – V Recovery
5.8.2. Global Alternative Sweeteners Market Segment: COVID Recovery Forecasts – U Recovery
5.8.3. Global Alternative Sweeteners Market Segment: COVID Recovery Forecasts – W Recovery
5.8.4. Global Alternative Sweeteners Market Segment: COVID Recovery Forecasts – L Recovery
5.8.5. Global Alternative Sweeteners Market Segment: COVID Recovery Forecasts – Without Covid 19 Impact
5.9. Global Alternative Sweeteners Market for Pharmaceuticals & Nutraceuticals Alternative Sweeteners Segment: Revenue Forecast 2020-2030
5.10. Increasing market penetration of stevia extract reb-A is improving demand of alternative sweeteners in pharmaceutical market
5.10.1. Global Alternative Sweeteners Market Segment: COVID Recovery Forecasts – V Recovery
5.10.2. Global Alternative Sweeteners Market Segment: COVID Recovery Forecasts – U Recovery
5.10.3. Global Alternative Sweeteners Market Segment: COVID Recovery Forecasts – W Recovery
5.10.4. Global Alternative Sweeteners Market Segment: COVID Recovery Forecasts – L Recovery
5.10.5. Global Alternative Sweeteners Market Segment: COVID Recovery Forecasts – Without Covid 19 Impact
5.11. Global Alternative Sweeteners Market for Other Application Segment: Revenue Forecast 2020-2030
5.12. Availability of large application segments for alternative sweeteners is driving the market
5.12.1. Global Alternative Sweeteners Market Segment: COVID Recovery Forecasts – V Recovery
5.12.2. Global Alternative Sweeteners Market Segment: COVID Recovery Forecasts – U Recovery
5.12.3. Global Alternative Sweeteners Market Segment: COVID Recovery Forecasts – W Recovery
5.12.4. Global Alternative Sweeteners Market Segment: COVID Recovery Forecasts – L Recovery
5.12.5. Global Alternative Sweeteners Market Segment: COVID Recovery Forecasts – Without Covid 19 Impact
6. Global Alternative Sweeteners Market Size Forecast 2020-2030 by Distribution Channel (Post COVID-19)
6.1. Global Alternative Sweeteners Market for Offline Segment: Revenue Forecast 2020-2030
6.2. Rising number of hypermarket and supermarket at global level is creating new opportunity for alternative sweeteners
6.2.1. Global Alternative Sweeteners Market Segment: COVID Recovery Forecasts – V Recovery
6.2.2. Global Alternative Sweeteners Market Segment: COVID Recovery Forecasts – U Recovery
6.2.3. Global Alternative Sweeteners Market Segment: COVID Recovery Forecasts – W Recovery
6.2.4. Global Alternative Sweeteners Market Segment: COVID Recovery Forecasts – L Recovery
6.2.5. Global Alternative Sweeteners Market Segment: COVID Recovery Forecasts – Without Covid 19 Impact
6.3. Global Alternative Sweeteners Market for Online Segment: Revenue Forecast 2020-2030
6.4. Consumer demand of purchasing product through online channel is expected to boost the market growth in online distribution channel
6.4.1. Global Alternative Sweeteners Market Segment: COVID Recovery Forecasts – V Recovery
6.4.2. Global Alternative Sweeteners Market Segment: COVID Recovery Forecasts – U Recovery
6.4.3. Global Alternative Sweeteners Market Segment: COVID Recovery Forecasts – W Recovery
6.4.4. Global Alternative Sweeteners Market Segment: COVID Recovery Forecasts – L Recovery
6.4.5. Global Alternative Sweeteners Market Segment: COVID Recovery Forecasts – Without Covid 19 Impact
7. Regional and Leading National Alternative Sweeteners Market Forecasts 2020-2030
7.1. Global Alternative Sweeteners Market by National Market Forecast 2020-2030
7.1.1. Global Alternative Sweeteners Market by National Market Forecast 2020-2030, COVID Recovery Scenarios
7.2. North America
7.2.1. North America Alternative Sweeteners Market Forecast 2020-2030, Recovery Scenarios
7.2.2. Rising number of obese populations is driving the market growth for this region
7.2.2.1. North America Alternative Sweeteners Market Segment: COVID Recovery Forecasts – V Recovery
7.2.2.2. North America Alternative Sweeteners Market Segment: COVID Recovery Forecasts – U Recovery
7.2.2.3. North America Alternative Sweeteners Market Segment: COVID Recovery Forecasts – W Recovery
7.2.2.4. North America Alternative Sweeteners Market Segment: COVID Recovery Forecasts – L Recovery
7.2.2.5. North America Alternative Sweeteners Market Segment: COVID Recovery Forecasts – Without Covid 19 Impact
7.2.3. North America Alternative Sweeteners Market Forecast by Product, 2020-2030 (US$ billion, AGR %)
7.2.4. North America Alternative Sweeteners Market Forecast by Application, 2020-2030 (US$ billion, AGR %)
7.2.5. North America Alternative Sweeteners Market Forecast by Distribution Channel, 2020-2030 (US$ billion, AGR%)
7.2.6. North America Alternative Sweeteners Market Forecast by Country, 2020-2030 (US$ billion, AGR%)
7.2.7. U.S. Alternative Sweeteners Market Forecast 2020-2030
7.2.8. Rising demand of healthy food product will boost the U.S. market growth
7.2.8.1. U.S. Alternative Sweeteners Market Segment: COVID Recovery Forecasts – V Recovery
7.2.8.2. U.S. Alternative Sweeteners Market Segment: COVID Recovery Forecasts – U Recovery
7.2.8.3. U.S. Alternative Sweeteners Market Segment: COVID Recovery Forecasts – W Recovery
7.2.8.4. U.S. Alternative Sweeteners Market Segment: COVID Recovery Forecasts – L Recovery
7.2.8.5. U.S. Alternative Sweeteners Market Segment: COVID Recovery Forecasts – Without Covid 19 impact
7.2.8.6. U.S. America Alternative Sweeteners Market Forecast by Product, 2020-2030 (US$ billion, AGR %)
7.2.8.7. U.S. Alternative Sweeteners Market Forecast by Application, 2020-2030 (US$ billion, AGR %)
7.2.8.8. U.S. Alternative Sweeteners Market Forecast by Distribution Channel, 2020-2030 (US$ billion, AGR%)
7.2.9. Rest of North America Alternative Sweeteners Market Forecast 2020-2030
7.2.10. Increasing number of alternative sweeteners manufacturer in this region will have a positive impact
7.2.10.1. Rest of North America Alternative Sweeteners Market Segment: COVID Recovery Forecasts – V Recovery
7.2.10.2. Rest of North America Alternative Sweeteners Market Segment: COVID Recovery Forecasts – U Recovery
7.2.10.3. Rest of North America Alternative Sweeteners Market Segment: COVID Recovery Forecasts – W Recovery
7.2.10.4. Rest of North America Alternative Sweeteners Market Segment: COVID Recovery Forecasts – L Recovery
7.2.10.5. Rest of North America Alternative Sweeteners Market Segment: COVID Recovery Forecasts – Without Covid 19 impact
7.2.10.6. Rest of North America Alternative Sweeteners Market Forecast by Product, 2020-2030 (US$ billion, AGR %)
7.2.10.7. Rest of North America Alternative Sweeteners Market Forecast by Application, 2020-2030 (US$ billion, AGR %)
7.2.10.8. Rest of North America Alternative Sweeteners Market Forecast by Distribution Channel, 2020-2030 (US$ billion, AGR%)
7.3. Europe
7.3.1. Europe Alternative Sweeteners Market Forecast 2020-2030, Recovery Scenarios
7.3.2. Increasing spending in high quality food and beverage segment will have a positive impact in Europe market.
7.3.2.1. Europe Alternative Sweeteners Market Segment: COVID Recovery Forecasts – V Recovery
7.3.2.2. Europe Alternative Sweeteners Market Segment: COVID Recovery Forecasts – U Recovery
7.3.2.3. Europe Alternative Sweeteners Market Segment: COVID Recovery Forecasts – W Recovery
7.3.2.4. Europe Alternative Sweeteners Market Segment: COVID Recovery Forecasts – L Recovery
7.3.2.5. Europe Alternative Sweeteners Market Segment: COVID Recovery Forecasts – Without Covid 19 Impact
7.3.3. Europe Alternative Sweeteners Market Forecast by Product, 2020-2030 (US$ billion, AGR %)
7.3.4. Europe Alternative Sweeteners Market Forecast by Application, 2020-2030 (US$ billion, AGR %)
7.3.5. Europe Alternative Sweeteners Market Forecast by Distribution Channel, 2020-2030 (US$ billion, AGR%)
7.3.6. Europe Alternative Sweeteners Market Forecast by Country, 2020-2030 (US$ billion, AGR%)
7.3.7. U.K. Alternative Sweeteners Market Forecast 2020-2030
7.3.8. Raw material is easily available in U.K. Availability of stevia will create new opportunity for alternative sweeteners market.
7.3.8.1. U.K. Alternative Sweeteners Market Segment: COVID Recovery Forecasts – V Recovery
7.3.8.2. U.K. Alternative Sweeteners Market Segment: COVID Recovery Forecasts – U Recovery
7.3.8.3. U.K. Alternative Sweeteners Market Segment: COVID Recovery Forecasts – W Recovery
7.3.8.4. U.K. Alternative Sweeteners Market Segment: COVID Recovery Forecasts – L Recovery
7.3.8.5. U.K. Alternative Sweeteners Market Segment: COVID Recovery Forecasts – Without Covid 19 impact
7.3.8.6. U.K. America Alternative Sweeteners Market Forecast by Product, 2020-2030 (US$ billion, AGR %)
7.3.8.7. U.K. Alternative Sweeteners Market Forecast by Application, 2020-2030 (US$ billion, AGR %)
7.3.8.8. U.K. Alternative Sweeteners Market Forecast by Distribution Channel, 2020-2030 (US$ billion, AGR%)
7.3.9. Germany Alternative Sweeteners Market Forecast 2020-2030
7.3.10. Huge number of large-scale alternative manufacturers are present in Germany. This factor will boost the market growth.
7.3.10.1. Germany Alternative Sweeteners Market Segment: COVID Recovery Forecasts – V Recovery
7.3.10.2. Germany Alternative Sweeteners Market Segment: COVID Recovery Forecasts – U Recovery
7.3.10.3. Germany Alternative Sweeteners Market Segment: COVID Recovery Forecasts – W Recovery
7.3.10.4. Germany Alternative Sweeteners Market Segment: COVID Recovery Forecasts – L Recovery
7.3.10.5. Germany Alternative Sweeteners Market Segment: COVID Recovery Forecasts – Without Covid 19 impact
7.3.10.6. Germany America Alternative Sweeteners Market Forecast by Product, 2020-2030 (US$ billion, AGR %)
7.3.10.7. Germany Alternative Sweeteners Market Forecast by Application, 2020-2030 (US$ billion, AGR %)
7.3.10.8. Germany Alternative Sweeteners Market Forecast by Distribution Channel, 2020-2030 (US$ billion, AGR%)
7.3.11. Rest of Europe Alternative Sweeteners Market Forecast 2020-2030
7.3.12. Food and beverage industry growth is driving this industry
7.3.12.1. Rest of Europe Alternative Sweeteners Market Segment: COVID Recovery Forecasts – V Recovery
7.3.12.2. Rest of Europe Alternative Sweeteners Market Segment: COVID Recovery Forecasts – U Recovery
7.3.12.3. Rest of Europe Alternative Sweeteners Market Segment: COVID Recovery Forecasts – W Recovery
7.3.12.4. Rest of Europe Alternative Sweeteners Market Segment: COVID Recovery Forecasts – L Recovery
7.3.12.5. Rest of Europe Alternative Sweeteners Market Segment: COVID Recovery Forecasts – Without Covid 19 impact
7.3.12.6. Rest of Europe America Alternative Sweeteners Market Forecast by Product, 2020-2030 (US$ billion, AGR %)
7.3.12.7. Rest of Europe Alternative Sweeteners Market Forecast by Application, 2020-2030 (US$ billion, AGR %)
7.3.12.8. Rest of Europe Alternative Sweeteners Market Forecast by Distribution Channel, 2020-2030 (US$ billion, AGR%)
7.4. Asia Pacific
7.4.1. Asia Pacific Alternative Sweeteners Market Forecast 2020-2030, Recovery Scenarios
7.4.2. Ease of government regulation in Asia Pacific countries will boost the market growth.
7.4.2.1. Asia Pacific Alternative Sweeteners Market Segment: COVID Recovery Forecasts – V Recovery
7.4.2.2. Asia Pacific Alternative Sweeteners Market Segment: COVID Recovery Forecasts – U Recovery
7.4.2.3. Asia Pacific Alternative Sweeteners Market Segment: COVID Recovery Forecasts – W Recovery
7.4.2.4. Asia Pacific Alternative Sweeteners Market Segment: COVID Recovery Forecasts – L Recovery
7.4.2.5. Asia Pacific Alternative Sweeteners Market Segment: COVID Recovery Forecasts – Without Covid 19 Impact
7.4.3. Asia Pacific Alternative Sweeteners Market Forecast by Product, 2020-2030 (US$ billion, AGR %)
7.4.4. Asia Pacific Alternative Sweeteners Market Forecast by Application, 2020-2030 (US$ billion, AGR %)
7.4.5. Asia Pacific Alternative Sweeteners Market Forecast by Distribution Channel, 2020-2030 (US$ billion, AGR%)
7.4.6. Asia Pacific Alternative Sweeteners Market Forecast by Country, 2020-2030 (US$ billion, AGR%)
7.4.7. China Alternative Sweeteners Market Forecast 2020-2030
7.4.8. Key players have prominent presence in this country
7.4.8.1. China Alternative Sweeteners Market Segment: COVID Recovery Forecasts – V Recovery
7.4.8.2. China Alternative Sweeteners Market Segment: COVID Recovery Forecasts – U Recovery
7.4.8.3. China Alternative Sweeteners Market Segment: COVID Recovery Forecasts – W Recovery
7.4.8.4. China Alternative Sweeteners Market Segment: COVID Recovery Forecasts – L Recovery
7.4.8.5. China Alternative Sweeteners Market Segment: COVID Recovery Forecasts – Without Covid 19 impact
7.4.8.6. China America Alternative Sweeteners Market Forecast by Product, 2020-2030 (US$ billion, AGR %)
7.4.8.7. China Alternative Sweeteners Market Forecast by Application, 2020-2030 (US$ billion, AGR %)
7.4.8.8. China Alternative Sweeteners Market Forecast by Distribution Channel, 2020-2030 (US$ billion, AGR%)
7.4.9. India Alternative Sweeteners Market Forecast 2020-2030
7.4.10. Availability of investment in food and beverage segment will drive the market
7.4.10.1. India Alternative Sweeteners Market Segment: COVID Recovery Forecasts – V Recovery
7.4.10.2. India Alternative Sweeteners Market Segment: COVID Recovery Forecasts – U Recovery
7.4.10.3. India Alternative Sweeteners Market Segment: COVID Recovery Forecasts – W Recovery
7.4.10.4. India Alternative Sweeteners Market Segment: COVID Recovery Forecasts – L Recovery
7.4.10.5. India Alternative Sweeteners Market Segment: COVID Recovery Forecasts – Without Covid 19 impact
7.4.10.6. India America Alternative Sweeteners Market Forecast by Product, 2020-2030 (US$ billion, AGR %)
7.4.10.7. India Alternative Sweeteners Market Forecast by Application, 2020-2030 (US$ billion, AGR %)
7.4.10.8. India Alternative Sweeteners Market Forecast by Distribution Channel, 2020-2030 (US$ billion, AGR%)
7.4.11. Rest of Asia Pacific Alternative Sweeteners Market Forecast 2020-2030
7.4.12. Economical development in many countries will drive the industry.
7.4.12.1. Rest of Asia Pacific Alternative Sweeteners Market Segment: COVID Recovery Forecasts – V Recovery
7.4.12.2. Rest of Asia Pacific Alternative Sweeteners Market Segment: COVID Recovery Forecasts – U Recovery
7.4.12.3. Rest of Asia Pacific Alternative Sweeteners Market Segment: COVID Recovery Forecasts – W Recovery
7.4.12.4. Rest of Asia Pacific Alternative Sweeteners Market Segment: COVID Recovery Forecasts – L Recovery
7.4.12.5. Rest of Asia Pacific Alternative Sweeteners Market Segment: COVID Recovery Forecasts – Without Covid 19 impact
7.4.12.6. Rest of Asia Pacific America Alternative Sweeteners Market Forecast by Product, 2020-2030 (US$ billion, AGR %)
7.4.12.7. Rest of Asia Pacific Alternative Sweeteners Market Forecast by Application, 2020-2030 (US$ billion, AGR %)
7.4.12.8. Rest of Asia Pacific Alternative Sweeteners Market Forecast by Distribution Channel, 2020-2030 (US$ billion, AGR%)
7.5. Latin America
7.5.1. Latin America Alternative Sweeteners Market Forecast 2020-2030, Recovery Scenarios
7.5.2. Decreasing import barrier in Latin American countries will have a positive impact
7.5.2.1. Latin America Alternative Sweeteners Market Segment: COVID Recovery Forecasts – V Recovery
7.5.2.2. Latin America Alternative Sweeteners Market Segment: COVID Recovery Forecasts – U Recovery
7.5.2.3. Latin America Alternative Sweeteners Market Segment: COVID Recovery Forecasts – W Recovery
7.5.2.4. Latin America Alternative Sweeteners Market Segment: COVID Recovery Forecasts – L Recovery
7.5.2.5. Latin America Alternative Sweeteners Market Segment: COVID Recovery Forecasts – Without Covid 19 Impact
7.5.3. Latin America Alternative Sweeteners Market Forecast by Product, 2020-2030 (US$ billion, AGR %)
7.5.4. Latin America Alternative Sweeteners Market Forecast by Application, 2020-2030 (US$ billion, AGR %)
7.5.5. Latin America Alternative Sweeteners Market Forecast by Distribution Channel, 2020-2030 (US$ billion, AGR%)
7.5.6. Latin America Alternative Sweeteners Market Forecast by Country, 2020-2030 (US$ billion, AGR%)
7.5.7. Brazil Alternative Sweeteners Market Forecast 2020-2030
7.5.8. Availability of government fund for food and beverage industry will create new opportunity for Brazil market
7.5.8.1. Brazil Alternative Sweeteners Market Segment: COVID Recovery Forecasts – V Recovery
7.5.8.2. Brazil Alternative Sweeteners Market Segment: COVID Recovery Forecasts – U Recovery
7.5.8.3. Brazil Alternative Sweeteners Market Segment: COVID Recovery Forecasts – W Recovery
7.5.8.4. Brazil Alternative Sweeteners Market Segment: COVID Recovery Forecasts – L Recovery
7.5.8.5. Brazil Alternative Sweeteners Market Segment: COVID Recovery Forecasts – Without Covid 19 impact
7.5.8.6. Brazil America Alternative Sweeteners Market Forecast by Product, 2020-2030 (US$ billion, AGR %)
7.5.8.7. Brazil Alternative Sweeteners Market Forecast by Application, 2020-2030 (US$ billion, AGR %)
7.5.8.8. Brazil Alternative Sweeteners Market Forecast by Distribution Channel, 2020-2030 (US$ billion, AGR%)
7.5.9. Rest of Latin America Alternative Sweeteners Market Forecast 2020-2030
7.5.10. Developing countries are investing in healthy beverages which require alternative sweeteners
7.5.10.1. Rest of Latin America Alternative Sweeteners Market Segment: COVID Recovery Forecasts – V Recovery
7.5.10.2. Rest of Latin America Alternative Sweeteners Market Segment: COVID Recovery Forecasts – U Recovery
7.5.10.3. Rest of Latin America Alternative Sweeteners Market Segment: COVID Recovery Forecasts – W Recovery
7.5.10.4. Rest of Latin America Alternative Sweeteners Market Segment: COVID Recovery Forecasts – L Recovery
7.5.10.5. Rest of Latin America Alternative Sweeteners Market Segment: COVID Recovery Forecasts – Without Covid 19 impact
7.5.10.6. Rest of Latin America Alternative Sweeteners Market Forecast by Product, 2020-2030 (US$ billion, AGR %)
7.5.10.7. Rest of Latin America Alternative Sweeteners Market Forecast by Application, 2020-2030 (US$ billion, AGR %)
7.5.10.8. Rest of Latin America Alternative Sweeteners Market Forecast by Distribution Channel, 2020-2030 (US$ billion, AGR%)
7.6. Middle East and Africa
7.6.1. Middle East and Africa Alternative Sweeteners Market Forecast 2020-2030, Recovery Scenarios
7.6.2. High spending power for healthy food and beverages will drive the market in coming years
7.6.2.1. Middle East and Africa Alternative Sweeteners Market Segment: COVID Recovery Forecasts – V Recovery
7.6.2.2. Middle East and Africa Alternative Sweeteners Market Segment: COVID Recovery Forecasts – U Recovery
7.6.2.3. Middle East and Africa Alternative Sweeteners Market Segment: COVID Recovery Forecasts – W Recovery
7.6.2.4. Middle East and Africa Alternative Sweeteners Market Segment: COVID Recovery Forecasts – L Recovery
7.6.2.5. Middle East and Africa Alternative Sweeteners Market Segment: COVID Recovery Forecasts – Without Covid 19 Impact
7.6.3. Middle East and Africa Alternative Sweeteners Market Forecast by Product, 2020-2030 (US$ billion, AGR %)
7.6.4. Middle East and Africa Alternative Sweeteners Market Forecast by Application, 2020-2030 (US$ billion, AGR %)
7.6.5. Middle East and Africa Alternative Sweeteners Market Forecast by Distribution Channel, 2020-2030 (US$ billion, AGR%)
7.6.6. Middle East and Africa Alternative Sweeteners Market Forecast by Country, 2020-2030 (US$ billion, AGR%)
7.6.7. South Africa Alternative Sweeteners Market Forecast 2020-2030
7.6.8. Associations are working on developing domestic market by understanding future demand of alternative sweeteners
7.6.8.1. South Africa Alternative Sweeteners Market Segment: COVID Recovery Forecasts – V Recovery
7.6.8.2. South Africa Alternative Sweeteners Market Segment: COVID Recovery Forecasts – U Recovery
7.6.8.3. South Africa Alternative Sweeteners Market Segment: COVID Recovery Forecasts – W Recovery
7.6.8.4. South Africa Alternative Sweeteners Market Segment: COVID Recovery Forecasts – L Recovery
7.6.8.5. South Africa Alternative Sweeteners Market Segment: COVID Recovery Forecasts – Without Covid 19 impact
7.6.8.6. South Africa America Alternative Sweeteners Market Forecast by Product, 2020-2030 (US$ billion, AGR %)
7.6.8.7. South Africa Alternative Sweeteners Market Forecast by Application, 2020-2030 (US$ billion, AGR %)
7.6.8.8. South Africa Alternative Sweeteners Market Forecast by Distribution Channel, 2020-2030 (US$ billion, AGR%)
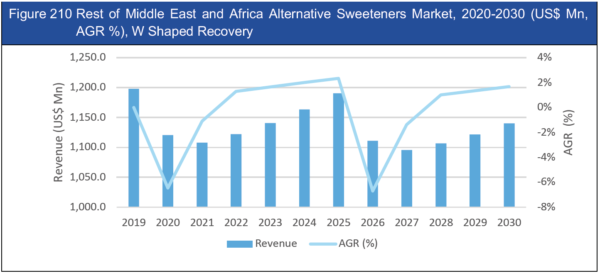
7.6.9. Rest of Middle East and Africa Alternative Sweeteners Market Forecast 2020-2030
7.6.10. Consumer Awareness About The Impacts Of Sugar Consumption will boost the market
7.6.10.1. Rest of Middle East and Africa Alternative Sweeteners Market Segment: COVID Recovery Forecasts – V Recovery
7.6.10.2. Rest of Middle East and Africa Alternative Sweeteners Market Segment: COVID Recovery Forecasts – U Recovery
7.6.10.3. Rest of Middle East and Africa Alternative Sweeteners Market Segment: COVID Recovery Forecasts – W Recovery
7.6.10.4. Rest of Middle East and Africa Alternative Sweeteners Market Segment: COVID Recovery Forecasts – L Recovery
7.6.10.5. Rest of Middle East and Africa Alternative Sweeteners Market Segment: COVID Recovery Forecasts – Without Covid 19 impact
7.6.10.6. Rest of Middle East and Africa Alternative Sweeteners Market Forecast by Product, 2020-2030 (US$ billion, AGR %)
7.6.10.7. Rest of Middle East and Africa Alternative Sweeteners Market Forecast by Application, 2020-2030 (US$ billion, AGR %)
7.6.10.8. Rest of Middle East and Africa Alternative Sweeteners Market Forecast by Distribution Channel, 2020-2030 (US$ billion, AGR%)
7.6.11.
8. Leading Companies in the Alternative Sweeteners Market
8.1. Leading 10 Alternative Sweeteners Company Sales Share Analysis 2019
8.2. Archer Daniels Midland Company
8.2.1. Archer Daniels Midland Company Total Company Sales 2015-2019
8.2.2. Archer Daniels Midland Company Net Income 2015-2019
8.2.3. Archer Daniels Midland Company Alternative Sweeteners Products / Service
8.2.4. Archer Daniels Midland Company Primary Market Competitors 2019
8.2.5. Archer Daniels Midland Company Mergers & Acquisitions (M&A) Activity
8.2.6. Archer Daniels Midland Company Alternative Sweeteners Analysis
8.2.7. Archer Daniels Midland Company Alternative Sweeteners Future Outlook
8.3. Cargill Incorporated
8.3.1. Cargill Incorporated Total Company Sales 2015-2019
8.3.2. Cargill Incorporated Net Income 2015-2019
8.3.3. Cargill Incorporated Alternative Sweeteners Products / Service
8.3.4. Cargill Incorporated Primary Market Competitors 2019
8.3.5. Cargill Incorporated Mergers & Acquisitions (M&A) Activity
8.3.6. Cargill Incorporated Alternative Sweeteners Analysis
8.3.7. Cargill Incorporated Alternative Sweeteners Future Outlook
8.4. Ajinomoto Co., Inc.
8.4.1. Ajinomoto Co., Inc. Total Company Sales 2015-2019
8.4.2. Ajinomoto Co., Inc. Net Income 2015-2019
8.4.3. Ajinomoto Co., Inc. Alternative Sweeteners Products / Service
8.4.4. Ajinomoto Co., Inc. Primary Market Competitors 2019
8.4.5. Ajinomoto Co., Inc. Mergers & Acquisitions (M&A) Activity
8.4.6. Ajinomoto Co., Inc. Alternative Sweeteners Analysis
8.4.7. Ajinomoto Co., Inc. Alternative Sweeteners Future Outlook
8.5. DuPont Nutrition & Health
8.5.1. DuPont Nutrition & Health Total Company Sales 2015-2019
8.5.2. DuPont Nutrition & Health Net Income 2015-2019
8.5.3. DuPont Nutrition & Health Alternative Sweeteners Products / Service
8.5.4. DuPont Nutrition & Health Primary Market Competitors 2019
8.5.5. DuPont Nutrition & Health Mergers & Acquisitions (M&A) Activity
8.5.6. DuPont Nutrition & Health Alternative Sweeteners Analysis
8.5.7. DuPont Nutrition & Health Alternative Sweeteners Future Outlook
8.6. Ingredion Incorporated
8.6.1. Ingredion Incorporated Total Company Sales 2015-2019
8.6.2. Ingredion Incorporated Net Income 2015-2019
8.6.3. Ingredion Incorporated Alternative Sweeteners Products / Service
8.6.4. Ingredion Incorporated Primary Market Competitors 2019
8.6.5. Ingredion Incorporated Mergers & Acquisitions (M&A) Activity
8.6.6. Ingredion Incorporated Alternative Sweeteners Analysis
8.6.7. Ingredion Incorporated Alternative Sweeteners Future Outlook
8.7. Tate & Lyle Plc.
8.7.1. Tate & Lyle Plc. Total Company Sales 2015-2019
8.7.2. Tate & Lyle Plc. Net Income 2015-2019
8.7.3. Tate & Lyle Plc. Alternative Sweeteners Products / Service
8.7.4. Tate & Lyle Plc. Primary Market Competitors 2019
8.7.5. Tate & Lyle Plc. Mergers & Acquisitions (M&A) Activity
8.7.6. Tate & Lyle Plc. Alternative Sweeteners Analysis
8.7.7. Tate & Lyle Plc. Alternative Sweeteners Future Outlook
8.8. Associated British Foods Plc.
8.8.1. Associated British Foods Plc. Total Company Sales 2015-2019
8.8.2. Associated British Foods Plc. Net Income 2015-2019
8.8.3. Associated British Foods Plc. Alternative Sweeteners Products / Service
8.8.4. Associated British Foods Plc. Primary Market Competitors 2019
8.8.5. Associated British Foods Plc. Mergers & Acquisitions (M&A) Activity
8.8.6. Associated British Foods Plc. Alternative Sweeteners Analysis
8.8.7. Associated British Foods Plc. Alternative Sweeteners Future Outlook
8.9. PureCircle Limited
8.9.1. PureCircle Limited Total Company Sales 2015-2019
8.9.2. PureCircle Limited Net Income 2015-2019
8.9.3. PureCircle Limited Alternative Sweeteners Products / Service
8.9.4. PureCircle Limited Primary Market Competitors 2019
8.9.5. PureCircle Limited Mergers & Acquisitions (M&A) Activity
8.9.6. PureCircle Limited Alternative Sweeteners Analysis
8.9.7. PureCircle Limited Alternative Sweeteners Future Outlook
8.10. GLG Life Tech Corporation
8.10.1. GLG Life Tech Corporation Total Company Sales 2015-2019
8.10.2. GLG Life Tech Corporation Net Income 2015-2019
8.10.3. GLG Life Tech Corporation Alternative Sweeteners Products / Service
8.10.4. GLG Life Tech Corporation Primary Market Competitors 2019
8.10.5. GLG Life Tech Corporation Mergers & Acquisitions (M&A) Activity
8.10.6. GLG Life Tech Corporation Alternative Sweeteners Analysis
8.10.7. GLG Life Tech Corporation Alternative Sweeteners Future Outlook
8.11. Naturex S.A.
8.11.1. Naturex S.A. Total Company Sales 2015-2019
8.11.2. Naturex S.A. Net Income 2015-2019
8.11.3. Naturex S.A. Alternative Sweeteners Products / Service
8.11.4. Naturex S.A. Primary Market Competitors 2019
8.11.5. Naturex S.A. Mergers & Acquisitions (M&A) Activity
8.11.6. Naturex S.A. Alternative Sweeteners Analysis
8.11.7. Naturex S.A. Alternative Sweeteners Future Outlook
9. Conclusions and Recommendations
9.1. Associated Visiongain Reports
9.2. Visiongain Report Sales Order Form
10. Appendix A
10.1. About Visiongain
11. Appendix B
11.1. Visiongain report evaluation form
LIST OF TABLES
Table 1 Global Alternative Sweeteners Market Snapshot, 2020 & 2030 (US$ Mn, CAGR %)
Table 2 Global Alternative Sweeteners Market Forecast by Product, 2020-2030 (US$ Mn, AGR %, CAGR %)
Table 3 Global Alternative Sweeteners Market CAGR Forecast by Product, (2020, 2025, 2030)
Table 4 High intensity sweeteners market forecast, V Shaped recovery, 2020-2030 (US$ Mn, AGR %,)
Table 5 High intensity sweeteners market forecast, U Shaped recovery, 2020-2030 (US$ Mn, AGR %,)
Table 6 High intensity sweeteners market forecast, L Shaped recovery, 2020-2030 (US$ Mn, AGR %,)
Table 7 High intensity sweeteners market forecast, W Shaped recovery, 2020-2030 (US$ Mn, AGR %,)
Table 8 High intensity sweeteners market forecast, Without Covid 19, 2020-2030 (US$ Mn, AGR %,)
Table 9 High fructose syrup market forecast, V Shaped recovery, 2020-2030 (US$ Mn, AGR %,)
Table 10 High fructose syrup market forecast, U Shaped recovery, 2020-2030 (US$ Mn, AGR %,)
Table 11 High fructose syrup market forecast, L Shaped recovery, 2020-2030 (US$ Mn, AGR %,)
Table 12 High fructose syrup market forecast, W Shaped recovery, 2020-2030 (US$ Mn, AGR %,)
Table 13 High fructose syrup market forecast, Without Covid impact, 2020-2030 (US$ Mn, AGR %,)
Table 14 Low intensity sweeteners market forecast, V Shaped recovery, 2020-2030 (US$ Mn, AGR %,)
Table 15 Low intensity sweeteners market forecast, U Shaped recovery, 2020-2030 (US$ Mn, AGR %,)
Table 16 Low intensity sweeteners market forecast, L Shaped recovery, 2020-2030 (US$ Mn, AGR %,)
Table 17 Low intensity sweeteners market forecast, W Shaped recovery, 2020-2030 (US$ Mn, AGR %,)
Table 18 Low intensity sweeteners market forecast, Without Covid 19, 2020-2030 (US$ Mn, AGR %,)
Table 19 Global Alternative Sweeteners Market Forecast by Application, 2020-2030 (US$ Mn, AGR %, CAGR %)
Table 20 Global Alternative Sweeteners Market CAGR Forecast by Application, (2020, 2025, 2030)
Table 21 Beverage application market forecast, L Shaped recovery, 2020-2030 (US$ Mn, AGR %,)
Table 22 Beverage application market forecast, U Shaped recovery, 2020-2030 (US$ Mn, AGR %,)
Table 23 Beverage application market forecast, L Shaped recovery, 2020-2030 (US$ Mn, AGR %,)
Table 24 Beverage application market forecast, W Shaped recovery, 2020-2030 (US$ Mn, AGR %,)
Table 25 Beverage application market forecast, without Covid 19 recovery, 2020-2030 (US$ Mn, AGR %,)
Table 26 Dairy & Frozen Desserts application market forecast, L Shaped recovery, 2020-2030 (US$ Mn, AGR %,)
Table 27 Dairy & Frozen Desserts application market forecast, U Shaped recovery, 2020-2030 (US$ Mn, AGR %,)
Table 28 Dairy & Frozen Desserts application market forecast, W Shaped recovery, 2020-2030 (US$ Mn, AGR %,)
Table 29 Dairy & Frozen Desserts application market forecast, W Shaped recovery, 2020-2030 (US$ Mn, AGR %,)
Table 30 Dairy & Frozen Desserts application market forecast, Without Covid 19 impact, 2020-2030 (US$ Mn, AGR %,)
Table 31 Bakery Goods application market forecast, L Shaped recovery, 2020-2030 (US$ Mn, AGR %,)
Table 32 Bakery Goods application market forecast, U Shaped recovery, 2020-2030 (US$ Mn, AGR %,)
Table 33 Bakery Goods application market forecast, L Shaped recovery, 2020-2030 (US$ Mn, AGR %,)
Table 34 Bakery Goods application market forecast, W Shaped recovery, 2020-2030 (US$ Mn, AGR %,)
Table 35 Bakery Goods application market forecast, Without Covid 19 impact, 2020-2030 (US$ Mn, AGR %,)
Table 36 Confectionery & Snacks application market forecast, L Shaped recovery, 2020-2030 (US$ Mn, AGR %,)
Table 37 Confectionery & Snacks application market forecast, U Shaped recovery, 2020-2030 (US$ Mn, AGR %,)
Table 38 Confectionery & Snacks application market forecast, L Shaped recovery, 2020-2030 (US$ Mn, AGR %,)
Table 39 Confectionery & Snacks application market forecast, W Shaped recovery, 2020-2030 (US$ Mn, AGR %,)
Table 40 Confectionery & Snacks application market forecast, Without Covid 19, 2020-2030 (US$ Mn, AGR %,)
Table 41 Pharmaceuticals & Nutraceuticals application market forecast, U Shaped recovery, 2020-2030 (US$ Mn, AGR %,)
Table 42 Pharmaceuticals & Nutraceuticals application market forecast, U Shaped recovery, 2020-2030 (US$ Mn, AGR %,)
Table 43 Pharmaceuticals & Nutraceuticals application market forecast, L Shaped recovery, 2020-2030 (US$ Mn, AGR %,)
Table 44 Pharmaceuticals & Nutraceuticals application market forecast, W Shaped recovery, 2020-2030 (US$ Mn, AGR %,)
Table 45 Pharmaceuticals & Nutraceuticals application market forecast, Without Covid 19 impact, 2020-2030 (US$ Mn, AGR %,)
Table 46 Other applications market forecast, U Shaped recovery, 2020-2030 (US$ Mn, AGR %,)
Table 47 Other applications market forecast, U Shaped recovery, 2020-2030 (US$ Mn, AGR %,)
Table 48 Other applications market forecast, L Shaped recovery, 2020-2030 (US$ Mn, AGR %,)
Table 49 Other applications market forecast, W Shaped recovery, 2020-2030 (US$ Mn, AGR %,)
Table 50 Other applications market forecast, without Covid 19 impact, 2020-2030 (US$ Mn, AGR %,)
Table 51 Global Alternative Sweeteners Market Forecast by Distribution Channel, 2020-2030 (US$ Mn, AGR %, CAGR %)
Table 52 Global Alternative Sweeteners Market CAGR Forecast by Distribution Channel, (2020, 2025, 2030)
Table 53 Online Distribution Channel market forecast, V Shaped recovery, 2020-2030 (US$ Mn, AGR %,)
Table 54 Online Distribution Channel market forecast, U Shaped recovery, 2020-2030 (US$ Mn, AGR %,)
Table 55 Online Distribution Channel market forecast, L Shaped recovery, 2020-2030 (US$ Mn, AGR %,)
Table 56 Online Distribution Channel market forecast, W Shaped recovery, 2020-2030 (US$ Mn, AGR %,)
Table 57 Offline Distribution Channel market forecast, L Shaped recovery, 2020-2030 (US$ Mn, AGR %,)
Table 58 Offline Distribution Channel market forecast, U Shaped recovery, 2020-2030 (US$ Mn, AGR %,)
Table 59 Offline Distribution Channel market forecast, L Shaped recovery, 2020-2030 (US$ Mn, AGR %,)
Table 60 Offline Distribution Channel market forecast, W Shaped recovery, 2020-2030 (US$ Mn, AGR %,)
Table 61 Offline Distribution Channel market forecast, Without Covid 19 impact, 2020-2030 (US$ Mn, AGR %,)
Table 62 Global Alternative Sweeteners Market Forecast by Region, 2020-2030 (US$ Mn, AGR %)
Table 63 Global Alternative Sweeteners Market CAGR Forecast by Region, (2020, 2025, 2030)
Table 64 North America Alternative Sweeteners market forecast, V Shaped recovery, 2020-2030 (US$ Mn, AGR %,)
Table 65 North America Alternative Sweeteners market forecast, U Shaped recovery, 2020-2030 (US$ Mn, AGR %,)
Table 66 North America Alternative Sweeteners market forecast, L Shaped recovery, 2020-2030 (US$ Mn, AGR %,)
Table 67 North America Alternative Sweeteners market forecast, W Shaped recovery, 2020-2030 (US$ Mn, AGR %,)
Table 68 North America Alternative Sweeteners market forecast, Without Covid 19 impact, 2020-2030 (US$ Mn, AGR %,)
Table 69 North America Alternative Sweeteners Market Forecast by Product, 2020-2030 (US$ Mn, AGR %, CAGR %)
Table 70 North America Alternative Sweeteners Market CAGR by Product, (2020, 2025, 2030)
Table 71 North America Alternative Sweeteners Market Forecast by Application, 2020-2030 (US$ Mn, AGR %, CAGR %)
Table 72 North America Alternative Sweeteners Market CAGR by Application, (2020, 2025, 2030)
Table 73 North America Alternative Sweeteners Market Forecast by Distribution Channel, 2020-2030 (US$ Mn, AGR %, CAGR %)
Table 74 North America Alternative Sweeteners Market CAGR by Distribution Channel, (2020, 2025, 2030)
Table 75 North America Alternative Sweeteners Market Forecast by Country, 2020-2030 (US$ Mn, AGR %, CAGR %)
Table 76 North America Alternative Sweeteners Market CAGR by Country, (2020, 2025, 2030)
Table 77 U.S. Alternative Sweeteners market forecast, V Shaped recovery, 2020-2030 (US$ Mn, AGR %,)
Table 78 U.S. Alternative Sweeteners market forecast, U Shaped recovery, 2020-2030 (US$ Mn, AGR %,)
Table 79 U.S. Alternative Sweeteners market forecast, L Shaped recovery, 2020-2030 (US$ Mn, AGR %,)
Table 80 U.S. Alternative Sweeteners market forecast, W Shaped recovery, 2020-2030 (US$ Mn, AGR %,)
Table 81 U.S. Alternative Sweeteners market forecast, Without Covid 19 impact, 2020-2030 (US$ Mn, AGR %,)
Table 82 U.S. Alternative Sweeteners Market Forecast by Product, 2020-2030 (US$ Mn, AGR %, CAGR %)
Table 83 U.S. Alternative Sweeteners Market Forecast by Application, 2020-2030 (US$ Mn, AGR %, CAGR %)
Table 84 U.S. Alternative Sweeteners Market CAGR by Application, (2020, 2025, 2030)
Table 85 U.S. Alternative Sweeteners Market Forecast by Distribution Channel, 2020-2030 (US$ Mn, AGR %, CAGR %)
Table 86 U.S. Alternative Sweeteners Market CAGR by Distribution Channel, (2020, 2025, 2030)
Table 87 Rest of North America Alternative Sweeteners market forecast, V Shaped recovery, 2020-2030 (US$ Mn, AGR %,)
Table 88 Rest of North America Alternative Sweeteners market forecast, U Shaped recovery, 2020-2030 (US$ Mn, AGR %,)
Table 89 Rest of North America Alternative Sweeteners market forecast, L Shaped recovery, 2020-2030 (US$ Mn, AGR %,)
Table 90 Rest of North America Alternative Sweeteners market forecast, W Shaped recovery, 2020-2030 (US$ Mn, AGR %,)
Table 91 Rest of North America Alternative Sweeteners market forecast, without Covid 19 impact, 2020-2030 (US$ Mn, AGR %,)
Table 92 Rest of North America Alternative Sweeteners Market Forecast by Product, 2020-2030 (US$ Mn, AGR %, CAGR %)
Table 93 Rest of North America Alternative Sweeteners Market CAGR by Product, (2020, 2025, 2030)
Table 94 Rest of North America Alternative Sweeteners Market Forecast by Application, 2020-2030 (US$ Mn, AGR %, CAGR %)
Table 95 Rest of North America Alternative Sweeteners Market CAGR by Application, (2020, 2025, 2030)
Table 96 Rest of North America Alternative Sweeteners Market Forecast by Distribution Channel, 2020-2030 (US$ Mn, AGR %, CAGR %)
Table 97 Rest of North America Alternative Sweeteners Market CAGR by Distribution Channel, (2020, 2025, 2030)
Table 98 Europe Alternative Sweeteners market forecast, V Shaped recovery, 2020-2030 (US$ Mn, AGR %,)
Table 99 Europe Alternative Sweeteners market forecast, U Shaped recovery, 2020-2030 (US$ Mn, AGR %,)
Table 100 Europe Alternative Sweeteners market forecast, L Shaped recovery, 2020-2030 (US$ Mn, AGR %,)
Table 101 Europe Alternative Sweeteners market forecast, W Shaped recovery, 2020-2030 (US$ Mn, AGR %,)
Table 102 Europe Alternative Sweeteners market forecast, Without Covid 19, 2020-2030 (US$ Mn, AGR %,)
Table 103 Europe Alternative Sweeteners Market Forecast by Product, 2020-2030 (US$ Mn, AGR %, CAGR %)
Table 104 Europe Alternative Sweeteners Market CAGR by Product, (2020, 2025, 2030)
Table 105 Europe Alternative Sweeteners Market Forecast by Application, 2020-2030 (US$ Mn, AGR %, CAGR %)
Table 106 Europe Alternative Sweeteners Market CAGR by Application, (2020, 2025, 2030)
Table 107 Europe Alternative Sweeteners Market Forecast by Distribution Channel, 2020-2030 (US$ Mn, AGR %, CAGR %)
Table 108 Europe Alternative Sweeteners Market CAGR by Distribution Channel, (2020, 2025, 2030)
Table 109 Europe Alternative Sweeteners Market Forecast by Country, 2020-2030 (US$ Mn, AGR %, CAGR %)
Table 110 Europe Alternative Sweeteners Market CAGR by Country, (2020, 2025, 2030)
Table 111 Germany Alternative Sweeteners market forecast, V Shaped recovery, 2020-2030 (US$ Mn, AGR %,)
Table 112 Germany Alternative Sweeteners market forecast, U Shaped recovery, 2020-2030 (US$ Mn, AGR %,)
Table 113 Germany Alternative Sweeteners market forecast, L Shaped recovery, 2020-2030 (US$ Mn, AGR %,)
Table 114 Germany Alternative Sweeteners market forecast, W Shaped recovery, 2020-2030 (US$ Mn, AGR %,)
Table 115 Germany Alternative Sweeteners market forecast, Without Covid 19 impact, 2020-2030 (US$ Mn, AGR %,)
Table 116 Germany Alternative Sweeteners Market Forecast by Product, 2020-2030 (US$ Mn, AGR %, CAGR %)
Table 117 Germany Alternative Sweeteners Market CAGR by Product, (2020, 2025, 2030)
Table 118 Germany Alternative Sweeteners Market Forecast by Application, 2020-2030 (US$ Mn, AGR %, CAGR %)
Table 119 Germany Alternative Sweeteners Market CAGR by Application, (2020, 2025, 2030)
Table 120 Germany Alternative Sweeteners Market Forecast by Distribution Channel, 2020-2030 (US$ Mn, AGR %, CAGR %)
Table 121 Germany Alternative Sweeteners Market CAGR by Distribution Channel, (2020, 2025, 2030)
Table 122 U.K. Alternative Sweeteners market forecast, V Shaped recovery, 2020-2030 (US$ Mn, AGR %,)
Table 123 U.K. Alternative Sweeteners market forecast, U Shaped recovery, 2020-2030 (US$ Mn, AGR %,)
Table 124 U.K. Alternative Sweeteners market forecast, L Shaped recovery, 2020-2030 (US$ Mn, AGR %,)
Table 125 U.K. Alternative Sweeteners market forecast, W Shaped recovery, 2020-2030 (US$ Mn, AGR %,)
Table 126 U.K. Alternative Sweeteners market forecast, Without Covid 19 impact, 2020-2030 (US$ Mn, AGR %,)
Table 127 U.K. Alternative Sweeteners Market Forecast by Product, 2020-2030 (US$ Mn, AGR %, CAGR %)
Table 128 U.K. Alternative Sweeteners Market CAGR by Product, (2020, 2025, 2030)
Table 129 U.K. Alternative Sweeteners Market Forecast by Application, 2020-2030 (US$ Mn, AGR %, CAGR %)
Table 130 U.K. Alternative Sweeteners Market CAGR by Application, (2020, 2025, 2030)
Table 131 U.K. Alternative Sweeteners Market Forecast by Distribution Channel, 2020-2030 (US$ Mn, AGR %, CAGR %)
Table 132 U.K. Alternative Sweeteners Market CAGR by Distribution Channel, (2020, 2025, 2030)
Table 133 France Alternative Sweeteners market forecast, U Shaped recovery, 2020-2030 (US$ Mn, AGR %,)
Table 134 France Alternative Sweeteners market forecast, U Shaped recovery, 2020-2030 (US$ Mn, AGR %,)
Table 135 France Alternative Sweeteners market forecast, L Shaped recovery, 2020-2030 (US$ Mn, AGR %,)
Table 136 France Alternative Sweeteners market forecast, W Shaped recovery, 2020-2030 (US$ Mn, AGR %,)
Table 137 France Alternative Sweeteners market forecast, Without Covid 19 impact, 2020-2030 (US$ Mn, AGR %,)
Table 138 France Alternative Sweeteners Market Forecast by Product, 2020-2030 (US$ Mn, AGR %, CAGR %)
Table 139 France Alternative Sweeteners Market CAGR by Product, (2020, 2025, 2030)
Table 140 France Alternative Sweeteners Market Forecast by Application, 2020-2030 (US$ Mn, AGR %, CAGR %)
Table 141 France Alternative Sweeteners Market CAGR by Application, (2020, 2025, 2030)
Table 142 France Alternative Sweeteners Market Forecast by Distribution Channel, 2020-2030 (US$ Mn, AGR %, CAGR %)
Table 143 France Alternative Sweeteners Market CAGR by Distribution Channel, (2020, 2025, 2030)
Table 144 Rest of Europe Alternative Sweeteners market forecast, V Shaped recovery, 2020-2030 (US$ Mn, AGR %,)
Table 145 Rest of Europe Alternative Sweeteners market forecast, U Shaped recovery, 2020-2030 (US$ Mn, AGR %,)
Table 146 Rest of Europe Alternative Sweeteners market forecast, L Shaped recovery, 2020-2030 (US$ Mn, AGR %,)
Table 147 Rest of Europe Alternative Sweeteners market forecast, W Shaped recovery, 2020-2030 (US$ Mn, AGR %,)
Table 148 Rest of Europe Alternative Sweeteners market forecast, Without Covid 19 impact, 2020-2030 (US$ Mn, AGR %,)
Table 149 Rest of Europe Alternative Sweeteners Market Forecast by Product, 2020-2030 (US$ Mn, AGR %, CAGR %)
Table 150 Rest of Europe Alternative Sweeteners Market CAGR by Product, (2020, 2025, 2030)
Table 151 Rest of Europe Alternative Sweeteners Market Forecast by Application, 2020-2030 (US$ Mn, AGR %, CAGR %)
Table 152 Rest of Europe Alternative Sweeteners Market CAGR by Application, (2020, 2025, 2030)
Table 153 Rest of Europe Alternative Sweeteners Market Forecast by Distribution Channel, 2020-2030 (US$ Mn, AGR %, CAGR %)
Table 154 Rest of Europe Alternative Sweeteners Market CAGR by Distribution Channel, (2020, 2025, 2030)
Table 155 Asia Pacific Alternative Sweeteners market forecast, V Shaped recovery, 2020-2030 (US$ Mn, AGR %,)
Table 156 Asia Pacific Alternative Sweeteners market forecast, U Shaped recovery, 2020-2030 (US$ Mn, AGR %,)
Table 157 Asia Pacific Alternative Sweeteners market forecast, L Shaped recovery, 2020-2030 (US$ Mn, AGR %,)
Table 158 Asia Pacific Alternative Sweeteners market forecast, W Shaped recovery, 2020-2030 (US$ Mn, AGR %,)
Table 159 Asia Pacific Alternative Sweeteners market forecast, Without Covid 19 impact, 2020-2030 (US$ Mn, AGR %,)
Table 160 Asia Pacific Alternative Sweeteners Market Forecast by Product, 2020-2030 (US$ Mn, AGR %, CAGR %)
Table 161 Asia Pacific Alternative Sweeteners Market CAGR by Product, (2020, 2025, 2030)
Table 162 Asia Pacific Alternative Sweeteners Market Forecast by Application, 2020-2030 (US$ Mn, AGR %, CAGR %)
Table 163 Asia Pacific Alternative Sweeteners Market CAGR by Application, (2020, 2025, 2030)
Table 164 Asia Pacific Alternative Sweeteners Market Forecast by Distribution Channel, 2020-2030 (US$ Mn, AGR %, CAGR %)
Table 165 Asia Pacific Alternative Sweeteners Market CAGR by Distribution Channel, (2020, 2025, 2030)
Table 166 Asia Pacific Alternative Sweeteners Market Forecast by Country, 2020-2030 (US$ Mn, AGR %, CAGR %)
Table 167 Asia Pacific Alternative Sweeteners Market CAGR by Country, (2020, 2025, 2030)
Table 168 China Alternative Sweeteners market forecast, V Shaped recovery, 2020-2030 (US$ Mn, AGR %,)
Table 169 China Alternative Sweeteners market forecast, U Shaped recovery, 2020-2030 (US$ Mn, AGR %,)
Table 170 China Alternative Sweeteners market forecast, L Shaped recovery, 2020-2030 (US$ Mn, AGR %,)
Table 171 China Alternative Sweeteners market forecast, W Shaped recovery, 2020-2030 (US$ Mn, AGR %,)
Table 172 China Alternative Sweeteners market forecast, Without Covid 19 impact, 2020-2030 (US$ Mn, AGR %,)
Table 173 China Alternative Sweeteners Market Forecast by Product, 2020-2030 (US$ Mn, AGR %, CAGR %)
Table 174 China Alternative Sweeteners Market CAGR by Product, (2020, 2025, 2030)
Table 175 China Alternative Sweeteners Market Forecast by Application, 2020-2030 (US$ Mn, AGR %, CAGR %)
Table 176 China Alternative Sweeteners Market CAGR by Application, (2020, 2025, 2030)
Table 177 China Alternative Sweeteners Market Forecast by Distribution Channel, 2020-2030 (US$ Mn, AGR %, CAGR %)
Table 178 China Alternative Sweeteners Market CAGR by Distribution Channel, (2020, 2025, 2030)
Table 179 Japan Alternative Sweeteners market forecast, V Shaped recovery, 2020-2030 (US$ Mn, AGR %,)
Table 180 Japan Alternative Sweeteners market forecast, U Shaped recovery, 2020-2030 (US$ Mn, AGR %,)
Table 181 Japan Alternative Sweeteners market forecast, L Shaped recovery, 2020-2030 (US$ Mn, AGR %,)
Table 182 Japan Alternative Sweeteners market forecast, W Shaped recovery, 2020-2030 (US$ Mn, AGR %,)
Table 183 Japan Alternative Sweeteners market forecast, Without Covid 19 impact, 2020-2030 (US$ Mn, AGR %,)
Table 184 Japan Alternative Sweeteners Market Forecast by Product, 2020-2030 (US$ Mn, AGR %, CAGR %)
Table 185 Japan Alternative Sweeteners Market CAGR by Product, (2020, 2025, 2030)
Table 186 Japan Alternative Sweeteners Market Forecast by Application, 2020-2030 (US$ Mn, AGR %, CAGR %)
Table 187 Japan Alternative Sweeteners Market CAGR by Application, (2020, 2025, 2030)
Table 188 Japan Alternative Sweeteners Market Forecast by Distribution Channel, 2020-2030 (US$ Mn, AGR %, CAGR %)
Table 189 Japan Alternative Sweeteners Market CAGR by Distribution Channel, (2020, 2025, 2030)
Table 190 India Alternative Sweeteners market forecast, V Shaped recovery, 2020-2030 (US$ Mn, AGR %,)
Table 191 India Alternative Sweeteners market forecast, U Shaped recovery, 2020-2030 (US$ Mn, AGR %,)
Table 192 India Alternative Sweeteners market forecast, L Shaped recovery, 2020-2030 (US$ Mn, AGR %,)
Table 193 India Alternative Sweeteners market forecast, W Shaped recovery, 2020-2030 (US$ Mn, AGR %,)
Table 194 India Alternative Sweeteners market forecast, Without Covid 19 impact, 2020-2030 (US$ Mn, AGR %,)
Table 195 India Alternative Sweeteners Market Forecast by Product, 2020-2030 (US$ Mn, AGR %, CAGR %)
Table 196 India Alternative Sweeteners Market CAGR by Product, (2020, 2025, 2030)
Table 197 India Alternative Sweeteners Market Forecast by Application, 2020-2030 (US$ Mn, AGR %, CAGR %)
Table 198 India Alternative Sweeteners Market CAGR by Application, (2020, 2025, 2030)
Table 199 India Alternative Sweeteners Market Forecast by Distribution Channel, 2020-2030 (US$ Mn, AGR %, CAGR %)
Table 200 India Alternative Sweeteners Market CAGR by Distribution Channel, (2020, 2025, 2030)
Table 201 Rest of Asia Pacific Alternative Sweeteners market forecast, V Shaped recovery, 2020-2030 (US$ Mn, AGR %,)
Table 202 Rest of Asia Pacific Alternative Sweeteners market forecast, U Shaped recovery, 2020-2030 (US$ Mn, AGR %,)
Table 203 Rest of Asia Pacific Alternative Sweeteners market forecast, L Shaped recovery, 2020-2030 (US$ Mn, AGR %,)
Table 204 Rest of Asia Pacific Alternative Sweeteners market forecast, W Shaped recovery, 2020-2030 (US$ Mn, AGR %,)
Table 205 Rest of Asia Pacific Alternative Sweeteners market forecast, Without Covid 19 impact, 2020-2030 (US$ Mn, AGR %,)
Table 206 Rest of Asia Pacific Alternative Sweeteners Market Forecast by Product, 2020-2030 (US$ Mn, AGR %, CAGR %)
Table 207 Rest of Asia Pacific Alternative Sweeteners Market CAGR by Product, (2020, 2025, 2030)
Table 208 Rest of Asia Pacific Alternative Sweeteners Market Forecast by Application, 2020-2030 (US$ Mn, AGR %, CAGR %)
Table 209 Rest of Asia Pacific Alternative Sweeteners Market CAGR by Application, (2020, 2025, 2030)
Table 210 Rest of Asia Pacific Alternative Sweeteners Market Forecast by Distribution Channel, 2020-2030 (US$ Mn, AGR %, CAGR %)
Table 211 Rest of Asia Pacific Alternative Sweeteners Market CAGR by Distribution Channel, (2020, 2025, 2030)
Table 212 Latin America Alternative Sweeteners market forecast, V Shaped recovery, 2020-2030 (US$ Mn, AGR %,)
Table 213 Latin America Alternative Sweeteners market forecast, U Shaped recovery, 2020-2030 (US$ Mn, AGR %,)
Table 214 Latin America Alternative Sweeteners market forecast, L Shaped recovery, 2020-2030 (US$ Mn, AGR %,)
Table 215 Latin America Alternative Sweeteners market forecast, W Shaped recovery, 2020-2030 (US$ Mn, AGR %,)
Table 216 Latin America Alternative Sweeteners market forecast, Without Covid 19 impact, 2020-2030 (US$ Mn, AGR %,)
Table 217 Latin America Alternative Sweeteners Market Forecast by Product, 2020-2030 (US$ Mn, AGR %, CAGR %)
Table 218 Latin America Alternative Sweeteners Market CAGR by Product, (2020, 2025, 2030)
Table 219 Latin America Alternative Sweeteners Market Forecast by Application, 2020-2030 (US$ Mn, AGR %, CAGR %)
Table 220 Latin America Alternative Sweeteners Market CAGR by Application, (2020, 2025, 2030)
Table 221 Latin America Alternative Sweeteners Market Forecast by Distribution Channel, 2020-2030 (US$ Mn, AGR %, CAGR %)
Table 222 Latin America Alternative Sweeteners Market CAGR by Distribution Channel, (2020, 2025, 2030)
Table 223 Latin America Alternative Sweeteners Market Forecast by Country, 2020-2030 (US$ Mn, AGR %, CAGR %)
Table 224 Latin America Alternative Sweeteners Market CAGR by Country, (2020, 2025, 2030)
Table 225 Brazil Alternative Sweeteners market forecast, V Shaped recovery, 2020-2030 (US$ Mn, AGR %,)
Table 226 Brazil Alternative Sweeteners market forecast, U Shaped recovery, 2020-2030 (US$ Mn, AGR %,)
Table 227 Brazil Alternative Sweeteners market forecast, L Shaped recovery, 2020-2030 (US$ Mn, AGR %,)
Table 228 Brazil Alternative Sweeteners market forecast, W Shaped recovery, 2020-2030 (US$ Mn, AGR %,)
Table 229 Brazil Alternative Sweeteners market forecast, Without Covid 19 impact, 2020-2030 (US$ Mn, AGR %,)
Table 230 Brazil Alternative Sweeteners Market Forecast by Product, 2020-2030 (US$ Mn, AGR %, CAGR %)
Table 231 Brazil Alternative Sweeteners Market CAGR by Product, (2020, 2025, 2030)
Table 232 Brazil Alternative Sweeteners Market Forecast by Application, 2020-2030 (US$ Mn, AGR %, CAGR %)
Table 233 Brazil Alternative Sweeteners Market CAGR by Application, (2020, 2025, 2030)
Table 234 Brazil Alternative Sweeteners Market Forecast by Distribution Channel, 2020-2030 (US$ Mn, AGR %, CAGR %)
Table 235 Brazil Alternative Sweeteners Market CAGR by Distribution Channel, (2020, 2025, 2030)
Table 236 Rest of Latin America Alternative Sweeteners market forecast, U Shaped recovery, 2020-2030 (US$ Mn, AGR %,)
Table 237 Rest of Latin America Alternative Sweeteners market forecast, U Shaped recovery, 2020-2030 (US$ Mn, AGR %,)
Table 238 Rest of Latin America Alternative Sweeteners market forecast, L Shaped recovery, 2020-2030 (US$ Mn, AGR %,)
Table 239 Rest of Latin America Alternative Sweeteners market forecast, W Shaped recovery, 2020-2030 (US$ Mn, AGR %,)
Table 240 Rest of Latin America Alternative Sweeteners market forecast, Without Covid 19 impact, 2020-2030 (US$ Mn, AGR %,)
Table 241 Rest of Latin America Alternative Sweeteners Market Forecast by Product, 2020-2030 (US$ Mn, AGR %, CAGR %)
Table 242 Rest of Latin America Alternative Sweeteners Market CAGR by Product, (2020, 2025, 2030)
Table 243 Rest of Latin America Alternative Sweeteners Market Forecast by Application, 2020-2030 (US$ Mn, AGR %, CAGR %)
Table 244 Rest of Latin America Alternative Sweeteners Market CAGR by Application, (2020, 2025, 2030)
Table 245 Rest of Latin America Alternative Sweeteners Market Forecast by Distribution Channel, 2020-2030 (US$ Mn, AGR %, CAGR %)
Table 246 Rest of Latin America Alternative Sweeteners Market CAGR by Distribution Channel, (2020, 2025, 2030)
Table 247 Middle East and Africa Alternative Sweeteners market forecast, V Shaped recovery, 2020-2030 (US$ Mn, AGR %,)
Table 248 Middle East and Africa Alternative Sweeteners market forecast, U Shaped recovery, 2020-2030 (US$ Mn, AGR %,)
Table 249 Middle East and Africa Alternative Sweeteners market forecast, L Shaped recovery, 2020-2030 (US$ Mn, AGR %,)
Table 250 Middle East and Africa Alternative Sweeteners market forecast, W Shaped recovery, 2020-2030 (US$ Mn, AGR %,)
Table 251 Middle East and Africa Alternative Sweeteners market forecast, Without Covid 19 impact Shaped recovery, 2020-2030 (US$ Mn, AGR %,)
Table 252 Middle East and Africa Alternative Sweeteners Market Forecast by Product, 2020-2030 (US$ Mn, AGR %, CAGR %)
Table 253 Middle East and Africa Alternative Sweeteners Market CAGR by Product, (2020, 2025, 2030)
Table 254 Middle East and Africa Alternative Sweeteners Market Forecast by Application, 2020-2030 (US$ Mn, AGR %, CAGR %)
Table 255 Middle East and Africa Alternative Sweeteners Market CAGR by Application, (2020, 2025, 2030)
Table 256 Middle East and Africa Alternative Sweeteners Market Forecast by Distribution Channel, 2020-2030 (US$ Mn, AGR %, CAGR %)
Table 257 Middle East and Africa Alternative Sweeteners Market CAGR by Distribution Channel, (2020, 2025, 2030)
Table 258 Middle East and Africa Alternative Sweeteners Market Forecast by Country, 2020-2030 (US$ Mn, AGR %, CAGR %)
Table 259 Middle East and Africa Alternative Sweeteners Market CAGR by Country, (2020, 2025, 2030)
Table 260 South Africa Alternative Sweeteners market forecast, V Shaped recovery, 2020-2030 (US$ Mn, AGR %,)
Table 261 South Africa Alternative Sweeteners market forecast, U Shaped recovery, 2020-2030 (US$ Mn, AGR %,)
Table 262 South Africa Alternative Sweeteners market forecast, L Shaped recovery, 2020-2030 (US$ Mn, AGR %,)
Table 263 South Africa Alternative Sweeteners market forecast, W Shaped recovery, 2020-2030 (US$ Mn, AGR %,)
Table 264 South Africa Alternative Sweeteners market forecast, Without Covid 19 impact, 2020-2030 (US$ Mn, AGR %,)
Table 265 South Africa Alternative Sweeteners Market CAGR by Product, (2020, 2025, 2030)
Table 266 South Africa Alternative Sweeteners Market Forecast by Application, 2020-2030 (US$ Mn, AGR %, CAGR %)
Table 267 South Africa Alternative Sweeteners Market CAGR by Application, (2020, 2025, 2030)
Table 268 South Africa Alternative Sweeteners Market Forecast by Distribution Channel, 2020-2030 (US$ Mn, AGR %, CAGR %)
Table 269 South Africa Alternative Sweeteners Market CAGR by Distribution Channel, (2020, 2025, 2030)
Table 270 Rest of Middle East and Africa Alternative Sweeteners market forecast, V Shaped recovery, 2020-2030 (US$ Mn, AGR %,)
Table 271 Rest of Middle East and Africa Alternative Sweeteners market forecast, U Shaped recovery, 2020-2030 (US$ Mn, AGR %,)
Table 272 Rest of Middle East and Africa Alternative Sweeteners market forecast, L Shaped recovery, 2020-2030 (US$ Mn, AGR %,)
Table 273 Rest of Middle East and Africa Alternative Sweeteners market forecast, W Shaped recovery, 2020-2030 (US$ Mn, AGR %,)
Table 274 Rest of Middle East and Africa Alternative Sweeteners market forecast, Without Covid 19 impact, 2020-2030 (US$ Mn, AGR %,)
Table 275 Rest of Middle East and Africa Alternative Sweeteners Market Forecast by Product, 2020-2030 (US$ Mn, AGR %, CAGR %)
Table 276 Rest of Middle East and Africa Alternative Sweeteners Market CAGR by Product, (2020, 2025, 2030)
Table 277 Rest of Middle East and Africa Alternative Sweeteners Market Forecast by Application, 2020-2030 (US$ Mn, AGR %, CAGR %)
Table 278 Rest of Middle East and Africa Alternative Sweeteners Market CAGR by Application, (2020, 2025, 2030)
Table 279 Rest of Middle East and Africa Alternative Sweeteners Market Forecast by Distribution Channel, 2020-2030 (US$ Mn, AGR %, CAGR %)
Table 280 Rest of Middle East and Africa Alternative Sweeteners Market CAGR by Distribution Channel, (2020, 2025, 2030)
Table 281 Leading 10 Alternative Sweeteners Companies Sales Share 2019 (Ranking, Company, FY2019 Total Company Sales US$ Mn)
Table 282 AJINOMOTO CO., INC. Profile 2019
Table 283 AJINOMOTO CO., INC. Total Company Sales 2015-2019 (US$ Mn, AGR %)
Table 284 AJINOMOTO CO., INC. Net Income 2015-2019 (US$ Mn, AGR %)
Table 285 AJINOMOTO CO., INC. Working Capital 2015-2019 (US$ Mn, AGR %)
Table 286 AJINOMOTO CO., INC. Revenue By Business Segment, 2019 (US$ Mn, AGR %)
Table 287 AJINOMOTO CO., INC. Alternative Sweeteners Products / Services (Segment of Business, Product, Specification / Features)
Table 288 AJINOMOTO CO., INC. Alternative Sweeteners Mergers and Acquisitions, 2019 (Date, Company Involved, Value US$ Mn, Details)
Table 289 Archer Daniels Midland Company Profile 2019
Table 290 Archer Daniels Midland Company Total Company Sales 2015-2019 (US$ Mn, AGR %)
Table 291 Archer Daniels Midland Company Net Income 2015-2019 (US$ Mn, AGR %)
Table 292 Archer Daniels Midland Company Working Capital 2015-2019 (US$ Mn, AGR %)
Table 293 Archer Daniels Midland Company Revenue By Business Segment, 2019 (US$ Mn, AGR %)
Table 294 Archer Daniels Midland Company Revenue By Geography, 2019 (US$ Mn, AGR %)
Table 295 Archer Daniels Midland Company Alternative Sweeteners Products / Services (Segment of Business, Product, Specification / Features)
Table 296 Archer Daniels Midland Company Alternative Sweeteners Mergers and Acquisitions, 2019 (Date, Company Involved, Value US$ Mn, Details)
Table 297 Cargill Incorporated Profile 2019
Table 298 Cargill Incorporated Total Company Sales 2015-2019 (US$ Mn, AGR %)
Table 299 Cargill Incorporated Net Income 2015-2019 (US$ Mn, AGR %)
Table 300 Cargill Incorporated Total Assets 2015-2019 (US$ Mn, AGR %)
Table 301 Cargill Incorporated Revenue By Geography, 2019 (US$ Mn, AGR %)
Table 302 Cargill Incorporated Alternative Sweeteners Products / Services (Segment of Business, Product, Specification / Features)
Table 303 Cargill Incorporated Alternative Sweeteners Mergers and Acquisitions, 2019 (Date, Company Involved, Value US$ Mn, Details)
Table 304 DuPont Nutrition & Health Profile 2019
Table 305 DuPont Nutrition & Health Total Company Sales 2015-2019 (US$ Mn, AGR %)
Table 306 DuPont Nutrition & Health Net Income 2015-2019 (US$ Mn, AGR %)
Table 307 DuPont Nutrition & Health Working Capital 2015-2019 (US$ Mn, AGR %)
Table 308 DuPont Nutrition & Health Alternative Sweeteners Products / Services (Segment of Business, Product, Specification / Features)
Table 309 DuPont Nutrition & Health Alternative Sweeteners Mergers and Acquisitions, 2019 (Date, Company Involved, Value US$ Mn, Details)
Table 310 GLG Life Tech Corporation Profile 2019
Table 311 GLG Life Tech Corporation Total Company Sales 2015-2019 (US$ Mn, AGR %)
Table 312 GLG Life Tech Corporation Net Income 2015-2019 (US$ Mn, AGR %)
Table 313 GLG Life Tech Corporation Working Capital 2015-2019 (US$ Mn, AGR %)
Table 314 GLG Life Tech Corporation Alternative Sweeteners Products / Services (Segment of Business, Product, Specification / Features)
Table 315 GLG Life Tech Corporation Alternative Sweeteners Mergers and Acquisitions, 2019 (Date, Company Involved, Value US$ Mn, Details)
Table 316 Ingredion Incorporated Profile 2019
Table 317 Ingredion Incorporated Total Company Sales 2015-2019 (US$ Mn, AGR %)
Table 318 Ingredion Incorporated Net Income 2015-2019 (US$ Mn, AGR %)
Table 319 Ingredion Incorporated Working Capital 2015-2019 (US$ Mn, AGR %)
Table 320 Ingredion Incorporated Revenue By Business Segment, 2019 (US$ Mn, AGR %)
Table 321 Ingredion Incorporated Revenue By Geography, 2019 (US$ Mn, AGR %)
Table 322 Ingredion Incorporated Alternative Sweeteners Products / Services (Segment of Business, Product, Specification / Features)
Table 323 Ingredion Incorporated Alternative Sweeteners Mergers and Acquisitions, 2019 (Date, Company Involved, Value US$ Mn, Details)
Table 324 Naturex S.A. Profile 2019
Table 325 Naturex S.A. Alternative Sweeteners Products / Services (Segment of Business, Product, Specification / Features)
Table 326 Naturex S.A. Alternative Sweeteners Mergers and Acquisitions, 2019 (Date, Company Involved, Value US$ Mn, Details)
Table 327 Tate & Lyle Plc. Profile 2019
Table 328 Tate & Lyle Plc. Total Company Sales 2015-2019 (US$ Mn, AGR %)
Table 329 Tate & Lyle Plc. Net Income 2015-2019 (US$ Mn, AGR %)
Table 330 Tate & Lyle Plc. Working Capital 2015-2019 (US$ Mn, AGR %)
Table 331 Tate & Lyle Plc. Revenue By Business Segment, 2019 (US$ Mn, AGR %)
Table 332 Tate & Lyle Plc. Revenue By Geography, 2019 (US$ Mn, AGR %)
Table 333 Tate & Lyle Plc. Alternative Sweeteners Products / Services (Segment of Business, Product, Specification / Features)
Table 334 Tate & Lyle Plc. Alternative Sweeteners Mergers and Acquisitions, 2019 (Date, Company Involved, Value US$ Mn, Details)
Table 335 PureCircle Limited Profile 2019
Table 336 PureCircle Limited Total Company Sales 2015-2019 (US$ Mn, AGR %)
Table 337 PureCircle Limited Total Company Sales 2015-2019 (US$ Mn, AGR %)
Table 338 PureCircle Limited Net Income 2015-2019 (US$ Mn, AGR %)
Table 339 PureCircle Limited Operational Cash 2015-2019 (US$ Mn, AGR %)
Table 340 PureCircle Limited Alternative Sweeteners Products / Services (Segment of Business, Product, Specification / Features)
Table 341 Associated British Foods Plc. Profile 2019
Table 342 Associated British Foods Plc. Total Company Sales 2015-2019 (US$ Mn, AGR %)
Table 343 Associated British Foods Plc. Net Income 2015-2019 (US$ Mn, AGR %)
Table 344 Associated British Foods Plc. Working Capital 2015-2019 (US$ Mn, AGR %)
Table 345 Associated British Foods Plc. Revenue By Business Segment, 2019 (US$ Mn, AGR %)
Table 346 Associated British Foods Plc. Revenue By Geography, 2019 (US$ Mn, AGR %)
Table 347 Associated British Foods Plc. Alternative Sweeteners Products / Services (Segment of Business, Product, Specification / Features)
Table 348 Associated British Foods Plc. Alternative Sweeteners Mergers and Acquisitions, 2019 (Date, Company Involved, Value US$ Mn, Details)
Table 349 Companies Involved in the Alternative Sweeteners Market 2020 (Company, Submarket Involvement, Location)
LIST OF FIGURES
Figure 1. Fiber Optic Networking in Aerospace and Defence Market Application Overview
Figure 2. Fiber Optic Networking in Aerospace and Defence Market Component Overview
Figure 3. Fiber Optic Networking in Aerospace and Defence Market Mode Overview
Figure 4. Fiber Optic Networking in Aerospace and Defence Market Forecast 2020-2030 (US$M, AGR %) (Before COVID)
Figure 5. Fiber Optic Networking in Aerospace and Defence Market Forecast 2020-2030 (US$M, AGR %) (COVID - Scenario V)
Figure 6. Fiber Optic Networking in Aerospace and Defence Market Forecast 2020-2030 (US$M, AGR %) (COVID - Scenario U)
Figure 7. Fiber Optic Networking in Aerospace and Defence Market Forecast 2020-2030 (US$M, AGR %) (COVID - Scenario W)
Figure 8. Fiber Optic Networking in Aerospace and Defence Market Forecast 2020-2030 (US$M, AGR %) (COVID - Scenario L)
Figure 9. Fiber Optic Networking in Aerospace and Defence Submarket Forecast by Application 2020-2030 (US$M, Global AGR %) (Before COVID)
Figure 10. Fiber Optic Networking in Aerospace and Defence Submarket Forecast by Application 2020-2030 (US$M, Global AGR %) (COVID - Scenario V)
Figure 11. Fiber Optic Networking in Aerospace and Defence Submarket Forecast by Application 2020-2030 (US$M, Global AGR %) (COVID - Scenario U)
Figure 12. Fiber Optic Networking in Aerospace and Defence Submarket Forecast by Application 2020-2030 (US$M, Global AGR %) (COVID - Scenario W)
Figure 13. Fiber Optic Networking in Aerospace and Defence Submarket Forecast by Application 2020-2030 (US$M, Global AGR %) (COVID - Scenario L)
Figure 14. Airborne Submarket Forecast 2020-2030 (US$Mn, AGR %, CAGR %) (Before COVID)
Figure 15. Airborne Submarket Forecast 2020-2030 (US$Mn, AGR %, CAGR %) (COVID – Scenario V)
Figure 16. Airborne Submarket Forecast 2020-2030 (US$M, Global AGR %) (COVID – Scenario U)
Figure 17. Airborne Submarket Forecast 2020-2030 (US$M, Global AGR %) (COVID – Scenario W)
Figure 18. Airborne Submarket Forecast 2020-2030 (US$M, Global AGR %) (COVID – Scenario L)
Figure 19. Land Based Submarket Forecast 2020-2030 (US$Mn, AGR %, CAGR %) (Before COVID)
Figure 20. Land Based Submarket Forecast 2020-2030 (US$Mn, AGR %, CAGR %) (COVID – Scenario V)
Figure 21. Land Based Submarket Forecast 2020-2030 (US$M, Global AGR %) (COVID – Scenario U)
Figure 22. Land Based Submarket Forecast 2020-2030 (US$M, Global AGR %) (COVID – Scenario W)
Figure 23. Land Based Submarket Forecast 2020-2030 (US$M, Global AGR %) (COVID – Scenario L)
Figure 24. Naval Submarket Forecast 2020-2030 (US$Mn, AGR %, CAGR %) (Before COVID)
Figure 25. Naval Submarket Forecast 2020-2030 (US$Mn, AGR %, CAGR %) (COVID – Scenario V)
Figure 26. Naval Submarket Forecast 2020-2030 (US$Mn, AGR %, CAGR %) (COVID – Scenario U)
Figure 27. Naval Submarket Forecast 2020-2030 (US$Mn, AGR %, CAGR %) (COVID – Scenario W)
Figure 28. Naval Submarket Forecast 2020-2030 (US$Mn, AGR %, CAGR %) (COVID – Scenario L)
Figure 29. Space Submarket Forecast 2020-2030 (US$Mn, AGR %, CAGR %) (Before COVID)
Figure 30. Space Submarket Forecast 2020-2030 (US$Mn, AGR %, CAGR %) (COVID – Scenario V)
Figure 31. Space Submarket Forecast 2020-2030 (US$Mn, AGR %, CAGR %) (COVID – Scenario U)
Figure 32. Space Submarket Forecast 2020-2030 (US$Mn, AGR %, CAGR %) (COVID – Scenario W)
Figure 33. Space Submarket Forecast 2020-2030 (US$Mn, AGR %, CAGR %) (COVID – Scenario L)
Figure 34. Fiber Optic Networking in Aerospace and Defence Submarket Forecast by Component 2020-2030 (US$M, Global AGR %) (Before COVID)
Figure 35. Fiber Optic Networking in Aerospace and Defence Submarket Forecast by Component 2020-2030 (US$M, Global AGR %) (COVID - Scenario V)
Figure 36. Fiber Optic Networking in Aerospace and Defence Submarket Forecast by Component 2020-2030 (US$M, Global AGR %) (COVID - Scenario U)
Figure 37. Fiber Optic Networking in Aerospace and Defence Submarket Forecast by Component 2020-2030 (US$M, Global AGR %) (COVID - Scenario W)
Figure 38. Fiber Optic Networking in Aerospace and Defence Submarket Forecast by Component 2020-2030 (US$M, Global AGR %) (COVID - Scenario L)
Figure 39. Cable Submarket Forecast 2020-2030 (US$M, Global AGR %) (Before COVID)
Figure 40. Cable Submarket Forecast 2020-2030 (US$M, Global AGR %) (COVID – Scenario V)
Figure 41. Cable Submarket Forecast 2020-2030 (US$M, Global AGR %) (COVID – Scenario U)
Figure 42. Cable Submarket Forecast 2020-2030 (US$M, Global AGR %) (COVID – Scenario W)
Figure 43. Cable Submarket Forecast 2020-2030 (US$M, Global AGR %) (COVID – Scenario L)
Figure 44. Transceiver Submarket Forecast 2020-2030 (US$M, Global AGR %) (Before COVID)
Figure 45. Transceiver Submarket Forecast 2020-2030 (US$M, Global AGR %) (COVID – Scenario V)
Figure 46. Transceiver Submarket Forecast 2020-2030 (US$M, Global AGR %) (COVID – Scenario U)
Figure 47. Transceiver Submarket Forecast 2020-2030 (US$M, Global AGR %) (COVID – Scenario W)
Figure 48. Transceiver Submarket Forecast 2020-2030 (US$M, Global AGR %) (COVID – Scenario L)
Figure 49. Amplifier Submarket Forecast 2020-2030 (US$M, Global AGR %) (Before COVID)
Figure 50. Amplifier Submarket Forecast 2020-2030 (US$M, Global AGR %) (COVID – Scenario V)
Figure 51. Amplifier Submarket Forecast 2020-2030 (US$M, Global AGR %) (COVID – Scenario U)
Figure 52. Amplifier Submarket Forecast 2020-2030 (US$M, Global AGR %) (COVID – Scenario W)
Figure 53. Amplifier Submarket Forecast 2020-2030 (US$M, Global AGR %) (COVID – Scenario W)
Figure 54. Isolator Submarket Forecast 2020-2030 (US$M, Global AGR %) (Before COVID)
Figure 55. Isolator Submarket Forecast 2020-2030 (US$M, Global AGR %) (Before COVID)
Figure 56. Isolator Submarket Forecast 2020-2030 (US$M, Global AGR %) (COVID – Scenario U)
Figure 57. Isolator Submarket Forecast 2020-2030 (US$M, Global AGR %) (COVID – Scenario W)
Figure 58. Isolator Submarket Forecast 2020-2030 (US$M, Global AGR %) (COVID – Scenario W)
Figure 59. Multiplexer/demultiplexer Submarket Forecast 2020-2030 (US$M, Global AGR %) (Before COVID)
Figure 60. Multiplexer/demultiplexer Submarket Forecast 2020-2030 (US$M, Global AGR %) (COVID – Scenario V)
Figure 61. Multiplexer/demultiplexer Submarket Forecast 2020-2030 (US$M, Global AGR %) (COVID – Scenario U)
Figure 62. Multiplexer/demultiplexer Submarket Forecast 2020-2030 (US$M, Global AGR %) (COVID – Scenario W)
Figure 63. Multiplexer/demultiplexer Submarket Forecast 2020-2030 (US$M, Global AGR %) (COVID – Scenario L)
Figure 64. Connector Submarket Forecast 2020-2030 (US$M, Global AGR %) (Before COVID)
Figure 65. Connector Submarket Forecast 2020-2030 (US$M, Global AGR %) (COVID – Scenario V)
Figure 66. Connector Submarket Forecast 2020-2030 (US$M, Global AGR %) (COVID – Scenario U)
Figure 67. Connector Submarket Forecast 2020-2030 (US$M, Global AGR %) (COVID – Scenario W)
Figure 68. Connector Submarket Forecast 2020-2030 (US$M, Global AGR %) (COVID – Scenario L)
Figure 69. Others Submarket Forecast 2020-2030 (US$M, Global AGR %) (Before COVID)
Figure 70. Others Submarket Forecast 2020-2030 (US$M, Global AGR %) (COVID – Scenario V)
Figure 71. Others Submarket Forecast 2020-2030 (US$M, Global AGR %) (COVID – Scenario U)
Figure 72. Others Submarket Forecast 2020-2030 (US$M, Global AGR %) (COVID – Scenario W)
Figure 73. Others Submarket Forecast 2020-2030 (US$M, Global AGR %) (COVID – Scenario L)
Figure 74. Fiber Optic Networking in Aerospace and Defence Submarket Forecast by Mode 2020-2030 (US$M, Global AGR %) (Before COVID)
Figure 75. Fiber Optic Networking in Aerospace and Defence Submarket Forecast by Mode 2020-2030 (US$M, Global AGR %) (COVID - Scenario V)
Figure 76. Fiber Optic Networking in Aerospace and Defence Submarket Forecast by Mode 2020-2030 (US$M, Global AGR %) (COVID - Scenario U)
Figure 77. Fiber Optic Networking in Aerospace and Defence Submarket Forecast by Mode 2020-2030 (US$M, Global AGR %) (COVID - Scenario W)
Figure 78. Fiber Optic Networking in Aerospace and Defence Submarket Forecast by Mode 2020-2030 (US$M, Global AGR %) (COVID - Scenario L)
Figure 79. Regional Fiber Optic Networking in Aerospace and Defence Market Forecast 2020-2030 (Sales US$M, Global AGR %)
Figure 80. Regional Fiber Optic Networking in Aerospace and Defence Market Forecast 2020-2030 (Sales US$M, Global AGR %) (COVID - Scenario V)
Figure 81. Regional Fiber Optic Networking in Aerospace and Defence Market Forecast 2020-2030 (Sales US$M, Global AGR %) (COVID - Scenario U)
Figure 82. Regional Fiber Optic Networking in Aerospace and Defence Market Forecast 2020-2030 (Sales US$M, Global AGR %) (COVID - Scenario W)
Figure 83. Regional Fiber Optic Networking in Aerospace and Defence Market Forecast 2020-2030 (Sales US$M, Global AGR %) (COVID - Scenario L)
Figure 84. North America Fiber Optic Networking in Aerospace and Defence Market Forecast by Application 2020-2030 (US$M, AGR %) (Before COVID)
Figure 85. North America Fiber Optic Networking in Aerospace and Defence Market Forecast by Application 2020-2030 (US$M, AGR %) (COVID - Scenario V)
Figure 86. North America Fiber Optic Networking in Aerospace and Defence Market Forecast by Application 2020-2030 (US$M, AGR %) (COVID - Scenario U)
Figure 87. North America Fiber Optic Networking in Aerospace and Defence Market Forecast by Application 2020-2030 (US$M, AGR %) (COVID - Scenario W)
Figure 88. North America Fiber Optic Networking in Aerospace and Defence Market Forecast by Application 2020-2030 (US$M, AGR %) (COVID - Scenario L)
Figure 89. North America Fiber Optic Networking in Aerospace and Defence Market Forecast by Component 2020-2030 (US$M, AGR %)
Figure 90. North America Fiber Optic Networking in Aerospace and Defence Market Forecast by Component 2020-2030 (US$M, AGR %) (COVID - Scenario V)
Figure 91. North America Fiber Optic Networking in Aerospace and Defence Market Forecast by Component 2020-2030 (US$M, AGR %) (COVID - Scenario U)
Figure 92. North America Fiber Optic Networking in Aerospace and Defence Market Forecast by Component 2020-2030 (US$M, AGR %) (COVID - Scenario W)
Figure 93. North America Fiber Optic Networking in Aerospace and Defence Market Forecast by Component 2020-2030 (US$M, AGR %) (COVID - Scenario L)
Figure 94. North America Fiber Optic Networking in Aerospace and Defence Market Forecast by Country 2020-2030 (US$M, AGR %) (Before COVID)
Figure 95. North America Fiber Optic Networking in Aerospace and Defence Market Forecast by Country 2020-2030 (US$M, AGR %) (COVID - Scenario V)
Figure 96. North America Fiber Optic Networking in Aerospace and Defence Market Forecast by Country 2020-2030 (US$M, AGR %) (COVID - Scenario U)
Figure 97. North America Fiber Optic Networking in Aerospace and Defence Market Forecast by Country 2020-2030 (US$M, AGR %) (COVID - Scenario W)
Figure 98. North America Fiber Optic Networking in Aerospace and Defence Market Forecast by Country 2020-2030 (US$M, AGR %) (COVID - Scenario L)
Figure 99. US Fiber Optic Networking in Aerospace and Defence Market Forecast 2020-2030 (US$M, AGR %) (Before COVID)
Figure 100. US Fiber Optic Networking in Aerospace and Defence Market Forecast 2020-2030 (US$M, AGR %) (COVID - Scenario V)
Figure 101. US Fiber Optic Networking in Aerospace and Defence Market Forecast 2020-2030 (US$M, AGR %) (COVID - Scenario U)
Figure 102. US Fiber Optic Networking in Aerospace and Defence Market Forecast 2020-2030 (US$M, AGR %) (COVID - Scenario W)
Figure 103. US Fiber Optic Networking in Aerospace and Defence Market Forecast 2020-2030 (US$M, AGR %) (COVID - Scenario L)
Figure 104. Canada Fiber Optic Networking in Aerospace and Defence Market Forecast 2020-2030 (US$M, AGR %)
Figure 105. Canada Fiber Optic Networking in Aerospace and Defence Market Forecast 2020-2030 (US$M, AGR %) (COVID - Scenario V)
Figure 106. Canada Fiber Optic Networking in Aerospace and Defence Market Forecast 2020-2030 (US$M, AGR %) (COVID - Scenario U)
Figure 107. Canada Fiber Optic Networking in Aerospace and Defence Market Forecast 2020-2030 (US$M, AGR %) (COVID - Scenario W)
Figure 108. Canada Fiber Optic Networking in Aerospace and Defence Market Forecast 2020-2030 (US$M, AGR %) (COVID - Scenario L)
Figure 109. Europe Fiber Optic Networking in Aerospace and Defence Market Forecast by Application 2020-2030 (US$M)
Figure 110. Europe Fiber Optic Networking in Aerospace and Defence Market Forecast by Application 2020-2030 (US$M) (COVID - Scenario V)
Figure 111. Europe Fiber Optic Networking in Aerospace and Defence Market Forecast by Application 2020-2030 (US$M) (COVID - Scenario U)
Figure 112. Europe Fiber Optic Networking in Aerospace and Defence Market Forecast by Application 2020-2030 (US$M) (COVID - Scenario W)
Figure 113. Europe Fiber Optic Networking in Aerospace and Defence Market Forecast by Application 2020-2030 (US$M) (COVID - Scenario L)
Figure 114. Europe Fiber Optic Networking in Aerospace and Defence Market Forecast by Component 2020-2030 (US$M) (Before COVID)
Figure 115. Europe Fiber Optic Networking in Aerospace and Defence Market Forecast by Component 2020-2030 (US$M) (COVID - Scenario V)
Figure 116. Europe Fiber Optic Networking in Aerospace and Defence Market Forecast by Component 2020-2030 (US$M) (COVID - Scenario U)
Figure 117. Europe Fiber Optic Networking in Aerospace and Defence Market Forecast by Component 2020-2030 (US$M) (COVID - Scenario W)
Figure 118. Europe Fiber Optic Networking in Aerospace and Defence Market Forecast by Component 2020-2030 (US$M) (COVID - Scenario L)
Figure 119. Europe Fiber Optic Networking in Aerospace and Defence Market Forecast by Country 2020-2030 (US$M, Global AGR %) (Before COVID)
Figure 120. Europe Fiber Optic Networking in Aerospace and Defence Market Forecast by Country 2020-2030 (US$M, Global AGR %) (COVID - Scenario V)
Figure 121. Europe Fiber Optic Networking in Aerospace and Defence Market Forecast by Country 2020-2030 (US$M, Global AGR %) (COVID - Scenario U)
Figure 122. Europe Fiber Optic Networking in Aerospace and Defence Market Forecast by Country 2020-2030 (US$M, Global AGR %) (COVID - Scenario W)
Figure 123. Europe Fiber Optic Networking in Aerospace and Defence Market Forecast by Country 2020-2030 (US$M, Global AGR %) (COVID - Scenario L)
Figure 124. UK Fiber Optic Networking in Aerospace and Defence Market Forecast 2020-2030 (US$M, AGR %) (Before COVID)
Figure 125. UK Fiber Optic Networking in Aerospace and Defence Market Forecast 2020-2030 (US$M, AGR %) (COVID - Scenario V)
Figure 126. UK Fiber Optic Networking in Aerospace and Defence Market Forecast 2020-2030 (US$M, AGR %) (COVID – Scenario U)
Figure 127. UK Fiber Optic Networking in Aerospace and Defence Market Forecast 2020-2030 (US$M, AGR %) (COVID - Scenario W)
Figure 128. UK Fiber Optic Networking in Aerospace and Defence Market Forecast 2020-2030 (US$M, AGR %) (COVID - Scenario L)
Figure 129. Germany Fiber Optic Networking in Aerospace and Defence Market Forecast 2020-2030 (US$M, AGR %)
Figure 130. Germany Fiber Optic Networking in Aerospace and Defence Market Forecast 2020-2030 (US$M, AGR %) (COVID - Scenario V)
Figure 131. Germany Fiber Optic Networking in Aerospace and Defence Market Forecast 2020-2030 (US$M, AGR %) (COVID - Scenario U)
Figure 132. Germany Fiber Optic Networking in Aerospace and Defence Market Forecast 2020-2030 (US$M, AGR %) (COVID - Scenario W)
Figure 133. Germany Fiber Optic Networking in Aerospace and Defence Market Forecast 2020-2030 (US$M, AGR %) (COVID - Scenario L)
Figure 134. France Fiber Optic Networking in Aerospace and Defence Market Forecast 2020-2030 (US$M, AGR %)
Figure 135. France Fiber Optic Networking in Aerospace and Defence Market Forecast 2020-2030 (US$M, AGR %) (COVID - Scenario V)
Figure 136. France Fiber Optic Networking in Aerospace and Defence Market Forecast 2020-2030 (US$M, AGR %) (COVID - Scenario U)
Figure 137. France Fiber Optic Networking in Aerospace and Defence Market Forecast 2020-2030 (US$M, AGR %) (COVID - Scenario W)
Figure 138. France Fiber Optic Networking in Aerospace and Defence Market Forecast 2020-2030 (US$M, AGR %) (COVID - Scenario L)
Figure 139. Rest of Europe Fiber Optic Networking in Aerospace and Defence Market Forecast 2020-2030 (US$M, AGR %) (Before COVID)
Figure 140. Rest of Europe Fiber Optic Networking in Aerospace and Defence Market Forecast 2020-2030 (US$M, AGR %) (COVID - Scenario V)
Figure 141. Rest of Europe Fiber Optic Networking in Aerospace and Defence Market Forecast 2020-2030 (US$M, AGR %) (COVID - Scenario U)
Figure 142. Rest of Europe Fiber Optic Networking in Aerospace and Defence Market Forecast 2020-2030 (US$M, AGR %) (COVID - Scenario W)
Figure 143. Rest of Europe Fiber Optic Networking in Aerospace and Defence Market Forecast 2020-2030 (US$M, AGR %) (COVID - Scenario L)
Figure 144. Asia-Pacific Fiber Optic Networking in Aerospace and Defence Market Forecast by Application 2020-2030 (US$M) (Before COVID)
Figure 145. Asia-Pacific Fiber Optic Networking in Aerospace and Defence Market Forecast by Application 2020-2030 (US$M) (COVID - Scenario V)
Figure 146. Asia-Pacific Fiber Optic Networking in Aerospace and Defence Market Forecast by Application 2020-2030 (US$M) (COVID - Scenario U)
Figure 147. Asia-Pacific Fiber Optic Networking in Aerospace and Defence Market Forecast by Application 2020-2030 (US$M) (COVID - Scenario W)
Figure 148. Asia-Pacific Fiber Optic Networking in Aerospace and Defence Market Forecast by Application 2020-2030 (US$M) (COVID - Scenario L)
Figure 149. Asia-Pacific Fiber Optic Networking in Aerospace and Defence Market Forecast by Component 2020-2030 (US$M)
Figure 150. Asia-Pacific Fiber Optic Networking in Aerospace and Defence Market Forecast by Component 2020-2030 (US$M) (COVID - Scenario V)
Figure 151. Asia-Pacific Fiber Optic Networking in Aerospace and Defence Market Forecast by Component 2020-2030 (US$M) (COVID - Scenario U)
Figure 152. Asia-Pacific Fiber Optic Networking in Aerospace and Defence Market Forecast by Component 2020-2030 (US$M) (COVID - Scenario W)
Figure 153. Asia-Pacific Fiber Optic Networking in Aerospace and Defence Market Forecast by Component 2020-2030 (US$M) (COVID - Scenario L)
Figure 154. Asia-Pacific Fiber Optic Networking in Aerospace and Defence Market Forecast by Country 2020-2030 (US$M, AGR %) (Before COVID)
Figure 155. Asia-Pacific Fiber Optic Networking in Aerospace and Defence Market Forecast by Country 2020-2030 (US$M, Global AGR %) (COVID - Scenario V)
Figure 156. Asia-Pacific Fiber Optic Networking in Aerospace and Defence Market Forecast by Country 2020-2030 (US$M, Global AGR %) (COVID - Scenario U)
Figure 157. Asia-Pacific Fiber Optic Networking in Aerospace and Defence Market Forecast by Country 2020-2030 (US$M, Global AGR %) (COVID - Scenario W)
Figure 158. Asia-Pacific Fiber Optic Networking in Aerospace and Defence Market Forecast by Country 2020-2030 (US$M, Global AGR %) (COVID - Scenario L)
Figure 159. China Fiber Optic Networking in Aerospace and Defence Market Forecast 2020-2030 (US$M, AGR %)
Figure 160. China Fiber Optic Networking in Aerospace and Defence Market Forecast 2020-2030 (US$M, AGR %) (COVID - Scenario V)
Figure 161. China Fiber Optic Networking in Aerospace and Defence Market Forecast 2020-2030 (US$M, AGR %) (COVID - Scenario U)
Figure 162. China Fiber Optic Networking in Aerospace and Defence Market Forecast 2020-2030 (US$M, AGR %) (COVID - Scenario W)
Figure 163. China Fiber Optic Networking in Aerospace and Defence Market Forecast 2020-2030 (US$M, AGR %) (COVID - Scenario L)
Figure 164. India Fiber Optic Networking in Aerospace and Defence Market Forecast 2020-2030 (US$M, AGR %)
Figure 165. India Fiber Optic Networking in Aerospace and Defence Market Forecast 2020-2030 (US$M, AGR %) (COVID - Scenario V)
Figure 166. India Fiber Optic Networking in Aerospace and Defence Market Forecast 2020-2030 (US$M, AGR %) (COVID - Scenario U)
Figure 167. India Fiber Optic Networking in Aerospace and Defence Market Forecast 2020-2030 (US$M, AGR %) (COVID - Scenario W)
Figure 168. India Fiber Optic Networking in Aerospace and Defence Market Forecast 2020-2030 (US$M, AGR %) (COVID - Scenario L)
Figure 169. Japan Fiber Optic Networking in Aerospace and Defence Market Forecast 2020-2030 (US$M, AGR %) (Before COVID)
Figure 170. Japan Fiber Optic Networking in Aerospace and Defence Market Forecast 2020-2030 (US$M, AGR %) (COVID - Scenario V)
Figure 171. Japan Fiber Optic Networking in Aerospace and Defence Market Forecast 2020-2030 (US$M, AGR %) (COVID - Scenario U)
Figure 172. Japan Fiber Optic Networking in Aerospace and Defence Market Forecast 2020-2030 (US$M, AGR %) (COVID - Scenario W)
Figure 173. Japan Fiber Optic Networking in Aerospace and Defence Market Forecast 2020-2030 (US$M, AGR %) (COVID - Scenario L)
Figure 174. Rest of APAC Fiber Optic Networking in Aerospace and Defence Market Forecast 2020-2030 (US$M, AGR %) (Before COVID)
Figure 175. Rest of APAC Fiber Optic Networking in Aerospace and Defence Market Forecast 2020-2030 (US$M, AGR %) (COVID - Scenario V)
Figure 176. Rest of APAC Fiber Optic Networking in Aerospace and Defence Market Forecast 2020-2030 (US$M, AGR %) (COVID - Scenario U)
Figure 177. Rest of APAC Fiber Optic Networking in Aerospace and Defence Market Forecast 2020-2030 (US$M, AGR %) (COVID - Scenario W)
Figure 178. Rest of APAC Fiber Optic Networking in Aerospace and Defence Market Forecast 2020-2030 (US$M, AGR %) (COVID - Scenario L)
Figure 179. Middle East Fiber Optic Networking in Aerospace and Defence Market Forecast by Application 2020-2030 (US$M)
Figure 180. Middle East Fiber Optic Networking in Aerospace and Defence Market Forecast by Application 2020-2030 (US$M) (COVID - Scenario V)
Figure 181. Middle East Fiber Optic Networking in Aerospace and Defence Market Forecast by Application 2020-2030 (US$M) (COVID - Scenario U)
Figure 182. Middle East Fiber Optic Networking in Aerospace and Defence Market Forecast by Application 2020-2030 (US$M) (COVID - Scenario W)
Figure 183. Middle East Fiber Optic Networking in Aerospace and Defence Market Forecast by Application 2020-2030 (US$M) (COVID - Scenario L)
Figure 184. Middle East Fiber Optic Networking in Aerospace and Defence Market Forecast by Component 2020-2030 (US$M)
Figure 185. Middle East Fiber Optic Networking in Aerospace and Defence Market Forecast by Component 2020-2030 (US$M) (COVID - Scenario V)
Figure 186. Middle East Fiber Optic Networking in Aerospace and Defence Market Forecast by Component 2020-2030 (US$M) (COVID - Scenario U)
Figure 187. Middle East Fiber Optic Networking in Aerospace and Defence Market Forecast by Component 2020-2030 (US$M) (COVID - Scenario W)
Figure 188. Middle East Fiber Optic Networking in Aerospace and Defence Market Forecast by Component 2020-2030 (US$M) (COVID - Scenario L)
Figure 189. Latin America Fiber Optic Networking in Aerospace and Defence Market Forecast by Application 2020-2030 (US$M)
Figure 190. Latin America Fiber Optic Networking in Aerospace and Defence Market Forecast by Application 2020-2030 (US$M) (COVID - Scenario V)
Figure 191. Latin America Fiber Optic Networking in Aerospace and Defence Market Forecast by Application 2020-2030 (US$M) (COVID - Scenario U)
Figure 192. Latin America Fiber Optic Networking in Aerospace and Defence Market Forecast by Application 2020-2030 (US$M) (COVID - Scenario W)
Figure 193. Latin America Fiber Optic Networking in Aerospace and Defence Market Forecast by Application 2020-2030 (US$M) (COVID - Scenario L)
Figure 194. Latin America Fiber Optic Networking in Aerospace and Defence Market Forecast by Component 2020-2030 (US$M)
Figure 195. Latin America Fiber Optic Networking in Aerospace and Defence Market Forecast by Component 2020-2030 (US$M) (COVID - Scenario V)
Figure 196. Latin America Fiber Optic Networking in Aerospace and Defence Market Forecast by Component 2020-2030 (US$M) (COVID - Scenario U)
Figure 197. Latin America Fiber Optic Networking in Aerospace and Defence Market Forecast by Component 2020-2030 (US$M) (COVID - Scenario W)
Figure 198. Latin America Fiber Optic Networking in Aerospace and Defence Market Forecast by Component 2020-2030 (US$M) (COVID - Scenario L)
Figure 199. Africa Fiber Optic Networking in Aerospace and Defence Market Forecast by Application 2020-2030 (US$M)
Figure 200. Africa Fiber Optic Networking in Aerospace and Defence Market Forecast by Application 2020-2030 (US$M) (COVID - Scenario V)
Figure 201. Africa Fiber Optic Networking in Aerospace and Defence Market Forecast by Application 2020-2030 (US$M) (COVID - Scenario U)
Figure 202. Africa Fiber Optic Networking in Aerospace and Defence Market Forecast by Application 2020-2030 (US$M) (COVID - Scenario W)
Figure 203. Africa Fiber Optic Networking in Aerospace and Defence Market Forecast by Application 2020-2030 (US$M) (COVID - Scenario L)
Figure 204. Africa Fiber Optic Networking in Aerospace and Defence Market Forecast by Component 2020-2030 (US$M) (Before COVID)
Figure 205. Africa Fiber Optic Networking in Aerospace and Defence Market Forecast by Component 2020-2030 (US$M) (COVID - Scenario V)
Figure 206. Africa Fiber Optic Networking in Aerospace and Defence Market Forecast by Component 2020-2030 (US$M) (COVID - Scenario U)
Figure 207. Africa Fiber Optic Networking in Aerospace and Defence Market Forecast by Component 2020-2030 (US$M) (COVID - Scenario W)
Figure 208. Africa Fiber Optic Networking in Aerospace and Defence Market Forecast by Component 2020-2030 (US$M) (COVID - Scenario L)
Figure 209. Porter’s Five Force Analysis
Figure 210. TE Connectivity Total Company Sales 2015-2019 (US$m, AGR %)
Figure 211. TE Connectivity Sales by Segment of Business 2019 (US$m)
Figure 212. TE Connectivity Sales by Regional Segment of Business 2019 (US$m)
Ajinomoto Co., Inc.
Archer Daniels Midland Company
Associated British Foods Plc.
Cargill Incorporated
DuPont Nutrition & Health
GLG Life Tech Corporation
Ingredion Incorporated
Naturex S.A.
PureCircle Limited
Tate & Lyle Plc.
List of Companies Mentioned in the Report:
A M Nutratech Private Limited
Advance Inorganics
Ajinomoto Co., Inc.
Alpspure Lifesciences Private Limited
Amnem
Amyris
Amyris Inc
Archer Daniels Midland Company
Associated British Foods Plc.
Bayleaf Wellness Private Limited
Bharat Heavy Chemicals
Bioven Ingredients
Cargill Incorporated
Chemical Corporation
Choice Organochem Llp
Deepar Pharmaceuticals Pvt Ltd
DuPont Nutrition & Health
Everest Water System
GLG Life Tech Corporation
Herboveda India
Higer Health Sciences LLP
Ingredion Incorporated
Jigya Chem & Fragrances
Joy Well Foods
Kebony AS
Merisant Company
Metabolistic Laboratories Private Limited
Milis Bio
N SHASHIKANT & CO.
Nandlal Bankatlal Private Limited
Naturex S.A.
Nestle SA
NRS Chemicals LLP
Nuvanto Bioscience Private Limited
PureCircle Limited
RAS Greeen Sweetners
Shriram Biochem
SoPure
Stevia Hub India
Stevia World AgroTech Private Limited
STEVIAL
Suminter India Organics
Tag Overseas
Tate & Lyle Plc.
Tulip Chemicals
Vanashree Agrotech
Vardhaman Healthcare
Wells Enterprises, Inc.
Whole Earth Brands Inc.
Xilinat
List of Organizations Mentioned in the Report:
All India Food Processors' Association
Assured Food Standards
Australian Food and Grocery Council
Australian Institute of Food Safety
Beverage Marketing Corporation
Council for Responsible Nutrition
Fats and Protein Research Foundation
Food and Drink Federation
Food Industry Suppliers Association
Food Ingredient Distribution Association
Food Products Association
FoodDrinkEurope
Indian Beverage Association
Indian Food & Beverages Products Association
International Food Information Council
International Food Information Council
International Sweeteners Association
National Registry of Food Safety Professionals
Scotland Food & Drink
Specialty Food Association
Download sample pages
Complete the form below to download your free sample pages for Alternative Sweeteners Market Report 2020-2030Related reports
-

Stevia Market Report 2019-2029
The global Stevia market is expected to witness strong growth during the forecast period.
...Full DetailsPublished: 01 January 1970 -
Food Flavour Enhancer Market Report 2020-2030
The food and beverage industry has undergone several stages of transformation in the past three years, driven by emerging brands...
Full DetailsPublished: 19 May 2020 -

Confectionery Market Report 2020-2030
Rising consumer awareness towards the healthy lifestyle coupled with the increasing demand for nutritious foods. The population have become more...
Full DetailsPublished: 25 June 2020 -
Functional Foods Market Report 2020-2030
Visiongain assesses that the functional foods market will generate revenues of $84.8bn in 2020.
...Full DetailsPublished: 23 January 2020
Download sample pages
Complete the form below to download your free sample pages for Alternative Sweeteners Market Report 2020-2030Do you have any custom requirements we can help you with?
Any specific country, geo region, market segment or specific company information?
Email us today, we can discuss your needs and see how we can help: jamie.roberts@visiongain.com
Would you like a free report overview of the report of your choice? If so, please drop an email to Jamie Roberts stating your chosen report title to jamie.roberts@visiongain.com
Visiongain food & drink reports are compiled using a broad and rich mixture of both primary and secondary information to produce an overall industry outlook. In order to provide our clients with the best product possible product, we do not rely on any one single source of information. Visiongain analysts reach out to market-leading vendors, carriers, service providers and industry experts but also review a wealth of financial data and product information from a vast range of sources. To find out more about our reports methodology, please email jamie.roberts@visiongain.com
Would you like to get the latest Visiongain food & drink reports catalogue? What are the dynamic growth sectors? where are the regional business opportunities? Which technologies will prevail and who are the leading companies succeeding in these sectors and why? If you want definitive answers to business critical questions, discover Visiongain’s full range of business intelligence reports. If so, please email Jamie Roberts on jamie.roberts@visiongain.com or call her today on +44 207 336 6100
Assured Food Standards
Europatat
Federation of Oils, Seeds and Fats Associations
Food and Drink Federation
Food & Drink Federation
Grain and Feed Trade Association
Freshfel Europe
International Dairy-Deli-Bakery Association
Meat Industry Association of New Zealand
National Frozen & Refrigerated Foods Association
Produce Marketing Association
TURYID
U.S. Poultry & Egg Association
Latest Food and Drink news
Visiongain Publishes Commercial Greenhouse Market Report 2024-2034
The global Commercial Greenhouse market was valued at US$38.02 billion in 2023 and is projected to grow at a CAGR of 8.3% during the forecast period 2024-2034.
09 April 2024
Visiongain Publishes Vertical Farming Market Report 2023-2033
The global Vertical Farming market was valued at US$5.4 billion in 2022 and is projected to grow at a CAGR of 22% during the forecast period 2023-2033.
31 July 2023
Visiongain Publishes Industrial Enzymes Market Report 2023-2033
The global industrial enzymes market was valued at US$6.42 billion in 2022 and is projected to grow at a CAGR of 6.8% during the forecast period 2023-2033.
06 June 2023
Visiongain Publishes Agricultural Robots Market Report 2023-2033
The global Agricultural Robots market was valued at US$12.8 billion in 2022 and is projected to grow at a CAGR of 25.3% during the forecast period 2023-2033.
31 May 2023


