Industries > Food and Drink > Functional Foods Market Report 2018-2028
Functional Foods Market Report 2018-2028
Analysing the “Superfoods” Trend and Forecasts for Functional Dairy, Bakery & Cereal, Baby Food, Fats & Oils, Meat, Fish & Eggs and Others Plus Profiles on the Leading Companies and Regional and Leading National Markets Analysis
The new report from business intelligence provider Visiongain offers an updated outlook for the global functional foods market and growing “superfood” trend. Visiongain assesses that the functional foods market will generate revenues of $69.73bn in 2018.
Now: “Functional Food Industry Boom: Chia, Flax and Quinoa Seeds Markets Witnessing Double Digit Growth.” This is an example of the business critical headline that you need to know about – and more importantly, you need to read Visiongain’s objective analysis of how this will impact your company and the industry more broadly. How are you and your company reacting to this news? Are you sufficiently informed?
How this report will benefit you
Read on to discover how you can exploit the future business opportunities emerging in the functional foods sector. Visiongain’s new study tells you and tells you NOW.
In this brand-new report, you will receive 217 in-depth tables, charts and graphs– all unavailable elsewhere.
The 184-page report provides clear detailed insight into the global functional foods market. It reveals the key drivers and challenges affecting the market.
By ordering and reading our brand-new report today you will be better informed and ready to act.
Report Scope
• Global functional foods market forecasts from 2018-2028
• Regional functional foods market forecasts from 2018-2028 covering
– North America
– South America
– Western Europe
– Eastern Europe
– Asia-Pacific
– Middle East and Africa
• Country level functional foods forecasts from 2018-2028 covering
– US
– Canada
– Mexico
– UK
– Germany
– Japan
– Brazil
– UAE
– RoW.
• Functional foods submarket forecasts from 2018-2028 covering
– Functional Dairy
– Functional Bakery & Cereal
– Functional Baby Food
– Functional Fats & Oils
– Functional Meat, Fish & Eggs
– Other Functional Foods
• Analysis of the key factors driving growth in the global, regional and country level functional foods markets from 2018-2028
• Profiles and competitive positioning map of the leading 15 functional foods companies
– Abbott Laboratories
– ADM
– Arla
– BASF
– Danone
– Dean Foods
– General Mills
– Glanbia plc
– GlaxoSmithKline plc
– Kellogg
– Nestle
– Orkla Group
– PepsiCo
– Raisio Group
– Royal FrieslandCampina N.V.
How will you benefit from this report?
• This report will keep your functional foods knowledge base up to speed. Don’t get left behind
• This report will reinforce strategic decision decision-making based upon definitive and reliable market data
• You will learn how to exploit new functional foods technological trends
• You will be able to realise your company’s full potential within the market
• You will better understand the competitive landscape and identify potential new business opportunities & partnerships
Who should read this report?
• Anyone within the food industry & value chain
• Food manufacturers
• Ingredients suppliers
• Manufacturers of functional food
• Manufacturers of functional ingredients
• Manufacturers of free-from food
• Manufacturers of organic food
• Manufacturers of superfoods
• Health & wellness food distribution companies
• Healthy food distributors and manufacturers
• Food marketing and business analysis departments
• Investment analysts
• Investment consultancies
• Food industry investors
• Food market consultancy
• Governmental departments & agencies
• New product development (NPD) managers & Specialists
• Food buyers
• Clean-label food manufacturers
• CEO’s
• COO’s
• CIO’s
• Business development managers
• Marketing managers
• Food industry associations
Visiongain’s study is intended for anyone requiring commercial analyses for the functional foods market and leading companies. You will find data, trends and predictions.
Buy our report today Functional Foods Market Report 2018-2028: Analysing the “Superfoods” Trend and Forecasts for Functional Dairy, Bakery & Cereal, Baby Food, Fats & Oils, Meat, Fish & Eggs and Others Plus Profiles on the Leading Companies and Regional and Leading National Markets Analysis. Avoid missing out by staying informed – order our report now.
Visiongain is a trading partner with the US Federal Government
CCR Ref number: KD4R6
1.1 Global Functional Foods Market Overview
1.2 Global Functional Foods Market Segmentation
1.3 Market Definition
1.4 How This Report Delivers
1.5 Key Questions Answered By This Analytical Report Include:
1.6 Why You Should Read This Report
1.7 Methodology
1.8 Frequently Asked Questions (FAQ)
1.9 Associated Visiongain Reports
2. Introduction to The Functional Foods Market And The ‘Superfoods’ Trend
2.1 The Roots Of ‘Functional Food’
2.2 Which Products Are Considered “Superfood”?
2.3 How Antioxidants Work?
2.4 The Types of Antioxidants
2.4.1 Antioxidant Enzymes
2.4.2 Antioxidant Vitamins
2.4.3 Fat Soluble Vitamins
2.4.4 Water Soluble Vitamins
2.4.5 Phytochemicals
2.5 What Is “Superfood” From The Legislative Point Of View: An Overlap With “Functional”Foods
2.5.1 EU Guidance On “Superfood” Claims Use
2.5.2 US DSHEA Regulation
2.5.3 Regulatory Framework in Latin America
2.5.4 Health Claim Regulations in Australia
2.5.5 Regulatory Scenario in India
2.5.6. Regulatory Scenario in China
2.5.7 Regulatory Scenario in Southeast Asia
2.6 Functional Food: The Differences In The Definition And The Market Sizing Approach
2.6.1 Where Do “Superfoods” Fit In?
3. Global Functional Foods Market Forecast 2018-2028
3.1 Global Functional Foods Market Analysis
3.2 Global Functional Foods Market Drivers and Restrains
3.3 Functional Foods Market Drivers
3.3.1 Healthy Lifestyle & New Dieting Patterns
3.3.2 Emerging Markets Provide Good Growth Opportunities
3.3.3 Low Cost Compared to Healthcare
3.3.4 Fastest Growing Customer Groups: Millennials
3.3.5 Fastest Growing Customer Groups: Kids
3.3.6 Fastest Growing Customer Groups: Women & Elderly
3.4 Functional Foods Market Restraints
3.4.1 Tougher Regulations
3.4.2 Product Safety Concerns
3.4.3 Doubts Over the Effectiveness of Functional Foods
3.4.4 Lack of Awareness regarding Functional Foods
4. Leading Functional Foods Submarket Forecasts 2018-2028
4.1 Leading Functional Foods Submarkets Share Forecast 2018, 2023 and 2028
4.2 Functional Dairy Market Forecast 2018-2028
4.2.1 Functional Dairy Market Analysis 2018-2028
4.2.2 Can Cheese Become A “Superfood”?
4.2.3 Increasing lactose intolerance
4.2.4 Plant Based Dairy Alternatives Are on The Rise
4.3 Functional Bakery & Cereal Market Forecast 2018-2028
4.3.1 Functional Bakery & Cereal Market Analysis 2018-2028
4.3.2 Latest Trends in The Bakery Industry
4.3.3 A Fast Growth of The Functional Flours Market
4.3.4 Good Prospects in The Hot Cereals Segment
4.4 Functional Baby Food Market Forecast 2018-2028
4.4.1 Functional Baby Food Market Analysis 2018-2028
4.4.2 Superfoods for The Little Ones
4.5 Functional Fats & Oils Market Forecast 2018-2028
4.5.1 Functional Fats & Oils Market Analysis 2018-2028
4.5.2 Which Oils Are “Superfoods”?
4.6 Functional Meat, Fish & Eggs Market Forecast 2018-2028
4.6.1 Functional Meat, Fish & Eggs Market Analysis 2018-2028
4.6.2 Consumers’ Negative Attitude Towards Meat Consumption
4.6.3 Meat Consumption and Mortality
4.6.4 Approaches to Develop Functional Meats
4.7 Other Functional Foods Market Forecast 2018-2028
4.7.1 Other Functional Foods Market Analysis 2018-2028
5. Regional Functional Foods Markets Forecasts 2018-2028
5.1 Regional Functional Foods Market Share Forecast 2018-2028
5.2 Historical Distribution Of Regional Market Shares
5.3 North American Functional Foods Market Forecast 2018-2028
5.3.1 North American Functional Foods Market Analysis 2018-2028
5.4 South American Functional Foods Market Forecast 2018-2028
5.4.1 South American Functional Foods Market Analysis 2018-2028
5.5 Western European Functional Foods Market Forecast 2018-2028
5.5.1 Western European Functional Foods Market Analysis 2018-2028
5.6 Eastern European Functional Foods Market Forecast 2018-2028
5.6.1 Eastern European Functional Foods Market Analysis 2018-2028
5.7 Asia-Pacific Functional Foods Market Forecast 2018-2028
5.7.1 Asia-Pacific Functional Foods Market Analysis 2018-2028
5.8 MEA Functional Foods Market Forecast 2018-2028
5.8.1 MEA Functional Foods Market Analysis 2018-2028
6. Leading National Functional Foods Markets Forecasts 2018-2028
6.1 Leading National Functional Foods Market Share Forecast 2018-2028
6.2 US Functional Foods Market Forecast 2018-2028
6.2.1 US Functional Foods Market Analysis 2018-2028
6.3 Canadian Functional Foods Market Forecast 2018-2028
6.3.1 Canadian Functional Foods Market Analysis 2018-2028
6.4 Mexican Functional Foods Market Forecast 2018-2028
6.4.1 Mexican Functional Foods Market Analysis 2018-2028
6.4.2 Can Superfoods Help with Obesity Problems in Mexico?
6.5 Brazilian Functional Foods Market Forecast 2018-2028
6.5.1 Brazilian Functional Foods Market Analysis 2018-2028
6.6 UK Functional Foods Market Forecast 2018-2028
6.6.1 UK Functional Foods Market Analysis 2018-2028
6.7 German Functional Foods Market Forecast 2018-2028
6.7.1 German Functional Foods Market Analysis 2018-2028
6.8 Japanese Functional Foods Market Forecast 2018-2028
6.8.1 Japanese Functional Foods Market Analysis 2018-2028
6.9 UAE Functional Foods Market Forecast 2018-2028
6.9.1 UAE Functional Foods Market Analysis 2018-2028
6.10 China Functional Foods Market Forecast 2018-2028
6.10.1 China Functional Foods Market Analysis 2018-2028
6.11 India Functional Foods Market Forecast 2018-2028
6.11.1 India Functional Foods Market Analysis 2018-2028
6.12 RoW Functional Foods Market Forecast 2018-2028
6.12.1 RoW Functional Foods Market Analysis 2018-2028
7. Leading Companies in the Functional Foods Market
7.1 Abbott Laboratories Overview
7.1.1 Abbott Laboratories Recent Revenue 2013-2017
7.1.2 Abbott Laboratories Analysis
7.1.3 Abbott Laboratories Regional Emphasis/Focus
7.1.4 Abbott Laboratories Mergers & Acquisitions
7.2 Archer Daniels Midland (ADM) Overview
7.2.1 ADM Recent Revenue 2013-2017
7.2.2 ADM Analysis
7.2.3 ADM Regional Emphasis/Focus
7.2.4 ADM Mergers & Acquisitions
7.3 Arla Overview
7.3.1 Arla Recent Revenue 2013-2017
7.3.2 Arla Analysis
7.3.3 Arla Regional Emphasis/Focus
7.4 BASF Overview
7.4.1 BASF Recent Revenue 2013-2017
7.4.2 BASF Analysis
7.4.3 BASF Regional Emphasis/Focus
7.4.4 BASF Mergers & Acquisitions
7.5 Dean Foods Overview
7.5.1 Dean Foods Recent Revenue 2013-2017
7.5.2 Dean Foods Analysis
7.6 Danone Overview
7.6.1 Danone Recent Revenue 2013-2017
7.6.2 Danone Analysis
7.6.3 Danone Regional Emphasis/Focus
7.6.4 Danone Mergers & Acquisitions
7.7 General Mills Overview
7.7.1 General Mills Recent Revenue 2013-2017
7.7.2 General Mills Analysis
7.7.3 General Mills Regional Emphasis/Focus
7.7.4 General Mills Mergers & Acquisitions
7.8 Glanbia plc Overview
7.8.1 Glanbia plc Recent Revenue 2013-2017
7.8.2 Glanbia plc Analysis
7.8.3 Glanbia plc Regional Emphasis/Focus
7.8.4 Glanbia plc Mergers & Acquisitions
7.9 GlaxoSmithKline plc Overview
7.9.1 GlaxoSmithKline plc Recent Revenue 2013-2017
7.9.3 GlaxoSmithKline plc Geographical Spread of Employees 2017
7.10 Kellogg Overview
7.10.1 Kellogg Recent Revenue 2013-2017
7.10.2 Kellogg Analysis
7.10.3 Kellogg Regional Emphasis/Focus
7.10.4 Kellogg Mergers & Acquisitions
7.11 Nestle Overview
7.11.1 Nestle Recent Revenue 2013-2017
7.11.2 Nestle Analysis
7.11.3 Nestle Regional Emphasis/Focus
7.11.4 Nestle Mergers & Acquisitions
7.12 Orkla Group Overview
7.12.1 Orkla Group Recent Revenue 2013-2017
7.12.2 Orkla Group Geographical Spread of Employees 2017
7.13 PepsiCo Overview
7.13.1 PepsiCo Recent Revenue 2013-2017
7.13.2 PepsiCo Analysis
7.13.3 PepsiCo Regional Emphasis/Focus
7.14 Raisio Group Overview
7.14.1 Raisio Group Recent Revenue 2013-2017
7.14.2 Raisio Group Analysis
7.14.3 Raisio Group Regional Emphasis/Focus
7.14.4 Raisio Group Mergers & Acquisitions
7.15 Royal FrieslandCampina N.V. Overview
7.15.1 Royal FrieslandCampina N.V. Recent Revenue 2013-2017
7.15.2 Royal FrieslandCampina N.V. Analysis
7.15.3 Royal FrieslandCampina N.V. Regional Emphasis/Focus
7.15.4 Royal FrieslandCampina N.V. Key Developments in 2017
7.16 Other Leading Companies In The Functional Foods Market and the Superfoods Industry
8. Conclusions & Recommendations
8.1 Functional Foods Market Outlook
8.2 Self Diagnosed Consumers As A Target Buyer Of Functional Foods
8.3 E-Commerce and the Use of Internet
8.4 Taste and Convenience
8.5 Product Tailoring
8.6 Educating and Communicating with Consumers
8.7 Key Findings
8.7.1 Leading Functional Foods Submarkets
8.7.2 Leading Regional Functional Foods Markets
8.7.3 Leading National Functional Foods Markets
9. Glossary
Associated Visiongain Reports
Visiongain Report Sales Order Form
Appendix A
About Visiongain
Appendix B
Visiongain Report Evaluation Form
List of Figures
Figure 1.1 UK Functional Foods Market Forecast 2018-2028 ($bn, AGR%)
Figure 1.2 Global Functional Foods Market Segmentation 2018
Figure 2.1 Natural Superfoods
Figure 2.2 Antioxidants at Work
Figure 2.3 Functional Food & Drink Market Segments 2018 ($bn)
Figure 2.4 The Overlap Of “Superfoods” With Other Food Markets
Figure 3.1 Global Functional Foods Market Forecast 2018-2028 ($bn, AGR%)
Figure 3.2 Global Functional Foods Market Drivers and Restrains
Figure 4.1 Leading Functional Foods Submarket Forecasts 2018-2028 ($bn, AGR%)
Figure 4.2 Leading Functional Foods Submarket AGR Forecasts 2018-2028 (AGR %)
Figure 4.3 Leading Functional Foods Submarkets Shares Forecast 2018 (% Share)
Figure 4.4 Leading Functional Foods Submarkets Shares Forecast 2023 (% Share)
Figure 4.5 Leading Functional Foods Submarkets Shares Forecast 2028 (% Share)
Figure 4.6 Functional Dairy Market Forecast 2018-2028 ($bn, AGR%)
Figure 4.7 Functional Dairy Market Share Forecast 2018, 2023 and 2028 (% Share)
Figure 4.8 Functional Bakery & Cereal Market Forecast 2018-2028 ($bn, AGR%)
Figure 4.9 Functional Bakery & Cereal Submarket Share Forecast 2018, 2023 and 2028 (% Share)
Figure 4.10 Functional Baby Food Market Forecast 2018-2028 ($bn, AGR%)
Figure 4.11 Functional Baby Food Market Share Forecast 2018, 2023 and 2028 (% Share)
Figure 4.12 Functional Fats & Oils Market Forecast 2018-2028 ($bn, AGR%)
Figure 4.13 Functional Fats & Oils Market Share Forecast 2018, 2023 and 2028 (% Share)
Figure 4.14 Functional Meat, Fish & Eggs Market Forecast 2018-2028 ($bn, AGR%)
Figure 4.15 Functional Meat, Fish & Eggs Market Share Forecast 2018, 2023 and 2028 (% Share)
Figure 4.16 Other Functional Foods Market Forecast 2018-2028 ($bn, AGR%)
Figure 4.17 Other Functional Foods Market Share Forecast 2018, 2023 and 2028 (% Share)
Figure 5.1 Regional Functional Foods Market Forecasts 2018-2028 ($bn, AGR%)
Figure 5.2 Regional Functional Foods Market AGR Forecasts 2018-2028 (AGR%)
Figure 5.3 Regional Functional Foods Market Share Forecast 2018 (% Share)
Figure 5.4 Regional Functional Foods Markets Share Forecast 2023 (% Share)
Figure 5.5 Regional Functional Foods Market Share Forecast 2028 (% Share)
Figure 5.6 Regional Functional Foods & Beverages Market Share Distribution 2002 (% Share)
Figure 5.7 Regional Functional Foods & Beverages Market Share Distribution 2008 (% Share)
Figure 5.8 North American Functional Foods Market Forecast 2018-2028 ($bn, AGR%)
Figure 5.9 North American Functional Foods Market Share Forecast 2018, 2023 and 2028 (% Share)
Figure 5.10 South American Functional Foods Market Forecast 2018-2028 ($bn, AGR%)
Figure 5.11 South American Functional Foods Market Share Forecast 2018, 2023 and 2028 (% Share)
Figure 5.12 Western European Functional Foods Market Forecast 2018-2028 ($bn, AGR%)
Figure 5.13 Western European Functional Foods Market Share Forecast 2018, 2023 and 2028 (% Share)
Figure 5.14 Eastern European Functional Foods Market Forecast 2018-2028 ($bn, AGR%)
Figure 5.15 Eastern European Functional Foods Market Share Forecast 2018, 2023 and 2028 (% Share)
Figure 5.16 Asia-Pacific Functional Foods Market Forecast 2018-2028 ($bn, AGR%)
Figure 5.17 Asia-Pacific Functional Foods Market Share Forecast 2018, 2023 and 2028 (% Share)
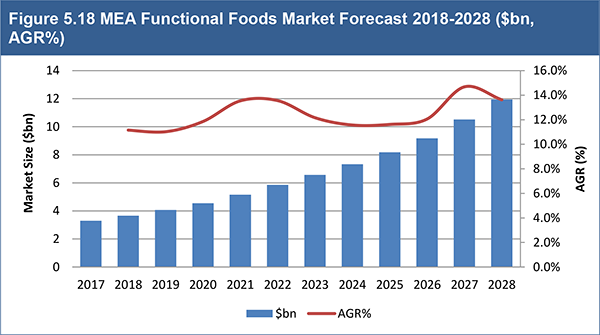
Figure 5.18 MEA Functional Foods Market Forecast 2018-2028 ($bn, AGR%)
Figure 5.19 MEA Functional Foods Market Share Forecast 2018, 2023 and 2028 (% Share)
Figure 6.1 Leading National Functional Foods Market Forecasts 2018-2028 ($bn, AGR%)
Figure 6.2 Leading National Functional Foods Market AGR Forecasts 2018-2028 (AGR%)
Figure 6.3 Leading National Functional Foods Market Share Forecast 2018 (% Share)
Figure 6.4 Leading National Functional Foods Market Share Forecast 2023 (% Share)
Figure 6.5 Leading National Functional Foods Market Share Forecast 2028 (% Share)
Figure 6.6 US Functional Foods Market Forecast 2018-2028 ($bn, AGR%)
Figure 6.7 US Functional Foods Market Share Forecast 2018, 2023 and 2028 (% Share)
Figure 6.8 Canadian Functional Foods Market Forecast 2018-2028 ($bn, AGR%)
Figure 6.9 Canadian Functional Foods Market Share Forecast 2018, 2023 and 2028 (% Share)
Figure 6.10 Mexican Functional Foods Market Forecast 2018-2028 ($bn, AGR%)
Figure 6.11 Mexican Functional Foods Market Share Forecast 2018, 2023 and 2028 (% Share)
Figure 6.12 Brazilian Functional Foods Market Forecast 2018-2028 ($bn, AGR%)
Figure 6.13 Brazilian Functional Foods Market Share Forecast 2018, 2023 and 2028 (% Share)
Figure 6.14 UK Functional Foods Market Forecast 2018-2028 ($bn, AGR%)
Figure 6.15 UK Functional Foods Market Share Forecast 2018, 2023 and 2028 (% Share)
Figure 6.16 German Functional Foods Market Forecast 2018-2028 ($bn, AGR%)
Figure 6.17 German Functional Foods Market Share Forecast 2018, 2023 and 2028 (% Share)
Figure 6.18 Japanese Functional Foods Market Forecast 2018-2028 ($bn, AGR%)
Figure 6.19 Functional Foods Market Share Forecast 2018, 2023 and 2028 (% Share)
Figure 6.20 UAE Functional Foods Market Forecast 2018-2028 ($bn, AGR%)
Figure 6.21 UAE Functional Foods Market Share Forecast 2018, 2023 and 2028 (% Share)
Figure 6.22 China Functional Foods Market Forecast 2018-2028 ($bn, AGR%)
Figure 6.23 China Functional Foods Market Share Forecast 2018, 2023 and 2028 (% Share)
Figure 6.24 India Functional Foods Market Forecast 2018-2028 ($bn, AGR%)
Figure 6.25 India Functional Foods Market Share Forecast 2018, 2023 and 2028 (% Share)
Figure 6.26 RoW Functional Foods Market Forecast 2018-2028 ($bn, AGR%)
Figure 6.27 RoW Functional Foods Market Share Forecast 2018, 2023 and 2028 (% Share)
Figure 7.1 Abbott Laboratories Revenue by Business Segments 2017 (% Share)
Figure 7.2 Abbott Laboratories Historic Revenue 2013-2017 ($m, AGR%)
Figure 7.3 Abbott Laboratories Regional Emphasis/ Focus 2017 (% Share)
Figure 7.4 ADM Revenue by Business Segment 2017 (% Share)
Figure 7.5 ADM Recent Revenue 2013-2017 ($m, AGR%)
Figure 7.6 ADM Regional Emphasis/Focus 2017 (% Share)
Figure 7.7 Arla Business Segments and Revenue from the Segments 2017 (% Share)
Figure 7.8 Arla Revenue by Country 2017 (% Share)
Figure 7.9 Arla Recent Revenue 2013-2017 ($m, AGR%)
Figure 7.10 BASF Revenue by Business Segments 2017 (% Share)
Figure 7.11 BASF Recent Revenue 2013-2017 ($m, AGR%)
Figure 7.12 BASF Regional Emphasis/ Focus 2017 (% Share)
Figure 7.13 Dean Food Revenue by Business Segments 2017 (% Share)
Figure 7.14 Dean Foods Historic Revenue 2013-2017 ($m, AGR%)
Figure 7.15 Danone Revenue by Business Segments 2017 ($bn, % Share)
Figure 7.16 Danone Recent Revenue 2013-2017 ($m, AGR%)
Figure 7.17 Danone Regional Emphasis/ Focus 2017 (% Share)
Figure 7.18 General Mills Revenue by Business Segments 2017 (% Share)
Figure 7.19 General Mills Sales by Product Category 2017 (% Share)
Figure 7.20 General Mills Recent Revenue 2013-2017 ($m, AGR%)
Figure 7.21 General Mills Regional Emphasis/ Focus 2017 (% Share)
Figure 7.22 Glanbia plc Historic Revenue 2013-2017 ($m, AGR%)
Figure 7.23 Glanbia plc Regional Emphasis/ Focus 2017 (% Share)
Figure 7.24 GlaxoSmithKline plc Revenue by Business Segments 2017 (% Share)
Figure 7.25 GlaxoSmithKline plc Revenue by Consumer Healthcare Business Segments 2017 (% Share)
Figure 7.26 GlaxoSmithKline plc Historic Revenue 2013-2017 ($m, AGR%)
Figure 7.27 GlaxoSmithKline plc Geographical Spread of Employees 2017 (% Share)
Figure 7.28 Kellogg Revenue by Business Segments 2017 ($m, % Share)
Figure 7.29 Kellogg Revenue by Product Category 2017 (% Share)
Figure 7.30 Kellogg Historic Revenue 2013-2017 ($m, AGR%)
Figure 7.31 Kellogg Regional Emphasis/ Focus 2017 (% Share)
Figure 7.32 Nestle Products Revenue from Segments 2017 (% Share)
Figure 7.33 Nestle Historic Revenue 2013-2017 ($m, AGR%)
Figure 7.34 Nestle Regional Emphasis/ Focus 2017 (% Share)
Figure 7.35 Nestle Sales by Country 2017 (% Share)
Figure 7.36 Orkla Group Revenue by Business Segments 2017 (% Share)
Figure 7.37 Orkla Group Historic Revenue 2013-2017 ($m, AGR%)
Figure 7.38 Orkla Group Regional Emphasis/ Focus 2017 (% Share)
Figure 7.39 PepsiCo Revenue by Business Segments 2017 (% Share)
Figure 7.40 PepsiCo Recent Revenue 2013-2017 ($m, AGR%)
Figure 7.41 PepsiCo Regional Emphasis/ Focus 2017 (% Share)
Figure 7.42 Royal FrieslandCampina N.V. Historic Revenue 2013-2017 ($m, AGR%)
Figure 7.43 Raisio Group Regional Emphasis/ Focus 2017 (% Share)
Figure 7.44 Royal FrieslandCampina N.V. Historic Revenue 2013-2017 ($m, AGR%)
Figure 7.45 Royal FrieslandCampina N.V. Regional Emphasis/ Focus 2017 (% Share)
Figure 8.1 Top 3 Largest Functional Foods Submarkets 2018, 2023 and 2028 ($bn)
Figure 8.2 Top 3 Fastest Growing Functional Foods Submarkets 2018-2028 (AGR %)
Figure 8.3 Top 3 Largest Regional Functional Foods Markets 2018, 2023 and 2028 ($bn)
Figure 8.4 Top 3 Fastest Growing Regional Functional Foods Markets 2018-2028 (AGR %)
Figure 8.5 Top 3 Largest National Functional Foods Markets 2018, 2023 and 2028 ($bn)
Figure 8.6 Top 3 Fastest Growing National Functional Foods Markets 2018-2028 (AGR %)
List of Tables
Table 1.1 Regional Functional Foods Markets Forecasts 2018-2028 ($bn, AGR%)
Table 2.1 Foods for Specific Health Use Products Approved by the Japanese MHLW (Specified Health Uses, Principal Ingredients)
Table 2.2 B Vitamins (Vitamin, Function, Dietary Source)
Table 2.3 EU Regulation on Nutrition And Health Claims Made On Food
Table 2.4 The List Of “Superfoods” (Product, Benefit)
Table 3.1 Global Functional Foods Market Forecast 2018-2028 ($bn, AGR%, CAGR%)
Table 4.1 Leading Functional Foods Submarket Forecasts 2018-2028 ($bn, AGR%)
Table 4.2 Functional Dairy Market Forecast 2018-2028 ($bn, AGR%, CAGR%)
Table 4.3 Functional Bakery & Cereal Market Forecast 2018-2028 ($bn, AGR%, CAGR%)
Table 4.4 Functional Baby Food Market Forecast 2018-2028 ($bn, AGR%, CAGR%)
Table 4.5 Functional Fats & Oils Market Forecast 2018-2028 ($bn, AGR%, CAGR%)
Table 4.6 Functional Meat, Fish & Eggs Market Forecast 2018-2028 ($bn, AGR%, CAGR%)
Table 4.7 Other Functional Foods Market Forecast 2018-2028 ($bn, AGR%, CAGR%)
Table 5.1 Regional Functional Foods Market Forecasts 2018-2028 ($bn, AGR%)
Table 5.2 North American Functional Foods Market Forecast 2018-2028 ($bn, AGR%, CAGR %)
Table 5.3 South American Functional Foods Market Forecast 2018-2028 ($bn, AGR%, CAGR %)
Table 5.4 Western European Functional Foods Market Forecast 2018-2028 ($bn, AGR%, CAGR %)
Table 5.5 Eastern European Functional Foods Market Forecast 2018-2028 ($bn, AGR%, CAGR %)
Table 5.6 Asia-Pacific Functional Foods Market Forecast 2018-2028 ($bn, AGR%, CAGR %)
Table 5.7 MEA Functional Foods Market Forecast 2018-2028 ($bn, AGR%, CAGR %)
Table 6.1 Leading National Functional Foods Markets Forecasts 2018-2028 ($bn, AGR%)
Table 6.2 US Functional Foods Market Forecast 2018-2028 ($bn, AGR%, CAGR %)
Table 6.3 Canadian Functional Foods Market Forecast 2018-2028 ($bn, AGR%, CAGR %)
Table 6.4 Mexican Functional Foods Market Forecast 2018-2028 ($bn, AGR%, CAGR %)
Table 6.5 Brazilian Functional Foods Market Forecast 2018-2028 ($bn, AGR%, CAGR %)
Table 6.6 UK Functional Foods Market Forecast 2018-2028 ($bn, AGR%, CAGR %)
Table 6.7 German Functional Foods Market Forecast 2018-2028 ($bn, AGR%, CAGR %)
Table 6.8 Japanese Functional Foods Market Forecast 2018-2028 ($bn, AGR%, CAGR %)
Table 6.9 UAE Functional Foods Market Forecast 2018-2028 ($bn, AGR%, CAGR %)
Table 6.10 China Functional Foods Market Forecast 2018-2028 ($bn, AGR%, CAGR %)
Table 6.11 India Functional Foods Market Forecast 2018-2028 ($bn, AGR%, CAGR %)
Table 6.12 RoW Functional Foods Market Forecast 2018-2028 ($bn, AGR%, CAGR %)
Table 7.1 Abbott Laboratories Overview 2017 (Total Revenue ($m), Ticker, HQ, IR Contact, Website)
Table 7.2 Abbott Laboratories Revenue by Business Segments 2017 ($m, % Share)
Table 7.3 Abbott Laboratories Recent Revenue 2013-2017 ($m, AGR%)
Table 7.4 Abbott Laboratories M&A (Company, Business Focus, Completion date, Currency, Acquisition price)
Table 7.5 ADM Overview (Total Revenue ($m), Ticker, HQ, IR Contact, Website) 2017
Table 7.6 ADM Revenue by Business Segment 2017 ($m, % Share)
Table 7.7 ADM Recent Revenue 2013-2017 ($m, AGR%)
Table 7.8 ADM Products/Services 2017 (Product/Service, Description)
Table 7.9 ADM M&A (Company, Business Focus, Completion date, Currency, Acquisition price)
Table 7.10 Arla Foods Overview 2017 (Total Revenue ($m), HQ, IR Contact, Website)
Table 7.11 Arla Business Segments and Revenue from the Segments 2017 ($m, % Share)
Table 7.12 Arla Revenue Split by Country 2017 ($m, % Share)
Table 7.13 Arla Recent Revenue 2013-2017 ($m, AGR%)
Table 7.14 Arla Brand/Products 2018 (Brand/Product, Description)
Table 7.15 BASF Overview 2017 (Total Revenue ($m), Ticker, HQ, IR Contact, Website)
Table 7.16 BASF Revenue by Business Segments 2017 ($m, % Share)
Table 7.17 BASF Recent Revenue 2013-2017 ($m, AGR%)
Table 7.18 BASF M&A (Company, Business Focus, Completion date, Currency, Acquisition price)
Table 7.19 Dean Foods Overview 2017 (Total Revenue ($m), Ticker, HQ, IR Contact, Website)
Table 7.20 Dean Food Revenue by Business Segments 2017 ($m, % Share)
Table 7.21 Dean Foods Recent Revenue 2013-2017 ($m, AGR%)
Table 7.22 Danone Overview 2017 (Total Revenue ($m), Ticker, HQ, IR Contact, Website)
Table 7.23 Danone Revenue by Business Segments 2017 ($bn, % Share)
Table 7.24 Danone Recent Revenue 2013-2017 ($m, AGR%)
Table 7.25 Danone M&A (Company, Business Focus, Completion date, Currency, Acquisition price)
Table 7.26 General Mills Overview 2017 (Total Revenue ($m), Ticker, HQ, IR Contact, Website)
Table 7.27 General Mills Revenue by Business Segments 2017 ($m, % Share)
Table 7.28 General Mills Sales by Product Category 2017 ($m, % Share)
Table 7.29 General Mills Recent Revenue 2013-2017 ($m, AGR%)
Table 7.30 General Mills M&A (Company, Business Focus, Completion date, Currency, Acquisition price)
Table 7.31 Glanbia plc Overview 2017 (Total Revenue ($m), Ticker, HQ, IR Contact, Website)
Table 7.32 Glanbia plc Revenue by Business Segments 2017 ($m, % Share)
Table 7.33 Glanbia plc Recent Revenue 2013-2017 ($m, AGR%)
Table 7.34 Glanbia plc M&A (Company, Business Focus, Completion date, Currency, Acquisition price)
Table 7.35 GlaxoSmithKline plc Overview 2017 (Total Revenue ($m), Ticker, HQ, IR Contact, Website)
Table 7.36 GlaxoSmithKline plc Revenue by Business Segments 2017 ($m, % Share)
Table 7.37 GlaxoSmithKline plc Revenue by Consumer Healthcare Segments 2017 (% Share)
Table 7.38 GlaxoSmithKline plc Recent Revenue 2013-2017 ($m, AGR%)
Table 7.39 Kellogg Overview 2017 (Total Revenue ($m), Ticker, HQ, IR Contact, Website)
Table 7.40 Kellogg Revenue by Business Segments 2017 ($m, % Share)
Table 7.41 Kellogg Revenue by Product Category 2017 ($m, % Share)
Table 7.42 Kellogg Recent Revenue 2013-2017 ($m, AGR%)
Table 7.43 Kellogg M&A (Company, Business Focus, Completion date, Currency, Acquisition price)
Table 7.44 Nestle Overview 2017 (Total Revenue ($m), Ticker, HQ, IR Contact, Website)
Table 7.45 Employees by Geographic Area 2017 (% Share)
Table 7.46 Nestle Products Revenue from Segments 2017 ($m, % Share)
Table 7.47 Nestle Recent Revenue 2013-2017 ($m, AGR%)
Table 7.48 Nestle M&A (Company, Business Focus, Completion date, Currency, Acquisition price)
Table 7.49 Orkla Group Overview 2017 (Total Revenue ($m), Ticker, HQ, IR Contact, Website)
Table 7.50 Orkla Group Revenue by Business Segments 2017 ($m, % Share)
Table 7.51 Orkla Group Recent Revenue 2013-2017 ($m, AGR%)
Table 7.52 PepsiCo Overview 2017 (Total Revenue ($m), Ticker, HQ, IR Contact, Website)
Table 7.53 PepsiCo Revenue by Business Segments 2017 ($m, % Share)
Table 7.54 PepsiCo Recent Revenue 2013-2017 ($m, AGR%)
Table 7.55 Raisio Group Overview 2017 (Total Revenue ($m), Ticker, HQ, IR Contact, Website)
Table 7.56 Raisio Group Revenue by Business Segments 2017 ($m, % Share)
Table 7.57 Raisio Group Recent Revenue 2013-2017 ($m, AGR%)
Table 7.58 Raisio Group M&A (Company, Business Focus, Completion date, Currency, Acquisition price)
Table 7.59 Royal FrieslandCampina N.V. Overview 2017 (Total Revenue ($m), Ticker, HQ, IR Contact, Website)
Table 7.60 Royal FrieslandCampina N.V. Recent Revenue 2013-2017 ($m, AGR%)
Table 7.61 Royal FrieslandCampina N.V. Key developments in 2017
Table 7.62 Other Leading Companies in The Functional Foods Market 2018 (Company Name, Product/Service)
Table 7.63 Leading Superfoods Companies 2018 (Company name, Product/Service)
Aduna Ltd
Aesthetic
Aggelakis S.A.
Alara Wholefoods Ltd
Alere Inc.
Alimentos Sanygran S.L.
AlpiPan S.r.l.
Alpro
Alterial Les Recettes de Celiane
Alternis Sàrl
Amazing Grass
Amazon
Andros Group
Annie’s, Inc
Archer Daniels Midland (ADM)
Arla Foods
Aston Foods and Food Ingredients
Atrium Innovations
Balsajo Black Garlic (UK) Ltd
Balviten Sp.z.o.o
BASF SE
Benecol Business
BetterBody Foods
Big Bear Group
Bioalimenta SRL
Bioferme oy
Biogran
Biotrap
Biovegan GmbH
Bisco Misr
Blue Bottle Coffee
Bonvita B.V.
Bo-Shin Flavors & Food Ingredients Ins
Botaniex, Inc.
Bravo Europe
C. Hahne Muhlenwerke GmbH
Centrale Danone
CFR Pharmaceuticals
Chameleon Cold-Brew
Chamtor SA
Changsha Gree Biotechnology Co. Ltd.
Chicago Bar Company LLC
Chr. Hansen
Cilag GmbH International
Creative Nature
Damhert Nutrition nv
Danone
De Halm
Dean Foods
Devondale Murray Goulburn
Domretor
Eaststarch C.V
Facundo Blanco S.A.
Fitplein.nl B.V.
Galderma
Geneferm Biotechnology
General Mills
Gilro LTD
Glanbia plc.
GlaxoSmithKline plc (GSK)
Grass Advantage LLC (Amazing Grass)
Green Island International TCM Group Ltd
Groupe Danone
Groupe Lactalis
Halayeb
Hanmi Natural Nutrition Co., Ltd
Harke Group
Healthy Foods Supplies LTD
Hi-Food Spa
Hion Ltd
IDEV Technologies
Insect Biotech
IREKS GmbH
Jentschura International GmbH
Kellogg Co
Kiantama Oy
Kirin Holdings Company Ltd
Koninklijke DSM N.V.
Kreglinger Europe
Lanxess Aktiengesellschaft
LB Bulgaricum
Leader Foods Oy
Lifefood Czech Republic s.r.o.
Lifeplan Ltd
Linwoods Health Foods
Loaf Of Nature
Lucy Bee
Lyckeby Starch AB
Mass Foods
Mattisson Healthcare
Medical
Megmilk snow brand Co
Merric Pet Care
Natureal
Natures Aid Ltd
Natures Happiness
Naturya
Navitas Naturals
Nestle
Novotech Nutraceuticals, Inc.
Nurture Inc.
Nutrisens SAS
Nutrition Dynamics
Of The Earth Superfoods
OptiMedica Corporation
Orgain, Inc
Organic Burst World S.A.
Origin Earth Ltd.
Originall
Orkla Group
Orkla Health AS
Oskri Corp
Otsuka Pharmaceutical Co., Ltd
PepsiCo
Pfizer Nutrition
Pharmacare Europe Ltd
Primal Food Ltd
Puratos NV
Quegen Biotech
Raisio Group
Rcl Foods
Ritmo Investimentos
Royal FrieslandCampina N.V.
Sinorey Foods Co., Ltd.
Specialty Commodities Inc
St. Jude
Standard Functional Foods Group, Inc.
Stonegate
Suntory
Super Foodies
Superfoods and more Wholesale
Superfruit Scandinavia AB
SuperLife Ltd
Tendyne Holdings, Inc
The Green Labs LLC
The Isopure Company, LLC
thinkThin, LLC
Toda Kogyo Corp.
Unilever
Valio
Veropharm
Vivatinell
Wal-Mart Stores, Inc.
WhiteWave
WILD Flavours
Xi'an Aquar Technoplogy & Business Co.,Ltd.
Zingology Ltd.
List of Organisations Mentioned in this Report
European Food Safety Authority (EFSA)
Food Safety and Standards Authority of India (FSSAI)
Japanese Food Safety Commission
Japanese Ministry of Education, Science and Culture
Japanese Ministry of Health, Labour, and Welfare (MHLW)
Japanese Pharmaceutical Affairs and Food Sanitation Council
National Health Surveillance Agency (ANVISA)
Organisation for Economic Co-operation and Development (OECD)
State Council Legislative Office (SCLO) China
The Brazilian Association of Foods for Special Purposes and Congeners (ABIAD)
The Committee for Scientific and Technical Assessment of Functional and New Foods (CTCAF)
The Mexican Government
Tufts University
U.S. Food and Drug Administration (FDA)
UK NHS
World Health Organization (WHO)
Download sample pages
Complete the form below to download your free sample pages for Functional Foods Market Report 2018-2028
Related reports
-
Global Coffee Market Report 2019-2029
The latest report from business intelligence provider Visiongain offers comprehensive analysis of the global coffee market. Visiongain assesses that this...Full DetailsPublished: 02 July 2019 -

Wellness Supplements Market 2018-2028
The wellness market is expected to grow at a CAGR of 5.5% in the first half of the forecast period....Full DetailsPublished: 31 August 2018 -

Global Low / Zero Alcohol Beer and Wine Market Report 2019-2029
The global low/zero alcohol beer and wine market is estimated to reach $2.5bn in 2024. The beer submarket is expected...
Full DetailsPublished: 18 February 2019 -

Global Poultry Feed Market Forecast 2019-2029
The global poultry feed market is estimated to reach $322bn in 2024. ...Full DetailsPublished: 16 January 2019 -
Global Yeast Market Report 2018-2028
The global yeast market is expected to grow at a CAGR of 8.9% in the first half of the forecast...
Full DetailsPublished: 13 July 2018 -

High Pressure Processing (HPP) Equipments and Foods Market 2018-2028
The horizontal food HPP Equipment submarket held 81% share of the HPP Equipments market in 2017. This submarket is estimated...
Full DetailsPublished: 18 June 2018 -

Global Probiotics Market Forecast 2018-2028
The global probiotics market reached $43bn in 2017 and is estimated to reach $59bn by 2022. In 2017, the bacterial...
Full DetailsPublished: 29 October 2018 -
Speciality Coffee Market Report 2019-2029
With global, national/regional, and submarket estimates for the speciality coffee market, this report covers key aspects of this market. In...
Full DetailsPublished: 19 December 2018 -
Speciality Coffee Market Report 2020-2030
With global, national/regional, and submarket estimates for the speciality coffee market, this report covers key aspects of this market. In...
Full DetailsPublished: 19 September 2019 -

Global Food Packaging Equipment Market 2018-2028
Visiongain comprehensive new 122-page report assesses that the global food packaging equipment market will be valued at $16bn in 2017....Full DetailsPublished: 01 February 2018
Download sample pages
Complete the form below to download your free sample pages for Functional Foods Market Report 2018-2028
Do you have any custom requirements we can help you with?
Any specific country, geo region, market segment or specific company information?
Email us today, we can discuss your needs and see how we can help: jamie.roberts@visiongain.com
Would you like a free report overview of the report of your choice? If so, please drop an email to Jamie Roberts stating your chosen report title to jamie.roberts@visiongain.com
Visiongain food & drink reports are compiled using a broad and rich mixture of both primary and secondary information to produce an overall industry outlook. In order to provide our clients with the best product possible product, we do not rely on any one single source of information. Visiongain analysts reach out to market-leading vendors, carriers, service providers and industry experts but also review a wealth of financial data and product information from a vast range of sources. To find out more about our reports methodology, please email jamie.roberts@visiongain.com
Would you like to get the latest Visiongain food & drink reports catalogue? What are the dynamic growth sectors? where are the regional business opportunities? Which technologies will prevail and who are the leading companies succeeding in these sectors and why? If you want definitive answers to business critical questions, discover Visiongain’s full range of business intelligence reports. If so, please email Jamie Roberts on jamie.roberts@visiongain.com or call her today on +44 207 336 6100
Assured Food Standards
Europatat
Federation of Oils, Seeds and Fats Associations
Food and Drink Federation
Food & Drink Federation
Grain and Feed Trade Association
Freshfel Europe
International Dairy-Deli-Bakery Association
Meat Industry Association of New Zealand
National Frozen & Refrigerated Foods Association
Produce Marketing Association
TURYID
U.S. Poultry & Egg Association
Latest Food and Drink news
Visiongain Publishes Commercial Greenhouse Market Report 2024-2034
The global Commercial Greenhouse market was valued at US$38.02 billion in 2023 and is projected to grow at a CAGR of 8.3% during the forecast period 2024-2034.
09 April 2024
Visiongain Publishes Vertical Farming Market Report 2023-2033
The global Vertical Farming market was valued at US$5.4 billion in 2022 and is projected to grow at a CAGR of 22% during the forecast period 2023-2033.
31 July 2023
Visiongain Publishes Industrial Enzymes Market Report 2023-2033
The global industrial enzymes market was valued at US$6.42 billion in 2022 and is projected to grow at a CAGR of 6.8% during the forecast period 2023-2033.
06 June 2023
Visiongain Publishes Agricultural Robots Market Report 2023-2033
The global Agricultural Robots market was valued at US$12.8 billion in 2022 and is projected to grow at a CAGR of 25.3% during the forecast period 2023-2033.
31 May 2023
