The global yeast market is expected to grow at a CAGR of 8.9% in the first half of the forecast period. In 2017, the baker’s yeast segment held the largest share in the global yeast market.
How this report will benefit you
Read on to discover how you can exploit the future business opportunities emerging in this sector.
In this brand new 135-page report you will receive 142 charts– all unavailable elsewhere.
The 135-page report provides clear detailed insight into the global yeast market. Discover the key drivers and challenges affecting the market.
By ordering and reading our brand-new report today you stay better informed and ready to act.
Report Scope
• Global Yeast market forecasts from 2018-2028
• This report also breaks down the revenue forecast for the global yeast market by type:
– Baker’s Yeast
– Brewer’s Yeast
– Wine Yeast
– Feed Yeast
– Bioethanol
– Others
Each submarket is further broken down by region: North America, Europe, Asia-Pacific, South America, Africa and Middle East
• This report also breaks down the revenue forecast for the global yeast market by form:
– Dry Yeast
– Instant Yeast
– Fresh Yeast
– Others
Each submarket is further broken down by region: North America, Europe, Asia-Pacific, South America, Africa and Middle East
• This report also breaks down the revenue forecast for the global yeast market by application:
– Food: Bakery, Beverages, Processed & Convenience Foods
– Feed
– Others
Each submarket is further broken down by region: North America, Europe, Asia-Pacific, South America, Africa and Middle East
• This report also breaks down the revenue forecast for the global specialty yeast market by type:
– Yeast Extracts
– Yeast Autolysates
– Beta Glucan
– Other Yeast Derivatives
• This report also breaks down the revenue forecast for the global specialty yeast market by region:
– North America
– Europe
– Asia-Pacific
– South America
– Africa
– Middle East
• This report provides individual revenue forecasts to 2028 for these regional and national markets:
– North America: US, Canada, Mexico
– Europe: Germany, France, the UK, Italy, Spain, Rest of Europe
– Asia-Pacific: China, Japan, India, Australia, Rest of Asia-Pacific
– South America: Brazil, Argentina, Rest of South America
– Africa: South Africa, Rest of Africa
– Middle East: Saudi Arabia, U.A.E, Rest of Middle East
Each region is further broken down by country, type, form, and application.
• Our study gives qualitative analysis of the yeast market. It discusses the Drivers and Restraints that influence this market as well as the Porter’s Five Forces Analysis of the yeast market.
• Our study discusses the selected leading companies that are the major players in the yeast industry:
– Alltech
– Angel Yeast Co., Ltd.
– Associated British Foods plc
– Chr. Hansen A/S
– Koninklijke DSM N.V.
– Lallemand Inc.
– Leiber GmbH
– Lesaffre Group
– Sensient Technologies
– Synergy Flavors
Visiongain’s study is intended for anyone requiring commercial analyses for the global yeast market. You find data, trends and predictions.
Get our report today Global Yeast Market Analysis: Baker’s Yeast, Brewer’s Yeast, Wine Yeast, Feed Yeast, Bioethanol, Dry Yeast, Instant Yeast, Fresh Yeast, Food, Feed, Bakery, Beverages, Processed & Convenience Foods, Yeast Extracts, Yeast Autolysates, Beta Glucan, Other Yeast Derivatives.
Visiongain is a trading partner with the US Federal Government
CCR Ref number: KD4R6
1. Report Overview
1.1 Market Definition
1.2 Why Should You Read This Report?
1.3 How This Report Delivers?
1.4 Key Questions Answered by This Analytical Report
1.5 Who Is This Report For?
1.6 Research Methodology
1.6.1 Primary Research
1.6.2 Secondary Research
1.6.3 Market Evaluation & Forecasting Methodology
1.7 Frequently Asked Questions (Faq)
1.8 Associated Visiongain Reports
1.9 About Visiongain
2. Introduction to The Yeast Market
2.1 What Is Yeast?
2.2 Global Yeast Market Segmentation
2.3 Global Yeast Market Overview
2.4 Market Drivers
2.4.1 Growing Demand for Bakery Products and Increasing Alcohol Consumption to Drive Global Yeast Market
2.4.2 Research & Development to Drive Innovative Usage of Yeast in Coming Years
2.4.3 Increasing Global Focus on Bioethanol as Renewable Source of Fuel
2.5 Market Restraints
2.5.1 Regulatory Restrictions on Use ff Red Yeast Extracts
2.5.2 Yeast Allergy to Restrain Consumer Preference for Yeast Based Products
2.6 Porter’s Five Forces Analysis
2.6.1 Internal Rivalry
2.6.2 Bargaining Power of Suppliers
2.6.3 Bargaining Power of Buyers
2.6.4 Threat of Substitutes
2.6.5 Threat of New Entrants
3. Global Yeast Market by Type, 2018-2028
3.1 Introduction
3.2 Baker’s Yeast
3.3 Brewer’s Yeast
3.4 Wine Yeast
3.5 Feed Yeast
3.6 Bioethanol Yeast
3.7 Others
4. Global Yeast Market by Form, 2018-2028
4.1 Introduction
4.2 Dry Yeast
4.3 Instant Yeast
4.4 Fresh Yeast
4.5 Others
5. Global Yeast Market by Application, 2018-2028
5.1 Introduction
5.1.1 Global Yeast Market By Application 2018-2028
5.2 Foods
5.2.1 Global Food Yeast Market, By Application, 2018-2028
5.2.1 Bakery
5.2.2 Beverages
5.2.3 Processed & Convenience Foods
5.2.3.1 Meat & Seafood Products
5.2.3.2 Dairy Products
5.2.3.3 Soups, Sauces, And Salad Dressings
5.2.3.4 Snack Foods
5.2.3.5 Others
5.3 Feed
5.4 Others
6. Global Specialty Yeast Market by Type, 2018-2028
6.1 Introduction
6.2 Yeast Extracts
6.3 Yeast Autolysates
6.4 Beta Glucan
6.5 Other Yeast Derivatives
7. Global Yeast Market by Species
7.1 Introduction
7.2 Saccharomyces Cerevisiae
7.3 Pichia Pastoris
7.4 Kluyveromyces
8. Global Yeast Market by Region, 2018–2028
8.1 Introduction
8.2 North America Yeast Market Forecast 2018-2028
8.3 Europe Yeast Market Forecast 2018-2028
8.4 Asia-Pacific Yeast Market Forecast 2018-2028
8.5 South America Yeast Market Forecast, 2018-2028
8.6 Africa Yeast Market, 2018-2028
8.7 Middle East Market Forecast, 2018-2028
9. Leading 10 Yeast Companies
9.1 Koninklijke Dsm N.V.
9.1.1 Koninklijke Dsm N.V.Total Company Sales 2013-2017
9.1.2 Koninklijke Dsm N.V.Sales by Segment of Business 2013-2017
9.1.3 Koninklijke Dsm N.V. Net Profit 2013-2017
9.1.4 Koninklijke Dsm N.V. Net Capital Expenditure 2013-2017
9.1.5 Koninklijke Dsm N.V. Cost of Research & Development 2013-2017
9.1.6 Koninklijke Dsm N.V. Number of Employees
9.1.7 Koninklijke Dsm N.V. Yeast Products
9.1.8 Koninklijke Dsm N.V. Primary Market Competitors 2018
9.1.9 Koninklijke Dsm N.V. Mergers & Acquisitions (M&A) Activity
9.1.10 Koninklijke Dsm N.V. Analysis
9.1.10.1 Dsm To Capitalize on The Potential Strong Growth of Dynamic Yeast Market
9.1.11 Koninklijke Dsm N.V. Future Outlook
9.2 Associated British Foods Plc
9.2.1 Associated British Foods Plc Total Company Sales 2013-2017
9.2.2 Associated British Foods Plc Sales by Segment Of Business 2013-2017
9.2.3 Associated British Foods Plc Net Profit 2013-2017
9.2.4 Associated British Foods Plc Cost of Research & Development 2013-2017
9.2.5 Associated British Foods Plc Number of Employees
9.2.6 Associated British Foods Plc Yeast Products
9.2.7 Associated British Foods Plc Primary Market Competitors 2017
9.2.8 Associated British Foods Plc Mergers & Acquisitions (M&A) Activity
9.2.9 Associated British Foods Plc Analysis
9.2.10 Associated British Foods Plc Future Outlook
9.3 Chr. Hansen A/S
9.3.1 Chr. Hansen A/S Total Company Sales 2013-2017
9.3.2 Chr. Hansen A/S Sales by Segment Of Business 2013-2017
9.3.3 Chr. Hansen A/S Net Profit 2013-2017
9.3.4 Chr. Hansen A/S Capital Expenditure 2013-2017
9.3.5 Chr. Hansen A/S Cost of Research & Development 2013-2017
9.3.6 Chr. Hansen A/S Sales by Geography 2013-2017
9.3.7 Chr. Hansen A/S Number of Employees
9.3.8 Chr. Hansen A/S Yeast Products
9.3.9 Chr. Hansen A/S Primary Market Competitors 2017
9.3.10 Chr Hansen A/S Mergers & Acquisitions (M&A) Activity
9.3.11 Chr. Hansen A/S Analysis& Future Outlook
9.4 Lesaffre Group
9.4.1 Lesaffre Group Yeast Products
9.4.2 Lesaffre Group Primary Market Competitors 2018
9.4.3 Lesaffre Group Mergers & Acquisitions (M&A) Activity
9.4.4 Lesaffre Group Analysis & Future Outlook
9.5 Lallemand Inc.
9.5.1 Lallemand Inc. Yeast Products
9.5.2 Lallemand Inc. Mergers & Acquisitions (M&A) Activity
9.5.3 Lallemand Inc. Analysis & Future Outlook
9.6 Sensient Technologies
9.6.1 Sensient Technologies Total Company Sales 2013-2017
9.6.2 Sensient Technologies Sales by Segment of Business 2013-2017
9.6.3 Sensient Technologies Net Earnings 2013-2017
9.6.4 Sensient Technologies Net Capital Expenditure 2013-2017
9.6.5 Sensient Technologies Cost of Research & Development 2013-2017
9.6.6 Sensient Technologies Number of Employees
9.6.7 Sensient Technologies Yeast Products
9.6.8 Sensient Technologies Primary Market Competitors 2016
9.6.9 Sensient Technologies Analysis & Future Outlook
9.7 Angel Yeast Co., Ltd.
9.7.1 Yeast Products
9.7.2 Angel Yeast Co., Ltd. Market Strategy
9.7.3 Angel Yeast Co., Ltd. Analysis& Future Outlook
9.8 Alltech Inc.
9.8.1 Yeast Products
9.8.2 Alltech Inc. Analysis& Future Outlook
9.9 Leiber Gmbh
9.9.1 Yeast Products
9.9.2 Leiber Gmbh Analysis& Future Outlook
9.10 Synergy Flavors
9.10.1 Yeast Products
9.10.2 Synergy Flavors Market Strategy
9.10.3 Synergy Flavours Analysis & Future Outlook
9.11 Other Companies Involved in The Yeast Market
10. Conclusions and Recommendations
10.1 Investing in Mature vs High Growth Markets
10.2 Application of Yeast in End-Use Industries
Appendices
Glossary
Associated Visiongain Reports
Visiongain Report Sales Order Form
About Visiongain
Visiongain Report Evaluation Form
List of Tables
Table 3.1 Global Yeast Market by Type, 2018-2028 ($m, AGR%, CAGR%)
Table 3.2 Global Yeast Market by Type and Region, 2018-2028 ($m)
Table 4.1 Global Yeast Market by Form, 2018-2028 ($m, AGR%, CAGR%)
Table 4.2 Global Yeast Market by Form, Breakdown by Region 2018-2028 ($m, Global AGR %, CAGR %)
Table 5.1 Global Yeast Market by Application, 2018-2028 ($m, AGR %, CAGR %)
Table 5.2 Global Food Yeast Market by Application 2018-2028 ($M, AGR %, CAGR %)
Table 5.3 Global Yeast Market by Applications, Breakdown by Region, 2018-2028 ($m, Global AGR %, CAGR %)
Table 6.1 Global Specialty Yeast Market by Type, 2018-2028 ($m, AGR %, CAGR %)
Table 6.2 Global Specialty Yeast Market by Region, 2018-2028 ($m, AGR %, CAGR %)
Table 8.1 North America Yeast Market, by Country, 2018-2028 ($m, AGR %, CAGR %)
Table 8.2 North America Specialty Yeast Market, by Country, 2018-2028 ($m, AGR %, CAGR %)
Table 8.3 North America Yeast Market by Form, 2018-2028 ($m, AGR %, CAGR %)
Table 8.4 North America Yeast Market by Application, 2018-2028 ($m, AGR %, CAGR %)
Table 8.5 Europe Yeast Market by Country, 2018-2028 ($m, AGR %, CAGR %)
Table 8.6 Europe Specialty Yeast Market by Country, 2018-2028 ($m, AGR %, CAGR %)
Table 8.7 Europe Yeast Market by Form, 2018-2028 ($m, AGR %, CAGR %)
Table 8.8 Europe Yeast Market by Application, 2018-2028 ($m, AGR %, CAGR %)
Table 8.9 Asia-Pacific Yeast Market by Country, 2018-2028 ($m, AGR %, CAGR %)
Table 8.10 Asia-Pacific Specialty Yeast Market by Country, 2018-2028 ($m, AGR %, CAGR %)
Table 8.11 Asia-Pacific Yeast Market, by Form, 2018-2028 ($m, AGR %, CAGR %)
Table 8.12 Asia-Pacific Yeast Market, by Application, 2018-2028 ($m, AGR %, CAGR %)
Table 8.13 South America Yeast Market by Country, 2018-2028 ($m, AGR %, CAGR %)
Table 8.14 South America Specialty Yeast Market by Country, 2018-2028 ($m, AGR %, CAGR %)
Table 8.15 South America Yeast Market by Form, 2018-2028 ($m, AGR %, CAGR %)
Table 8.16 South America Yeast Market by Application, 2018-2028 ($m, AGR %, CAGR %)
Table 8.17 Africa Yeast Market by Country, 2018-2028 ($m, AGR %, CAGR %)
Table 8.18 Africa Specialty Yeast Market by Country, 2018-2028 ($m, AGR %, CAGR %)
Table 8.19 Africa Yeast Market by Form, 2018-2028 ($m, AGR %, CAGR %)
Table 8.20 Africa Yeast Market by Application, 2018-2028 ($m, AGR %, CAGR %)
Table 8.21 Middle East Yeast Market by Country, 2018-2028 ($m, AGR %, CAGR %)
Table 8.22 Middle East Specialty Yeast Market by Country, 2018-2028 ($m, AGR %, CAGR %)
Table 8.23 Middle East Yeast Market by Form, 2018-2028 ($m, AGR %, CAGR %)
Table 8.24 Middle East Yeast Market by Application, 2018-2028 ($m, AGR %, CAGR %)
Table 9.1 Koninklijke Dsm N.V.: Company Profile
Table 9.2 Koninklijke Dsm N.V.Total Company Sales 2013-2017 ($m, AGR %)
Table 9.3 Koninklijke Dsm N.V. Sales by Segment of Business 2013-2017 ($m, AGR %)
Table 9.4 Koninklijke Dsm N.V. Net Profit 2013-2017 ($m, AGR %)
Table 9.5 Koninklijke Dsm N.V. Net Capital Expenditure 2013-2017 ($m, AGR %)
Table 9.6 Koninklijke Dsm N.V. Cost of Research & Development 2011-2017 ($m, AGR %)
Table 9.7 Koninklijke Dsm N.V. Sales by Geographical Location 2013-2017 ($m, AGR %)
Table 9.8 Koninklijke Dsm N.V. Number of Employees 2013-2017 (No. Of Employees, AGR %)
Table 9.9 Koninklijke Dsm N.V. Yeast Products (Segment of Business, Product, Specification)
Table 9.10 Koninklijke Dsm N.V. Mergers and Acquisitions 2013-2018 (Date, Company Involved, Value US$m, Details)
Table 9.11 Associated British Foods Plc: Company Profile
Table 9.12 Associated British Foods Plc Total Company Sales 2013-2017 ($m, AGR %)
Table 9.13 Associated British Foods Plc Sales by Segment Of Business 2013-2017 ($m, AGR %)
Table 9.14 Associated British Foods Plc Net Profit 2013-2017 ($m, AGR %)
Table 9.15 Associated British Foods Plc Cost of Research & Development 2013-2017 ($m, AGR %)
Table 9.16 Associated British Foods Plc Sales by Geographical Location 2013-2017 ($m, AGR %)
Table 9.17 Associated British Foods Plc Number of Employees 2013-2017 (No. Of Employees, AGR %)
Table 9.18 Associated British Foods Plc (AB Mauri) Yeast Products (Segment of Business, Product, Specification)
Table 9.19 Associated British Foods Mergers and Acquisitions 2013-2017 (Date, Company Involved, Value $m, Details)
Table 9.20 Chr. Hansen A/S: Company Profile
Table 9.21 Chr. Hansen A/S Total Company Sales 2013-2017 ($m, AGR %)
Table 9.22 Chr. Hansen A/S Sales by Segment Of Business 2013-2017 ($m, AGR %)
Table 9.23 Chr. Hansen A/S Net Profit 2013-2017 ($m, AGR %)
Table 9.24 Chr. Hansen A/S Capital Expenditure 2013-2017 ($m, AGR %)
Table 9.25 Chr. Hansen A/S Cost of Research & Development 2013-2017 ($m, AGR %)
Table 9.26 Chr. Hansen A/S Sales by Geographical Location 2013-2017 ($m, AGR %)
Table 9.27 Chr. Hansen A/S Number of Employees 2013-2017 (No. Of Employees, Agr %)
Table 9.28 Chr. Hansen A/S Yeast Products (Segment of Business, Product, Specification)
Table 9.20 Chr Hansen A/S Foods Mergers and Acquisitions 2013-2017 (Date, Company Involved, $m, Details)
Table 9.30 Lesaffre Group: Company Profile
Table 9.31 Lesaffre Group Yeast Products (Segment of Business, Product, Specification)
Table 9.32 Lesaffre Group Mergers and Acquisitions 2013-2017 (Date, Company Involved, Value US$m, Details)
Table 9.33 Lallemand Inc.: Company Profile
Table 9.34 Lallemand Inc. Yeast Products (Segment of Business, Product, Specification)
Table 9.35 Lallemand Inc. Mergers and Acquisitions 2013-2017 (Date, Company Involved, Value $m, Details)
Table 9.36 Sensient Technologies: Company Profile
Table 9.37 Sensient Technologies Total Company Sales 2013-2017 ($m, AGR %)
9.6.2
Table 9.38 Sensient Technologies Segment Sales 2013-2017 ($m, AGR %)
Table 9.39 Sensient Technologies Sales by Segment of Business 2013-2017 ($m, AGR %)
Table 9.40 Sensient Technologies Net Earnings 2013-2017 ($m, AGR %)
Table 9.41 Sensient Technologies Net Capital Expenditure 2013-2017 ($m, AGR %)
Table 9.42 Sensient Technologies Cost of Research & Development 2013-2017 ($m, AGR %)
Table 9.43 Sensient Technologies Sales by Geographical Location 2013-2017 ($m, AGR %)
Table 9.44 Sensient Technologies Number of Employees 2013-2017 (No. Of Employees, AGR %)
Table 9.45 Sensient Technologies Yeast Products (Segment of Business, Product, Specification)
Table 9.46 Angel Yeast Co., Ltd.: Company Profile
Table 9.47 Angel Yeast Co., Ltd. Yeast Products (Segment of Business, Product, Specification)
Table 9.48 Angel Yeast Co., Ltd. Market Strategy 2011-2015 (Date, Company Involved, Value $m, Details)
Table 9.49 Alltech Inc.: Company Profile
Table 9.50 Alltech Inc. Yeast Products (Segment of Business, Product, Specification)
Table 9.51 Leiber Gmbh: Company Profile
Table 9.52 Leiber Gmbh Yeast Products (Segment of Business, Product, Specification)
Table 9.53 Synergy Flavors: Company Profile
Table 9.54 Synergy Flavors Yeast Products (Segment of Business, Product, Specification)
Table 9.55 Synergy Flavors Market Strategy 2011-2017 (Date, Company Involved, Value $m, Details)
Table 9.56 Other Companies Involved in the Yeast Market
List of Figures
Figure 2.1 Global Yeast Market Segmentation Overview
Figure 3.1 Global Yeast Market by Type, 2017-2028 ($m, AGR %)
Figure 3.2 Global Yeast Market Share by Type, 2018 (% Share)
Figure 4.1 Global Yeast Market by Form 2018-2028 ($m, Global AGR %)
Figure 4.2 Global Yeast Market Share by Form 2018 (% Share)
Figure 5.1 Global Yeast Market by Application 2018-2028 ($m, Global AGR %)
Figure 5.2 Global Yeast Market Share by Application 2018 (% Share)
Figure 6.1 Global Specialty Yeast Market by Type, 2018-2028 ($m, Global AGR %)
Figure 6.2 Global Specialty Yeast Market Share, 2018 (% Share)
Figure 8.1 Global Yeast Market by Region, 2018-2028 ($m, Global AGR %)
Figure 8.2 Global Yeast Market by Region, 2018-2028 (AGR %)
Figure 8.3 Global Yeast Market Share by Region, 2018 (% Share)
Figure 9.1 Koninklijke Dsm N.V. Total Company Sales 2013-2017 ($m, AGR %)
Figure 9.2 Koninklijke Dsm N.V.Sales by Segment of Business 2013-2017 ($m)
Figure 9.3 Koninklijke Dsm N.V.Sales AGR by Segment of Business 2013-2017 (AGR %)
Figure 9.4 Koninklijke Dsm N.V. Net Profit 2013-2017 ($m, AGR %)
Figure 9.5 Koninklijke Dsm N.V. Net Capital Expenditure 2013-2017 ($m, AGR %)
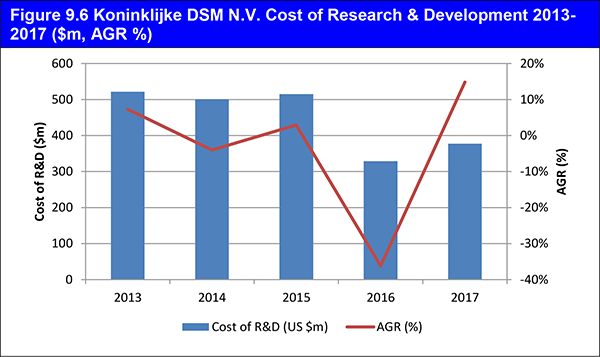
Figure 9.6 Koninklijke Dsm N.V. Cost Of Research & Development 2013-2017 ($m, AGR %)
Figure 9.7 Koninklijke Dsm N.V. Sales AGR by Geographical Location 2013-2017 (AGR %)
Figure 9.8 Koninklijke Dsm N.V. Sales by Geographical Location 2013-2017 ($m)
Figure 9.9 Koninklijke Dsm N.V. Number of Employees 2013-2017 (No. Of Employees, AGR %)
Figure 9.10 Koninklijke Dsm N.V. Primary Market Competitors 2018
Figure 9.11 Associated British Foods Plc Total Company Sales 2013-2017 ($m, AGR %)
Figure 9.12 Associated British Foods Plc Sales by Segment of Business 2013-2017 ($m)
Figure 9.13 Associated British Foods Plc Sales AGR by Segment Of Business 2013-2017 (AGR %)
Figure 9.14 Associated British Foods Plc Net Profit 2013-2017 ($m, AGR %)
Figure 9.15 Associated British Foods Plc Cost of Research & Development 2013-2017 ($m, AGR %)
Figure 9.16 Associated British Foods Plc Sales AGR by Geographical Location 2013-2017 (AGR %)
Figure 9.17 Associated British Foods Plc Sales by Geographical Location 2013-2017 ($m)
Figure 9.18 Associated British Foods Plc Number Of Employees 2013-2017 (No. Of Employees, AGR %)
Figure 9.19 Associated British Foods Plc Primary Market Competitors 2017
Figure 9.20 Chr. Hansen A/S Total Company Sales 2013-2017 ($m, AGR %)
Figure 9.21 Chr. Hansen A/S Sales by Segment of Business 2013-2017 ($m, Total Company Sales)
Figure 9.22 Chr. Hansen A/S Sales AGR by Segment Of Business 2013-2017 (AGR %)
Figure 9.23 Chr. Hansen A/S Net Profit 2013-2017 ($m, AGR %)
Figure 9.24 Chr. Hansen A/S Capital Expenditure 2013-2017 ($m, AGR %)
Figure 9.25 Chr. Hansen A/S Cost of Research & Development 2013-2017 ($m, AGR %)
Figure 9.26 Chr. Hansen A/S Sales AGR by Geographical Location 2013-2017 (AGR %)
Figure 9.27 Chr. Hansen A/S Sales by Geographical Location 2013-2017 ($m)
Figure 9.28 Chr. Hansen A/S Number of Employees 2013-2017 (No. Of Employees, AGR %)
Figure 9.29 Chr. Hansen Foods Plc Primary Market Competitors 2017
Figure 9.30 Lesaffre Group Primary Market Competitors 2018
Figure 9.31 Sensient Technologies Total Company Sales 2013-2017 ($m, AGR %)
Figure 9.32 Sensient Technologies Sales by Segment Of Business 2013-2017 ($m)
Figure 9.33 Sensient Technologies Sales AGR by Segment Of Business 2013-2017 (AGR %)
Figure 9.34 Sensient Technologies Net Earnings 2013-2017 ($m, AGR %)
Figure 9.35 Sensient Technologies Net Capital Expenditure 2013-2017 ($m, AGR %)
Figure 9.36 Sensient Technologies Cost of Research & Development 2013-2017 ($m, AGR %)
Figure 9.37 Sensient Technologies Sales AGR by Geographical Location 2013-2017 (AGR%)
Figure 9.38 Sensient Technologies Sales by Geographical Location 2013-2017 ($m)
Figure 9.39 Sensient Technologies Number of Employees 2013-2017 (No. of Employees, AGR %)
Figure 9.40 Sensient Technologies Primary Market Competitors 2017
