Industries > Food and Drink > Global Coffee Market Report 2019-2029
Global Coffee Market Report 2019-2029
Forecasts by Sources (Arabica, Robusta), by Product (Whole-Bean, Ground, Instant) and by Distribution Channel (On-Trade, Off-Trade) PLUS Profiles of Leading Companies and Regional and Leading National Market Analysis
The latest report from business intelligence provider Visiongain offers comprehensive analysis of the global coffee market. Visiongain assesses that this market will generate revenues of $107bn in 2019.
Now: The inclination towards coffee consumption and production, along with companies more focussing on variety of coffee has led Visiongain to publish this unique report, which is crucial to your companies improved success.
How this report will benefit you
Read on to discover how you can exploit the future business opportunities emerging in this sector. Visiongain’s new study tells you and tells you NOW.
In this brand new report you find 150 in-depth tables, charts and graphs.
The 137-page report provides clear detailed insight into the global coffee market. Discover the key drivers and challenges affecting the market.
By ordering and reading our brand-new report today you stay better informed and ready to act.
Report Scope
• Global Coffee market forecasts from 2019-2029
• Regional Coffee market forecasts from 2019-2029 covering North America, Asia-Pacific, Europe, Latin America and Rest of the World
• Country Coffee forecasts from 2019-2029 covering China, the US, the UK, Germany, India, Canada, Japan, and Brazil
• Instant coffee market forecasts from 2019-2029
• Analysis of the key factors driving growth in the global, regional and country level coffee markets from 2019-2029
How will you benefit from this report?
• Enhance your strategic decision making
• Assist with your research, presentations and business plans
• Show which emerging market opportunities to focus upon
• Increase your industry knowledge
• Keep you up to date with crucial market developments
Who should read this report?
• Anyone within the coffee market
• Competitive intelligence manager
• Marketing managers
• Marketing Consultant
• Suppliers
• Investors
• Government agencies
Key Questions Answered by this Report
• How is the coffee market evolving?
• What is driving and restraining coffee market dynamics?
• How will each coffee submarket segment grow over the forecast period and how much sales will these submarkets account for in 2029?
• How will market shares of each coffee submarket develop from 2019-2029?
• Which individual technologies will prevail and how will these shifts be responded to?
• Which coffee submarket will be the main driver of the overall market from 2019-2029?
• How will political and regulatory factors influence regional coffee markets and submarkets?
• Who are the leading players and what are their prospects over the forecast period?
Visiongain’s study is intended for anyone requiring commercial analyses for the coffee market and leading companies. You find data, trends and predictions.
Buy our report today Global Coffee Market Report 2019-2029. Avoid missing out by staying informed – get our report now.
Visiongain is a trading partner with the US Federal Government
CCR Ref number: KD4R6
Do you have any custom requirements we can help you with? Any need for specific country, geo region, market segment or specific company information? Contact us today, we can discuss your needs and see how we can help: sara.peerun@visiongain.com
1.1 Global Coffee Market Overview
1.2 Global Coffee Market Segmentation
1.3 Why You Should Read This Report
1.4 How This Report Delivers
1.5 Key Questions Answered by This Analytical Report Include:
1.6 Who is This Report For?
1.7 Methodology
1.7.1 Secondary Research
1.7.2 Market Evaluation & Forecasting Methodology
1.8 Frequently Asked Questions (FAQ)
1.9 Associated Visiongain Reports
1.10 About Visiongain
2. Introduction to the Coffee Market
2.1 Global Coffee Market Structure
2.2 Coffee Market Definition
2.3 Coffee Submarket Definitions
2.4 Coffee Market Supply Chain
3. Global Coffee Market 2019-2029
3.1 Global Coffee Market Forecast 2019-2029
3.2 Global Coffee Market Analysis
3.3 Global Coffee Market Drivers & Restraints 2019
3.3.1 Surplus Production of Coffee
3.3.2 Increasing Demand in Countries with Larger Population
3.3.3 Growing Millennial Coffee Consumption
3.3.4 Coffee Market Reforms Affecting Price
4. Global Coffee Market Forecast by Source 2019-2029
4.1 Global Coffee Market Forecast by Arabica Segment 2019-2029
4.2 Global Coffee Market Forecast by Robusta Segment 2019-2029
5. Global Coffee Market Forecasts by Product 2019-2029
5.1 Global Coffee Market Forecast by Whole-Bean Coffee Segment 2019-2029
5.2 Global Coffee Market Forecast by Ground Coffee Segment 2019-2029
5.3 Global Coffee Market Forecast by Instant Coffee Segment 2019-2029
6. Global Coffee Market Forecast by Distribution Channel 2019-2029
6.1 Global Coffee Market Forecast by On-Trade Segment 2019-2029
6.2 Global Coffee Market Forecast by Off-Trade Segment 2019-2029
7. Regional Coffee Market Forecasts 2019-2029
7.1 North American Coffee Market Forecast 2019-2029
7.1.1 North American Coffee Market Forecast by Source 2019-2029
7.1.2 North American Coffee Market Forecast by Product 2019-2029
7.1.3 North American Coffee Market Forecast by Channel 2019-2029
7.1.4 North American Coffee Market Forecast by Country 2019-2029
7.1.5 North American Coffee Market Analysis
7.2 Asia-Pacific Coffee Market Forecast 2019-2029
7.2.1 Asia-Pacific Coffee Market Forecast by Source 2019-2029
7.2.2 Asia-Pacific Coffee Market Forecast by Product 2019-2029
7.2.3 Asia-Pacific Coffee Market Forecast by Channel 2019-2029
7.2.4 Asia-Pacific Coffee Market Forecast by Country 2019-2029
7.2.5 Asia-Pacific Coffee Market Analysis
7.3 Europe Coffee Market Forecast 2019-2029
7.3.1 Europe Coffee Market Forecast by Source 2019-2029
7.3.2 Europe Coffee Market Forecast by Product 2019-2029
7.3.3 Europe Coffee Market Forecast by Channel 2019-2029
7.3.4 Europe Coffee Market Forecast by Country 2019-2029
7.3.5 Europe Coffee Market Analysis
7.4 Latin American Coffee Market Forecast 2019-2029
7.4.1 Latin America Coffee Market Forecast by Source 2019-2029
7.4.2 Latin America Coffee Market Forecast by Product 2019-2029
7.4.3 Latin America Coffee Market Forecast by Channel 2019-2029
7.4.4 Latin America Coffee Market Forecast by Country 2019-2029
7.4.5 Latin America Coffee Market Analysis
7.5 RoW Coffee Market Forecast 2019-2029
7.5.1 RoW Coffee Market Forecast by Source 2019-2029
7.5.2 RoW Coffee Market Forecast by Product 2019-2029
7.5.3 RoW Coffee Market Forecast by Channel 2019-2029
7.5.4 RoW Coffee Market Analysis
8. SWOT Analysis of the Coffee Market 2019-2029
9. Leading Companies in the Coffee Market 2019
9.1 Coffee Companies 2019
9.1.1 Major Growth Strategies Adopted by Key Players
9.2 Eight O’ Clock Coffee
9.2.1 Eight O’ Clock Coffee Selected Recent Key Developments 2013-2018
9.2.2 Eight O’Clock Coffee’s Parent Company (Tata Global Beverages Ltd.) Sales 2013-2017
9.2.3 Eight O’Clock Coffee’s Parent Company (Tata Global Beverages Ltd.) Net Income / Loss 2013-2017
9.2.4 Eight O’Clock Coffee Products/ Services
9.2.5 Eight O’Clock Coffee Overview
9.2.6 Eight O’Clock Coffee’s Parent Company: Key Financial Ratio
9.3 J.M. Smucker Company
9.3.1 J.M. Smucker Coffee Key Developments 2017-2018
9.3.2 J.M. Smucker Sales 2013-2017
9.3.3 J.M. Smucker Net Income 2013-2017
9.3.4 J.M. Smucker Overview
9.3.5 J.M. Smucker Key Financial Ratios
9.4 Jacobs Douwe Egberts
9.4.1 Jacobs Douwe Egberts Key Strategies
9.4.2 Jacobs Douwe Egberts l Coffee Products/ Services
9.4.3 Jacobs Douwe Egberts Overview
9.5 Caribou Coffee
9.5.1 Caribou Coffee Key Developments
9.5.2 Caribou Coffee Products/Services
9.5.3 Caribou Coffee Overview
9.6 Starbucks Corporation
9.6.1 Starbucks Corporation Coffee Key Developments 2017-2018
9.6.2 Starbucks Corporation Sales 2014-2017
9.6.3 Starbucks Corporation Net Income 2014-2017
9.6.4 Starbucks Corporation Overview
9.7 Ajinomoto General Foods, Inc.
9.7.1 Ajinomoto Co., Inc. (Parent Company) Sales 2014-2018
9.7.2 Ajinomoto General Foods, Inc. Net Income/Loss 2014-2018
9.7.3 Ajinomoto General Foods, Inc. Coffee Selected Recent Key Developments 2017-2019
9.7.4 Ajinomoto General Foods, Inc. Coffee Products/Services
9.7.5 Ajinomoto General Foods, Inc. Overview
9.8 Coffee Beanery
9.8.1 Coffee Beanery Coffee Products/Services
9.8.2 Coffee Beanery Overview
9.9 Coffee Republic
9.9.1 Coffee Republic Coffee Products/ Services
9.9.2 Coffee Republic Overview
9.10 Costa Coffee
9.10.1 Costa Coffee Products/Services
9.10.2 Costa Coffee Overview
9.11 Luigi Lavazza S.p.A.
9.11.1 Luigi Lavazza S.p.A. Coffee Selected Recent Key Developments 2015-2018
9.11.2 Luigi Lavazza S.p.A. Coffee Products/Services
9.11.3 Luigi Lavazza S.p.A. Overview
9.12 Other Leading Companies in the Value Chain
10. Conclusions
Appendices
Associated Visiongain Reports
Visiongain Report Sales Order Form
About Visiongain
List of Tables
Table 2.1 Coffee Submarket (Submarket, Definition)
Table 3.1 Global Coffee Market Forecast 2019-2029 (US$b, AGR%, CAGR %, Cumulative)
Table 4.1 Global Coffee Market Forecast by Source 2019-2029 (US$b, AGR%, CAGR %, Cumulative)
Table 4.2 Global Coffee Market Forecast for Arabica Segment by Region 2019-2029 (US$m, AGR%, CAGR %, Cumulative)
Table 4.3 Global Coffee Forecast for Robusta Segment by Region 2019-2029 (US$b, AGR%, CAGR %, Cumulative)
Table 5.1 Global Coffee Market Forecast by Product 2019-2029 (US$b, AGR%, CAGR %, Cumulative)
Table 5.2 Global Coffee Market Forecast For Whole-Bean Coffee Segment by Region 2019-2029 (US$b, AGR%, CAGR %, Cumulative)
Table 5.3 Global Coffee Forecast for Ground Coffee Segment by Region 2019-2029 (US$b, AGR%, CAGR %, Cumulative)
Table 5.4 Global Coffee Market Forecast For Instant Coffee Segment by Region 2019-2029 (US$b, AGR%, CAGR %, Cumulative)
Table 6.1 Global Coffee Market Forecast by Distribution Channel 2019-2029 (US$m, AGR%, CAGR %, Cumulative)
Table 6.2 Global Coffee Market Forecast for On-Trade Segment by Region 2019-2029 (US$b, AGR%, CAGR %, Cumulative)
Table 6.3 Global Coffee Forecast for Off-Trade Segment by Region 2019-2029 (US$b, AGR%, CAGR %, Cumulative)
Table 7.1 Regional Coffee Market Forecast 2019-2029 (US$b, AGR%, CAGR %, Cumulative)
Table 7.2 North American Coffee Market Forecast by Source 2019-2029 (US$b, AGR%, CAGR %, Cumulative)
Table 7.3 North American Coffee Market Forecast by Product 2019-2029 (US$b, AGR%, CAGR %, Cumulative)
Table 7.4 North America Coffee Market Forecast By Channel 2019-2029 (US$b, AGR%, CAGR %, Cumulative)
Table 7.5 North America Coffee Market Forecast By Country 2019-2029 (US$b, AGR%, CAGR %, Cumulative)
Table 7.6 Asia-Pacific Coffee Market Forecast by Source 2019-2029 (US$b, AGR%, CAGR %, Cumulative)
Table 7.7 Asia-Pacific Coffee Market Forecast by Product 2019-2029 (US$b, AGR%, CAGR %, Cumulative)
Table 7.8 Asia-Pacific Coffee Market Forecast By Channel 2019-2029 (US$b, AGR%, CAGR %, Cumulative)
Table 7.9 Asia-Pacific Coffee Market Forecast By Country 2019-2029 (US$b, AGR%, CAGR %, Cumulative)
Table 7.10 Europe Coffee Market Forecast by Source 2019-2029 (US$b, AGR%, CAGR %, Cumulative)
Table 7.11 Europe Coffee Market Forecast by Product 2019-2029 (US$b, AGR%, CAGR %, Cumulative)
Table 7.12 Europe Coffee Market Forecast By Channel 2019-2029 (US$b, AGR%, CAGR %, Cumulative)
Table 7.13 Europe Coffee Market Forecast By Country 2019-2029 (US$b, AGR%, CAGR %, Cumulative)
Table 7.14 Latin America Coffee Market Forecast by Source 2019-2029 (US$b, AGR%, CAGR %, Cumulative)
Table 7.15 Latin America Coffee Market Forecast by Product 2019-2029 (US$b, AGR%, CAGR %, Cumulative)
Table 7.16 Latin America Coffee Market Forecast By Channel 2019-2029 (US$b, AGR%, CAGR %, Cumulative)
Table 7.17 Latin America Coffee Market Forecast By Country 2019-2029 (US$b, AGR%, CAGR %, Cumulative)
Table 7.18 RoW Coffee Market Forecast by Source 2019-2029 (US$b, AGR%, CAGR %, Cumulative)
Table 7.19 RoW Coffee Market Forecast by Product 2019-2029 (US$b, AGR%, CAGR %, Cumulative)
Table 7.20 RoW Coffee Market Forecast By Channel 2019-2029 (US$b, AGR%, CAGR %, Cumulative)
Table 8.1 Global Coffee Market SWOT Analysis 2019-2029
Table 9.1 Leading Coffee Companies and Organizations 2019
Table 9.2 Eight O’Clock Coffee Company Profile 2019 (CEO, Parent Company Sales US$m, Net Income, Business Segment in the Market, HQ, Founded, Website)
Table 9.3 Eight O’ Clock Coffee Key Developments (Date, Strategies, Details)
Table 9.4 Eight O’Clock Coffee Company Parent Company (Tata Global Beverages Ltd.) Net Income / Loss 2013-2017 (US$B)
Table 9.5 Eight O’Clock Coffee Company Coffee Products/ Services (Product, Specification/Features)
Table 9.6 Eight O’Clock Coffee Parent Company: Subsidiary/Associates/Joint Ventures
Table 9.7 Eight O’Clock Coffee’s Parent Company: Key Financial Ratio – 2017
Table 9.8 J.M. Smucker Company Profile 2019 (CEO, Parent Company Sales US$m, Net Income, Business Segment in the Market, HQ, Founded, Website)
Table 9.9 J.M. Smucker Key Developments 2017-2018 (Date, Strategy, Details)
Table 9.10 J.M. Smucker Sales 2013-2017 (US$m, AGR %)
Table 9.11 J.M. Smucker Net Income 2013-2017 (US$m, AGR %)
Table 9.12 J.M. Smucker: Key Financial Ratios 2017
Table 9.13 Jacobs Douwe Egberts Company Profile 2019 (CEO, Parent Company Sales US$m, Net Income, Business Segment in the Market, HQ, Founded, Website)
Table 9.14 Jacobs Douwe Egberts Company Key Strategies (Date, Strategy, Details)
Table 9.15 Caribou Coffee Profile 2019 (CEO, HQ, Founded, No. of Employees, Website)
Table 9.16 Caribou Coffee Key Strategies (Date, Strategy, Details)
Table 9.17 Caribou Coffee Products/Services (Segment of Business, Specification/Features)
Table 9.18 Starbucks Corporation Profile 2019 (CEO, Parent Company Sales US$m, Net Income, Business Segment in the Market, HQ, Founded, Website)
Table 9.19 Starbucks Corporation Key Developments 2017-2018 (Date, Strategy, Details)
Table 9.20 Starbucks Corporation Sales 2014-2017 (US$m, AGR %)
Table 9.21 Starbucks Corporation Net Income 2014-2017 (US$m, AGR %)
Table 9.22 Ajinomoto General Foods, Inc. Profile 2017 (President, Total Company Sales US$m, Net Income US$m, HQ, Founded, No. of Employees, Website)
Table 9.23 Ajinomoto Co., Inc. (Parent Company) Sales 2014-2018 (Yen ¥ m, AGR %)
Table 9.24 Ajinomoto General Foods, Inc. Key Strategies (Date, Strategy, Details)
Table 9.25 Ajinomoto General Foods, Inc. Coffee Products/Services
Table 9.26 Coffee Beanery Profile 2019 (CEO, HQ, Founded, Website, No of Employees)
Table 9.27 Coffee Beanery Coffee Products / Services
Table 9.28 Coffee Republic Profile 2019 (CEO, HQ, Founded, Website)
Table 9.29 Coffee Republic Coffee Products/ Services
Table 9.30 Costa Coffee Profile 2019 (CEO, HQ, Founded, Website)
Table 9.31 Costa Coffee Products/Services
Table 9.32 Luigi Lavazza S.p.A. Profile 2019 (CEO, HQ, Founded, Website)
Table 9.33 Luigi Lavazza S.p.A. Key Strategies (Date, Strategy, Details)
Table 9.34 Luigi Lavazza S.p.A. Coffee Products/Services
Table 9.35 Other Leading Companies in the Coffee Market Value 2019 (Company, Revenue, No of Employees, Location)
List of Figures
Figure 1.1 Global Coffee Market Segmentation
Figure 2.1 Global Coffee Market Segmentation Overview
Figure 2.2 Global Coffee Market Supply Chain
Figure 3.1 Global Coffee Market Forecast 2019-2029 (US$b, AGR %)
Figure 3.2 Total Coffee Production By Region 2015-2018 (In Thousand 60Kg Bags)
Figure 4.1 Global Coffee Market Forecast by Source 2019-2029 (US$b)
Figure 4.2 Global Coffee Market Share Forecast by Source 2019, 2024, 2029 (% Share)
Figure 4.3 Global Coffee Market Forecast For Arabica 2019, 2024, 2029 (US$b)
Figure 4.4 Global Coffee Market Share Forecast For Arabica Segment by Region 2019, 2024, 2029 (%)
Figure 4.5 Global Coffee Market Forecast For Robusta 2019, 2024, 2029 (US$b)
Figure 4.6 Global Coffee Market Share Forecast For Robusta Segment by Region 2019, 2024, 2029 (% Share)
Figure 5.1 Global Coffee Market Forecast by Product 2019-2029 (US$b)
Figure 5.2 Global Coffee Market Share Forecast by Product 2019, 2024, 2029 (% Share)
Figure 5.2 Global Coffee Market Forecast For Whole Bean 2019, 2024, 2029 (US$b)
Figure 5.3 Global Coffee Market Share Forecast For Whole-Bean Coffee Segment by Region 2019, 2024, 2029 (% Share)
Figure 5.4 Global Coffee Market Forecast For Ground Coffee 2019, 2024, 2029 (US$b)
Figure 5.5 Global Coffee Market Share Forecast For Ground Coffee Segment by Region 2019, 2024, 2029 (% Share)
Figure 5.6 Global Coffee Market Forecast For Instant Coffee 2019, 2024, 2029 (US$b)
Figure 5.7 Global Coffee Market Share Forecast For Instant Coffee Segment by Region 2019-2024-2029 (% Share)
Figure 6.1 Global Coffee Market Forecast by Distribution Channel 2019-2029 (US$b)
Figure 6.2 Global Coffee Market Share Forecast by Distribution Channel 2019, 2024, 2029 (% Share)
Figure 6.3 Global Coffee Market Forecast For On-Trade 2019, 2024, 2029 (US$b)
Figure 6.4 Global Coffee Market Share Forecast For On-Trade Segment by Region 2019-2024-2029 (%)
Figure 6.5 Global Coffee Market Forecast For Off-Trade 2019, 2024, 2029 (US$b)
Figure 7.1 Regional Coffee Market Forecast 2019-2029 (US$b, AGR%)
Figure 7.2 Regional Coffee Market Share Forecast 2019 (% Share)
Figure 7.3 Regional Coffee Market Share Forecast 2024 (% Share)
Figure 7.4 Regional Specility Coffee Market Share Forecast 2029 (% Share)
Figure 7.5 North America Coffee Market Forecast by Source 2019-2029 (US$b)
Figure 7.6 North American Coffee Market Share Forecast by Form 2019, 2024, 2029 (% Share)
Figure 7.7 North American Coffee Market Forecast by Form 2019-2029 (US$b, AGR%)
Figure 7.8 North America Coffee Market Forecast for Instant Coffee Segment 2019-2029 (US$b, AGR%)
Figure 7.9 North America Coffee Market Forecast for Ground Coffee Segment 2019-2029 (US$b, AGR%)
Figure 7.10 North America Coffee Market Forecast for Whole Beans Segment 2019-2029 (US$b, AGR%)
Figure 7.11 North America Coffee Market Forecast by Channel 2019-2029 (US$b, AGR%)
Figure 7.12 North America Coffee Market Share Forecast by Country 2019, 2024, 2029 (% Share)
Figure 7.13 North America Coffee Market Forecast by Country 2019-2029 (US$b, AGR%)
Figure 7.14 US Coffee Market Forecast 2019-2029 (US$b, AGR%)
Figure 7.15 Canada Coffee Market Forecast 2019-2029 (US$b, AGR%)
Figure 7.16 Mexico Coffee Market Forecast 2019-2029 (US$m, AGR%)
Figure 7.17 Asia-Pacific Coffee Market Forecast by Source 2019-2029 (US$b)
Figure 7.18 Asia-Pacific Coffee Market Forecast by Product 2019-2029 (US$b)
Figure 7.19 Asia-Pacific Coffee Market Forecast by Channel 2019-2029 (US$b, AGR%)
Figure 7.20 Asia-Pacific Coffee Market Share Forecast by Country 2019, 2024, 2029 (% Share)
Figure 7.21 Asia-Pacific Coffee Market Forecast by Country 2019-2029 (US$b, AGR%)
Figure 7.22 Japan Coffee Market Forecast 2019-2029 (US$b, AGR%)
Figure 7.23 China Coffee Market Forecast 2019-2029 (US$b, AGR%)
Figure 7.24 India Coffee Market Forecast 2019-2029 (US$b, AGR%)
Figure 7.25 Australia Coffee Market Forecast 2019-2029 (US$b, AGR%)
Figure 7.26 Singapore Coffee Market Forecast 2019-2029 (US$b, AGR%)
Figure 7.27 Rest of APAC Coffee Market Forecast 2019-2029 (US$b, AGR%)
Figure 7.28 Europe Coffee Market Forecast by Source 2019-2029 (US$b)
Figure 7.29 Europe Coffee Market Forecast by Product 2019-2029 (US$b)
Figure 7.30 Europe Coffee Market Forecast by Channel 2019-2029 (US$b, AGR%)
Figure 7.31 Europe Coffee Market Share Forecast by Country 2019, 2024, 2029 (% Share)
Figure 7.32 Europe Coffee Market Forecast by Country 2019-2029 (US$b, AGR%)
Figure 7.33 UK Coffee Market Forecast 2019-2029 (US$b, AGR%)
Figure 7.34 Italy Coffee Market Forecast 2019-2029 (US$b, AGR%)
Figure 7.35 France Coffee Market Forecast 2019-2029 (US$b, AGR%)
Figure 7.36 Germany Coffee Market Forecast 2019-2029 (US$b, AGR%)
Figure 7.37 Spain Coffee Market Forecast 2019-2029 (US$b, AGR%)
Figure 7.38 Rest of Europe Coffee Market Forecast 2019-2029 (US$b, AGR%)
Figure 7.39 Latin America Coffee Market Forecast by Source 2019-2029 (US$b)
Figure 7.40 Latin America Coffee Market Forecast by Product 2019-2029 (US$b)
Figure 7.41 Europe Coffee Market Forecast by Channel 2019-2029 (US$b, AGR%)
Figure 7.42 Latin America Coffee Market Share Forecast by Country 2019, 2024, 2029 (% Share)
Figure 7.43 Latin America Coffee Market Forecast by Country 2019-2029 (US$b, AGR%)
Figure 7.44 Brazil Coffee Market Forecast 2019-2029 (US$b, AGR%)
Figure 7.45 Argentina Coffee Market Forecast 2019-2029 (US$b, AGR%)
Figure 7.46 Rest of Latin America Coffee Market Forecast 2019-2029 (US$b, AGR%)
Figure 7.47 ROW Coffee Market Forecast by Source 2019-2029 (US$b)
Figure 7.48 ROW Coffee Market Forecast by Product 2019-2029 (US$b)
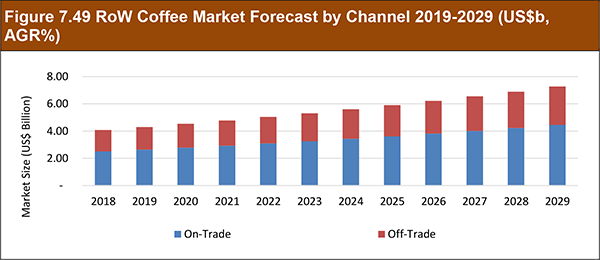
Figure 7.49 RoW Coffee Market Forecast by Channel 2019-2029 (US$b, AGR%)
Figure 9.1 Eight O’Clock Coffee’s Parent Company (Tata Global Beverages Ltd.) Sales 2013-2017 (US$m, AGR %)
Figure 9.2 Eight O’Clock Coffee Parent Company (Tata Global Beverages Ltd.) Net Income / Loss 2013-2017 (US$m)
Figure 9.3 J.M. Smucker Sales 2013-2017 (US$m, AGR %)
Figure 9.4 J.M. Smucker Net Income 2013-2017 (US$m, AGR %)
Figure 9.4 Starbucks Corporation Sales 2014-2017 (US$m, AGR %)
Figure 9.5 Starbucks Corporation Net Income 2014-2017 (US$m, AGR %)
Figure 9.6 Ajinomoto Co., Inc. (Parent Company) Sales 2014-2018 (Yen ¥ m, AGR %)
Figure 9.7 Ajinomoto General Foods, Inc. Net Income/Loss 2014-2018 (US$m, AGR %)
Ajinomoto Group
Ajinomoto Istanbul Food Sales Ltd.
Alibaba Group
Amalgamated Plantations Pvt. Ltd
Amoy Food Ltd.
Arsenal Football Clubs
Boyd Coffee Company
Campestres Holdings Ltd.
Caribou Coffee Company, Inc.
CITIC Capital Asian Foods Holdings Limited
Coffee Beanery
Coffee Republic
Community Coffee Company L.L.C.
Consolidated Coffee Inc.
Costa Coffee
Cypress Creek Solar Farms
Drassington Ltd.
Dunkin’ Donuts
Earth Rules Pty Ltd.
Eight O’ Clock Coffee
Elev8 Brands, Inc.
Empirical Group LLC
Espresso Service Proximité (ESP)
Estate Management Services Pvt. Ltd.
Folgers & Co.
Good Earth Corporation
Good Earth Teas Inc.
Greenwell Farms Inc
Illycaffe Spa
International Coffee Organization
J.M. Smucker Company
JAB Coffee Holding B.V.
JAB Holding Company
Jacobs Douwe Egberts (JDE)
JOBMeal
Joekels Tea Packers (Proprietary) Ltd
Joh. A. Benckiser
Kahutara Holdings Ltd.
Kanan Devan Hills Plantations Co. Pvt. Ltd.
Keurig Green Mountain, Inc
Keurig, Inc.
Kicking Horse Coffee
Korea Mcnulty Co., Ltd.
Kraft Heinz Inc.
Labeyrie Traiteur Surgelés S.A.S.
Lavazza Group
Liverpool Football Clubs
Luigi Lavazza S.p.A.
Lyons Tetley Ltd.
Mars, incorporated
Massimo Zanetti Beverage Group SpA
Mondelēz International, Inc
Nespresso
Nestlé
Nongshim Co., Ltd.
NourishCo Beverages Ltd.
Ofcay
Southern Tea LLC
Stansand (Africa) Ltd.
Stansand (Brokers) Ltd.
Stansand (Central Africa) Ltd.
Starbucks Canada
Starbucks Corporation
Suntyco Holding Ltd.
Swiss Water Decaffeinated Coffee, Inc.
Tata Coffee Ltd.
Tata Coffee Vietnam Company Ltd.
Tata Global Beverages Australia Pty Ltd.
Tata Global Beverages Canada Inc.
Tata Global Beverages Capital Ltd
Tata Global Beverages Czech Republic a.s.
Tata Global Beverages GB Ltd.
Tata Global Beverages Group Ltd.
Tata Global Beverages Holdings Ltd.
Tata Global Beverages Investments Ltd.
Tata Global Beverages Ltd.
Tata Global Beverages Overseas Holdings Ltd.
Tata Global Beverages Overseas Ltd.
Tata Global Beverages Polska sp.zo.o
Tata Global Beverages Services Ltd.
Tata Global Beverages US Holdings Inc
Tata Starbucks Private Ltd.
Tata Tea Extractions Inc.
Tata Tea Holdings Private Ltd.
Tata Waters LLC
TCHIBO GmbH
Teapigs Ltd.
Teapigs US LLC
TerraCycle
Tetley ACI (Bangladesh) Ltd.
Tetley Clover (Pvt) Ltd.
Tetley USA Inc.
Thanksgiving Coffee Company Inc.
TRIL Constructions Ltd.
Uber Eats Japan
Ucc Holdings Co. Ltd.
Zhejiang Tata Tea Extraction Company Ltd.
Organisations Mentioned in the Report
All Japan Coffee Association
CECAFE
Centre for Sociological Investigation (CIS)9
Global Coffee Platform
International Coffee Organization (ICO)
National Restaurant Association (NRA)
Specialty Coffee Association
Download sample pages
Complete the form below to download your free sample pages for Global Coffee Market Report 2019-2029
Related reports
-

Global Poultry Feed Market Forecast 2019-2029
The global poultry feed market is estimated to reach $322bn in 2024. ...Full DetailsPublished: 16 January 2019 -

Global Meat Substitutes Market Forecast & Analysis 2019-2029
The global meat substitutes market is estimated to have reached $4.5bn in 2018 and is expected to grow at a...
Full DetailsPublished: 23 July 2019 -

Speciality Coffee Market Report 2020-2030
With global, national/regional, and submarket estimates for the speciality coffee market, this report covers key aspects of this market. In...
Full DetailsPublished: 19 September 2019 -

Global Food Packaging Equipment Market 2018-2028
Visiongain comprehensive new 122-page report assesses that the global food packaging equipment market will be valued at $16bn in 2017....Full DetailsPublished: 01 February 2018 -

Global Yeast Market Report 2019-2029
The global yeast market is expected to grow at a CAGR of 8.9% in the first half of the forecast...
Full DetailsPublished: 30 August 2019 -

Food High Pressure Processing (HPP) Equipment Market Report 2020-2030
As demand for new, minimally processed foods and drinks increases, more distributors stock their shelves with goods produced using HPP...Full DetailsPublished: 17 December 2020 -

High Pressure Processing (HPP) Equipments and Foods Market 2018-2028
The horizontal food HPP Equipment submarket held 81% share of the HPP Equipments market in 2017. This submarket is estimated...
Full DetailsPublished: 18 June 2018 -

Top 20 Food High Pressure Processing (HPP) Companies 2020
The global food HPP equipment market is expected to grow at a CAGR of 11% in the first half of...
Full DetailsPublished: 08 January 2020 -

Speciality Coffee Market Report 2019-2029
With global, national/regional, and submarket estimates for the speciality coffee market, this report covers key aspects of this market. In...
Full DetailsPublished: 19 December 2018 -

Food High Pressure Processing (HPP) Equipment Market 2019-2029
The global food HPP equipment market is expected to grow at a CAGR of 11% in the first half of...
Full DetailsPublished: 25 September 2019
Download sample pages
Complete the form below to download your free sample pages for Global Coffee Market Report 2019-2029
Do you have any custom requirements we can help you with?
Any specific country, geo region, market segment or specific company information?
Email us today, we can discuss your needs and see how we can help: jamie.roberts@visiongain.com
Would you like a free report overview of the report of your choice? If so, please drop an email to Jamie Roberts stating your chosen report title to jamie.roberts@visiongain.com
Visiongain food & drink reports are compiled using a broad and rich mixture of both primary and secondary information to produce an overall industry outlook. In order to provide our clients with the best product possible product, we do not rely on any one single source of information. Visiongain analysts reach out to market-leading vendors, carriers, service providers and industry experts but also review a wealth of financial data and product information from a vast range of sources. To find out more about our reports methodology, please email jamie.roberts@visiongain.com
Would you like to get the latest Visiongain food & drink reports catalogue? What are the dynamic growth sectors? where are the regional business opportunities? Which technologies will prevail and who are the leading companies succeeding in these sectors and why? If you want definitive answers to business critical questions, discover Visiongain’s full range of business intelligence reports. If so, please email Jamie Roberts on jamie.roberts@visiongain.com or call her today on +44 207 336 6100
Assured Food Standards
Europatat
Federation of Oils, Seeds and Fats Associations
Food and Drink Federation
Food & Drink Federation
Grain and Feed Trade Association
Freshfel Europe
International Dairy-Deli-Bakery Association
Meat Industry Association of New Zealand
National Frozen & Refrigerated Foods Association
Produce Marketing Association
TURYID
U.S. Poultry & Egg Association
Latest Food and Drink news
Visiongain Publishes Commercial Greenhouse Market Report 2024-2034
The global Commercial Greenhouse market was valued at US$38.02 billion in 2023 and is projected to grow at a CAGR of 8.3% during the forecast period 2024-2034.
09 April 2024
Visiongain Publishes Vertical Farming Market Report 2023-2033
The global Vertical Farming market was valued at US$5.4 billion in 2022 and is projected to grow at a CAGR of 22% during the forecast period 2023-2033.
31 July 2023
Visiongain Publishes Industrial Enzymes Market Report 2023-2033
The global industrial enzymes market was valued at US$6.42 billion in 2022 and is projected to grow at a CAGR of 6.8% during the forecast period 2023-2033.
06 June 2023
Visiongain Publishes Agricultural Robots Market Report 2023-2033
The global Agricultural Robots market was valued at US$12.8 billion in 2022 and is projected to grow at a CAGR of 25.3% during the forecast period 2023-2033.
31 May 2023
