1. Report Overview
1.1. Introduction
1.2. Why You Should Read This Report
1.3. Key Questions Answered by This Analytical Report
1.4. Who is This Report For?
1.5. Methodology
1.6. Frequently Asked Questions (FAQ)
1.7. Associated Visiongain Reports
1.8. About Visiongain
2. Executive Summary
3. Introduction to Inactivated Vaccine
3.1. Global Inactivated Vaccine Market Structure
3.2. Market Definition and Scope
3.3. Regulatory Outlook
3.3.1. U.S.
3.3.2. Europe
3.4. Market Dynamics
3.4.1. Market Drivers
3.4.1.1. Rise in prevalence of infectious diseases
3.4.1.2. Government support in vaccine development
3.4.2. Market Restraints/Challenges
3.4.2.1. High cost of overall research & development
3.4.3. Opportunities
3.4.3.1. Demand for vaccines during pandemic
3.4.4. Porter’s Five Forces Analysis
3.4.4.1. Competitive Rivalry
3.4.4.2. Supplier Power
3.4.4.3. Buyer Power
3.4.4.4. Threat of Substitution
3.4.4.5. Threat of New Entry
3.5. Impact of COVID-19 on the Global Inactivated Vaccine Market
4. Global Inactivated Vaccine Market Analysis and Forecast 2020-2030, by Pathogen Type (Pre COVID and V, U, W and L COVID Recovery Scenarios)
4.1. Market Overview
4.1.1. Viral
4.1.1.1. Increasing prevalence of viral diseases
4.1.2. Bacterial
4.1.2.1. Increasing prevalence of bacterial diseases
5. Global Inactivated Vaccine Market Analysis and Forecast, 2020-2030 by Target Type (Pre COVID and V, U, W and L COVID Recovery Scenarios)
5.1. Market Overview
5.1.1. Pertussis
5.1.1.1. Increase in demand of vaccination of pregnant women, government initiatives towards immunization of infants and rise in number of vaccination programs for children in healthcare institutes
5.1.2. Cholera
5.1.2.1. Improvements in water & sanitation facilities in rural & urban areas, strategic goals of government authorities to reduce cholera cases and efforts towards prevention of high-risk areas for cholera
5.1.3. Influenza
5.1.3.1. High Number of cases of Influenza and seasonal flue in country like U.S.
5.1.4. Hepatitis A
5.1.4.1. Active participation of government association in treating Hepatitis A
5.1.5. Cell Mediated Rabies
5.1.5.1. Awareness on Cell Mediated Rabies & preventing dog bites and increase in preventive immunization in people
5.1.6. Others
5.1.6.1. Ongoing research and development in range of diseases to treat them
6. Global Inactivated Vaccine Market Analysis and Forecast, 2020-2030 by End User Type (Pre COVID and V, U, W and L COVID Recovery Scenarios)
6.1. Market Overview
6.1.1. Pediatrics
6.1.1.1. Hospitals and clinics play an important role in immunization programmers for children, adults, and the elderly population. Improving performance of immunization program is the major role of hospitals and clinics
6.1.2. Adults
6.1.2.1. People with new cases for hepatitis, cholera, influenza, and cell mediated rabies are from adults age groups and leads high demand for inactivated vaccines
7. Global Inactivated Vaccine Market Analysis and Forecast, 2020-2030 by Channel Type (Pre COVID and V, U, W and L COVID Recovery Scenarios)
7.1. Market Overview
7.1.1. Hospitals & Clinics
7.1.1.1. Hospitals and clinics play an important role in immunization programmes for children, adults, and the elderly population. Improving performance of immunization program is the major role of hospitals and clinics
7.1.2. Others
7.1.2.1. Increase in focus on comprehensive health care to patients, expanding vaccinations programs to rural communities and rise in investments in community health centers driving the growth of this centre
8. North America Inactivated Vaccine Market Analysis and Forecast, 2020-2030 Pre COVID and V, U, W and L COVID Recovery Scenarios)
8.1. Market Overview
8.2. North America Inactivated Vaccine Market Size and Forecast by Pathogen Type
8.2.1. Rising prevalence viral and bacterial disease
8.3. North America Inactivated Vaccine Market Size and Forecast by Pathogen Type
8.3.1. Increasing number of diseases and active participation of government to treat them
8.4. North America Inactivated Vaccine Market Size and Forecast by Target Type
8.4.1. Efforts towards increasing infant immunization
8.5. North America Inactivated Vaccine Market Size and Forecast by Channel Type
8.5.1. Effective immunization through hospitals and clinics
8.6. U.S. Inactivated Vaccine Market
8.6.1. Investment in vaccine development
8.7. Canada Inactivated Vaccine Market
8.7.1. Active participation government
9. Europe Inactivated Vaccine Market Analysis and Forecast, 2020-2030 (Pre COVID and V, U, W and L COVID Recovery Scenarios)
9.1. Market Overview
9.2. Europe Inactivated Vaccine Market Size and Forecast by Pathogen Type
9.2.1. Rising prevalence viral and bacterial disease
9.3. Europe Inactivated Vaccine Market Size and Forecast by Pathogen Type
9.3.1. Increasing number of diseases and active participation of government to treat them
9.4. Europe Inactivated Vaccine Market Size and Forecast by Target Type
9.4.1. Efforts towards increasing infant immunization
9.5. Europe Inactivated Vaccine Market Size and Forecast by Channel Type
9.5.1. Effective immunization through hospitals and clinics
9.6. Germany Inactivated Vaccine Market
9.6.1. Free vaccination
9.7. France Inactivated Vaccine Market
9.7.1. Rising number of vaccine players
9.8. Italy Inactivated Vaccine Market
9.8.1. Active participation of Italy based players in vaccine development
9.9. Spain Inactivated Vaccine Market
9.9.1. Spain commitment to GAVI and funding of 50 million Euro to immunize almost 300 million children’s in response to COVID-19 event
9.10. UK Inactivated Vaccine Market
9.10.1. Presence of sophisticated healthcare industry
9.11. Rest of Europe Inactivated Vaccine Market
9.11.1. Rising prevalence of viral and bacterial diseases
10. Asia Pacific Inactivated Vaccine Market Analysis and Forecast, 2020-2030 (Pre COVID and V, U, W and L COVID Recovery Scenarios)
10.1. Market Overview
10.2. Asia Pacific Inactivated Vaccine Market Size and Forecast by Pathogen Type
10.2.1. Rising prevalence viral and bacterial disease
10.3. Asia Pacific Inactivated Vaccine Market Size and Forecast by Target Type
10.3.1. Increasing number of diseases and active participation of government to treat them
10.4. Asia Pacific Inactivated Vaccine Market Size and Forecast by Target Type
10.4.1. Efforts towards increasing infant immunization
10.5. Asia Pacific Inactivated Vaccine Market Size and Forecast by Channel Type
10.5.1. Effective immunization through hospitals and clinics
10.6. China Inactivated Vaccine Market
10.6.1. Rising investment in vaccine development
10.7. India Inactivated Vaccine Market
10.7.1. High growth in vaccine manufacturing
10.8. Japan Inactivated Vaccine Market
10.8.1. Active participation in vaccine procurement
10.9. Australia Inactivated Vaccine Market
10.9.1. Greater healthcare spending and vaccination coverage
10.10. Rest of Asia Pacific Inactivated Vaccine Market
10.10.1. Profitable vaccine manufacturing opportunities
11. Latin America Inactivated Vaccine Market Analysis and Forecast, 2020-2030 (Pre COVID and V, U, W and L COVID Recovery Scenarios)
11.1. Market Overview
11.2. Latin America Inactivated Vaccine Market Size and Forecast by Pathogen Type
11.2.1. Rising prevalence viral and bacterial disease
11.3. Latin America Inactivated Vaccine Market Size and Forecast by Target Type
11.3.1. Increasing number of diseases and active participation of government to treat them
11.4. Latin America Inactivated Vaccine Market Size and Forecast by Target Type
11.4.1. Efforts towards increasing infant immunization
11.5. Latin America Inactivated Vaccine Market Size and Forecast by Channel Type
11.5.1. Effective immunization through hospitals and clinics
11.6. Latin America Inactivated Vaccine Market Size and Forecast by Mode
11.6.1. Brazil Inactivated Vaccine Market
11.6.1.1. Growing indicatives to immunization coverage
11.6.2. Mexico Inactivated Vaccine Market
11.6.2.1. Government assistance in immunization programs
11.6.3. Rest of Latin America Inactivated Vaccine Market
11.6.3.1. XX Driving/Opportunity Factor
12. MEA Inactivated Vaccine Market Analysis and Forecast, 2020-2030 (Pre COVID and V, U, W and L COVID Recovery Scenarios)
12.1. Market Overview
12.2. MEA Inactivated Vaccine Market Size and Forecast by Pathogen Type
12.2.1. Rising prevalence viral and bacterial disease
12.3. MEA Inactivated Vaccine Market Size and Forecast by Target Type
12.3.1. Increasing number of diseases and active participation of government to treat them
12.4. MEA Inactivated Vaccine Market Size and Forecast by Target Type
12.4.1. Efforts towards increasing infant immunization
12.5. MEA Inactivated Vaccine Market Size and Forecast by Channel Type
12.5.1. Effective immunization through hospitals and clinics
12.6. Saudi Arabia Inactivated Vaccine Market
12.6.1.1. Privatization in immune programs
12.6.1.2. High Healthcare Spending
12.7. South Africa Inactivated Vaccine Market
12.7.1.1. Rising immunization programs
12.8. Rest of MEA Inactivated Vaccine Market
13. Companies in the Inactivated Vaccine Market
13.1. GlaxoSmithKline PLC
13.1.1. Company Snapshot
13.1.2. Company Overview
13.1.3. Financial Performance (2015-2019)
13.1.3.1. Net Revenue
13.1.3.2. Gross Profit
13.1.3.3. Geographical Revenue, 2019
13.1.4. Product Offerings
13.1.5. Recent Initiatives (2017-2019)
13.2. Emergent BioSolutions Inc.
13.2.1. Company Snapshot
13.2.2. Company Overview
13.2.3. Financial Performance (2015-2019)
13.2.3.1. Net Revenue
13.2.3.2. Gross Profit
13.2.3.3. Geographical Revenue, 2019
13.2.4. Product Offerings
13.2.5. Recent Initiatives (2017-2019)
13.3. Merck & Co., Inc.
13.3.1. Company Snapshot
13.3.2. Company Overview
13.3.3. Financial Performance (2015-2019)
13.3.3.1. Net Revenue
13.3.3.2. Gross Profit
13.3.3.3. Geographical Revenue, 2019
13.3.4. Product Offerings
13.3.5. Recent Initiatives (2017-2019)
13.4. Sanofi
13.4.1. Company Snapshot
13.4.2. Company Overview
13.4.3. Financial Performance (2015-2019)
13.4.3.1. Net Revenue
13.4.3.2. Gross Profit
13.4.3.3. Geographical Revenue, 2019
13.4.4. Product Offerings
13.4.5. Recent Initiatives (2017-2019)
13.5. Valneva SE
13.5.1. Company Snapshot
13.5.2. Company Overview
13.5.3. Financial Performance (2015-2019)
13.5.3.1. Net Revenue
13.5.3.2. Gross Profit
13.5.3.3. Geographical Revenue, 2019
13.5.4. Product Offerings
13.5.5. Recent Initiatives (2017-2019)
13.6. Pfizer
13.6.1. Company Snapshot
13.6.2. Company Overview
13.6.3. Financial Performance (2015-2019)
13.6.3.1. Net Revenue
13.6.3.2. Gross Profit
13.6.3.3. Geographical Revenue, 2019
13.6.4. Product Offerings
13.6.5. Recent Initiatives (2017-2019)
13.7. Astellas Pharma Inc.
13.7.1. Company Snapshot
13.7.2. Company Overview
13.7.3. Financial Performance (2015-2019)
13.7.3.1. Net Revenue
13.7.3.2. Gross Profit
13.7.3.3. Geographical Revenue, 2019
13.7.4. Product Offerings
13.7.5. Recent Initiatives (2017-2019)
13.8. Johnson & Johnson
13.8.1. Company Snapshot
13.8.2. Company Overview
13.8.3. Financial Performance (2015-2019)
13.8.3.1. Net Revenue
13.8.3.2. Gross Profit
13.8.3.3. Geographical Revenue, 2019
13.8.4. Product Offerings
13.8.5. Recent Initiatives (2017-2019)
13.9. Seqirus
13.9.1. Company Snapshot
13.9.2. Company Overview
13.9.3. Financial Performance (2015-2019)
13.9.3.1. Net Revenue
13.9.3.2. Gross Profit
13.9.3.3. Geographical Revenue, 2019
13.9.4. Product Offerings
13.9.5. Recent Initiatives (2017-2019)
13.10. Serum Institute of India
13.10.1. Company Snapshot
13.10.2. Company Overview
13.10.3. Financial Performance (2015-2019)
13.10.3.1. Net Revenue
13.10.3.2. Gross Profit
13.10.3.3. Geographical Revenue, 2019
13.10.4. Product Offerings
13.10.5. Recent Initiatives (2017-2019)
13.11. Other Notable Players
14. Conclusion
15. Glossary
List of Tables
Table 1 Global Inactivated Vaccines Market Forecast by Region Type, 2020-2030 (US$ million, AGR %, CAGR %)
Table 2. Global Inactivated Vaccines Market Highlights (US$ bn, CAGR (%),2020-2030
Table 3. Global Inactivated Vaccines Market Forecast by Pathogen Type, 2020-2030 (US$ million, AGR %, CAGR %)
Table 4. Global Inactivated Vaccines Market for Viral Vaccines Segment: Revenue Forecast 2020-2030 (US$ billion, AGR%, CAGR%)
Table 5. “V” Shaped Recovery: Global Inactivated Vaccines Market for Viral Vaccines Segment, Revenue Forecast 2020-2030 (US$ billion, AGR%, CAGR%)
Table 6. “U” Shaped Recovery: Global Inactivated Vaccines Market for Viral Vaccines Segment, Revenue Forecast 2020-2030 (US$ billion, AGR%, CAGR%)
Table 7. “W” Shaped Recovery: Global Inactivated Vaccines Market for Viral Vaccines Segment, Revenue Forecast 2020-2030 (US$ billion, AGR%, CAGR%)
Table 8. “L” Shaped Recovery: Global Inactivated Vaccines Market for Viral Vaccines Segment, Revenue Forecast 2020-2030 (US$ billion, AGR%, CAGR%)
Table 9. Global Inactivated Vaccines Market for Bacterial Vaccines Segment: Revenue Forecast 2020-2030 (US$ billion, AGR%, CAGR%)
Table 10. “V” Shaped Recovery: Global Inactivated Vaccines Market for Bacterial Vaccines Segment, Revenue Forecast 2020-2030 (US$ billion, AGR%, CAGR%)
Table 11. “U” Shaped Recovery: Global Inactivated Vaccines Market for Bacterial Vaccines Segment, Revenue Forecast 2020-2030 (US$ billion, AGR%, CAGR%)
Table 12. “W” Shaped Recovery: Global Inactivated Vaccines Market for Bacterial Vaccines Segment, Revenue Forecast 2020-2030 (US$ billion, AGR%, CAGR%)
Table 13. “L” Shaped Recovery: Global Inactivated Vaccines Market for Bacterial Vaccines Segment, Revenue Forecast 2020-2030 (US$ billion, AGR%, CAGR%)
Table 14. Global Inactivated Vaccines Market Forecast by Target Type, 2020-2030 (US$ million, AGR %, CAGR %)
Table 15. Global Inactivated Vaccines Market for Pertussis Segment: Revenue Forecast 2020-2030 (US$ billion, AGR%, CAGR%)
Table 16. “V” Shaped Recovery: Global Inactivated Vaccines Market for Pertussis Vaccines Segment, Revenue Forecast 2020-2030 (US$ billion, AGR%, CAGR%)
Table 17. “U” Shaped Recovery: Global Inactivated Vaccines Market for Pertussis Segment, Revenue Forecast 2020-2030 (US$ billion, AGR%, CAGR%)
Table 18. “W” Shaped Recovery: Global Inactivated Vaccines Market for Pertussis Segment, Revenue Forecast 2020-2030 (US$ billion, AGR%, CAGR%)
Table 19. “L” Shaped Recovery: Global Inactivated Vaccines Market for Pertussis Segment, Revenue Forecast 2020-2030 (US$ billion, AGR%, CAGR%)
Table 20. Global Inactivated Vaccines Market for Cholera Segment: Revenue Forecast 2020-2030 (US$ billion, AGR%, CAGR%)
Table 21. “V” Shaped Recovery: Global Inactivated Vaccines Market for Cholera Segment, Revenue Forecast 2020-2030 (US$ billion, AGR%, CAGR%)
Table 22. “U” Shaped Recovery: Global Inactivated Vaccines Market for Cholera Segment, Revenue Forecast 2020-2030 (US$ billion, AGR%, CAGR%)
Table 23. “W” Shaped Recovery: Global Inactivated Vaccines Market for Cholera Segment, Revenue Forecast 2020-2030 (US$ billion, AGR%, CAGR%)
Table 24. “L” Shaped Recovery: Global Inactivated Vaccines Market for Cholera Segment, Revenue Forecast 2020-2030 (US$ billion, AGR%, CAGR%)
Table 25. Global Inactivated Vaccines Market for Polio Segment: Revenue Forecast 2020-2030 (US$ billion, AGR%, CAGR%)
Table 26. “V” Shaped Recovery: Global Inactivated Vaccines Market for Polio Segment, Revenue Forecast 2020-2030 (US$ billion, AGR%, CAGR%)
Table 27.“U” Shaped Recovery: Global Inactivated Vaccines Market for Polio Segment, Revenue Forecast 2020-2030 (US$ billion, AGR%, CAGR%)
Table 28. “W” Shaped Recovery: Global Inactivated Vaccines Market for Polio Segment, Revenue Forecast 2020-2030 (US$ billion, AGR%, CAGR%)
Table 29. “L” Shaped Recovery: Global Inactivated Vaccines Market for Polio Segment, Revenue Forecast 2020-2030 (US$ billion, AGR%, CAGR%)
Table 30. Global Inactivated Vaccines Market for Influenza Segment: Revenue Forecast 2020-2030 (US$ billion, AGR%, CAGR%)
Table 31. “V” Shaped Recovery: Global Inactivated Vaccines Market for Influenza Segment, Revenue Forecast 2020-2030 (US$ billion, AGR%, CAGR%)
Table 32. “U” Shaped Recovery: Global Inactivated Vaccines Market for Influenza Segment, Revenue Forecast 2020-2030 (US$ billion, AGR%, CAGR%)
Table 33. “W” Shaped Recovery: Global Inactivated Vaccines Market for Influenza Segment, Revenue Forecast 2020-2030 (US$ billion, AGR%, CAGR%)
Table 34. “L” Shaped Recovery: Global Inactivated Vaccines Market for Influenza Segment, Revenue Forecast 2020-2030 (US$ billion, AGR%, CAGR%)
Table 35. Global Inactivated Vaccines Market for Hepatitis Segment: Revenue Forecast 2020-2030 (US$ billion, AGR%, CAGR%)
Table 36. “V” Shaped Recovery: Global Inactivated Vaccines Market for Hepatitis Segment, Revenue Forecast 2020-2030 (US$ billion, AGR%, CAGR%)
Table 37. “U” Shaped Recovery: Global Inactivated Vaccines Market for Hepatitis Segment, Revenue Forecast 2020-2030 (US$ billion, AGR%, CAGR%)
Table 39. “W” Shaped Recovery: Global Inactivated Vaccines Market for Hepatitis Segment, Revenue Forecast 2020-2030 (US$ billion, AGR%, CAGR%)
Table 40. “L” Shaped Recovery: Global Inactivated Vaccines Market for Hepatitis Segment, Revenue Forecast 2020-2030 (US$ billion, AGR%, CAGR%)
Table 41. Global Inactivated Vaccines Market for Cell Mediated Rabies Segment: Revenue Forecast 2020-2030 (US$ billion, AGR%, CAGR%)
Table 42. “V” Shaped Recovery: Global Inactivated Vaccines Market for Cell Mediated Rabies Segment, Revenue Forecast 2020-2030 (US$ billion, AGR%, CAGR%)
Table 43. “U” Shaped Recovery: Global Inactivated Vaccines Market for Cell Mediated Rabies Segment, Revenue Forecast 2020-2030 (US$ billion, AGR%, CAGR%)
Table 44. “W” Shaped Recovery: Global Inactivated Vaccines Market for Cell Mediated Rabies Segment, Revenue Forecast 2020-2030 (US$ billion, AGR%, CAGR%)
Table 45.“L” Shaped Recovery: Global Inactivated Vaccines Market for Cell Mediated Rabies Segment, Revenue Forecast 2020-2030 (US$ billion, AGR%, CAGR%)
Table 46. Global Inactivated Vaccines Market for Others Segment: Revenue Forecast 2020-2030 (US$ billion, AGR%, CAGR%)
Table 47. “V” Shaped Recovery: Global Inactivated Vaccines Market for Others Segment, Revenue Forecast 2020-2030 (US$ billion, AGR%, CAGR%)
Table 48. “U” Shaped Recovery: Global Inactivated Vaccines Market for Others Segment, Revenue Forecast 2020-2030 (US$ billion, AGR%, CAGR%)
Table 49. “W” Shaped Recovery: Global Inactivated Vaccines Market for Others Segment, Revenue Forecast 2020-2030 (US$ billion, AGR%, CAGR%)
Table 50. “L” Shaped Recovery: Global Inactivated Vaccines Market for Others Segment, Revenue Forecast 2020-2030 (US$ billion, AGR%, CAGR%)
Table 51. Global Inactivated Vaccines by End-user Type Submarket Forecast 2019-2030 (US $bn, AGR%, CAGR%)
Table 52. Global Inactivated Vaccines Market for Pediatric Segment: Revenue Forecast 2020-2030 (US$ billion, AGR%, CAGR%)
Table 53. “V” Shaped Recovery: Global Inactivated Vaccines Market for Paediatrics Segment, Revenue Forecast 2020-2030 (US$ billion, AGR%, CAGR%)
Table 55. “W” Shaped Recovery: Global Inactivated Vaccines Market for Paediatrics Segment, Revenue Forecast 2020-2030 (US$ billion, AGR%, CAGR%)
Table 56 “L” Shaped Recovery: Global Inactivated Vaccines Market for Paediatrics Segment, Revenue Forecast 2020-2030 (US$ billion, AGR%, CAGR%)
Table 57. Global Inactivated Vaccines Market for Adults Segment: Revenue Forecast 2020-2030 (US$ billion, AGR%, CAGR%)
Table 58. “V” Shaped Recovery: Global Inactivated Vaccines Market for Adults Segment, Revenue Forecast 2020-2030 (US$ billion, AGR%, CAGR%)
Table 59. “U” Shaped Recovery: Global Inactivated Vaccines Market for Adults Segment, Revenue Forecast 2020-2030 (US$ billion, AGR%, CAGR%)
Table 60. “W” Shaped Recovery: Global Inactivated Vaccines Market for Adults Segment, Revenue Forecast 2020-2030 (US$ billion, AGR%, CAGR%)
Table 61. “L” Shaped Recovery: Global Inactivated Vaccines Market for Adults Segment, Revenue Forecast 2020-2030 (US$ billion, AGR%, CAGR%)
Table 62. Global Inactivated Vaccines Market Forecast by Channel Type, 2020-2030 (US$ million, AGR %, CAGR %)
Table 6 3. Global Inactivated Vaccines Market for Hospitals & Clinics Segment: Revenue Forecast 2020-2030 (US$ billion, AGR%, CAGR%)
Table 64. “V” Shaped Recovery: Global Inactivated Vaccines Market for Hospitals & Clinics Segment, Revenue Forecast 2020-2030 (US$ billion, AGR%, CAGR%)
Table 65. “U” Shaped Recovery: Global Inactivated Vaccines Market for Hospitals & Clinics Segment, Revenue Forecast 2020-2030 (US$ billion, AGR%, CAGR%)
Table 66. “W” Shaped Recovery: Global Inactivated Vaccines Market for Hospitals & Clinics Segment, Revenue Forecast 2020-2030 (US$ billion, AGR%, CAGR%)
Table 67. “L” Shaped Recovery: Global Inactivated Vaccines Market for Hospitals & Clinics Segment, Revenue Forecast 2020-2030 (US$ billion, AGR%, CAGR%)
Table 68. Global Inactivated Vaccines Market for Other Segment: Revenue Forecast 2020-2030 (US$ billion, AGR%, CAGR%)
Table 69. “V” Shaped Recovery: Global Inactivated Vaccines Market for Others Segment, Revenue Forecast 2020-2030 (US$ billion, AGR%, CAGR%)
Table 70. “U” Shaped Recovery: Global Inactivated Vaccines Market for Others Segment, Revenue Forecast 2020-2030 (US$ billion, AGR%, CAGR%)
Table 71. “W” Shaped Recovery: Global Inactivated Vaccines Market for Others Segment, Revenue Forecast 2020-2030 (US$ billion, AGR%, CAGR%)
Table 75. “V” Shaped Recovery: North America Inactivated Vaccines Market Forecast by Pathogen Type, 2020-2030 (US$ billion, AGR %)
Table 76. “U” Shaped Recovery: North America Inactivated Vaccines Market Forecast by Pathogen Type, 2020-2030 (US$ billion, AGR %)
Table 77. “W” Shaped Recovery: North America Inactivated Vaccines Market Forecast by Pathogen Type, 2020-2030 (US$ billion, AGR %)
Table 78. “L” Shaped Recovery: North America Inactivated Vaccines Market Forecast by Pathogen Type, 2020-2030 (US$ billion, AGR %)
Table 79. U.S. Inactivated Vaccines Market Forecast, 2020-2030 (US$ billion, AGR %, CAGR %)
Table 80. U.S. Inactivated Vaccines Market Forecast by Pathogen Type, 2020-2030 (US$ billion, AGR %)
Table 81. “V” Shaped Recovery: U.S. Inactivated Vaccines Market Forecast by Pathogen Type, 2020-2030 (US$ billion, AGR %)
Table 82. “U” Shaped Recovery: U.S. Inactivated Vaccines Market Forecast by Pathogen Type, 2020-2030 (US$ billion, AGR %)
Table 83. “W” Shaped Recovery: U.S. Inactivated Vaccines Market Forecast by Pathogen Type, 2020-2030 (US$ billion, AGR %)
Table 84. “L” Shaped Recovery: U.S. Inactivated Vaccines Market Forecast by Pathogen Type, 2020-2030 (US$ billion, AGR %)
Table 85. Canada Inactivated Vaccines Market Forecast, 2020-2030 (US$ million, AGR %, CAGR %)
Table 86. Canada Inactivated Vaccines Market Forecast by Pathogen Type, 2020-2030 (US$ billion, AGR %)
Table 87. “V” Shaped Recovery: Canada Inactivated Vaccines Market Forecast by Pathogen Type, 2020-2030 (US$ billion, AGR %)
Table 88. “U” Shaped Recovery: Canada Inactivated Vaccines Market Forecast by Pathogen Type, 2020-2030 (US$ billion, AGR %)
Table 89. “W” Shaped Recovery: Canada Inactivated Vaccines Market Forecast by Pathogen Type, 2020-2030 (US$ billion, AGR %)
Table 90. “L” Shaped Recovery: Canada Inactivated Vaccines Market Forecast by Pathogen Type, 2020-2030 (US$ billion, AGR %)
Table 91. Europe Inactivated Vaccines Market Forecast by Pathogen Type, 2020-2030 (US$ billion, AGR %)
Table 92. “V” Shaped Recovery: Europe Inactivated Vaccines Market Forecast by Pathogen Type, 2020-2030 (US$ billion, AGR %)
Table 94. “W” Shaped Recovery: Europe Inactivated Vaccines Market Forecast by Pathogen Type, 2020-2030 (US$ billion, AGR %)
Table 95. “L” Shaped Recovery: Europe Inactivated Vaccines Market Forecast by Pathogen Type, 2020-2030 (US$ billion, AGR %)
Table 96. Germany Inactivated Vaccines Market Forecast, 2020-2030 (US$ million, AGR %, CAGR %)
Table 97. Germany Inactivated Vaccines Market Forecast by Pathogen Type, 2020-2030 (US$ billion, AGR %)
Table 98. “V” Shaped Recovery: Germany Inactivated Vaccines Market Forecast by Pathogen Type, 2020-2030 (US$ billion, AGR %)
Table 99. “U” Shaped Recovery: Germany Inactivated Vaccines Market Forecast by Pathogen Type, 2020-2030 (US$ billion, AGR %)
Table 100. “W” Shaped Recovery: Germany Inactivated Vaccines Market Forecast by Pathogen Type, 2020-2030 (US$ billion, AGR %)
Table 101. “L” Shaped Recovery: Germany Inactivated Vaccines Market Forecast by Pathogen Type, 2020-2030 (US$ billion, AGR %)
Table 102. UK Inactivated Vaccines Market Forecast, 2020-2030 (US$ million, AGR %, CAGR %)
Table 103. UK Inactivated Vaccines Market Forecast by Pathogen Type, 2020-2030 (US$ billion, AGR %)
Table 104. “V” Shaped Recovery: UK Inactivated Vaccines Market Forecast by Pathogen Type, 2020-2030 (US$ billion, AGR %)
Table 105. “U” Shaped Recovery: UK Inactivated Vaccines Market Forecast by Pathogen Type, 2020-2030 (US$ billion, AGR %)
Table 106.“W” Shaped Recovery: UK Inactivated Vaccines Market Forecast by Pathogen Type, 2020-2030 (US$ billion, AGR %)
Table 109. Italy Inactivated Vaccines Market Forecast by Pathogen Type, 2020-2030 (US$ billion, AGR %)
Table 110. “V” Shaped Recovery: Italy Inactivated Vaccines Market Forecast by Pathogen Type, 2020-2030 (US$ billion, AGR %)
Table 111. “U” Shaped Recovery: Italy Inactivated Vaccines Market Forecast by Pathogen Type, 2020-2030 (US$ billion, AGR %)
Table 112. “W” Shaped Recovery: Italy Inactivated Vaccines Market Forecast by Pathogen Type, 2020-2030 (US$ billion, AGR %)
Table 113. “L” Shaped Recovery: Italy Inactivated Vaccines Market Forecast by Pathogen Type, 2020-2030 (US$ billion, AGR %)
Table 96. France Inactivated Vaccines Market Forecast, 2020-2030 (US$ million, AGR %, CAGR %)
Table 97. France Inactivated Vaccines Market Forecast by Pathogen Type, 2020-2030 (US$ billion, AGR %)
Table 98. “V” Shaped Recovery: France Inactivated Vaccines Market Forecast by Pathogen Type, 2020-2030 (US$ billion, AGR %)
Table 99. “U” Shaped Recovery: France Inactivated Vaccines Market Forecast by Pathogen Type, 2020-2030 (US$ billion, AGR %)
Table 100. “W” Shaped Recovery: France Inactivated Vaccines Market Forecast by Pathogen Type, 2020-2030 (US$ billion, AGR %)
Table 101. “L” Shaped Recovery: France Inactivated Vaccines Market Forecast by Pathogen Type, 2020-2030 (US$ billion, AGR %)
Table 96. Spain Inactivated Vaccines Market Forecast, 2020-2030 (US$ million, AGR %, CAGR %)
Table 97. Spain Inactivated Vaccines Market Forecast by Pathogen Type, 2020-2030 (US$ billion, AGR %)
Table 98. “V” Shaped Recovery: Spain Inactivated Vaccines Market Forecast by Pathogen Type, 2020-2030 (US$ billion, AGR %)
Table 99. “U” Shaped Recovery: Spain Inactivated Vaccines Market Forecast by Pathogen Type, 2020-2030 (US$ billion, AGR %)
Table 100. “W” Shaped Recovery: Spain Inactivated Vaccines Market Forecast by Pathogen Type, 2020-2030 (US$ billion, AGR %)
Table 101. “L” Shaped Recovery: Spain Inactivated Vaccines Market Forecast by Pathogen Type, 2020-2030 (US$ billion, AGR %)
Table 96. Rest of Europe Inactivated Vaccines Market Forecast, 2020-2030 (US$ million, AGR %, CAGR %)
Table 97. Rest of Europe Inactivated Vaccines Market Forecast by Pathogen Type, 2020-2030 (US$ billion, AGR %)
Table 98. “V” Shaped Recovery: Rest of Europe Inactivated Vaccines Market Forecast by Pathogen Type, 2020-2030 (US$ billion, AGR %)
Table 99. “U” Shaped Recovery: Rest of Europe Inactivated Vaccines Market Forecast by Pathogen Type, 2020-2030 (US$ billion, AGR %)
Table 100. “W” Shaped Recovery: Rest of Europe Inactivated Vaccines Market Forecast by Pathogen Type, 2020-2030 (US$ billion, AGR %)
Table 101. “L” Shaped Recovery: Rest of Europe Inactivated Vaccines Market Forecast by Pathogen Type, 2020-2030 (US$ billion, AGR %)
Table 114. China Inactivated Vaccines Market Forecast, 2020-2030 (US$ million, AGR %, CAGR %)
Table 115. China Inactivated Vaccines Market Forecast by Pathogen Type, 2020-2030 (US$ billion, AGR %)
Table 116. “V” Shaped Recovery: China Inactivated Vaccines Market Forecast by Pathogen Type, 2020-2030 (US$ billion, AGR %)
Table 117. “U” Shaped Recovery: China Inactivated Vaccines Market Forecast by Pathogen Type, 2020-2030 (US$ billion, AGR %)
Table 118. “W” Shaped Recovery: China Inactivated Vaccines Market Forecast by Pathogen Type, 2020-2030 (US$ billion, AGR %)
Table 119. “L” Shaped Recovery: China Inactivated Vaccines Market Forecast by Pathogen Type, 2020-2030 (US$ billion, AGR %)
Table 120.India Inactivated Vaccines Market Forecast, 2020-2030 (US$ million, AGR %, CAGR %)
Table 121. India Inactivated Vaccines Market Forecast by Pathogen Type, 2020-2030 (US$ billion, AGR %)
Table 122. “V” Shaped Recovery: India Inactivated Vaccines Market Forecast by Pathogen Type, 2020-2030 (US$ billion, AGR %)
Table 123. “U” Shaped Recovery: India Inactivated Vaccines Market Forecast by Pathogen Type, 2020-2030 (US$ billion, AGR %)
Table 124.“W” Shaped Recovery: India Inactivated Vaccines Market Forecast by Pathogen Type, 2020-2030 (US$ billion, AGR %)
Table 125.“L” Shaped Recovery: India Inactivated Vaccines Market Forecast by Pathogen Type, 2020-2030 (US$ billion, AGR %)
Table 126. Japan Inactivated Vaccines Market Forecast, 2020-2030 (US$ million, AGR %, CAGR %)
Table 127. Japan Inactivated Vaccines Market Forecast by Pathogen Type, 2020-2030 (US$ billion, AGR %)
Table 128. “V” Shaped Recovery: Japan Inactivated Vaccines Market Forecast by Pathogen Type, 2020-2030 (US$ billion, AGR %)
Table 129.“U” Shaped Recovery: Japan Inactivated Vaccines Market Forecast by Pathogen Type, 2020-2030 (US$ billion, AGR %)
Table 130.“W” Shaped Recovery: Japan Inactivated Vaccines Market Forecast by Pathogen Type, 2020-2030 (US$ billion, AGR %)
Table 131. “L” Shaped Recovery: Japan Inactivated Vaccines Market Forecast by Pathogen Type, 2020-2030 (US$ billion, AGR %)
Table 114. Australia Inactivated Vaccines Market Forecast, 2020-2030 (US$ million, AGR %, CAGR %)
Table 115. Australia Inactivated Vaccines Market Forecast by Pathogen Type, 2020-2030 (US$ billion, AGR %)
Table 116. “V” Shaped Recovery: Australia Inactivated Vaccines Market Forecast by Pathogen Type, 2020-2030 (US$ billion, AGR %)
Table 117. “U” Shaped Recovery: Australia Inactivated Vaccines Market Forecast by Pathogen Type, 2020-2030 (US$ billion, AGR %)
Table 118. “W” Shaped Recovery: Australia Inactivated Vaccines Market Forecast by Pathogen Type, 2020-2030 (US$ billion, AGR %)
Table 119. “L” Shaped Recovery: Australia Inactivated Vaccines Market Forecast by Pathogen Type, 2020-2030 (US$ billion, AGR %)
Table 114. Rest of Asia Pacific Inactivated Vaccines Market Forecast, 2020-2030 (US$ million, AGR %, CAGR %)
Table 115. Rest of Asia Pacific Inactivated Vaccines Market Forecast by Pathogen Type, 2020-2030 (US$ billion, AGR %)
Table 116. “V” Shaped Recovery: Rest of Asia Pacific Inactivated Vaccines Market Forecast by Pathogen Type, 2020-2030 (US$ billion, AGR %)
Table 117. “U” Shaped Recovery: Rest of Asia Pacific Inactivated Vaccines Market Forecast by Pathogen Type, 2020-2030 (US$ billion, AGR %)
Table 118. “W” Shaped Recovery: Rest of Asia Pacific Inactivated Vaccines Market Forecast by Pathogen Type, 2020-2030 (US$ billion, AGR %)
Table 119. “L” Shaped Recovery: Rest of Asia Pacific Inactivated Vaccines Market Forecast by Pathogen Type, 2020-2030 (US$ billion, AGR %)
Table 132. Latin America Inactivated Vaccines Market Forecast by Pathogen Type, 2020-2030 (US$ billion, AGR %)
Table 133. “V” Shaped Recovery: Latin America Inactivated Vaccines Market Forecast by Pathogen Type, 2020-2030 (US$ billion, AGR %)
Table 134. “U” Shaped Recovery: Latin America Inactivated Vaccines Market Forecast by Pathogen Type, 2020-2030 (US$ billion, AGR %)
Table 135. “W” Shaped Recovery: Latin America Inactivated Vaccines Market Forecast by Pathogen Type, 2020-2030 (US$ billion, AGR %)
Table 136. “L” Shaped Recovery: Latin America Inactivated Vaccines Market Forecast by Pathogen Type, 2020-2030 (US$ billion, AGR %)
Table 137. Brazil Inactivated Vaccines Market Forecast, 2020-2030 (US$ million, AGR %, CAGR %)
Table 138. Brazil Inactivated Vaccines Market Forecast by Pathogen Type, 2020-2030 (US$ billion, AGR %)
Table 139. “V” Shaped Recovery: Brazil Inactivated Vaccines Market Forecast by Pathogen Type, 2020-2030 (US$ billion, AGR %)
Table 140.“U” Shaped Recovery: Brazil Inactivated Vaccines Market Forecast by Pathogen Type, 2020-2030 (US$ billion, AGR %)
Table 141. “W” Shaped Recovery: Brazil Inactivated Vaccines Market Forecast by Pathogen Type, 2020-2030 (US$ billion, AGR %)
Table 142. “L” Shaped Recovery: Brazil Inactivated Vaccines Market Forecast by Pathogen Type, 2020-2030 (US$ billion, AGR %)
Table 114. Argentina Inactivated Vaccines Market Forecast, 2020-2030 (US$ million, AGR %, CAGR %)
Table 115. Argentina Inactivated Vaccines Market Forecast by Pathogen Type, 2020-2030 (US$ billion, AGR %)
Table 116. “V” Shaped Recovery: Argentina Inactivated Vaccines Market Forecast by Pathogen Type, 2020-2030 (US$ billion, AGR %)
Table 117. “U” Shaped Recovery: Argentina Inactivated Vaccines Market Forecast by Pathogen Type, 2020-2030 (US$ billion, AGR %)
Table 118. “W” Shaped Recovery: Argentina Inactivated Vaccines Market Forecast by Pathogen Type, 2020-2030 (US$ billion, AGR %)
Table 119. “L” Shaped Recovery: Argentina Inactivated Vaccines Market Forecast by Pathogen Type, 2020-2030 (US$ billion, AGR %)
Table 114. Rest of Latin America Inactivated Vaccines Market Forecast, 2020-2030 (US$ million, AGR %, CAGR %)
Table 115. Rest of Latin America Inactivated Vaccines Market Forecast by Pathogen Type, 2020-2030 (US$ billion, AGR %)
Table 116. “V” Shaped Recovery: Rest of Latin America Inactivated Vaccines Market Forecast by Pathogen Type, 2020-2030 (US$ billion, AGR %)
Table 117. “U” Shaped Recovery: Rest of Latin America Inactivated Vaccines Market Forecast by Pathogen Type, 2020-2030 (US$ billion, AGR %)
Table 118. “W” Shaped Recovery: Rest of Latin America Inactivated Vaccines Market Forecast by Pathogen Type, 2020-2030 (US$ billion, AGR %)
Table 119. “L” Shaped Recovery: Rest of Latin America Inactivated Vaccines Market Forecast by Pathogen Type, 2020-2030 (US$ billion, AGR %)
Table 143. Middle East and Africa Inactivated Vaccines Market Forecast by Pathogen Type, 2020-2030 (US$ billion, AGR %)
Table 144. “V” Shaped Recovery: Middle East and Africa Inactivated Vaccines Market Forecast by Pathogen Type, 2020-2030 (US$ billion, AGR %)
Table 145. “U” Shaped Recovery: Middle East and Africa Inactivated Vaccines Market Forecast by Pathogen Type, 2020-2030 (US$ billion, AGR %)
Table 146. “W” Shaped Recovery: Middle East and Africa Inactivated Vaccines Market Forecast by Pathogen Type, 2020-2030 (US$ billion, AGR %)
Table 147. “L” Shaped Recovery: Middle East and Africa Inactivated Vaccines Market Forecast by Pathogen Type, 2020-2030 (US$ billion, AGR %)
Table 148. Saudi Arabia Inactivated Vaccines Market Forecast, 2020-2030 (US$ million, AGR %, CAGR %)
Table 149. Saudi Arabia Inactivated Vaccines Market Forecast by Pathogen Type, 2020-2030 (US$ billion, AGR %)
Table 150. “V” Shaped Recovery: Saudi Arabia Inactivated Vaccines Market Forecast by Pathogen Type, 2020-2030 (US$ billion, AGR %)
Table 151. “U” Shaped Recovery: Saudi Arabia Inactivated Vaccines Market Forecast by Pathogen Type, 2020-2030 (US$ billion, AGR %)
Table 152. “W” Shaped Recovery: Saudi Arabia Inactivated Vaccines Market Forecast by Pathogen Type, 2020-2030 (US$ billion, AGR %)
Table 153. “L” Shaped Recovery: Saudi Arabia Inactivated Vaccines Market Forecast by Pathogen Type, 2020-2030 (US$ billion, AGR %)
Table 114. South Africa Inactivated Vaccines Market Forecast, 2020-2030 (US$ million, AGR %, CAGR %)
Table 115. South Africa Inactivated Vaccines Market Forecast by Pathogen Type, 2020-2030 (US$ billion, AGR %)
Table 116. “V” Shaped Recovery: South Africa Inactivated Vaccines Market Forecast by Pathogen Type, 2020-2030 (US$ billion, AGR %)
Table 117. “U” Shaped Recovery: South Africa Inactivated Vaccines Market Forecast by Pathogen Type, 2020-2030 (US$ billion, AGR %)
Table 118. “W” Shaped Recovery: South Africa Inactivated Vaccines Market Forecast by Pathogen Type, 2020-2030 (US$ billion, AGR %)
Table 119. “L” Shaped Recovery: South Africa Inactivated Vaccines Market Forecast by Pathogen Type, 2020-2030 (US$ billion, AGR %)
Table 114. Rest of Middle East and Africa Inactivated Vaccines Market Forecast, 2020-2030 (US$ million, AGR %, CAGR %)
Table 115. Rest of Middle East and Africa Inactivated Vaccines Market Forecast by Pathogen Type, 2020-2030 (US$ billion, AGR %)
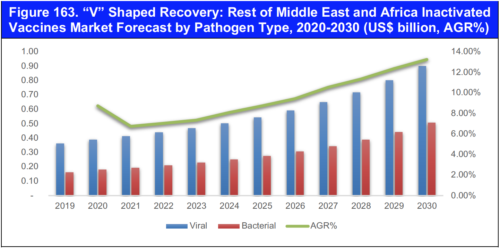
Table 116. “V” Shaped Recovery: Rest of Middle East and Africa Inactivated Vaccines Market Forecast by Pathogen Type, 2020-2030 (US$ billion, AGR %)
Table 117. “U” Shaped Recovery: Rest of Middle East and Africa Inactivated Vaccines Market Forecast by Pathogen Type, 2020-2030 (US$ billion, AGR %)
Table 118. “W” Shaped Recovery: Rest of Middle East and Africa Inactivated Vaccines Market Forecast by Pathogen Type, 2020-2030 (US$ billion, AGR %)
Table 119. “L” Shaped Recovery: Rest of Middle East and Africa Inactivated Vaccines Market Forecast by Pathogen Type, 2020-2030 (US$ billion, AGR %)
Table 154. GlaxoSmithKline – Product Type (Trademark, Generic Name)
Table 155. GlaxoSmithKline PLC Total Company Sales 2015-2019 (US $bn)
Table 156. GlaxoSmithKline PLC – Segmental Performance
Table 157. GlaxoSmithKline PLC –Geographic Performance (%, 2019)
Table 158. Emergent BioSolutions Inc. – Product Type (Trademark, Generic Name)
Table 159. Emergent BioSolutions Inc. Total Company Sales 2015-2019 (US $m)
Table 160. Emergent BioSolutions Inc. – Segmental Performance
Table 161. Emergent BioSolutions Inc. –Geographic Performance (%, 2019)
Table 162. Merck & Co., Inc. – Product Type (Trademark, Generic Name)
Table 163. Merck & Co., Inc. Total Company Sales 2015-2019 (US $bn)
Table 164. Merck & Co., Inc. – Segmental Performance
Table 165. Merck & Co., Inc. –Geographic Performance (%, 2019)
Table 166. Sanofi – Product Type (Trademark, Generic Name)
Table 167. Sanofi Total Company Sales 2015-2019 (US$Bn)
Table 168. Sanofi – Segmental Performance
Table169. Sanofi –Geographic Performance (%, 2019)
Table 171. Valneva SE – Product Type (Trademark, Generic Name)
Table 172. Valneva SE Total Company Sales 2015-2019 (US $Mn)
Table 173. Valneva SE – Segmental Performance
Table 174. Valneva SE –Geographic Performance (%, 2019)
Table 175. Pfizer – Product Type (Trademark, Generic Name)
Table 176. Pfizer Total Company Sales 2015-2019 (US $bn)
Table 177. Pfizer – Segmental Performance
Table 178. Pfizer –Geographic Performance (%, 2019)
Table 179. Astellas Pharma Inc. – Product Type (Trademark, Generic Name)
Table 180. Astellas Pharma Inc. Total Company Sales 2015-2019 (US $bn)
Table 181. Astellas Pharma Inc. – Segmental Performance
Table 182. Astellas Pharma Inc. –Geographic Performance (%, 2019)
Table 183. Recent Development
Table 184. Johnson & Johnson – Product Type (Trademark, Generic Name)
Table 185. Johnson & Johnson Total Company Sales 2015-2019 (US $bn)
Table 186. Johnson & Johnson – Segmental Performance
Table 187. Johnson & Johnson –Geographic Performance (%, 2019)
Table 188. Seqirus – Product Type (Trademark, Generic Name)
Table 189. Serum Institute of India – Product Type (Trademark, Generic Name)
Table 190. Recent Development
Table 191. Other Leading Companies in the Inactivated Vaccines
List of Figures
Figure 1. Inactivated Vaccines Market by Regional Market Share Forecast2019, 2024, 2030 (% Share)
_Toc53318884
Figure 2. Global Inactivated Vaccines Market Segmentation Overview
Figure 3. Inactivated Vaccines Market Drivers& Restraints, 2020
Figure 4. PORTER’S FIVE FORCES ANALYSIS, 2020
Figure 5. Global Inactivated Vaccines Market Forecast by Pathogen Type, 2020-2030 (US$ billion, AGR %)
Figure 6. Global Inactivated Vaccines Market Share Forecast by Product Type, 2020, 2025, 2030 (%)
Figure 7. Global Inactivated Vaccines Market for Viral Vaccines Segment: Revenue Forecast 2020-2030 (US$ billion), (AGR%)
Figure 8.“V” Shaped Recovery: Global Inactivated Vaccines Market for Viral Vaccines Segment, Revenue Forecast 2020-2030 (US$ billion)
Figure 9. “U” Shaped Recovery: Global Inactivated Vaccines Market for Viral Vaccines Segment, Revenue Forecast 2020-2030 (US$ billion, AGR%)
Figure 10. “W” Shaped Recovery: Global Inactivated Vaccines Market for Viral Vaccines Segment, Revenue Forecast 2020-2030 (US$ billion)
Figure 11. “L” Shaped Recovery: Global Inactivated Vaccines Market for Viral Vaccines Segment, Revenue Forecast 2020-2030 (US$ billion, AGR%)
Figure 12. Global Inactivated Vaccines Market for Bacterial Vaccines Segment: Revenue Forecast 2020-2030 (US$ billion, AGR%)
Figure 13. “V” Shaped Recovery: Global Inactivated Vaccines Market for Bacterial Vaccines Segment, Revenue Forecast 2020-2030 (US$ billion, AGR%)
Figure 14. “U” Shaped Recovery: Global Inactivated Vaccines Market for Bacterial Vaccines Segment, Revenue Forecast 2020-2030 (US$ billion, AGR%)
Figure 15. “W” Shaped Recovery: Global Inactivated Vaccines Market for Bacterial Vaccines Segment, Revenue Forecast 2020-2030 (US$ billion , AGR%)
Figure 16. “L” Shaped Recovery: Global Inactivated Vaccines Market for Bacterial Vaccines Segment, Revenue Forecast 2020-2030 (US$ billion, AGR%)
Figure 17. Global Inactivated Vaccines Market Share Forecast by Target Type, 2020, 2025, 2030 (%)
Figure 18. Global Inactivated Vaccines Market for Pertussis Segment: Revenue Forecast 2020-2030 (US$ billion,, AGR%)
Figure19. “V” Shaped Recovery: Global Inactivated Vaccines Market for Pertussis Segment, Revenue Forecast 2020-2030 (US$ billion)
Figure 20. “U” Shaped Recovery: Global Inactivated Vaccines Market for Pertussis Segment, Revenue Forecast 2020-2030 (US$ billion)
Figure 21. “W” Shaped Recovery: Global Inactivated Vaccines Market for Pertussis Segment, Revenue Forecast 2020-2030 (US$ billion)
Figure 22. “L” Shaped Recovery: Global Inactivated Vaccines Market for Pertussis Segment, Revenue Forecast 2020-2030 (US$ billion, AGR%)
Figure 23. Global Inactivated Vaccines Market for Cholera Segment: Revenue Forecast 2020-2030 (US$ billion)
Figure 24.“V” Shaped Recovery: Global Inactivated Vaccines Market for Cholera Segment, Revenue Forecast 2020-2030 (US$ billion)
Figure 25.“U” Shaped Recovery: Global Inactivated Vaccines Market for Cholera Segment, Revenue Forecast 2020-2030 (US$ billion , AGR%)
Figure 26. “W” Shaped Recovery: Global Inactivated Vaccines Market for Cholera Segment, Revenue Forecast 2020-2030 (US$ billion , AGR%)
Figure 27.“L” Shaped Recovery: Global Inactivated Vaccines Market for Cholera Segment, Revenue Forecast 2020-2030 (US$ billion, AGR%)
Figure 28. Global Inactivated Vaccines Market for Bacterial Vaccines Segment: Revenue Forecast 2020-2030 (US$ billion , AGR%)
Figure 29. “V” Shaped Recovery: Global Inactivated Vaccines Market for Polio Segment, Revenue Forecast 2020-2030 (US$ billion , AGR%)
Figure 30. “U” Shaped Recovery: Global Inactivated Vaccines Market for Polio Segment, Revenue Forecast 2020-2030 (US$ billion , AGR%)
Figure 31. “W” Shaped Recovery: Global Inactivated Vaccines Market for Polio Segment, Revenue Forecast 2020-2030 (US$ billion , AGR%)
Figure 32. “L” Shaped Recovery: Global Inactivated Vaccines Market for Polio Segment, Revenue Forecast 2020-2030 (US$ billion, AGR%)
Figure 33. Global Inactivated Vaccines Market for Influenza Segment: Revenue Forecast 2020-2030 (US$ billion , AGR%)
Figure 34. “V” Shaped Recovery: Global Inactivated Vaccines Market for Influenza Segment, Revenue Forecast 2020-2030 (US$ billion , AGR%)
Figure 35. “U” Shaped Recovery: Global Inactivated Vaccines Market for Influenza Segment, Revenue Forecast 2020-2030 (US$ billion , AGR%)
Figure 36. “W” Shaped Recovery: Global Inactivated Vaccines Market for Influenza Segment, Revenue Forecast 2020-2030 (US$ billion , AGR%)
Figure 37. “L” Shaped Recovery: Global Inactivated Vaccines Market for Influenza Segment, Revenue Forecast 2020-2030 (US$ billion, AGR%)
Figure 38. Global Inactivated Vaccines Market for Hepatitis Segment: Revenue Forecast 2020-2030 (US$ billion , AGR%)
Figure 39. “V” Shaped Recovery: Global Inactivated Vaccines Market for Hepatitis Segment, Revenue Forecast 2020-2030 (US$ billion , AGR%)
Figure 40.“U” Shaped Recovery: Global Inactivated Vaccines Market for Hepatitis Segment, Revenue Forecast 2020-2030 (US$ billion , AGR%)
Figure 41. “W” Shaped Recovery: Global Inactivated Vaccines Market for Hepatitis Segment, Revenue Forecast 2020-2030 (US$ billion, AGR%)
Figure 42.“L” Shaped Recovery: Global Inactivated Vaccines Market for Hepatitis Segment, Revenue Forecast 2020-2030 (US$ billion, AGR%)
Figure 43.Global Inactivated Vaccines Market for Cell Mediated Rabies Segment: Revenue Forecast 2020-2030 (US$ billion, AGR%)
Figure 44.“V” Shaped Recovery: Global Inactivated Vaccines Market for Cell Mediated Rabies Segment, Revenue Forecast 2020-2030 (US$ billion, AGR%)
Figure 45.“U” Shaped Recovery: Global Inactivated Vaccines Market for Cell Mediated Rabies Segment, Revenue Forecast 2020-2030 (US$ billion , AGR%)
Figure 46. “W” Shaped Recovery: Global Inactivated Vaccines Market for Cell Mediated Rabies Segment, Revenue Forecast 2020-2030 (US$ billion , AGR%)
Figure 47. “L” Shaped Recovery: Global Inactivated Vaccines Market for Cell Mediated Rabies Segment, Revenue Forecast 2020-2030 (US$ billion, AGR%)
Figure 48. Global Inactivated Vaccines Market for Others Segment: Revenue Forecast 2020-2030 (US$ billion , AGR%)
Figure 49.“V” Shaped Recovery: Global Inactivated Vaccines Market for Others Segment, Revenue Forecast 2020-2030 (US$ billion , AGR%)
Figure 50.“U” Shaped Recovery: Global Inactivated Vaccines Market for Others Segment, Revenue Forecast 2020-2030 (US$ billion , AGR%)
Figure 51 “W” Shaped Recovery: Global Inactivated Vaccines Market for Others Segment, Revenue Forecast 2020-2030 (US$ billion , AGR%)
Figure 52. “L” Shaped Recovery: Global Inactivated Vaccines Market for Others Segment, Revenue Forecast 2020-2030 (US$ billion, AGR%)
Figure 53. Global Inactivated Vaccines Market for Pediatrics Segment: Revenue Forecast 2020-2030 (US$ billion , AGR%)
Figure 54. “V” Shaped Recovery: Global Inactivated Vaccines Market for Pediatrics Segment, Revenue Forecast 2020-2030 (US$ billion , AGR%)
Figure 55 “U” Shaped Recovery: Global Inactivated Vaccines Market for Pediatrics Segment, Revenue Forecast 2020-2030 (US$ billion , AGR%)
Figure 57 “W” Shaped Recovery: Global Inactivated Vaccines Market for Pediatrics Segment, Revenue Forecast 2020-2030 (US$ billion, AGR%)
Figure 58.“L” Shaped Recovery: Global Inactivated Vaccines Market for Pediatrics Segment, Revenue Forecast 2020-2030 (US$ billion, AGR%)
Figure 59. Global Inactivated Vaccines Market for Adults Segment: Revenue Forecast 2020-2030 (US$ billion, AGR%)
Figure 60. “V” Shaped Recovery: Global Inactivated Vaccines Market for Adults Segment, Revenue Forecast 2020-2030 (US$ billion, AGR%)
Figure 61. “U” Shaped Recovery: Global Inactivated Vaccines Market for Adults Segment, Revenue Forecast 2020-2030 (US$ billion , AGR%)
Figure 62. “W” Shaped Recovery: Global Inactivated Vaccines Market for Adults Segment, Revenue Forecast 2020-2030 (US$ billion , AGR%)
Figure 63. “L” Shaped Recovery: Global Inactivated Vaccines Market for Adults Segment, Revenue Forecast 2020-2030 (US$ billion, AGR%)
Figure 64. Global Inactivated Vaccines Market Forecast by Channel Type, 2020-2030 (US$ billion, AGR %)
Figure 65. Global Inactivated Vaccines Market Share Forecast by Channel Type, 2020, 2025, 2030 (%)
Figure 66. Global Inactivated Vaccines Market for Hospitals & Clinics Segment: Revenue Forecast 2020-2030 (US$ billion, AGR%)
Figure 67. “V” Shaped Recovery: Global Inactivated Vaccines Market for Hospitals & Clinics Segment, Revenue Forecast 2020-2030 (US$ billion , AGR%)
Figure 68. “U” Shaped Recovery: Global Inactivated Vaccines Market for Hospitals & Clinics Segment, Revenue Forecast 2020-2030 (US$ billion , AGR%)
Figure 69. “W” Shaped Recovery: Global Inactivated Vaccines Market for Hospitals & Clinics Segment, Revenue Forecast 2020-2030 (US$ billion, AGR%)
Figure 70. “L” Shaped Recovery: Global Inactivated Vaccines Market for Hospitals & Clinics Segment, Revenue Forecast 2020-2030 (US$ billion, AGR%)
Figure 71. Global Inactivated Vaccines Market for Others Segment: Revenue Forecast 2020-2030 (US$ billion , AGR%)
Figure 72. “V” Shaped Recovery: Global Inactivated Vaccines Market for Others Segment, Revenue Forecast 2020-2030 (US$ billion, AGR%)
Figure 73. “U” Shaped Recovery: Global Inactivated Vaccines Market for Others Segment, Revenue Forecast 2020-2030 (US$ billion , AGR%)
Figure 74.“W” Shaped Recovery: Global Inactivated Vaccines Market for Others Segment, Revenue Forecast 2020-2030 (US$ billion,, AGR%)
Figure 75. “L” Shaped Recovery: Global Inactivated Vaccines Market for Others Segment, Revenue Forecast 2020-2030 (US$ billion, AGR%)
Figure 76. Global Inactivated Vaccines Market Share Forecast by Region, 2020, 2025, 2030 (%)
Figure77. North America Inactivated Vaccines Market Forecast by Country, 2020-2030 (US$ billion)
Figure 78. North America Inactivated Vaccines Market Share Forecast by Country 2020, 2025, 2030 (%)
Figure 79. “V” Shaped Recovery: North America Inactivated Vaccines Market Forecast by Country, 2020-2030 (US$ billion, AGR%)
Figure 80. “U” Shaped Recovery: North America Inactivated Vaccines Market Forecast by Country, 2020-2030 (US$ billion, AGR%)
Figure 81. “W” Shaped Recovery: North America Inactivated Vaccines Market Forecast by Country, 2020-2030 (US$ billion, AGR%)
Figure 3
Figure 82. “L” Shaped Recovery: North America Inactivated Vaccines Market Forecast by Country, 2020-2030 (US$ billion, AGR%)
Figure 83. North America Inactivated Vaccines Market Forecast by Pathogen Type, 2020-2030 (US$ billion, AGR%)
Figure 84. “V” Shaped Recovery: North America Inactivated Vaccines Market Forecast by Pathogen Type, 2020-2030 (US$ billion, AGR%)
Figure 85. “U” Shaped Recovery: North America Inactivated Vaccines Market Forecast by Pathogen Type, 2020-2030 (US$ billion, AGR%)
Figure 86. “W” Shaped Recovery: North America Inactivated Vaccines Market Forecast by Pathogen Type, 2020-2030 (US$ billion, AGR%)
Figure 87.“L” Shaped Recovery: North America Inactivated Vaccines Market Forecast by Pathogen Type, 2020-2030 (US$ billion, AGR%)
Figure 88. U.S. Inactivated Vaccines Market Forecast 2020-2030 (US$ million, AGR %)
Figure 89. “V” Shaped Recovery: U.S. Inactivated Vaccines Market Forecast, 2020-2030 (US$ billion, AGR%)
Figure 90. “U” Shaped Recovery: U.S. Inactivated Vaccines Market, 2020-2030 (US$ billion, AGR%)
Figure 91. “W” Shaped Recovery: U.S. Inactivated Vaccines Market Forecast, 2020-2030 (US$ billion, AGR%)
Figure 92. “L” Shaped Recovery: U.S. Inactivated Vaccines Market Forecast by Country, 2020-2030 (US$ billion, AGR%)
Figure 93. U.S. Inactivated Vaccines Market Forecast by Pathogen Type, 2020-2030 (US$ billion, AGR%)
Figure 94 “V” Shaped Recovery: U.S. Inactivated Vaccines Market Forecast by Pathogen Type, 2020-2030 (US$ billion, AGR%)
Figure 95. “U” Shaped Recovery: U.S. Inactivated Vaccines Market Forecast by Pathogen Type, 2020-2030 (US$ billion, AGR%)
Figure 96 “W” Shaped Recovery: U.S. Inactivated Vaccines Market Forecast by Pathogen Type, 2020-2030 (US$ billion, AGR%)
Figure 97 “L” Shaped Recovery: U.S. Inactivated Vaccines Market Forecast by Pathogen Type, 2020-2030 (US$ billion, AGR%)
Figure 98. Canada Inactivated Vaccines Market Forecast 2020-2030 (US$ million, AGR %)
Figure 100. “V” Shaped Recovery: Canada Inactivated Vaccines Market Forecast, 2020-2030 (US$ billion, AGR%)
Figure 101 .“U” Shaped Recovery: Canada Inactivated Vaccines Market, 2020-2030 (US$ billion, AGR%)
Figure 102. “W” Shaped Recovery: Canada Inactivated Vaccines Market Forecast, 2020-2030 (US$ billion, AGR%)
Figure 103.“L” Shaped Recovery: Canada Inactivated Vaccines Market Forecast by Country, 2020-2030 (US$ billion, AGR%)
Figure 104. Canada Inactivated Vaccines Market Forecast by Pathogen Type, 2020-2030 (US$ billion, AGR%)
Figure 105 “V” Shaped Recovery: Canada Inactivated Vaccines Market Forecast by Pathogen Type, 2020-2030 (US$ billion, AGR%)
Figure 106.“U” Shaped Recovery: Canada Inactivated Vaccines Market Forecast by Pathogen Type, 2020-2030 (US$ billion, AGR%)
Figure 107. “W” Shaped Recovery: Canada Inactivated Vaccines Market Forecast by Pathogen Type, 2020-2030 (US$ billion, AGR%)
Figure 108.“L” Shaped Recovery: Canada Inactivated Vaccines Market Forecast by Pathogen Type, 2020-2030 (US$ billion, AGR%)
Figure 109. Europe Inactivated Vaccines Market Forecast by Country, 2020-2030 (US$ billion)
Figure 110 Europe Inactivated Vaccines Market Share Forecast by Country 2020, 2025, 2030 (%)
Figure 111 “V” Shaped Recovery: Europe Inactivated Vaccines Market Forecast by Country, 2020-2030 (US$ billion, AGR%)
Figure 112 “U” Shaped Recovery: Europe Inactivated Vaccines Market Forecast by Country, 2020-2030 (US$ billion, AGR%)
Figure 113 “W” Shaped Recovery: Europe Inactivated Vaccines Market Forecast by Country, 2020-2030 (US$ billion, AGR%)
Figure 114 “L” Shaped Recovery: Europe Inactivated Vaccines Market Forecast by Country, 2020-2030 (US$ billion, AGR%)
Figure 115. Europe Inactivated Vaccines Market Forecast by Pathogen Type, 2020-2030 (US$ billion, AGR%)
Figure 116 “V” Shaped Recovery: Europe Inactivated Vaccines Market Forecast by Pathogen Type, 2020-2030 (US$ billion, AGR%)
Figure 117 “U” Shaped Recovery: Europe Inactivated Vaccines Market Forecast by Pathogen Type, 2020-2030 (US$ billion, AGR%)
Figure 118. “W” Shaped Recovery: Europe Inactivated Vaccines Market Forecast by Pathogen Type, 2020-2030 (US$ billion, AGR%)
Figure 119. “L” Shaped Recovery: Europe Inactivated Vaccines Market Forecast by Pathogen Type, 2020-2030 (US$ billion, AGR%)
Figure 120. Germany Inactivated Vaccines Market Forecast 2020-2030 (US$ million, AGR %)
Figure 121. “V” Shaped Recovery: Germany Inactivated Vaccines Market Forecast, 2020-2030 (US$ billion, AGR%)
Figure 122. “U” Shaped Recovery: Germany Inactivated Vaccines Market, 2020-2030 (US$ billion, AGR%)
Figure 123. “W” Shaped Recovery: Germany Inactivated Vaccines Market Forecast, 2020-2030 (US$ billion, AGR%)
Figure 124. “L” Shaped Recovery: Germany Inactivated Vaccines Market Forecast by Country, 2020-2030 (US$ billion, AGR%)
Figure 125. Germany Inactivated Vaccines Market Forecast by Pathogen Type, 2020-2030 (US$ billion, AGR%)
Figure 126. “V” Shaped Recovery: Germany Inactivated Vaccines Market Forecast by Pathogen Type, 2020-2030 (US$ billion, AGR%)
Figure 127. “U” Shaped Recovery: Germany Inactivated Vaccines Market Forecast by Pathogen Type, 2020-2030 (US$ billion, AGR%)
Figure 128. “W” Shaped Recovery: Germany Inactivated Vaccines Market Forecast by Pathogen Type, 2020-2030 (US$ billion, AGR%)
Figure 129. “L” Shaped Recovery: Germany Inactivated Vaccines Market Forecast by Pathogen Type, 2020-2030 (US$ billion, AGR%)
Figure 130. UK Inactivated Vaccines Market Forecast 2020-2030 (US$ million, AGR %)
Figure 131. “V” Shaped Recovery: UK Inactivated Vaccines Market Forecast, 2020-2030 (US$ billion, AGR%)
Figure 132. “U” Shaped Recovery: UK Inactivated Vaccines Market, 2020-2030 (US$ billion, AGR%)
Figure 133. “W” Shaped Recovery: UK Inactivated Vaccines Market Forecast, 2020-2030 (US$ billion, AGR%)
Figure 134.“L” Shaped Recovery: UK Inactivated Vaccines Market Forecast by Country, 2020-2030 (US$ billion, AGR%)
Figure 135. UK Inactivated Vaccines Market Forecast by Pathogen Type, 2020-2030 (US$ billion, AGR%)
Figure 136.“V” Shaped Recovery: UK Inactivated Vaccines Market Forecast by Pathogen Type, 2020-2030 (US$ billion, AGR%)
Figure 137. “U” Shaped Recovery: UK Inactivated Vaccines Market Forecast by Pathogen Type, 2020-2030 (US$ billion, AGR%)
Figure 138. “W” Shaped Recovery: UK Inactivated Vaccines Market Forecast by Pathogen Type, 2020-2030 (US$ billion, AGR%)
Figure 139. “L” Shaped Recovery: UK Inactivated Vaccines Market Forecast by Pathogen Type, 2020-2030 (US$ billion, AGR%)
Figure 140. Italy Inactivated Vaccines Market Forecast 2020-2030 (US$ million, AGR %)
Figure 141. “V” Shaped Recovery: Italy Inactivated Vaccines Market Forecast, 2020-2030 (US$ billion, AGR%)
Figure 142. “U” Shaped Recovery: Italy Inactivated Vaccines Market, 2020-2030 (US$ billion, AGR%)
Figure 143.“W” Shaped Recovery: Italy Inactivated Vaccines Market Forecast, 2020-2030 (US$ billion, AGR%)
Figure 144.“L” Shaped Recovery: Italy Inactivated Vaccines Market Forecast by Country, 2020-2030 (US$ billion, AGR%)
Figure 145. Italy Inactivated Vaccines Market Forecast by Pathogen Type, 2020-2030 (US$ billion, AGR%)
Figure 146. “V” Shaped Recovery: Italy Inactivated Vaccines Market Forecast by Pathogen Type, 2020-2030 (US$ billion, AGR%)
Figure 147.“U” Shaped Recovery: Italy Inactivated Vaccines Market Forecast by Pathogen Type, 2020-2030 (US$ billion, AGR%)
Figure 148. “W” Shaped Recovery: Italy Inactivated Vaccines Market Forecast by Pathogen Type, 2020-2030 (US$ billion, AGR%)
Figure 149. “L” Shaped Recovery: Italy Inactivated Vaccines Market Forecast by Pathogen Type, 2020-2030 (US$ billion, AGR%)
Figure 120. France Inactivated Vaccines Market Forecast 2020-2030 (US$ million, AGR %)
Figure 121. “V” Shaped Recovery: Germany Inactivated Vaccines Market Forecast, 2020-2030 (US$ billion, AGR%)
Figure 122. “U” Shaped Recovery: France Inactivated Vaccines Market, 2020-2030 (US$ billion, AGR%)
Figure 123. “W” Shaped Recovery: France Inactivated Vaccines Market Forecast, 2020-2030 (US$ billion, AGR%)
Figure 124. “L” Shaped Recovery: France Inactivated Vaccines Market Forecast by Country, 2020-2030 (US$ billion, AGR%)
Figure 125. France Inactivated Vaccines Market Forecast by Pathogen Type, 2020-2030 (US$ billion, AGR%)
Figure 126. “V” Shaped Recovery: France Inactivated Vaccines Market Forecast by Pathogen Type, 2020-2030 (US$ billion, AGR%)
Figure 127. “U” Shaped Recovery: France Inactivated Vaccines Market Forecast by Pathogen Type, 2020-2030 (US$ billion, AGR%)
Figure 128. “W” Shaped Recovery: France Inactivated Vaccines Market Forecast by Pathogen Type, 2020-2030 (US$ billion, AGR%)
Figure 129. “L” Shaped Recovery: France Inactivated Vaccines Market Forecast by Pathogen Type, 2020-2030 (US$ billion, AGR%)
Figure 120. Spain Inactivated Vaccines Market Forecast 2020-2030 (US$ million, AGR %)
Figure 121. “V” Shaped Recovery: Spain Inactivated Vaccines Market Forecast, 2020-2030 (US$ billion, AGR%)
Figure 122. “U” Shaped Recovery: Spain Inactivated Vaccines Market, 2020-2030 (US$ billion, AGR%)
Figure 123. “W” Shaped Recovery: Spain Inactivated Vaccines Market Forecast, 2020-2030 (US$ billion, AGR%)
Figure 124. “L” Shaped Recovery: Spain Inactivated Vaccines Market Forecast by Country, 2020-2030 (US$ billion, AGR%)
Figure 125. Spain Inactivated Vaccines Market Forecast by Pathogen Type, 2020-2030 (US$ billion, AGR%)
Figure 126. “V” Shaped Recovery: Spain Inactivated Vaccines Market Forecast by Pathogen Type, 2020-2030 (US$ billion, AGR%)
Figure 127. “U” Shaped Recovery: Spain Inactivated Vaccines Market Forecast by Pathogen Type, 2020-2030 (US$ billion, AGR%)
Figure 128. “W” Shaped Recovery: Spain Inactivated Vaccines Market Forecast by Pathogen Type, 2020-2030 (US$ billion, AGR%)
Figure 129. “L” Shaped Recovery: Spain Inactivated Vaccines Market Forecast by Pathogen Type, 2020-2030 (US$ billion, AGR%)
Figure 120. Rest of Europe Inactivated Vaccines Market Forecast 2020-2030 (US$ million, AGR %)
Figure 121. “V” Shaped Recovery: Rest of Europe Inactivated Vaccines Market Forecast, 2020-2030 (US$ billion, AGR%)
Figure 122. “U” Shaped Recovery: Rest of Europe Inactivated Vaccines Market, 2020-2030 (US$ billion, AGR%)
Figure 123. “W” Shaped Recovery: Rest of Europe Inactivated Vaccines Market Forecast, 2020-2030 (US$ billion, AGR%)
Figure 124. “L” Shaped Recovery: Rest of Europe Inactivated Vaccines Market Forecast by Country, 2020-2030 (US$ billion, AGR%)
Figure 125. Rest of Europe Inactivated Vaccines Market Forecast by Pathogen Type, 2020-2030 (US$ billion, AGR%)
Figure 126. “V” Shaped Recovery: Rest of Europe Inactivated Vaccines Market Forecast by Pathogen Type, 2020-2030 (US$ billion, AGR%)
Figure 127. “U” Shaped Recovery: Rest of Europe Inactivated Vaccines Market Forecast by Pathogen Type, 2020-2030 (US$ billion, AGR%)
Figure 128. “W” Shaped Recovery: Rest of Europe Inactivated Vaccines Market Forecast by Pathogen Type, 2020-2030 (US$ billion, AGR%)
Figure 129. “L” Shaped Recovery: Rest of Europe Inactivated Vaccines Market Forecast by Pathogen Type, 2020-2030 (US$ billion, AGR%)
Figure 150. Asia Pacific Inactivated Vaccines Market Forecast by Country, 2020-2030 (US$ billion)
Figure 151. Asia Pacific Inactivated Vaccines Market Share Forecast by Country 2020, 2025, 2030 (%)
Figure 153. “V” Shaped Recovery: Asia Pacific Inactivated Vaccines Market, 2020-2030 (US$ billion, AGR%)
Figure 154 “U” Shaped Recovery: Asia Pacific Inactivated Vaccines Market, 2020-2030 (US$ billion, AGR%)
Figure 155. “W” Shaped Recovery: Asia Pacific Inactivated Vaccines Market Forecast, 2020-2030 (US$ billion, AGR%)
Figure 156. “L” Shaped Recovery: Asia Pacific Inactivated Vaccines Market Forecast by Country, 2020-2030 (US$ billion, AGR%)
Figure 157. China Inactivated Vaccines Market Forecast 2020-2030 (US$ million, AGR %)
Figure 158.“V” Shaped Recovery: China Inactivated Vaccines Market Forecast, 2020-2030 (US$ billion, AGR%)
Figure 159. “U” Shaped Recovery: China Inactivated Vaccines Market, 2020-2030 (US$ billion, AGR%)
Figure 160. “W” Shaped Recovery: China Inactivated Vaccines Market Forecast, 2020-2030 (US$ billion, AGR%)
Figure 161.“L” Shaped Recovery: China Inactivated Vaccines Market Forecast by Country, 2020-2030 (US$ billion, AGR%)
Figure 162. China Inactivated Vaccines Market Forecast by Pathogen Type, 2020-2030 (US$ billion, AGR%)
Figure 163. “V” Shaped Recovery: China Inactivated Vaccines Market Forecast by Pathogen Type, 2020-2030 (US$ billion, AGR%)
Figure 164.“U” Shaped Recovery: China Inactivated Vaccines Market Forecast by Pathogen Type, 2020-2030 (US$ billion, AGR%)
Figure 165. “W” Shaped Recovery: China Inactivated Vaccines Market Forecast by Pathogen Type, 2020-2030 (US$ billion, AGR%)
Figure 166.“L” Shaped Recovery: China Inactivated Vaccines Market Forecast by Pathogen Type, 2020-2030 (US$ billion, AGR%)
Figure 167. India Inactivated Vaccines Market Forecast 2020-2030 (US$ million, AGR %)
Figure 168.“V” Shaped Recovery: India Inactivated Vaccines Market Forecast, 2020-2030 (US$ billion, AGR%)
Figure 169.“U” Shaped Recovery: India Inactivated Vaccines Market, 2020-2030 (US$ billion, AGR%)
Figure 170. “W” Shaped Recovery: India Inactivated Vaccines Market Forecast, 2020-2030 (US$ billion, AGR%)
Figure 171. “L” Shaped Recovery: India Inactivated Vaccines Market Forecast by Country, 2020-2030 (US$ billion, AGR%)
Figure 172. India Inactivated Vaccines Market Forecast by Pathogen Type, 2020-2030 (US$ billion, AGR%)
Figure 173. “V” Shaped Recovery: India Inactivated Vaccines Market Forecast by Pathogen Type, 2020-2030 (US$ billion, AGR%)
Figure 174. “U” Shaped Recovery: India Inactivated Vaccines Market Forecast by Pathogen Type, 2020-2030 (US$ billion, AGR%)
Figure 175. “W” Shaped Recovery: India Inactivated Vaccines Market Forecast by Pathogen Type, 2020-2030 (US$ billion, AGR%)
Figure 176. “L” Shaped Recovery: India Inactivated Vaccines Market Forecast by Pathogen Type, 2020-2030 (US$ billion, AGR%)
Figure 177. Japan Inactivated Vaccines Market Forecast 2020-2030 (US$ million, AGR %)
Figure 178. “V” Shaped Recovery: Japan Inactivated Vaccines Market Forecast, 2020-2030 (US$ billion, AGR%)
Figure 179. “U” Shaped Recovery: Japan Inactivated Vaccines Market, 2020-2030 (US$ billion, AGR%)
Figure 180. “W” Shaped Recovery: Japan Inactivated Vaccines Market Forecast, 2020-2030 (US$ billion, AGR%)
Figure 181. “L” Shaped Recovery: Japan Inactivated Vaccines Market Forecast by Country, 2020-2030 (US$ billion, AGR%)
Figure 182. Japan Inactivated Vaccines Market Forecast by Pathogen Type, 2020-2030 (US$ billion, AGR%)
Figure 183. “V” Shaped Recovery: Japan Inactivated Vaccines Market Forecast by Pathogen Type, 2020-2030 (US$ billion, AGR%)
Figure 184. “U” Shaped Recovery: Japan Inactivated Vaccines Market Forecast by Pathogen Type, 2020-2030 (US$ billion, AGR%)
Figure 185. “W” Shaped Recovery: Japan Inactivated Vaccines Market Forecast by Pathogen Type, 2020-2030 (US$ billion, AGR%)
Figure 186. “L” Shaped Recovery: Japan Inactivated Vaccines Market Forecast by Pathogen Type, 2020-2030 (US$ billion, AGR%)
Figure 157. Australia Inactivated Vaccines Market Forecast 2020-2030 (US$ million, AGR %)
Figure 158.“V” Shaped Recovery: Australia Inactivated Vaccines Market Forecast, 2020-2030 (US$ billion, AGR%)
Figure 159. “U” Shaped Recovery: Australia Inactivated Vaccines Market, 2020-2030 (US$ billion, AGR%)
Figure 160. “W” Shaped Recovery: Australia Inactivated Vaccines Market Forecast, 2020-2030 (US$ billion, AGR%)
Figure 161.“L” Shaped Recovery: Australia Inactivated Vaccines Market Forecast by Country, 2020-2030 (US$ billion, AGR%)
Figure 162. Australia Inactivated Vaccines Market Forecast by Pathogen Type, 2020-2030 (US$ billion, AGR%)
Figure 163. “V” Shaped Recovery: Australia Inactivated Vaccines Market Forecast by Pathogen Type, 2020-2030 (US$ billion, AGR%)
Figure 164.“U” Shaped Recovery: Australia Inactivated Vaccines Market Forecast by Pathogen Type, 2020-2030 (US$ billion, AGR%)
Figure 165. “W” Shaped Recovery: Australia Inactivated Vaccines Market Forecast by Pathogen Type, 2020-2030 (US$ billion, AGR%)
Figure 166.“L” Shaped Recovery: Australia Inactivated Vaccines Market Forecast by Pathogen Type, 2020-2030 (US$ billion, AGR%)
Figure 157. Rest of Asia Pacific Inactivated Vaccines Market Forecast 2020-2030 (US$ million, AGR %)
Figure 158.“V” Shaped Recovery: Rest of Asia Pacific Inactivated Vaccines Market Forecast, 2020-2030 (US$ billion, AGR%)
Figure 159. “U” Shaped Recovery: Rest of Asia Pacific Inactivated Vaccines Market, 2020-2030 (US$ billion, AGR%)
Figure 160. “W” Shaped Recovery: Rest of Asia Pacific Inactivated Vaccines Market Forecast, 2020-2030 (US$ billion, AGR%)
Figure 161.“L” Shaped Recovery: Rest of Asia Pacific Inactivated Vaccines Market Forecast by Country, 2020-2030 (US$ billion, AGR%)
Figure 162. Rest of Asia Pacific Inactivated Vaccines Market Forecast by Pathogen Type, 2020-2030 (US$ billion, AGR%)
Figure 163. “V” Shaped Recovery: Rest of Asia Pacific Inactivated Vaccines Market Forecast by Pathogen Type, 2020-2030 (US$ billion, AGR%)
Figure 164.“U” Shaped Recovery: Rest of Asia Pacific Inactivated Vaccines Market Forecast by Pathogen Type, 2020-2030 (US$ billion, AGR%)
Figure 165. “W” Shaped Recovery: Rest of Asia Pacific Inactivated Vaccines Market Forecast by Pathogen Type, 2020-2030 (US$ billion, AGR%)
Figure 166.“L” Shaped Recovery: Rest of Asia Pacific Inactivated Vaccines Market Forecast by Pathogen Type, 2020-2030 (US$ billion, AGR%)
Figure 187. Latin America Inactivated Vaccines Market Forecast by Country, 2020-2030 (US$ billion)
Figure 188. Latin America Inactivated Vaccines Market Share Forecast by Country 2020, 2025, 2030 (%)
Figure 189. “V” Shaped Recovery: Latin America Inactivated Vaccines Market Forecast, 2020-2030 (US$ billion, AGR%)
Figure 190. “U” Shaped Recovery: Latin America Inactivated Vaccines Market, 2020-2030 (US$ billion, AGR%)
Figure 191. “W” Shaped Recovery: Latin America Inactivated Vaccines Market Forecast, 2020-2030 (US$ billion, AGR%)
Figure 192. “L” Shaped Recovery: Latin America Inactivated Vaccines Market Forecast by Country, 2020-2030 (US$ billion, AGR%)
Figure 193. Latin America Inactivated Vaccines Market Forecast by Pathogen Type, 2020-2030 (US$ billion, AGR%)
Figure 194. “V” Shaped Recovery: Latin America Inactivated Vaccines Market Forecast by Pathogen Type, 2020-2030 (US$ billion, AGR%)
Figure 195. “U” Shaped Recovery: Latin America Inactivated Vaccines Market Forecast by Pathogen Type, 2020-2030 (US$ billion, AGR%)
Figure 196. “W” Shaped Recovery: Latin America Inactivated Vaccines Market Forecast by Pathogen Type, 2020-2030 (US$ billion, AGR%)
Figure 197. “L” Shaped Recovery: Latin America Inactivated Vaccines Market Forecast by Pathogen Type, 2020-2030 (US$ billion, AGR%)
Figure 198. Brazil Inactivated Vaccines Market Forecast 2020-2030 (US$ million, AGR %)
Figure 199. “V” Shaped Recovery: Brazil Inactivated Vaccines Market Forecast, 2020-2030 (US$ billion, AGR%)
Figure 200. “U” Shaped Recovery: Brazil Inactivated Vaccines Market, 2020-2030 (US$ billion, AGR%)
Figure 201. “W” Shaped Recovery: Brazil Inactivated Vaccines Market Forecast, 2020-2030 (US$ billion, AGR%)
Figure 202. “L” Shaped Recovery: Brazil Inactivated Vaccines Market Forecast by Country, 2020-2030 (US$ billion, AGR%)
Figure 203. Brazil Inactivated Vaccines Market Forecast by Pathogen Type, 2020-2030 (US$ billion, AGR%)
Figure 204. “V” Shaped Recovery: Brazil Inactivated Vaccines Market Forecast by Pathogen Type, 2020-2030 (US$ billion, AGR%)
Figure 205. “U” Shaped Recovery: Brazil Inactivated Vaccines Market Forecast by Pathogen Type, 2020-2030 (US$ billion, AGR%)
Figure 206. “W” Shaped Recovery: Brazil Inactivated Vaccines Market Forecast by Pathogen Type, 2020-2030 (US$ billion, AGR%)
Figure 207. “L” Shaped Recovery: Brazil Inactivated Vaccines Market Forecast by Pathogen Type, 2020-2030 (US$ billion, AGR%)
Figure 157. Argentina Inactivated Vaccines Market Forecast 2020-2030 (US$ million, AGR %)
Figure 158.“V” Shaped Recovery: Argentina Inactivated Vaccines Market Forecast, 2020-2030 (US$ billion, AGR%)
Figure 159. “U” Shaped Recovery: Argentina Inactivated Vaccines Market, 2020-2030 (US$ billion, AGR%)
Figure 160. “W” Shaped Recovery: Argentina Inactivated Vaccines Market Forecast, 2020-2030 (US$ billion, AGR%)
Figure 161.“L” Shaped Recovery: Argentina Inactivated Vaccines Market Forecast by Country, 2020-2030 (US$ billion, AGR%)
Figure 162. Argentina Inactivated Vaccines Market Forecast by Pathogen Type, 2020-2030 (US$ billion, AGR%)
Figure 163. “V” Shaped Recovery: Argentina Inactivated Vaccines Market Forecast by Pathogen Type, 2020-2030 (US$ billion, AGR%)
Figure 164.“U” Shaped Recovery: Argentina Inactivated Vaccines Market Forecast by Pathogen Type, 2020-2030 (US$ billion, AGR%)
Figure 165. “W” Shaped Recovery: Argentina Inactivated Vaccines Market Forecast by Pathogen Type, 2020-2030 (US$ billion, AGR%)
Figure 166.“L” Shaped Recovery: Argentina Inactivated Vaccines Market Forecast by Pathogen Type, 2020-2030 (US$ billion, AGR%)
Figure 157. Rest of Latin America Inactivated Vaccines Market Forecast 2020-2030 (US$ million, AGR %)
Figure 158.“V” Shaped Recovery: Rest of Latin America Inactivated Vaccines Market Forecast, 2020-2030 (US$ billion, AGR%)
Figure 159. “U” Shaped Recovery: Rest of Latin America Inactivated Vaccines Market, 2020-2030 (US$ billion, AGR%)
Figure 160. “W” Shaped Recovery: Rest of Latin America Inactivated Vaccines Market Forecast, 2020-2030 (US$ billion, AGR%)
Figure 161.“L” Shaped Recovery: Rest of Latin America Inactivated Vaccines Market Forecast by Country, 2020-2030 (US$ billion, AGR%)
Figure 162. Rest of Latin America Inactivated Vaccines Market Forecast by Pathogen Type, 2020-2030 (US$ billion, AGR%)
Figure 163. “V” Shaped Recovery: Rest of Latin America Inactivated Vaccines Market Forecast by Pathogen Type, 2020-2030 (US$ billion, AGR%)
Figure 164.“U” Shaped Recovery: Rest of Latin America Inactivated Vaccines Market Forecast by Pathogen Type, 2020-2030 (US$ billion, AGR%)
Figure 165. “W” Shaped Recovery: Rest of Latin America Inactivated Vaccines Market Forecast by Pathogen Type, 2020-2030 (US$ billion, AGR%)
Figure 166.“L” Shaped Recovery: Rest of Latin America Inactivated Vaccines Market Forecast by Pathogen Type, 2020-2030 (US$ billion, AGR%)
Figure 208. Middle East and Africa Inactivated Vaccines Market Forecast by Country, 2020-2030 (US$ billion)
Figure 209. Latin America Inactivated Vaccines Market Share Forecast by Country 2020, 2025, 2030 (%)
Figure 210. “V” Shaped Recovery: Middle East and Africa Inactivated Vaccines Market Forecast, 2020-2030 (US$ billion, AGR%)
Figure 211.“U” Shaped Recovery: Middle East and Africa Inactivated Vaccines Market, 2020-2030 (US$ billion, AGR%)
Figure 212. “W” Shaped Recovery: Middle East and Africa Inactivated Vaccines Market Forecast, 2020-2030 (US$ billion, AGR%)
Figure 213. “L” Shaped Recovery: Middle East and Africa Inactivated Vaccines Market Forecast by Country, 2020-2030 (US$ billion, AGR%)
Figure 214. Middle East and Africa Inactivated Vaccines Market Forecast by Pathogen Type, 2020-2030 (US$ billion, AGR%)
Figure 215. “V” Shaped Recovery: Middle East and Africa Inactivated Vaccines Market Forecast by Pathogen Type, 2020-2030 (US$ billion, AGR%)
Figure 216. “U” Shaped Recovery: Middle East and Africa Inactivated Vaccines Market Forecast by Pathogen Type, 2020-2030 (US$ billion, AGR%)
Figure 217. “W” Shaped Recovery: Middle East and Africa Inactivated Vaccines Market Forecast by Pathogen Type, 2020-2030 (US$ billion, AGR%)
Figure 218. “L” Shaped Recovery: Middle East and Africa Inactivated Vaccines Market Forecast by Pathogen Type, 2020-2030 (US$ billion, AGR%)
Figure 219. Saudi Arabia Inactivated Vaccines Market Forecast 2020-2030 (US$ million, AGR %)
Figure 220. “V” Shaped Recovery: Saudi Arabia Inactivated Vaccines Market Forecast, 2020-2030 (US$ billion, AGR%)
Figure 221. “U” Shaped Recovery: Brazil Inactivated Vaccines Market, 2020-2030 (US$ billion, AGR%)
Figure 223. “W” Shaped Recovery: Saudi Arabia Inactivated Vaccines Market Forecast, 2020-2030 (US$ billion, AGR%)
Figure 224.“L” Shaped Recovery: Saudi Arabia Inactivated Vaccines Market Forecast by Country, 2020-2030 (US$ billion, AGR%)
Figure 225. Saudi Arabia Inactivated Vaccines Market Forecast by Pathogen Type, 2020-2030 (US$ billion, AGR%)
Figure 226. “V” Shaped Recovery: Saudi Arabia Inactivated Vaccines Market Forecast by Pathogen Type, 2020-2030 (US$ billion, AGR%)
Figure 227. “U” Shaped Recovery: Saudi Arabia Inactivated Vaccines Market Forecast by Pathogen Type, 2020-2030 (US$ billion, AGR%)
Figure 228. “W” Shaped Recovery: Saudi Arabia Inactivated Vaccines Market Forecast by Pathogen Type, 2020-2030 (US$ billion, AGR%)
Figure 229. “L” Shaped Recovery: Saudi Arabia Inactivated Vaccines Market Forecast by Pathogen Type, 2020-2030 (US$ billion, AGR%)
Figure 157. South Africa Inactivated Vaccines Market Forecast 2020-2030 (US$ million, AGR %)
Figure 158.“V” Shaped Recovery: South Africa Inactivated Vaccines Market Forecast, 2020-2030 (US$ billion, AGR%)
Figure 159. “U” Shaped Recovery: South Africa Inactivated Vaccines Market, 2020-2030 (US$ billion, AGR%)
Figure 160. “W” Shaped Recovery: South Africa Inactivated Vaccines Market Forecast, 2020-2030 (US$ billion, AGR%)
Figure 161.“L” Shaped Recovery: South Africa Inactivated Vaccines Market Forecast by Country, 2020-2030 (US$ billion, AGR%)
Figure 162. South Africa Inactivated Vaccines Market Forecast by Pathogen Type, 2020-2030 (US$ billion, AGR%)
Figure 163. “V” Shaped Recovery: South Africa Inactivated Vaccines Market Forecast by Pathogen Type, 2020-2030 (US$ billion, AGR%)
Figure 164.“U” Shaped Recovery: South Africa Inactivated Vaccines Market Forecast by Pathogen Type, 2020-2030 (US$ billion, AGR%)
Figure 165. “W” Shaped Recovery: South Africa Inactivated Vaccines Market Forecast by Pathogen Type, 2020-2030 (US$ billion, AGR%)
Figure 166.“L” Shaped Recovery: South Africa Inactivated Vaccines Market Forecast by Pathogen Type, 2020-2030 (US$ billion, AGR%)
Figure 157. Rest of Middle East and Africa Inactivated Vaccines Market Forecast 2020-2030 (US$ million, AGR %)
Figure 158.“V” Shaped Recovery: Rest of Middle East and Africa Inactivated Vaccines Market Forecast, 2020-2030 (US$ billion, AGR%)
Figure 159. “U” Shaped Recovery: Rest of Middle East and Africa Inactivated Vaccines Market, 2020-2030 (US$ billion, AGR%)
Figure 160. “W” Shaped Recovery: Rest of Middle East and Africa Inactivated Vaccines Market Forecast, 2020-2030 (US$ billion, AGR%)
Figure 161.“L” Shaped Recovery: Rest of Middle East and Africa Inactivated Vaccines Market Forecast by Country, 2020-2030 (US$ billion, AGR%)
Figure 162. Rest of Middle East and Africa Inactivated Vaccines Market Forecast by Pathogen Type, 2020-2030 (US$ billion, AGR%)
Figure 163. “V” Shaped Recovery: Rest of Middle East and Africa Inactivated Vaccines Market Forecast by Pathogen Type, 2020-2030 (US$ billion, AGR%)
Figure 164.“U” Shaped Recovery: Rest of Middle East and Africa Inactivated Vaccines Market Forecast by Pathogen Type, 2020-2030 (US$ billion, AGR%)
Figure 165. “W” Shaped Recovery: Rest of Middle East and Africa Inactivated Vaccines Market Forecast by Pathogen Type, 2020-2030 (US$ billion, AGR%)
Figure 166.“L” Shaped Recovery: Rest of Middle East and Africa Inactivated Vaccines Market Forecast by Pathogen Type, 2020-2030 (US$ billion, AGR%)
Figure 230. GlaxoSmithKline PLC Total Company Sales 2015-2019 (US $bn)
Figure 231. GlaxoSmithKline PLC – Segmental Performance (%, 2019)
Figure 253. Inactivated Vaccines Market by Pathogen Type Share Forecast2019, 2024, 2030 (% Share)