The Immuno-Oncology Clinical Trials Market Report 2023-2033: This report will prove invaluable to leading firms striving for new revenue pockets if they wish to understand the industry and its underlying dynamics better. It will be useful for companies that want to expand into different industries or their existing operations in a new region.
Increasing Number of Interventional Immuno Oncology Clinical Trials Driving Market Growth
Clinical studies that evaluate a new intervention, like a medicine or a medical technology, are known as interventional trials. Clinical trials in immuno oncology evaluate the efficacy of brand-new immunotherapies for cancer. Furthermore, interventional radiologists have created new procedures and equipment for both intratumor ablative techniques to cure disease and a variety of transarterial intrahepatic therapeutic alternatives, continually improving patient results. Interventional radiologists undertake treatments that can result in immune augmentation, strengthening the role of immunotherapies, such as ablative (radiofrequency and microwave ablation) or embolic.
The number of interventional immuno oncology clinical trials was over 7,000 as of January 2023. More than 3,000 of these trials fell under Phase III. Melanoma, NSCLC, and colorectal cancer are the cancer types that are examined in immuno oncology clinical trials the most frequently. Checkpoint inhibitors, CAR T cells, and oncolytic viruses are the immunotherapies most frequently investigated in immuno oncology clinical trials.
Serious Issues and Substantial Medical Costs Likely to Challenge Industry Growth
Immunotherapy is a relatively recent type of cancer treatment using the body’s immune system to combat cancer cells. Although it is expensive, it has shown significant potential in treating several tumors. There are a few factors that contribute to immunotherapy’s high cost. It is a complicated treatment that necessitates much research and development. Second, it is frequently produced using pricey biologic medications that are challenging to produce. Third, immunotherapy is in high demand, which raises the cost. Many cancer patients may find it difficult to get immunotherapy due to its high cost. Immunotherapy, for instance, typically costs more than $100,000 a year in the United States.
Further, high medical costs are a big issue for patients worldwide. There is intense pressure to reduce costs and demonstrate value. The lack of accessible drugs has impacted population health in underdeveloped nations and shortened average life expectancy. Immunotherapy often involves an average annual cost of above $100,000 per patient; if the worth of medical insurance were considered, this cost would rise to $850,000 per patient. As a result of the high price of immuno oncology therapy, it is projected that the market for immuno oncology medications will expand slowly.
What Questions Should You Ask Before Buying a Market Research Report?
• How is immuno oncology clinical trials market evolving?
• What is driving and restraining immuno oncology clinical trials market?
• How will each immuno oncology clinical trials submarket segment grow over the forecast period, and how much revenue will these submarkets account for in 2033?
• How will the market shares for each immuno oncology clinical trials submarket develop from 2023 to 2033?
• What will be the main driver for the overall market from 2023 to 2033?
• Will leading immuno oncology clinical trials markets broadly follow the macroeconomic dynamics, or will individual national markets outperform others?
• How will the market shares of the national markets change by 2033, and which geographical region will lead the market in 2033?
• Who are the leading players, and what are their prospects over the forecast period?
• What are the immuno oncology clinical trials projects for these leading companies?
• How will the industry evolve during the period between 2023 and 2033? What are the implications of immuno oncology clinical trials projects taking place now and over the next 10 years?
• Is there a greater need for product commercialization to further scale immuno oncology clinical trials market?
• Where is the immuno oncology clinical trials market heading and how can you ensure you are at the forefront of the market?
• What are the best investment options for new product and service lines?
• What are the key prospects for moving companies into a new growth path and C-suite?
You need to discover how this will impact the Immuno Oncology Clinical Trials market today, and over the next 10 years:
• Our 249-page report provides 96 tables and 145 charts/graphs exclusively to you.
• The report highlights key lucrative areas in the industry so you can target them – NOW.
• It contains in-depth analysis of global, regional and national sales and growth.
• It highlights for you the key successful trends, changes and revenue projections made by your competitors.
This report tells you TODAY how the immuno oncology clinical trials market will develop in the next 10 years, and in line with the variations in COVID-19 economic recession and bounce. This market is more critical now than at any point over the last 10 years.
Forecasts to 2033 and other analyses reveal commercial prospects
• In addition to revenue forecasting to 2033, our new study provides you with recent results, growth rates, and market shares.
• You will find original analyses, with business outlooks and developments.
• Discover qualitative analyses (including market dynamics, drivers, opportunities, restraints and challenges), cost structure, impact of rising Immuno Oncology Clinical Trials prices and recent developments.
This report includes data analysis and invaluable insight into how COVID-19 will affect the industry and your company. Four COVID-19 recovery patterns and their impact, namely, “V”, “L”, “W” and “U” are discussed in this report.
Segments Covered in the Report
Phase
• Phase I
• Phase II
• Phase III
• Phase IV
Design
• Interventional Trials
• Observational Trials
• Expanded Access Trials
Indication
• Solid Tumours
• Hematological Cancer

In addition to the revenue predictions for the overall world market and segments, you will also find revenue forecasts for five regional and 20 leading national markets:
North America
• U.S.
• Canada
Europe
• Germany
• UK
• France
• Spain
• Italy
• Rest of Europe
Asia Pacific
• China
• Japan
• India
• Australia
• South Korea
• Rest of Asia Pacific
Latin America
• Brazil
• Mexico
• Rest of Latin America
MEA
• GCC
• South Africa
• Rest of MEA
Need industry data? Please contact us today.
The report also includes profiles and for some of the leading companies in the Immuno Oncology Clinical Trials Market, 2023 to 2033, with a focus on this segment of these companies’ operations.
Leading Companies and the Potential for market growth
• AstraZeneca plc
• BioNTech SE
• Bristol-Myers Squibb Company
• Exscientia plc
• F. Hoffmann-La Roche AG
• ICON plc
• IO Biotech, Inc.
• IQVIA Inc.
• Medpace, Inc.
• Merck & Co., Inc.
• Novartis AG
• Pfizer Inc.
• Syneos Health
Overall world revenue for Immuno Oncology Clinical Trials Market, 2023 to 2033 in terms of value the market will surpass US$6,800 million in 2023, our work calculates. We predict strong revenue growth through to 2033. Our work identifies which organizations hold the greatest potential. Discover their capabilities, progress, and commercial prospects, helping you stay ahead.
How will the Immuno Oncology Clinical Trials Market, 2023 to 2033 report help you?
In summary, our 240+ page report provides you with the following knowledge:
• Revenue forecasts to 2033 for Immuno Oncology Clinical Trials Market 2023 to 2033, with forecasts for phase, design, and indication, each forecast at a global and regional level – discover the industry’s prospects, finding the most lucrative places for investments and revenues.
• Revenue forecasts to 2033 for five regional and 20 key national markets – See forecasts for the Immuno Oncology Clinical Trials Market, 2023 to 2033 market in North America, Europe, Asia-Pacific, Latin America, and MEA. Also forecasted is the market in the US, Canada, Mexico, Brazil, Germany, France, UK, Italy, China, India, Japan, and Australia among other prominent economies.
• Prospects for established firms and those seeking to enter the market – including company profiles for Merck & Co., Inc., Bristol-Myers Squibb Company, Novartis AG, AstraZeneca plc, and F. Hoffmann-La Roche AG among others involved in the Immuno Oncology Clinical Trials Market, 2023 to 2033.
Find quantitative and qualitative analyses with independent predictions. Receive information that only our report contains, staying informed with invaluable business intelligence.
Information found nowhere else
With our new report, you are less likely to fall behind in knowledge or miss out on opportunities. See how our work could benefit your research, analyses, and decisions. Visiongain’s study is for everybody needing commercial analyses for the Immuno Oncology Clinical Trials Market, 2023 to 2033, market-leading companies. You will find data, trends and predictions.
To access the data contained in this document please email contactus@visiongain.com
Buy our report today Immuno-Oncology Clinical Trials Market Report 2023-2033: Forecasts by Phase (Phase I, Phase II, Phase III, Phase IV), by Design (Interventional Trials, Observational Trials, Expanded Access Trials), by Indication (Solid Tumours, Hematological Cancer) AND Regional and Leading National Market Analysis PLUS Analysis of Leading Companies AND COVID-19 Impact and Recovery Pattern Analysis. Avoid missing out by staying informed – order our report now.
Visiongain is a trading partner with the US Federal Government
CCR Ref number: KD4R6
Do you have any custom requirements we can help you with? Any need for a specific country, geo region, market segment or specific company information? Contact us today, we can discuss your needs and see how we can help: contactus@visiongain.com
1 Report Overview
1.1 Objectives of the Study
1.2 Introduction to Immuno Oncology Clinical Trials Market
1.3 What This Report Delivers
1.4 Why You Should Read This Report
1.5 Key Questions Answered by This Analytical Report
1.6 Who is This Report for?
1.7 Methodology
1.7.1 Market Definitions
1.7.2 Market Evaluation & Forecasting Methodology
1.7.3 Data Validation
1.7.3.1 Primary Research
1.7.3.2 Secondary Research
1.8 Frequently Asked Questions (FAQs)
1.9 Associated Visiongain Reports
1.10 About Visiongain
2 Executive Summary
3 Market Overview
3.1 Key Findings
3.2 Market Dynamics
3.2.1 Market Driving Factors
3.2.1.1 Increase in Cancer Cases Has Compelled Biotech and Pharmaceutical Companies to Conduct More Clinical Immuno Oncology Tests
3.2.1.2 Increasing Regulatory Approval for Immuno Oncology Drug
3.2.1.3 Greater Investment in Healthcare R&D
3.2.2 Market Restraining Factors
3.2.2.1 Serious Issues and Substantial Medical Costs
3.2.2.2 Regulatory Challenges
3.2.2.3 Lack of Diversity
3.2.3 Market Opportunities
3.2.3.1 Potential for Partnership and Collaborations Offering Lucrative Opportunity
3.2.3.2 Growing Number of Immuno Oncology Medication Clinical Studies
3.3 Porter’s Five Forces Analysis
3.4 PEST Analysis
3.5 COVID-19 Impact Analysis
4 Immuno Oncology Clinical Trials Market Analysis by Phase
4.1 Key Findings
4.2 Phase Segment: Market Attractiveness Index
4.3 Immuno Oncology Clinical Trials Market Size Estimation and Forecast by Phase
4.4 Phase I
4.4.1 Market Size by Region, 2023-2033 (US$ Million)
4.4.2 Market Share by Region, 2023 & 2033 (%)
4.5 Phase II
4.5.1 Market Size by Region, 2023-2033 (US$ Million)
4.5.2 Market Share by Region, 2023 & 2033 (%)
4.6 Phase III
4.6.1 Market Size by Region, 2023-2033 (US$ Million)
4.6.2 Market Share by Region, 2023 & 2033 (%)
4.7 Phase IV
4.7.1 Market Size by Region, 2023-2033 (US$ Million)
4.7.2 Market Share by Region, 2023 & 2033 (%)
5 Immuno Oncology Clinical Trials Market Analysis by Design
5.1 Key Findings
5.2 Design Segment: Market Attractiveness Index
5.3 Immuno Oncology Clinical Trials Market Size Estimation and Forecast by Design
5.4 Interventional Trials
5.4.1 Market Size by Region, 2023-2033 (US$ Million)
5.4.2 Market Share by Region, 2023 & 2033 (%)
5.5 Observational Trials
5.5.1 Market Size by Region, 2023-2033 (US$ Million)
5.5.2 Market Share by Region, 2023 & 2033 (%)
5.6 Expanded Access Trials
5.6.1 Market Size by Region, 2023-2033 (US$ Million)
5.6.2 Market Share by Region, 2023 & 2033 (%)
6 Immuno Oncology Clinical Trials Market Analysis by Indication
6.1 Key Findings
6.2 Indication Segment: Market Attractiveness Index
6.3 Immuno Oncology Clinical Trials Market Size Estimation and Forecast by Indication
6.4 Solid Tumours
6.4.1 Market Size by Region, 2023-2033 (US$ Million)
6.4.2 Market Share by Region, 2023 & 2033 (%)
6.5 Hematological Cancer
6.5.1 Market Size by Region, 2023-2033 (US$ Million)
6.5.2 Market Share by Region, 2023 & 2033 (%)
7 Immuno Oncology Clinical Trials Market Analysis by Region
7.1 Key Findings
7.2 Regional Market Size Estimation and Forecast
8 North America Immuno Oncology Clinical Trials Market Analysis
8.1 Key Findings
8.2 North America Immuno Oncology Clinical Trials Market Attractiveness Index
8.3 North America Immuno Oncology Clinical Trials Market by Country, 2023, 2028 & 2033 (US$ Million)
8.4 North America Immuno Oncology Clinical Trials Market Size Estimation and Forecast by Country
8.5 North America Immuno Oncology Clinical Trials Market Size Estimation and Forecast by Phase
8.6 North America Immuno Oncology Clinical Trials Market Size Estimation and Forecast by Design
8.7 North America Immuno Oncology Clinical Trials Market Size Estimation and Forecast by Indication
8.8 U.S. Immuno Oncology Clinical Trials Market Analysis
8.9 Canada Immuno Oncology Clinical Trials Market Analysis
9 Europe Immuno Oncology Clinical Trials Market Analysis
9.1 Key Findings
9.2 Europe Immuno Oncology Clinical Trials Market Attractiveness Index
9.3 Europe Immuno Oncology Clinical Trials Market by Country, 2023, 2028 & 2033 (US$ Million)
9.4 Europe Immuno Oncology Clinical Trials Market Size Estimation and Forecast by Country
9.5 Europe Immuno Oncology Clinical Trials Market Size Estimation and Forecast by Phase
9.6 Europe Immuno Oncology Clinical Trials Market Size Estimation and Forecast by Design
9.7 Europe Immuno Oncology Clinical Trials Market Size Estimation and Forecast by Indication
9.8 Germany Immuno Oncology Clinical Trials Market Analysis
9.9 UK Immuno Oncology Clinical Trials Market Analysis
9.10 France Immuno Oncology Clinical Trials Market Analysis
9.11 Italy Immuno Oncology Clinical Trials Market Analysis
9.12 Spain Immuno Oncology Clinical Trials Market Analysis
9.13 Rest of Europe Immuno Oncology Clinical Trials Market Analysis
10 Asia Pacific Immuno Oncology Clinical Trials Market Analysis
10.1 Key Findings
10.2 Asia Pacific Immuno Oncology Clinical Trials Market Attractiveness Index
10.3 Asia Pacific Immuno Oncology Clinical Trials Market by Country, 2023, 2028 & 2033 (US$ Million)
10.4 Asia Pacific Immuno Oncology Clinical Trials Market Size Estimation and Forecast by Country
10.5 Asia Pacific Immuno Oncology Clinical Trials Market Size Estimation and Forecast by Phase
10.6 Asia Pacific Immuno Oncology Clinical Trials Market Size Estimation and Forecast by Design
10.7 Asia Pacific Immuno Oncology Clinical Trials Market Size Estimation and Forecast by Indication
10.8 China Immuno Oncology Clinical Trials Market Analysis
10.9 Japan Immuno Oncology Clinical Trials Market Analysis
10.10 India Immuno Oncology Clinical Trials Market Analysis
10.11 Australia Immuno Oncology Clinical Trials Market Analysis
10.12 South Korea Immuno Oncology Clinical Trials Market Analysis
10.13 Rest of Asia Pacific Immuno Oncology Clinical Trials Market Analysis
11 Latin America Immuno Oncology Clinical Trials Market Analysis
11.1 Key Findings
11.2 Latin America Immuno Oncology Clinical Trials Market Attractiveness Index
11.3 Latin America Immuno Oncology Clinical Trials Market by Country, 2023, 2028 & 2033 (US$ Million)
11.4 Latin America Immuno Oncology Clinical Trials Market Size Estimation and Forecast by Country
11.5 Latin America Immuno Oncology Clinical Trials Market Size Estimation and Forecast by Phase
11.6 Latin America Immuno Oncology Clinical Trials Market Size Estimation and Forecast by Design
11.7 Latin America Immuno Oncology Clinical Trials Market Size Estimation and Forecast by Indication
11.8 Brazil Immuno Oncology Clinical Trials Market Analysis
11.9 Mexico Immuno Oncology Clinical Trials Market Analysis
11.10 Rest of Latin America Immuno Oncology Clinical Trials Market Analysis
12 MEA Immuno Oncology Clinical Trials Market Analysis
12.1 Key Findings
12.2 MEA Immuno Oncology Clinical Trials Market Attractiveness Index
12.3 MEA Immuno Oncology Clinical Trials Market by Country, 2023, 2028 & 2033 (US$ Million)
12.4 MEA Immuno Oncology Clinical Trials Market Size Estimation and Forecast by Country
12.5 MEA Immuno Oncology Clinical Trials Market Size Estimation and Forecast by Phase
12.6 MEA Immuno Oncology Clinical Trials Market Size Estimation and Forecast by Design
12.7 MEA Immuno Oncology Clinical Trials Market Size Estimation and Forecast by Indication
12.8 South Africa Immuno Oncology Clinical Trials Market Analysis
12.9 GCC Immuno Oncology Clinical Trials Market Analysis
12.10 Rest of MEA Immuno Oncology Clinical Trials Market Analysis
13 Company Profiles
13.1 Competitive Landscape
13.2 Strategic Outlook
13.3 Merck & Co., Inc.
13.3.1 Company Snapshot
13.3.2 Company Overview
13.3.3 Financial Analysis
13.3.3.1 Net Revenue, 2017-2022
13.3.3.2 R&D, 2017-2022
13.3.3.3 Regional Market Shares, 2022
13.3.4 Product Benchmarking
13.3.5 Strategic Outlook
13.4 Bristol-Myers Squibb Company
13.4.1 Company Snapshot
13.4.2 Company Overview
13.4.3 Financial Analysis
13.4.3.1 Net Revenue, 2017-2022
13.4.3.2 R&D, 2017-2022
13.4.3.3 Regional Market Shares, 2022
13.4.4 Product Benchmarking
13.4.5 Strategic Outlook
13.5 Medpace, Inc.
13.5.1 Company Snapshot
13.5.2 Company Overview
13.5.3 Financial Analysis
13.5.3.1 Net Revenue, 2017-2022
13.5.4 Product Benchmarking
13.5.5 Strategic Outlook
13.6 Novartis AG
13.6.1 Company Snapshot
13.6.2 Company Overview
13.6.3 Financial Analysis
13.6.3.1 Net Revenue, 2017-2022
13.6.3.2 R&D, 2017-2022
13.6.3.3 Regional Market Shares, 2022
13.6.4 Product Benchmarking
13.6.5 Strategic Outlook
13.7 AstraZeneca plc
13.7.1 Company Snapshot
13.7.2 Company Overview
13.7.3 Financial Analysis
13.7.3.1 Net Revenue, 2017-2022
13.7.3.2 R&D, 2017-2022
13.7.3.3 Regional Market Shares, 2022
13.7.4 Product Benchmarking
13.8 BioNTech SE
13.8.1 Company Snapshot
13.8.2 Company Overview
13.8.3 Financial Analysis
13.8.3.1 Net Revenue, 2017-2022
13.8.3.2 R&D, 2017-2022
13.8.4 Product Benchmarking
13.8.5 Strategic Outlook
13.9 Exscientia plc
13.9.1 Company Snapshot
13.9.2 Company Overview
13.9.3 Financial Analysis
13.9.3.1 Net Revenue, 2020-2022
13.9.3.2 R&D, 2020-2022
13.9.3.3 Regional Market Shares, 2022
13.9.4 Product Benchmarking
13.9.5 Strategic Outlook
13.10 F. Hoffmann-La Roche AG
13.10.1 Company Snapshot
13.10.2 Company Overview
13.10.3 Financial Analysis
13.10.3.1 Net Revenue, 2017-2022
13.10.3.2 R&D, 2017-2022
13.10.3.3 Regional Market Shares, 2022
13.10.4 Product Benchmarking
13.10.5 Strategic Outlook
13.11 Pfizer Inc.
13.11.1 Company Snapshot
13.11.2 Company Overview
13.11.3 Financial Analysis
13.11.3.1 Net Revenue, 2017-2022
13.11.3.2 R&D, 2017-2022
13.11.3.3 Regional Market Shares, 2022
13.11.4 Product Benchmarking
13.11.5 Strategic Outlook
13.12 Syneos Health
13.12.1 Company Snapshot
13.12.2 Company Overview
13.12.3 Financial Analysis
13.12.3.1 Net Revenue, 2017-2022
13.12.3.2 Regional Market Shares, 2021
13.12.4 Product Benchmarking
13.12.5 Strategic Outlook
13.13 IO Biotech, Inc.
13.13.1 Company Snapshot
13.13.2 Company Overview
13.13.3 Product Benchmarking
13.13.4 Strategic Outlook
13.14 ICON plc
13.14.1 Company Snapshot
13.14.2 Company Overview
13.14.3 Financial Analysis
13.14.3.1 Net Revenue, 2017-2022
13.14.3.2 Regional Market Shares, 2022
13.14.4 Product Benchmarking
13.15 IQVIA Inc.
13.15.1 Company Snapshot
13.15.2 Company Overview
13.15.3 Financial Analysis
13.15.3.1 Net Revenue, 2017-2022
13.15.3.2 R&D, 2017-2022
13.15.3.3 Regional Market Shares, 2022
13.15.4 Product Benchmarking
14 Conclusion and Recommendations
14.1 Concluding Remarks from Visiongain
14.2 Recommendations for Market Players
List of Tables
Table 1 Immuno Oncology Clinical Trials Market Snapshot, 2023 & 2033 (US$ Million, CAGR %)
Table 2 Regulatory Approval, 2022
Table 3 Immuno Oncology Clinical Trials Market Forecast by Region, 2023-2033 (US$ Million, AGR%): “V” Shaped Recovery
Table 4 Immuno Oncology Clinical Trials Market Forecast by Region, 2023-2033 (US$ Million, AGR%): “U” Shaped Recovery
Table 5 Immuno Oncology Clinical Trials Market Forecast by Region, 2023-2033 (US$ Million, AGR%): “W” Shaped Recovery
Table 6 Immuno Oncology Clinical Trials Market Forecast by Region, 2023-2033 (US$ Million, CAGR%): “L” Shaped Recovery
Table 7 Immuno Oncology Clinical Trials Market Forecast by Phase, 2023-2033 (US$ Million, CAGR %)
Table 8 Phase I Segment Market Forecast by Region, 2023-2033 (US$ Million, CAGR%)
Table 9 Phase II Segment Market Forecast by Region, 2023-2033 (US$ Million, CAGR%)
Table 10 Phase III Segment Market Forecast by Region, 2023-2033 (US$ Million, CAGR%)
Table 11 Phase IV Segment Market Forecast by Region, 2023-2033 (US$ Million, CAGR%)
Table 12 Immuno Oncology Clinical Trials Market Forecast by Design, 2023-2033 (US$ Million, CAGR %)
Table 13 Interventional Trials Segment Market Forecast by Region, 2023-2033 (US$ Million, CAGR%)
Table 14 Observational Trials Segment Market Forecast by Region, 2023-2033 (US$ Million, CAGR%)
Table 15 Expanded Access Trials Segment Market Forecast by Region, 2023-2033 (US$ Million, CAGR%)
Table 16 Immuno Oncology Clinical Trials Market Forecast by Indication, 2023-2033 (US$ Million, CAGR %)
Table 17 Solid Tumours Segment Market Forecast by Region, 2023-2033 (US$ Million, CAGR%)
Table 18 Hematological Cancer Segment Market Forecast by Region, 2023-2033 (US$ Million, CAGR %)
Table 19 Immuno Oncology Clinical Trials Market Forecast by Region, 2023-2033 (US$ Million, AGR %)
Table 20 North America Immuno Oncology Clinical Trials Market Forecast by Country, 2023-2033 (US$ Million, CAGR %)
Table 21 North America Immuno Oncology Clinical Trials Market Forecast by Phase, 2023-2033 (US$ Million, CAGR %)
Table 22 Immuno Oncology Clinical Trials Market Forecast by Design, 2023-2033 (US$ Million, CAGR %)
Table 23 North America Immuno Oncology Clinical Trials Market Forecast by Indication, 2023-2033 (US$ Million, CAGR %)
Table 24 U.S. Immuno Oncology Clinical Trials Market Forecast, 2023-2033 (US$ Million, CAGR %)
Table 25 Canada Immuno Oncology Clinical Trials Market Forecast, 2023-2033 (US$ Million, CAGR %)
Table 26 Europe Immuno Oncology Clinical Trials Market Forecast by Country, 2023-2033 (US$ Million, CAGR %)
Table 27 Europe Immuno Oncology Clinical Trials Market Forecast by Phase, 2023-2033 (US$ Million, CAGR %)
Table 28 Europe Immuno Oncology Clinical Trials Market Forecast by Design, 2023-2033 (US$ Million, CAGR %)
Table 29 Europe Immuno Oncology Clinical Trials Market Forecast by Indication, 2023-2033 (US$ Million, CAGR %)
Table 30 Germany Immuno Oncology Clinical Trials Market Forecast, 2023-2033 (US$ Million, CAGR %)
Table 31 UK Immuno Oncology Clinical Trials Market Forecast, 2023-2033 (US$ Million, CAGR %)
Table 32 France Immuno Oncology Clinical Trials Market Forecast, 2023-2033 (US$ Million, CAGR %)
Table 33 Italy Immuno Oncology Clinical Trials Market Forecast, 2023-2033 (US$ Million, CAGR %)
Table 34 Spain Immuno Oncology Clinical Trials Market Forecast, 2023-2033 (US$ Million, CAGR %)
Table 35 Rest of Europe Immuno Oncology Clinical Trials Market Forecast, 2023-2033 (US$ Million, CAGR %)
Table 36 Asia Pacific Immuno Oncology Clinical Trials Market Forecast by Country, 2023-2033 (US$ Million, CAGR %)
Table 37 Asia Pacific Immuno Oncology Clinical Trials Market Forecast by Phase, 2023-2033 (US$ Million, CAGR %)
Table 38 Asia Pacific Immuno Oncology Clinical Trials Market Forecast by Design, 2023-2033 (US$ Million, CAGR %)
Table 39 Asia Pacific Immuno Oncology Clinical Trials Market Forecast by Indication, 2023-2033 (US$ Million, CAGR %)
Table 40 China Immuno Oncology Clinical Trials Market Forecast, 2023-2033 (US$ Million, CAGR %)
Table 41 Japan Immuno Oncology Clinical Trials Market Forecast, 2023-2033 (US$ Million, CAGR %)
Table 42 India Immuno Oncology Clinical Trials Market Forecast, 2023-2033 (US$ Million, CAGR %)
Table 43 Australia Immuno Oncology Clinical Trials Market Forecast, 2023-2033 (US$ Million, CAGR %)
Table 44 South Korea Immuno Oncology Clinical Trials Market Forecast, 2023-2033 (US$ Million, CAGR %)
Table 45 Rest of Asia Pacific Immuno Oncology Clinical Trials Market Forecast, 2023-2033 (US$ Million, CAGR %)
Table 46 Latin America Immuno Oncology Clinical Trials Market Forecast by Country, 2023-2033 (US$ Million, CAGR %)
Table 47 Latin America Immuno Oncology Clinical Trials Market Forecast by Phase, 2023-2033 (US$ Million, CAGR %)
Table 48 Latin America Immuno Oncology Clinical Trials Market Forecast by Design, 2023-2033 (US$ Million, CAGR %)
Table 49 Latin America Immuno Oncology Clinical Trials Market Forecast by Indication, 2023-2033 (US$ Million, CAGR %)
Table 50 Brazil Immuno Oncology Clinical Trials Market Forecast, 2023-2033 (US$ Million, CAGR %)
Table 51 Mexico Immuno Oncology Clinical Trials Market Forecast, 2023-2033 (US$ Million, CAGR %)
Table 52 Rest of Latin America Immuno Oncology Clinical Trials Market Forecast, 2023-2033 (US$ Million, CAGR %)
Table 53 MEA Immuno Oncology Clinical Trials Market Forecast by Country, 2023-2033 (US$ Million, CAGR %)
Table 54 MEA Immuno Oncology Clinical Trials Market Forecast by Phase, 2023-2033 (US$ Million, CAGR %)
Table 55 MEA Immuno Oncology Clinical Trials Market Forecast by Design, 2023-2033 (US$ Million, CAGR %)
Table 56 MEA Immuno Oncology Clinical Trials Market Forecast by Indication, 2023-2033 (US$ Million, CAGR %)
Table 57 South Africa Immuno Oncology Clinical Trials Market Forecast, 2023-2033 (US$ Million, CAGR %)
Table 58 GCC Immuno Oncology Clinical Trials Market Forecast, 2023-2033 (US$ Million, CAGR %)
Table 59 Rest of MEA Immuno Oncology Clinical Trials Market Forecast, 2023-2033 (US$ Million, CAGR %)
Table 60 Strategic Outlook
Table 61 Merck & Co., Inc.: Key Details, (CEO, HQ, Revenue, Founded, No. of Employees, Company Type, Website, Business Segment)
Table 62 Merck & Co., Inc.: Product Benchmarking
Table 63 Merck & Co., Inc.: Strategic Outlook
Table 64 Bristol-Myers Squibb Company: Key Details, (CEO, HQ, Revenue, Founded, No. of Employees, Company Type, Website, Business Segment)
Table 65 Bristol-Myers Squibb Company: Product Benchmarking
Table 66 Bristol-Myers Squibb Company: Strategic Outlook
Table 67 Medpace, Inc.: Key Details, (CEO, HQ, Revenue, Founded, No. of Employees, Company Type, Website, Business Segment)
Table 68 Medpace, Inc.: Product Benchmarking
Table 69 Medpace, Inc.: Strategic Outlook
Table 70 Novartis AG: Key Details, (CEO, HQ, Revenue, Founded, No. of Employees, Company Type, Website, Business Segment)
Table 71 Novartis AG: Product Benchmarking
Table 72 Novartis AG: Strategic Outlook
Table 73 AstraZeneca plc: Key Details, (CEO, HQ, Revenue, Founded, No. of Employees, Company Type, Website, Business Segment)
Table 74 AstraZeneca plc: Product Benchmarking
Table 75 BioNTech SE: Key Details, (CEO, HQ, Revenue, Founded, No. of Employees, Company Type, Website, Business Segment)
Table 76 BioNTech SE: Product Benchmarking
Table 77 BioNTech SE: Strategic Outlook
Table 78 Exscientia plc: Key Details, (CEO, HQ, Revenue, Founded, No. of Employees, Company Type, Website, Business Segment)
Table 79 Exscientia plc: Product Benchmarking
Table 80 Exscientia plc: Strategic Outlook
Table 81 F. Hoffmann-La Roche AG: Key Details, (CEO, HQ, Revenue, Founded, No. of Employees, Company Type, Website, Business Segment)
Table 82 F. Hoffmann-La Roche AG: Product Benchmarking
Table 83 F. Hoffmann-La Roche AG: Strategic Outlook
Table 84 Pfizer Inc.: Key Details, (CEO, HQ, Revenue, Founded, No. of Employees, Company Type, Website, Business Segment)
Table 85 Pfizer Inc.: Product Benchmarking
Table 86 Pfizer Inc.: Strategic Outlook
Table 87 Syneos Health: Key Details, (CEO, HQ, Revenue, Founded, No. of Employees, Company Type, Website, Business Segment)
Table 88 Syneos Health: Product Benchmarking
Table 89 Syneos Health.: Strategic Outlook
Table 90 IO Biotech, Inc.: Key Details, (CEO, HQ, Revenue, Founded, No. of Employees, Company Type, Website, Business Segment)
Table 91 IO Biotech, Inc.: Product Benchmarking
Table 92 IO Biotech, Inc.: Strategic Outlook
Table 93 ICON plc: Key Details, (CEO, HQ, Revenue, Founded, No. of Employees, Company Type, Website, Business Segment)
Table 94 ICON plc: Product Benchmarking
Table 95 IQVIA Inc.: Key Details, (CEO, HQ, Revenue, Founded, No. of Employees, Company Type, Website, Business Segment)
Table 96 IQVIA INC.: Product Benchmarking
List of Figures
Figure 1 Immuno Oncology Clinical Trials Market Segmentation
Figure 2 Immuno Oncology Clinical Trials Market by Phase: Market Attractiveness Index
Figure 3 Immuno Oncology Clinical Trials Market by Design: Market Attractiveness Index
Figure 4 Immuno Oncology Clinical Trials Market by Indication: Market Attractiveness Index
Figure 5 Immuno Oncology Clinical Trials Market Attractiveness Index by Region
Figure 6 Immuno Oncology Clinical Trials Market: Market Dynamics
Figure 7 Global Cancer Cases, 2020
Figure 8 Top 10 Cancer Drugmakers by 2024
Figure 9 Immuno Oncology Clinical Trials Market by Region, 2023-2033 (US$ Million, AGR %): “V” Shaped Recovery
Figure 10 Immuno Oncology Clinical Trials Market by Region, 2023-2033 (US$ Million, AGR %): “U” Shaped Recovery
Figure 11 Immuno Oncology Clinical Trials Market by Region, 2023-2033 (US$ Million, AGR %): “W” Shaped Recovery
Figure 12 Immuno Oncology Clinical Trials Market by Region, 2023-2033 (US$ Million, AGR %): “L” Shaped Recovery
Figure 13 Immuno Oncology Clinical Trials Market by Phase: Market Attractiveness Index
Figure 14 Immuno Oncology Clinical Trials Market Forecast by Phase, 2023-2033 (US$ Million, AGR %)
Figure 15 Immuno Oncology Clinical Trials Market Share Forecast by Phase, 2023, 2028, 2033 (%)
Figure 16 Phase I Segment Market Forecast by Region, 2023-2033 (US$ Million, CAGR %)
Figure 17 Phase I Segment Market Share Forecast by Region, 2023 & 2033 (%)
Figure 18 Phase II Segment Market Forecast by Region, 2023-2033 (US$ Million, AGR %)
Figure 19 Phase II Segment Market Share Forecast by Region, 2023 & 2033 (%)
Figure 20 Phase III Segment Market Forecast by Region, 2023-2033 (US$ Million, AGR %)
Figure 21 Phase III Segment Market Share Forecast by Region, 2023 & 2033 (%)
Figure 22 Phase IV Segment Market Forecast by Region, 2023-2033 (US$ Million, AGR %)
Figure 23 Phase IV Segment Market Share Forecast by Region, 2023 & 2033 (%)
Figure 24 Immuno Oncology Clinical Trials Market by Design: Market Attractiveness Index
Figure 25 Immuno Oncology Clinical Trials Market Forecast by Design, 2023-2033 (US$ Million, AGR %)
Figure 26 Immuno Oncology Clinical Trials Market Share Forecast by Design, 2023, 2028, 2033 (%)
Figure 27 Interventional Trials Segment Market Forecast by Region, 2023-2033 (US$ Million, AGR %)
Figure 28 Interventional Trials Segment Market Share Forecast by Region, 2023 & 2033 (%)
Figure 29 Observational Trials Segment Market Forecast by Region, 2023-2033 (US$ Million, AGR %)
Figure 30 Observational Trials Segment Market Share Forecast by Region, 2023 & 2033 (%)
Figure 31 Expanded Access Trials Segment Market Forecast by Region, 2023-2033 (US$ Million, AGR %)
Figure 32 Expanded Access Trials Segment Market Share Forecast by Region, 2023 & 2033 (%)
Figure 33 Immuno Oncology Clinical Trials Market by Indication: Market Attractiveness Index
Figure 34 Immuno Oncology Clinical Trials Market Forecast by Indication, 2023-2033 (US$ Million, AGR %)
Figure 35 Immuno Oncology Clinical Trials Market Share Forecast by Indication, 2023, 2028, 2033 (%)
Figure 36 Solid Tumours Segment Market Forecast by Region, 2023-2033 (US$ Million, AGR %)
Figure 37 Solid Tumours Segment Market Share Forecast by Region, 2023 & 2033 (%)
Figure 38 Hematological Cancer Segment Market Forecast by Region, 2023-2033 (US$ Million, CAGR %)
Figure 39 Hematological Cancer Segment Market Share Forecast by Region, 2023 & 2033 (%)
Figure 40 Immuno Oncology Clinical Trials Market Forecast by Region 2023 and 2033 (Revenue, CAGR %)
Figure 41 Immuno Oncology Clinical Trials Market Share Forecast by Region 2023, 2028, 2033 (%)
Figure 42 Immuno Oncology Clinical Trials Market by Region, 2023-2033 (US$ Million, CAGR %)
Figure 43 North America Immuno Oncology Clinical Trials Market Attractiveness Index
Figure 44 North America Immuno Oncology Clinical Trials Market by Region, 2023, 2028 & 2033 (US$ Million)
Figure 45 North America Immuno Oncology Clinical Trials Market Forecast by Country, 2023-2033 (US$ Million, CAGR %)
Figure 46 North America Immuno Oncology Clinical Trials Market Share Forecast by Country, 2023 & 2033 (%)
Figure 47 North America Immuno Oncology Clinical Trials Market Forecast by Phase, 2023-2033 (US$ Million, AGR %)
Figure 48 North America Immuno Oncology Clinical Trials Market Share Forecast by Phase, 2023 & 2033 (%)
Figure 49 North America Immuno Oncology Clinical Trials Market Forecast by Design, 2023-2033 (US$ Million, AGR %)
Figure 50 North America Immuno Oncology Clinical Trials Market Share Forecast by Design, 2023 & 2033 (%)
Figure 51 North America Immuno Oncology Clinical Trials Market Forecast by Indication, 2023-2033 (US$ Million, AGR %)
Figure 52 North America Immuno Oncology Clinical Trials Market Share Forecast by Indication, 2023 & 2033 (%)
Figure 53 Immuno Oncology Clinical Trials in the United States
Figure 54 U.S. Immuno Oncology Clinical Trials Market Forecast, 2023-2033 (US$ Million, AGR %)
Figure 55 Canada Immuno Oncology Clinical Trials Market Forecast, 2023-2033 (US$ Million, AGR %)
Figure 56 Europe Immuno Oncology Clinical Trials Market Attractiveness Index
Figure 57 Europe Immuno Oncology Clinical Trials Market by Region, 2023, 2028 & 2033 (US$ Million)
Figure 58 Europe Immuno Oncology Clinical Trials Market Forecast by Country, 2023-2033 (US$ Million, AGR %)
Figure 59 Europe Immuno Oncology Clinical Trials Market Share Forecast by Country, 2023 & 2033 (%)
Figure 60 Europe Immuno Oncology Clinical Trials Market Forecast by Phase, 2023-2033 (US$ Million, AGR %)
Figure 61 Europe Immuno Oncology Clinical Trials Market Share Forecast by Phase, 2023 & 2033 (%)
Figure 62 Europe Immuno Oncology Clinical Trials Market Forecast by Design, 2023-2033 (US$ Million, AGR %)
Figure 63 Europe Immuno Oncology Clinical Trials Market Share Forecast by Design, 2023 & 2033 (%)
Figure 64 Europe Immuno Oncology Clinical Trials Market Forecast by Indication, 2023-2033 (US$ Million, AGR %)
Figure 65 Europe Immuno Oncology Clinical Trials Market Share Forecast by Indication, 2023 & 2033 (%)
Figure 66 Germany Immuno Oncology Clinical Trials Market Forecast, 2023-2033 (US$ Million, CAGR %)
Figure 67 UK Immuno Oncology Clinical Trials Market Forecast, 2023-2033 (US$ Million, AGR %)
Figure 68 France Immuno Oncology Clinical Trials Market Forecast, 2023-2033 (US$ Million, AGR %)
Figure 69 Italy Immuno Oncology Clinical Trials Market Forecast, 2023-2033 (US$ Million, AGR %)
Figure 70 Spain Immuno Oncology Clinical Trials Market Forecast, 2023-2033 (US$ Million, AGR %)
Figure 71 Rest of Europe Immuno Oncology Clinical Trials Market Forecast, 2023-2033 (US$ Million, AGR %)
Figure 72 Asia Pacific Immuno Oncology Clinical Trials Market Attractiveness Index
Figure 73 Asia Pacific Immuno Oncology Clinical Trials Market by Region, 2023, 2028 & 2033 (US$ Million)
Figure 74 Asia Pacific Immuno Oncology Clinical Trials Market Forecast by Country, 2023-2033 (US$ Million, AGR %)
Figure 75 Asia Pacific Immuno Oncology Clinical Trials Market Share Forecast by Country, 2023 & 2033 (%)
Figure 76 Asia Pacific Immuno Oncology Clinical Trials Market Forecast by Phase, 2023-2033 (US$ Million, AGR %)
Figure 77 Asia Pacific Immuno Oncology Clinical Trials Market Share Forecast by Phase, 2023 & 2033 (%)
Figure 78 Asia Pacific Immuno Oncology Clinical Trials Market Forecast by Design, 2023-2033 (US$ Million, AGR %)
Figure 79 Asia Pacific Immuno Oncology Clinical Trials Market Share Forecast by Design, 2023 & 2033 (%)
Figure 80 Asia Pacific Immuno Oncology Clinical Trials Market Forecast by Indication, 2023-2033 (US$ Million, AGR %)
Figure 81 Asia Pacific Immuno Oncology Clinical Trials Market Share Forecast by Indication, 2023 & 2033 (%)
Figure 82 China Immuno Oncology Clinical Trials Market Forecast, 2023-2033 (US$ Million, AGR %)
Figure 83 Japan Immuno Oncology Clinical Trials Market Forecast, 2023-2033 (US$ Million, AGR %)
Figure 84 India Immuno Oncology Clinical Trials Market Forecast, 2023-2033 (US$ Million, AGR %)
Figure 85 Australia Immuno Oncology Clinical Trials Market Forecast, 2023-2033 (US$ Million, AGR %)
Figure 86 South Korea Immuno Oncology Clinical Trials Market Forecast, 2023-2033 (US$ Million, AGR %)
Figure 87 Rest of Asia Pacific Immuno Oncology Clinical Trials Market Forecast, 2023-2033 (US$ Million, AGR %)
Figure 88 Latin America Immuno Oncology Clinical Trials Market Attractiveness Index
Figure 89 Latin America Immuno Oncology Clinical Trials Market by Region, 2023, 2028 & 2033 (US$ Million)
Figure 90 Latin America Immuno Oncology Clinical Trials Market Forecast by Country, 2023-2033 (US$ Million, CAGR %)
Figure 91 Latin America Immuno Oncology Clinical Trials Market Share Forecast by Country, 2023 & 2033 (%)
Figure 92 Latin America Immuno Oncology Clinical Trials Market Forecast by Phase, 2023-2033 (US$ Million, AGR %)
Figure 93 Latin America Immuno Oncology Clinical Trials Market Share Forecast by Phase, 2023 & 2033 (%)
Figure 94 Latin America Immuno Oncology Clinical Trials Market Forecast by Design, 2023-2033 (US$ Million, AGR %)
Figure 95 Latin America Immuno Oncology Clinical Trials Market Share Forecast by Design, 2023 & 2033 (%)
Figure 96 Latin America Immuno Oncology Clinical Trials Market Forecast by Indication, 2023-2033 (US$ Million, AGR %)
Figure 97 Latin America Immuno Oncology Clinical Trials Market Share Forecast by Indication, 2023 & 2033 (%)
Figure 98 Brazil Immuno Oncology Clinical Trials Market Forecast, 2023-2033 (US$ Million, AGR %)
Figure 99 Mexico Immuno Oncology Clinical Trials Market Forecast, 2023-2033 (US$ Million, CAGR %)
Figure 100 Rest of Latin America Immuno Oncology Clinical Trials Market Forecast, 2023-2033 (US$ Million, AGR %)
Figure 101 MEA Immuno Oncology Clinical Trials Market Attractiveness Index
Figure 102 MEA Immuno Oncology Clinical Trials Market by Region, 2023, 2028 & 2033 (US$ Million)
Figure 103 MEA Immuno Oncology Clinical Trials Market Forecast by Country, 2023-2033 (US$ Million, CAGR %)
Figure 104 MEA Immuno Oncology Clinical Trials Market Share Forecast by Country, 2023 & 2033 (%)
Figure 105 MEA Immuno Oncology Clinical Trials Market Forecast by Phase, 2023-2033 (US$ Million, AGR %)
Figure 106 MEA Immuno Oncology Clinical Trials Market Share Forecast by Phase, 2023 & 2033 (%)
Figure 107 MEA Immuno Oncology Clinical Trials Market Forecast by Design, 2023-2033 (US$ Million, AGR %)
Figure 108 MEA Immuno Oncology Clinical Trials Market Share Forecast by Design, 2023 & 2033 (%)
Figure 109 MEA Immuno Oncology Clinical Trials Market Forecast by Indication, 2023-2033 (US$ Million, AGR %)
Figure 110 MEA Immuno Oncology Clinical Trials Market Share Forecast by Indication, 2023 & 2033 (%)
Figure 111 South Africa Immuno Oncology Clinical Trials Market Forecast, 2023-2033 (US$ Million, AGR %)
Figure 112 GCC Immuno Oncology Clinical Trials Market Forecast, 2023-2033 (US$ Million, AGR %)
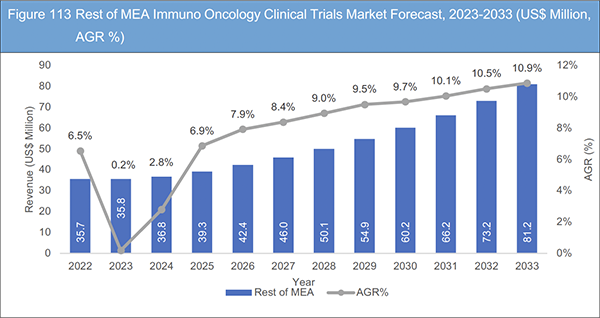
Figure 113 Rest of MEA Immuno Oncology Clinical Trials Market Forecast, 2023-2033 (US$ Million, AGR %)
Figure 114 Immuno Oncology Clinical Trials Market: Company Share Analysis
Figure 115 Merck & Co., Inc.: Net Revenue, 2017-2022 (US$ Million, AGR%)
Figure 116 Merck & Co., Inc.: R&D, 2017-2022 (US$ Million, AGR%)
Figure 117 Merck & Co., Inc.: Regional Market Shares, 2022
Figure 118 Bristol-Myers Squibb Company: Net Revenue, 2017-2022 (US$ Million, AGR%)
Figure 119 Bristol-Myers Squibb Company: R&D, 2017-2022 (US$ Million, AGR%)
Figure 120 Bristol-Myers Squibb Company: Regional Market Shares, 2022
Figure 121 Medpace, Inc.: Net Revenue, 2017-2022 (US$ Million, AGR%)
Figure 122 Novartis AG: Net Revenue, 2017-2022 (US$ Million, AGR%)
Figure 123 Novartis AG: R&D, 2017-2022 (US$ Million, AGR%)
Figure 124 Novartis AG: Regional Market Shares, 2022
Figure 125 AstraZeneca plc: Net Revenue, 2017-2022 (US$ Million, AGR%)
Figure 126 AstraZeneca plc: R&D, 2017-2022 (US$ Million, AGR%)
Figure 127 AstraZeneca plc: Regional Market Shares, 2022
Figure 128 BioNTech SE: Net Revenue, 2017-2022 (US$ Million, AGR%)
Figure 129 BioNTech SE: R&D, 2017-2022 (US$ Million, AGR%)
Figure 130 Exscientia plc: Net Revenue, 2020-2022 (US$ Million, AGR%)
Figure 131 Exscientia plc: R&D, 2020-2022 (US$ Million, AGR%)
Figure 132 Exscientia plc: Regional Market Shares, 2022
Figure 133 F. Hoffmann-La Roche AG: Net Revenue, 2017-2022 (US$ Million, AGR%)
Figure 134 F. Hoffmann-La Roche AG: R&D, 2017-2022 (US$ Million, AGR%)
Figure 135 F. Hoffmann-La Roche AG: Regional Market Shares, 2022
Figure 136 Pfizer Inc.: Net Revenue, 2017-2022 (US$ Million, AGR%)
Figure 137 Pfizer Inc.: R&D, 2017-2022 (US$ Million, AGR%)
Figure 138 Pfizer Inc.: Regional Market Shares, 2022
Figure 139 Syneos Health.: Net Revenue, 2017-2022 (US$ Million, AGR%)
Figure 140 Syneos Health: Regional Market Shares, 2021
Figure 141 ICON plc: Net Revenue, 2017-2022 (US$ Million, AGR%)
Figure 142 ICON plc: Regional Market Shares, 2022
Figure 143 IQVIA Inc.: Net Revenue, 2017-2022 (US$ Million, AGR%)
Figure 144 IQVIA Inc.: R&D, 2017-2022 (US$ Million, AGR%)
Figure 145 IQVIA Inc.: Regional Market Shares, 2022
List of Companies Profiled in the Report
AstraZeneca plc
BioNTech SE
Bristol-Myers Squibb Company
Exscientia plc
F. Hoffmann-La Roche AG
ICON plc
IO Biotech, Inc.
IQVIA Inc.
Medpace, Inc.
Merck & Co., Inc.
Novartis AG
Pfizer Inc.
Syneos Health
List of Other Companies Mentioned in the Report
AbbVie
Astellas Pharma
Biotech Farma
Cerenis Therapeutics
Daiichi Sankyo
Dompé
Genentech
Gilead Sciences
Janssen
MaaT Pharma
MacroGenics
Medincell
Oncodea
Ono Pharmaceutical
OSE Immunotherapeutics
Samsung BioLogics
SK Biopharmaceuticals
List of Associations Mentioned in the Report
China's Centre for Drug Evaluation (CDE)
Columbia University Irving Medical Centre (CUIMC)
Food and Drug Administration (FDA)
German Cancer Research Centre (DKFZ)
Gulf International Cancer Centre
Health Research Council of New Zealand (HRC)
National Cancer Institute
Spanish Clinical Experiments Register (REEC)
World Health Organization (WHO)