Visiongain has calculated that the Transformer Core market will see a capital expenditure (CAPEX) of $7,853 mn in 2017.Read on to discover the potential business opportunities available.
Transformer Core comprises of highly permeable materials with a minimal gap, generally, grain oriented electrical steel (GOES), wherein the transfer of energy is constant from an AC source by coupling the lines of flux between secondary and primary windings.
Transformer Core is one of the basic materials involved in the manufacturing of transformers and power transmission system for insulation, reduction of electricity losses, and heat dispersion. Transformer cores comprise of primary, secondary, or tertiary windings used in different grades, and are installed in transformers in accordance with the transformer type and capacity.
The major players operating in the world Transformer Core market have focused on the strategic expansion of production capacities due to rising demand for Transformer Cores in the power industry, followed by new product developments.
Rapid industrialization, urbanization, and rising need for integration of renewable sources of energy for electricity generation along with infrastructural development especially in the emerging economies such as India, China, and Indonesia, Chile, Brazil, Argentina etc. are some key factors posing bright opportunities for the world Transformer Core market.
Visiongain’s global Transformer Core market report can keep you informed and up to date with the developments in the market, across different regions: North America, Europe, Asia-Pacific, and LAMEA.
With reference to this report, it details the key investments trend in the global market, subdivided by regions, capital expenditure, transformer type and transformer capacity. Through extensive secondary research and interviews with industry experts, visiongain has identified a series of market trends that will impact the Transformer Core market over the forecast timeframe.
The report will answer questions such as:
– How is the Transformer Core ingredients market evolving?
– What is driving and restraining Transformer Core ingredients market dynamics?
– How will each Transformer Core ingredients submarket segment grow over the forecast period and how much sales will these submarkets account for in 2027?
– How will market shares of each Transformer Core ingredients submarket develop from 2017-2027?
– Which individual technologies will prevail and how will these shifts be responded to?
– Which Transformer Core submarket will be the main driver of the overall market from 2017-2027?
– How will political and regulatory factors influence regional Transformer Core ingredients markets and submarkets?
– Will leading national Transformer Core ingredients markets broadly follow macroeconomic dynamics, or will individual country sectors outperform the rest of the economy?
– How will market shares of the national markets change by 2027 and which nation will lead the market in 2027?
– Who are the leading players and what are their prospects over the forecast period?
– How will the sector evolve as alliances form during the period between 2017 and 2027?
Five Reasons Why You Must Order and Read This Report Today:
1) The report provides2017-2027 forecasts for the global Transformer Core Market by
– Volume (Kilotons)
– CAPEX (US$m)
2) The report provides forecasts for the global Transformer Core Market by Transformer Type for the period 2017-2027
– Power Transformer
– Distribution Transformer
– Others (including Isolation Transformers, Auto Transformers, and Core Transformers)
3) The report also forecasts and analyses the global Transformer Core Market by Region from 2017-2027
– North America
– Europe
– Asia Pacific
– LAMEA (Latin America, Middle East and Africa)
4) The report also forecasts and analyses the global Transformer Core Market by Nation from 2017-2027
North America:
– U.S.
– Canada
– Mexico
Europe:
– Russia
– Germany
– France
– UK
– Rest of Europe
Asia Pacific:
– China
– India
– Japan
– Rest of Asia-Pacific
LAMEA (Latin America, Middle East and Africa):
– Brazil
– Argentina
– Saudi Ariba
– South Africa
– Rest of Latin America, Middle East and Africa
5) The report reveals where and how companies are investing and provides
detailed profiles of the leading companies operating within the Global Transformer Core market:
– ABB Ltd
– Siemens AG
– Toshiba
– Mitsubishi Electric Corporation
– Hitachi Ltd
– Fuji Electric Co. Ltd
– Crompton Greaves
– Ferroxcube International Holding B.V.
This independent 149-page report guarantees you will remain better informed than your competitors. With 121 tables and figures examining the Transformer Core market space, the report gives you a direct, detailed breakdown of the market. PLUS, Capital expenditure AND based on transformer type, transformer capacity, and geography. This report will keep your knowledge that one step ahead of your rivals.
This report is essential reading for you or anyone in the Energy sector. Purchasing this report today will help you to recognise those important market opportunities and understand the possibilities there. I look forward to receiving your order.
Visiongain is a trading partner with the US Federal Government
CCR Ref number: KD4R6
1. Report Overview
1.1 Global Transformer Core Market Overview
1.2 Why You Should Read This Report
1.3 How This Report Delivers
1.4 Key Questions Answered by This Analytical Report Include:
1.5 Who is This Report For?
1.6 Methodology
1.6.1 Primary Research
1.6.2 Secondary Research
1.6.3 Market Evaluation & Forecasting Methodology
1.7 Frequently Asked Questions (FAQ)
1.8 Associated Visiongain Reports
1.9 About visiongain
2. Introduction to the Transformer Core Market
2.1 Transformer Core Market Structure
2.2 Transformer Core Market Definition
2.3 Transformer Core Types Definition
2.4 Why is the Difference between Distribution Transformer and Power Transformer?
2.4.1 Advantages and Disadvantages of Using Distribution Transformer
2.5 Functions of Transformer Oil
2.5.1 Types of Transformer Oil
2.5.2 What are Advantages of Transformer Oil in Transformer Core?
2.5.3 Why are the Different Metals used to Develop Transformer Core?
2.6 Which is the Top Investing Region?
2.7 Strategy Adopted by Key Players
2.7.1 CXOs Perspective In The Transformer Core Market
3. Global Transformer Core Market 2017-2027
3.1 Global Transformer Core Market Forecast 2017-2027
3.2 Global Transformer Core Market Analysis
3.3 Global Transformer Core Drivers & Restraints 2017
3.3.1 Global Transformer Core Market Drivers 2017
3.3.1.1 Increasing Demand for Electricity Generation
3.3.1.2 Transmission and Expansion to Integrate Renewable Energy Resources
3.3.1.3 Rapid Urbanization
3.3.1.4 New Power Generation and Distribution Projects
3.3.1.5 Increasing investment in the Power Sector
3.3.1.6 Rising Power Consumption
3.3.1.7 Increasing Investments in Power Sector
3.3.1.8 Expansion of Electric Grid in China, India and Brazil
3.3.1.9 Growing Demand from Original Equipment Manufacturers
3.3.1.10 Rising Production of Transformers
3.3.2 Global Transformer Core Market Restraints 2017
3.3.2.1 Volatile Prices of Raw Materials
3.3.2.2 Changing Regulatory Environment
3.4 Key Factors Impacting the Growth of the Global Transformer Core Market
3.4.1 Increasing Demand for Electricity and Rising Power Consumption
3.4.2 Increasing Investments by Governmental and Non-Governmental Organizations in the Power Sector
3.4.3 Increasing Production of Transformers
3.4.4 Volatile Prices of Raw Materials
3.5 Global Transformer Core Market Porter’s Five Forces Analysis 2017
3.5.1 Bargaining Power of Suppliers
3.5.2 Bargaining Power of Buyers
3.5.3 Threat of New Entrants
3.5.4 Threat of New Substitutes
3.5.5 Competitive Rivalry
4. Global Transformer Core Types Forecast 2017-2027
4.1 Leading Transformer Core Submarkets Shares Forecast
4.2 Power Transformer Submarket Forecast 2017-2027
4.2.1 Power Transformer Submarket Analysis 2017-2027
4.3 Distribution Transformer Submarket Forecast 2017-2027
4.3.1 Distribution Transformer Submarket Analysis
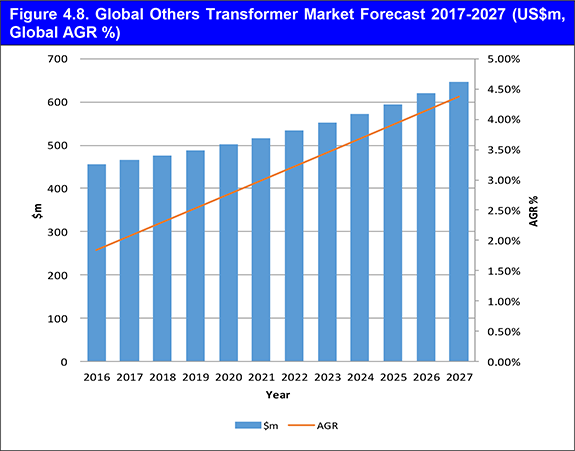
4.4 Others Transformer Core Submarket Forecast 2017-2027
4.4.1 Others Transformer Core Submarket Analysis 2017-2027
5. Leading National Transformer Core Markets Forecast 2017-2027
5.1 Global Core Regional Volume Forecast & Analysis 2017-2027
5.2 North America Transformer Core Regional Analysis 2017-2027
5.2.1 U.S. Transformer Core Regional Analysis 2017-2027
5.2.2 Canada Transformer Core Regional Analysis 2017-2027
5.2.3 Mexico Transformer Core Regional Analysis 2017-2027
5.3 Europe Transformer Cores Regional Analysis 2017-2027
5.3.1 Russia Transformer Core Regional Analysis 2017-2027
5.3.2 Germany Transformer Core Regional Analysis 2017-2027
5.3.3 France Transformer Core Regional Analysis 2017-2027
5.3.4 UK Transformer Core Regional Analysis 2017-2027
5.3.5 Rest Of Europe Transformer Core Regional Analysis 2017-2027
5.4 Asia-Pacific Transformer Cores Regional Analysis 2017-2027
5.4.1 China Transformer Core Regional Analysis 2017-2027
5.4.2 Japan Transformer Core Regional Analysis 2017-2027
5.4.3 India Transformer Core Regional Analysis 2017-2027
5.4.4 Rest Of Asia-Pacific Transformer Core Regional Analysis 2017-2027
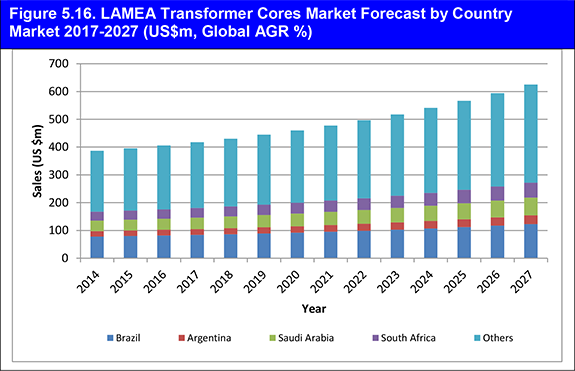
5.5 LAMEA (Latin America, Middle East and Africa) Transformer Cores Regional Analysis 2017-2027
5.5.1 Brazil Transformer Core Regional Analysis 2017-2027
5.5.2 Argentina Transformer Core Regional Analysis 2017-2027
5.5.3 Saudi Arabia Transformer Core Regional Analysis 2017-2027
5.5.4 South Africa Transformer Core Regional Analysis 2017-2027
5.5.5 Rest Of LAMEA Transformer Core Regional Analysis 2017-2027
6. Leading Companies in the Transformer Core Market
6.1 ABB Ltd. Company Overview
6.1.2 ABB Ltd Historic Revenue
6.1.3 ABB Ltd Brands and Products
6.1.4 ABB Ltd Key Strategic Moves and Developments
6.2 Siemens AG Overview
6.2.3 Siemens AG Key Strategic Moves and Developments
6.3 Toshiba Overview
6.3.1 Toshiba Historic Revenue
6.3.2 Toshiba Regional Emphasis/Focus
6.4 Mitsubishi Electric Corporation Overview
6.4.1 Mitsubishi Electric Corporation Historic Revenue
6.4.2 Mitsubishi Electric Corporation Products
6.4.3 Key Strategic Moves and Developments
6.5 Hitachi Ltd. Overview
6.5.1 Hitachi Historic Revenue
6.5.2 Hitachi Products
6.5.2 Hitachi Key Strategic Moves and Developments
6.6 Fuji Electric Co. Ltd. Overview
6.6.1 Fuji Electric Co. Ltd. Historic Revenue
6.6.2 Fuji Electric Co. Ltd. Products
6.7 Crompton Greaves Overview
6.7.1 Crompton Greaves Historic Revenue
6.7.2 Crompton Greaves Key Strategic Moves and Developments
6.8 Ferroxcube International Holding B.V. Overview
6.8.1 Ferroxcube International Holding B.V. Products Analysis
6.9 Other Leading Companies
7. Conclusions and Recommendations
7.1 Key Findings
7.2 Recommendations
8. Glossary
Appendix
Associated Visiongain Reports
Visiongain Report Sales Order Form
Appendix A
Appendix B
Visiongain Report Evaluation Form
List of Tables
Table 3.1. Global Transformer Core Market Forecast 2017-2027 ($m, AGR %, Cumulative)
Table 3.2. World Electricity Consumption, 2010-2012 (billion kilowatt-hours)
Table 4.1. Global Transformer Core by Type Volume Forecast 2017-2027 (KT, AGR %, CAGR %)
Table 4.2. Transformer Core by Type Market Value Forecast 2017-2027 ($m, AGR %, CAGR %)
Table 4.3. Power Transformer Regional Volume Forecast 2017-2027 (Kilotons, AGR %, CAGR %)
Table 4.4. Power Transformer Regional Submarket Forecast 2017-2027 (US$m, AGR %, Cumulative)
Table 4.5. Global Power Transformer Market Forecast 2017-2027 (US$m, AGR %, CAGR %, Cumulative)
Table 4.6. Distribution Transformer Regional Volume Forecast 2017-2027 (Kilotons, AGR %, CAGR %)
Table 4.7. Distribution Transformer Regional Submarket Forecast 2017-2027 (US $m, AGR %, CAGR %)
Table 4.8. Global Distribution Transformer Market Forecast 2017-2027 (US$m, AGR %, CAGR %, Cumulative)
Table 4.7. Global Distribution Transformer Market Forecast 2017-2027 (US$m, AGR %, CAGR %, Cumulative)
Table 4.9. Global Others Transformer Cores Regional Volume Forecast 2017-2027 (Kilotons, AGR %)
Table 4.10. Global Others Transformer Core by Region Market Forecast 2017-2027 (US$m, AGR %)
Table 4.11. Global Others Transformer Market Forecast 2017-2027 (US$m, AGR %, CAGR %, Cumulative)
Table 5.1. Global Transformer Cores Markets Regional Forecast, By Volume 2017-2027 (KT, AGR %, CAGR %)
Table 5.2. Global Transformer Cores Markets Regional Forecast, By Value 2017-2027 (US$m, AGR %, CAGR %)
Table 5.3. Global Transformer Cores Markets, By Volume 2017-2027 (KT, AGR %, CAGR %)
Table 5.4. Global Transformer Cores Submarkets Regional Forecast, By Value 2017-2027 (US$m, AGR %, CAGR %)
Table 5.5. North America Transformer Cores Volume Forecast, By Country 2017-2027 (KT, AGR %, CAGR %)
Table 5.6. North America Transformer Cores Market Forecast, By Country (US$m, AGR %, CAGR %)
Table 5.7. North America Transformer Cores Volume Forecast, By Type 2017-2027 (KT, AGR %, CAGR %)
Table 5.8. North America Transformer Cores Submarkets Forecast, By Type 2017-2027 (US$m, AGR %, CAGR %)
Table 5.9. Europe Transformer Cores Volume Forecast, By Country 2017-2027 (KT, AGR %, CAGR %)
Table 5.10. Europe Transformer Cores Market Forecast, By Country (US$m, AGR %, CAGR %)
Table 5.11. Europe Transformer Cores Volume Forecast, By Type 2017-2027 (KT, AGR %, CAGR %)
Table 5.12. Europe Transformer Cores Submarkets Forecast, By Type 2017-2027 (US$m, AGR %, CAGR %)
Table 5.13. Asia-Pacific Transformer Cores Volume Forecast, By Country 2017-2027 (KT, AGR %, CAGR %)
Table 5.14. Asia-Pacific Transformer Cores Market Forecast, By Country (US$m, AGR %, CAGR %)
Table 5.15. Asia-Pacific Transformer Cores Volume Forecast, By Type 2017-2027 (KT, AGR %, CAGR %)
Table 5.16. Asia-Pacific Transformer Cores Submarkets Forecast, By Type 2017-2027 (US$m, AGR %, CAGR %)
Table 5.17. LAMEA Transformer Cores Volume Forecast, By Country 2017-2027 (KT, AGR %, CAGR %)
Table 5.18. LAMEA Transformer Cores Market Forecast, By Country (US$m, AGR %, CAGR %)
Table 5.19. LAMEA Transformer Cores Volume Forecast, By Type 2017-2027 (KT, AGR %, CAGR %)
Table 5.20. LAMEA Transformer Cores Submarkets Forecast, By Type 2017-2027 (US$m, AGR %, CAGR %)
Table 6.1. ABB Ltd. Company Overview (Total Revenue $m), Key Members HQ, Contact Number, Website, 2015
Table 6.2. ABB Ltd. Historic Revenue ($m, AGR%), 2013-2015
Table 6.3. ABB Ltd. Product Lines and Products, 2017
Table 6.4 ABB Ltd Key Strategic Moves and Developments
Table 6.5. Siemens AG Overview (Total Revenue $m), Key Executives, HQ, Website 2015
Table 6.6. Siemens AG Business Segments, Revenue From Segments (€m, % Share), Revenue From Sector (%), 2015
Table 6.7. Siemens AG Historic Revenue ($m, AGR%), 2013-2015
Table 6.8. Siemens AG Product Brands and Product Lines, 2017
Table 6.9. Siemens AG Key Strategic Moves and Developments
Table 6.10. Toshiba Overview (Total Revenue $m), Key Executives, HQ, Website, 2016
Table 6.11. Toshiba Historic Revenue ($m, AGR%), 2013-2015
Table 6.12. Toshiba Product Brands and Product Lines, 2017
Table 6.13. Mitsubishi Electric Corporation Overview (Total Revenue $m) Key Executives, HQ, IR Contact, Website), 2016
Table 6.14. Mitsubishi Electric Corporation Historic Revenue ($m, AGR%), 2013-2015
Table 6.15. Mitsubishi Electric Corporation Product Brands and Product Lines, 2017
Table 6.16. Strategic Moves and Developments
Table 6.17. Hitachi Ltd. Overview (Total Revenue $m), Revenue From The Transformer Core ($m), Key Executives, HQ, IR Contact, Website), 2016
Table 6.18. Hitachi Ltd. Historic Revenue ($m, AGR%), 2014-2016
Table 6.19. Hitachi Products, 2016
Table 6.20. Hitachi Key Strategic Moves and Developments
Table 6.21. Fuji Electric Co. Ltd. Overview (Total Revenue $m), Key Executives, HQ, IR Contact, Website), 2016
Table 6.22. Fuji Electric Co. Ltd. Historic Revenue ($m, AGR%), 2014-2016
Table 6.23. Fuji Electric Co. Ltd. Product Brands and Product Lines, 2017
Table 6.24. Crompton Greaves Overview (Total Revenue $m), Key Executives, HQ, IR Contact, Website), 2015
Table 6.25. Crompton Greaves Historic Revenue ($m, AGR%), 2013-2015
Table 6.26. Crompton Greaves Key Strategic Moves and Developments
Table 6.27. Ferroxcube International Holding B.V. Overview (HQ, Website), 2016
Table 6.28. Product Brands and Product Lines, 2017
Table 7.1. Global Transformer Core Market Forecast 2017-2027 ($m, AGR %, Cumulative)
List of Figures
Figure 1.1. Global Transformer Core Market Forecast ($m, AGR%), 2017-2027
Figure 1.2. Global Transformer Core Market Segmentation
Figure 1.3. Example of Leading National Transformer Core Market Forecast by Submarket 2017-2027 (US$m, AGR %, Cumulative)
Figure 2.1. Global Transformer Core Market Segmentation Overview
Figure 2.2. Transformer CoreTypes
Figure 2.3. Top Investing Regions for Transformer Core Market
Figure 2.4. Global Transformer Core Winning Strategies
Figure 2.5. Global Transformer Core Top Winning Strategies, By Company, 2011–2016
Figure 3.1. Global Transformer Core Market Forecast ($m, AGR%), 2017-2027
Figure 3.2. Global Transformer Core Market Forecast By Type 2017-2027 (AGR %)
Figure 3.3. Global Transformer Core Market Drivers & Restraints 2017-2027
Figure 3.4. Growth rates of urban agglomerations, by size class, 2014–2030
Figure 3.5. Porter’s Five Forces Analysis
Figure 4.1. Leading Transformer Core Submarkets Growth Rate Forecast (AGR %), 2017-2027
Figure 4.2. Leading Transformer Core Submarkets Shares Forecast (% Share), 2017
Figure 4.3. Leading Transformer Core Submarkets Shares Forecast (% Share), 2022
Figure 4.4. Leading Transformer Core Submarkets Shares Forecast (% Share), 2027
Figure 4.5. Global Power Transformers Submarket Forecast ($m, AGR%), 2017-2027
Figure 4.6. Global Power Transformer Market Forecast 2017-2027 (tons AGR %)
Figure 4.7. Global Distribution Transformer Market Forecast 2017-2027 (US$m, Global AGR %)
Figure 4.8. Global Others Transformer Market Forecast 2017-2027 (US$m, Global AGR %)
Figure 4.9. Global Others Transformer Volume Forecast 2017-2027 (Kilotons, AGR %, CAGR %, Cumulative)
Figure 5.1. North America Market Size by Country 2017 (US$m, Global AGR %)
Figure 5.2. North America Market Size by Country 2017-2027 (US$m, Global AGR %)
Figure 5.3. North America Transformer Cores Market Share By Country 2017 (US$m, Global AGR %)
Figure 5.4. North America Transformer Cores Market Share By Country 2022 (US$m, Global AGR %)
Figure 5.5. North America Transformer Cores Market Share By Country 2027 (US$m, Global AGR %)
Figure 5.6. Europe Transformer Cores Market Forecast by Country Market 2017-2027 (US$m, Global AGR %)
Figure 5.7. Europe Market Size by Country 2017 (US$m, Global AGR %)
Figure 5.8. Europe Transformer Cores Regional Market Share Forecast 2017 (% Share)
Figure 5.9. Europe Transformer Cores Regional Market Share Forecast 2022 (% Share)
Figure 5.10. Europe Transformer Cores Regional Market Share Forecast 2027 (% Share)
Figure 5.11 Asia-Pacific Transformer Cores Market Forecast by Country Market 2017-2027 (US$m, Global AGR %)
Figure 5.12. Asia-Pacific Market Size by Country 2017 (US$m, Global AGR %)
Figure 5.13. Asia-Pacific Regional Market Share Forecast 2017 (% Share)
Figure 5.14. Asia-Pacific Regional Market Share Forecast 2022 (% Share)
Figure 5.15. Asia-Pacific Regional Market Share Forecast 2027 (% Share)
Figure 5.16. LAMEA Transformer Cores Market Forecast by Country Market 2017-2027 (US$m, Global AGR %)
Figure 5.17. LAMEA Market Size by Country Forecast 2017 (US$m, Global AGR %)
Figure 5.18. LAMEA Transformer Cores Regional Market Share Forecast 2017 (% Share)
Figure 5.19. LAMEA Transformer Cores Regional Market Share Forecast 2022 (% Share)
Figure 5.20. LAMEA Transformer Cores Regional Market Share Forecast 2027 (% Share)
Figure 6.1. ABB Ltd. Business Segments Revenue (%), 2016
Figure 6.2. ABB Ltd. Historic Revenue ($m, AGR%), 2013-2015
Figure 6.3. Siemens AG Business Segments Revenue (%), 2015
Figure 6.4. Siemens AG Historic Revenue ($m, AGR%), 2013-2015
Figure 6.5. Siemens Regional Emphasis/ Focus (% Share), 2015
Figure 6.6. Toshiba Business Segments Revenue (%), 2016
Figure 6.7. Toshiba Historic Revenue ($m, AGR%), 2013-2015
Figure 6.8. Toshiba Regional Emphasis/ Focus (% Share), 2016
Figure 6.9. Mitsubishi Electric Corporation Business Segments Revenue (%), 2015
Figure 6.10. Mitsubishi Electric Corporation Historic Revenue ($m, AGR%), 2013-2015
Figure 6.11. Hitachi Electric Corporation Business Segments Revenue (%), 2015
Figure 6.12. Hitachi Ltd. Historic Revenue ($m, AGR%), 2014-2016
Figure 6.13. Fuji Electric Co. Ltd. Business Segments Revenue (%), 2016
Figure 6.14. Fuji Electric Co. Ltd. Historic Revenue ($m, AGR%), 2014-2016
Figure 6.15. Crompton Greaves Business Segments Revenue (%), 2015
Figure 6.16. Crompton Greaves Historic Revenue ($m, AGR%), 2013-2015