
Visiongain has calculated that the global Land Drill Rigs market will see a capital expenditure (CAPEX) of $43,454.1mn in 2020. Read on to discover the potential business opportunities available.
Land drilling comprises nearly 65% of the overall oil and gas drilling and production of oil across the globe. This number is expected to rise in the near future despite the growing awareness among the consumers regarding green energy and alternate energy sources.
Land drilling or onshore drilling is often the preferred choice of contractors that enter into oil and gas drilling sector due to certain obvious parameters. These parameters include, capital expenditure, maintenance, availability of workforce, and technical expertise. An average cost of setting up an onshore drilling rig is ten times less than that of an offshore drilling rig.
The major factors that contribute towards the growth of land drilling rigs market include increasing onshore oil production, low operational cost and high demand of land drilling rigs, and advancement in drilling technology and inspection services.
Onshore drilling is one of the major sources for oil extraction to meet the high demands from Asian, European, and the Middle East for petroleum. The consumption of oil is nearly 35 billion barrels per year across the globe which constitutes nearly 100 million barrels in a day.
Visiongain’s global Land Drill Rigs market report can keep you informed and up to date with the developments in the market, across six different regions: North America, Europe, Middle East, Africa, Asia Pacific and South America.
With reference to this report, it details the key investments trend in the global market, subdivided by regions, capital expenditure, rig type and power. Through extensive secondary research and interviews with industry experts, Visiongain has identified a series of market trends that will impact the Land Drill Rigs market over the forecast timeframe.
The report will answer questions such as:
• How is global the land drill rigs market evolving?
• What is driving and restraining the land drill rigs market?
• What are the market shares of each segment of the overall land drill rigs market in 2020?
• How will each land drill rig submarket segment grow over the forecast period and how much revenue will these submarkets account for in 2030?
• How will the market shares for each land drill rigs submarket develop from 2020 to 2030?
• Which individual technologies will prevail and how will these shifts be responded to?
• What will be the main driver of the overall market from 2020 to 2030?
• How will political and regulatory factors influence the regional markets and submarkets?
• Will leading national land drill rigs markets broadly follow the macroeconomic dynamics, or will individual national markets outperform others?
• How will the market shares of the national markets change by 2030 and which geographical region will lead the market in 2030?
• Who are the leading players and what are their prospects over the forecast period?
• What are the predictions for M&A activity, consolidation for existing players and the potential prospects for new market entrants?
• How will the industry evolve during the period between 2020 and 2030?
Five Reasons Why You Must Order and Read This Report Today:
1) The report provides forecasts for the global Land Drill Rigs market, by Rig Type for the period 2020-2030
• Mobil Rig CAPEX 2020-2030
• Conventional Rig CAPEX 2020-2030
2) The report also forecasts and analyses the Land Drill Rigs market by Power from 2020-2030
• Less than 1500 hp CAPEX 2020-2030
• 1500 hp to 2500 hp CAPEX 2020-2030
• More than 2500 hp CAPEX 2020-2030
3) The report reveals where and how companies are investing in Land Drill Rigs. We show you the prospects for the following regions, including individual breakdowns by Rig Type and Power:
Africa
• Nigeria CAPEX 2020-2030
• Algeria CAPEX 2020-2030
• Angola CAPEX 2020-2030
• Rest of Africa CAPEX 2020-2030
Asia Pacific
• India CAPEX 2020-2030
• China CAPEX 2020-2030
• Indonesia CAPEX 2020-2030
• Rest of Asia-Pacific CAPEX 2020-2030
North America
• U.S. CAPEX 2020-2030
• Canada CAPEX 2020-2030
• Mexico CAPEX 2020-2030
Europe
• Russia CAPEX 2020-2030
• Kazakhstan CAPEX 2020-2030
• UK CAPEX 2020-2030
• Rest of Europe CAPEX 2020-2030
South America
• Brazil CAPEX 2020-2030
• Argentina CAPEX 2020-2030
• Colombia CAPEX 2020-2030
• Venezuela CAPEX 2020-2030
• Rest of South America CAPEX 2020-2030
Middle East
• UAE CAPEX 2020-2030
• Saudi Arabia CAPEX 2020-2030
• Kuwait CAPEX 2020-2030
• Iran CAPEX 2020-2030
• Iraq CAPEX 2020-2030
• Rest of Middle East CAPEX 2020-2030
4) The report includes Details of Recent Developments including company Mergers and Acquisitions Land Drill Rigs market
• Date
• Approach
• Details
5) The report provides market share and detailed profiles of the leading companies operating within the Land Drill Rigs market:
• KCA Deutag
• Nabors Industries Ltd.
• Cactus Drilling Company, LLC
• SDP Services Ltd.
• Drillmec Inc.
• Marriott Drilling Ltd.
• China Oilfield Services Ltd.
• Helmerich & Payne, Inc
• Parker Drilling
• Patterson-UTI Energy, Inc
This independent 163-page report guarantees you will remain better informed than your competitors. With 205 tables and figures examining the Land Drill Rigs market space, the report gives you a direct, detailed breakdown of the market. PLUS, Capital expenditure by Rig Type and Power, as well as in-depth analysis of company Mergers and Acquisitions that will keep your knowledge that one step ahead of your rivals.
This report is essential reading for you or anyone in the Oil and Gas sector. Purchasing this report today will help you to recognise those important market opportunities and understand the possibilities there. I look forward to receiving your order.
Buy our report today Land Drill Rigs Market Analysis. Avoid missing out by staying informed – order our report now.
Visiongain is a trading partner with the US Federal Government
CCR Ref number: KD4R6
Do you have any custom requirements we can help you with? Any need for specific country, geo region, market segment or specific company information? Contact us today, we can discuss your needs and see how we can help: sara.peerun@visiongain.com
1. Report Overview
1.1 Land Drill Rigs Market Overview
1.2 Global Land Drill Rigs Market Segmentation
1.3 Global Land Drill Rigs Market Definition
1.4 Why You Should Read This Report
1.5 How This Report Delivers
1.6 Key Questions Answered by This Analytical Report
1.7 Who is This Report For?
1.8 Methodology
1.9 Frequently Asked Questions (FAQ)
1.10 Associated Visiongain Reports
1.11 About Visiongain
2. Introduction to the Land Drill Rigs Market
2.1 Rig Types
2.1.1 Mobil Rig
2.1.2 Conventional Rig
2.2 Power Type
2.2.1 Less than 1500 hp
2.2.2 1500 hp to 2500 hp
2.2.3 More than 2500 hp
2.3 History of Land Rigs
3. Global Land Drill Rigs Market Forecast 2019-2030
3.1 Global Land Drill Rigs Market Overview
3.2 Global Land Drill Rigs Market Overview by Rig Type
3.3 Global Land Drill Rigs Market Overview by Power Type
3.4 Global Land Drill Rigs Market Overview by Region
4. Global Land Drill Rigs Market Drivers and Restraints
4.1 Drivers
4.1.1 Increasing Onshore Oil Production
4.1.2 Low Operational Cost and High Demand of Land Drilling Rigs
4.1.3 Advancement in Drilling Technology and Inspection Services
4.2 Restraints
4.2.1 Increasing Focus on Renewable Energy
4.2.2 Low Crude Oil Prices
4.2.3 Opportunities
4.2.4 Challenges
5. North America Land Drill Rigs Market Forecast 2020-2030
5.1 North America Land Drill Rigs Market Overview
5.2 North America Land Drill Rigs Market Overview by Rig Type
5.3 North America Land Drill Rigs Market Overview by Power Type
5.4 North America Land Drill Rigs Market Overview by Country
6. Asia-Pacific Land Drill Rigs Market Forecast 2019-2030
6.1 Asia-Pacific Land Drill Rigs Market Overview
6.2 Asia-Pacific Land Drill Rigs Market Overview by Rig Type
6.3 Asia-Pacific Land Drill Rigs Market Overview by Power Type
6.4 Asia-Pacific Land Drill Rigs Market Overview by Country
7. Africa Land Drill Rigs Market Forecast 2019-2030
7.1 Africa Land Drill Rigs Market Overview
7.2 Africa Land Drill Rigs Market Overview by Rig Type
7.3 Africa Drill Rigs Market Overview by Power Type
7.4 Africa Land Drill Rigs Market Overview by Country
8. Europe Land Drill Rigs Market Forecast 2019-2030
8.1 Europe Land Drill Rigs Market Overview
8.2 Europe Land Drill Rigs Market Overview by Rig Type
8.3 Europe Land Drill Rigs Market Overview by Power Type
8.4 Europe Land Drill Rigs Market Overview by Country
9. The Middle East Land Drill Rigs Market Forecast 2019-2030
9.1 The Middle East Land Drill Rigs Market Overview
9.2 The Middle East Land Drill Rigs Market Overview by Rig Type
9.3 The Middle East Land Drill Rigs Market Overview by Power Type
9.4 The Middle East Land Drill Rigs Market Overview by Country
10. South America Land Drill Rigs Market Forecast 2020-2030
10.1 South America Land Drill Rigs Market Overview
10.2 South America Land Drill Rigs Market Overview by Rig Type
10.3 South America Land Drill Rigs Market Overview by Power Type
10.4 South America Land Drill Rigs Market Overview by Country
11.PEST & Porters Analysis of the Land Drill Rigs Market
11.1 North America PEST Analysis
11.2 South America PEST Analysis
11.3 Middle East PEST Analysis
11.4 Europe PEST Analysis
11.5 Asia-Pacific PEST Analysis
11.6 Africa PEST Analysis
11.7 Porters Five Force Analysis
12. Leading Companies in the Land Drill Rigs Market
12.1 KCA Deutag
12.1.1 KCA Deutag Profile
12.1.2 KCA Deutag Analyst View
12.1.3 KCA Deutag Selected Recent Developments
12.1.4 KCA Deutag SWOT
12.2 Nabors Industries Ltd.
12.2.1 Nabors Industries Ltd. Profile
12.2.2 NaborsIndustries Ltd. Analyst View
12.2.3 Nabors Industries Ltd. Selected Recent Developments
12.2.4 Nabors Industries Ltd. Ltd SWOT
12.3 Cactus Drilling Company, LLC
12.3.1 Cactus Drilling Company, LLC Profile
12.3.2 Cactus Drilling Company, LLC Analyst View
12.3.3 Cactus Drilling Company, LLC Selected Recent Developments
12.3.4 Cactus Drilling Company, LLC SWOT
12.4 SDP Services Ltd.
12.4.1 SDP Services Ltd. Profile
12.4.2 SDP Services Ltd. Analyst View
12.4.3 SDP Services Ltd. Selected Recent Developments
12.4.4 SDP Services Ltd. SWOT
12.5 Drillmec Inc.
12.5.1 Drillmec Inc. Profile
12.5.2 Drillmec Inc. Analyst View
12.5.3 Drillmec Inc. Selected Recent Developments
12.5.4 Drillmec Inc. SWOT
12.6 Marriott Drilling Ltd.
12.6.1 Marriott Drilling Ltd. Profile
12.6.2 Marriott Drilling Ltd. Analyst View
12.6.3 Marriott Drilling Ltd. Selected Recent Developments
12.6.4 Marriott Drilling Ltd. SWOT
12.7 China Oilfield Services Ltd.
12.7.1 China Oilfield Services Ltd. Profile
12.7.2 China Oilfield Services Ltd. Analyst View
12.7.3 China Oilfield Services Ltd. Selected Recent Developments
12.7.4 China Oilfield Services Ltd. SWOT
12.8 Helmerich & Payne, Inc.
12.8.1 Helmerich & Payne, Inc. Profile
12.8.2 Helmerich & Payne, Inc. Analyst View
12.8.3 Helmerich & Payne, Inc. Selected Recent Developments
12.8.4 Helmerich & Payne, Inc. SWOT
12.9 Parker Drilling
12.9.1 Parker Drilling Profile
12.9.2 Parker Drilling Analyst View
12.9.3 Parker Drilling Recent Developments
12.9.4 Parker Drilling SWOT
12.10 Patterson-UTI Energy, Inc
12.10.1 Patterson-UTI Energy, Inc Profile
12.10.2 Patterson-UTI Energy, Inc Analyst View
12.10.3 Patterson-UTI Energy, Inc Recent Developments
12.10.4 Patterson-UTI Energy, Inc SWOT
12.11 Precision Drilling Corporation
12.11.1 Precision Drilling Corporation Profile
12.11.2 Precision Drilling Corporation Analyst View
12.11.3 Precision Drilling Corporation Recent Developments
12.11.4 Precision Drilling Corporation SWOT
12.12 Pioneer Energy Services
12.12.1 Pioneer Energy Services Profile
12.12.2 Pioneer Energy Services Analyst View
12.12.4 Pioneer Energy Services SWOT
12.13 Lamprell
12.13.1 Lamprell Profile
12.13.2 Lamprell Analyst View
12.13.3 Lamprell Recent Developments
12.13.4 Lamprell SWOT
12.14 Bharat Heavy Electricals Ltd.
12.14.1 Bharat Heavy Electricals Ltd. Profile
12.14.2 Bharat Heavy Electricals Ltd. Analyst View
12.14.4 Bharat Heavy Electricals Ltd. SWOT
12.15 Honghua Group Ltd
12.15.1 Honghua Group Ltd Profile
12.15.2 Honghua Group Ltd Analyst View
12.15.3 Honghua Group Ltd Recent Developments
12.15.4 Honghua Group Ltd SWOT
12.16 Other Leading Companies in the Land Drilling Market
13. Conclusion and Recommendations
13.1 Conclusion
13.2 Recommendations
14. Glossary
Associated Visiongain Reports
Visiongain Report Sales Order Form
Appendix A
About Visiongain
Appendix B
Visiongain report evaluation form
List of Tables
Table 1.1 Global Land Drill Rigs Market Forecast, By Region 2019-2030
Table 3.1 Global Land Drill Rigs Market Value Forecast (Usd Mn), By Rig Type 2019-2030
Table 3.2 Global Land Drill Rigs Market Volume Forecast (Units), By Rig Type 2019-2030
Table 3.3 Global Land Drill Rigs Market Value Forecast (Usd Mn), By Power Type 2019-2030
Table 3.4 Global Land Drill Rigs Market Volume Forecast (Units), By Power Type 2019-2030
Table 3.5 Global Land Drill Rigs Market Value Forecast (Usd Mn), By Region 2019-2030
Table 3.6 Global Land Drill Rigs Market Value Forecast (Units), By Region 2019-2030
Table 3.7 Global Land Drill Rigs Market Forecast (Usd Mn, Agr %, Cagr %),2019-2030
Table 5.1 North America Land Drill Rigs Market Value Forecast (Usd Mn), By Rig Type 2019-2030
Table 5.2 North America Land Drill Rigs Market Volume Forecast (Units), By Rig Type 2019-2030
Table 5.3 North Americaland Drill Rigs Market Value Forecast (Usd Mn), By Power Type 2019-2030
Table 5.4 North America Land Drill Rigs Market Volume Forecast (Units), By Power Type 2019-2030
Table 5.5north America Land Drill Rigs Market Value Forecast (Usd Mn), By Country2019-2030
Table 5.6north America Land Drill Rigs Market Volume Forecast (Units), By Country2019-2030
Table 5.7 North America Land Drill Rigs Market Forecast (Usd Mn, Agr %, Cagr %),2019-2030
Table 6.1 Asia-Pacific Land Drill Rigs Market Value Forecast (Usd Mn), By Rig Type 2019-2030
Table 6.2 Asia-Pacific Land Drill Rigs Market Volume Forecast (Units), By Rig Type 2019-2030
Table 6.3 Asia-Pacific Land Drill Rigs Market Value Forecast (Usd Mn), By Power Type 2019-2030
Table 6.4 Asia-Pacific Land Drill Rigs Market Volume Forecast (Units), By Power Type 2019-2030
Table 6.5asia-Pacific Land Drill Rigs Market Value Forecast (Usd Mn), By Country 2019-2030
Table 6.6asia-Pacific Land Drill Rigs Market Volume Forecast (Units), By Country2019-2030
Table 6.7 Asia-Pacific Land Drill Rigs Market Forecast (Usd Mn, Agr %, Cagr %),2019-2030
Table 7.1 Africa Land Drill Rigs Market Value Forecast (Usd Mn), By Rig Type 2019-2030
Table 7.2 Africa Land Drill Rigs Market Volume Forecast (Units), By Rig Type 2019-2030
Table 7.3 Africa Land Drill Rigs Market Value Forecast (Usd Mn), By Power Type 2019-2030
Table 7.4 Africa Land Drill Rigs Market Volume Forecast (Units), By Power Type 2019-2030
Table 7.5africa Land Drill Rigs Market Value Forecast (Usd Mn), By Country 2019-2030
Table 7.6africa Land Drill Rigs Market Volume Forecast (Units), By Country2019-2030
Table 7.7 Africa Land Drill Rigs Market Forecast (Usd Mn, Agr %, Cagr %),2019-2030
Table 8.1 Europe Land Drill Rigs Market Value Forecast (Usd Mn), By Rig Type 2019-2030
Table 8.2 Europe Land Drill Rigs Market Volume Forecast (Units), By Rig Type 2019-2030
Table 8.3 Europe Land Drill Rigs Market Value Forecast (Usd Mn), By Power Type 2019-2030
Table 8.4 Europe Land Drill Rigs Market Volume Forecast (Units), By Power Type 2019-2030
Table 8.5europeland Drill Rigs Market Value Forecast (Usd Mn), By Country 2019-2030
Table 8.6europe Land Drill Rigs Market Volume Forecast (Units), By Country2019-2030
Table 8.7 Europe Land Drill Rigs Market Forecast (Usd Mn, Agr %, Cagr %),2019-2030
Table 9.1 The Middle East Land Drill Rigs Market Value Forecast (Usd Mn), By Rig Type 2019-2030
Table 9.2 The Middle East Land Drill Rigs Market Volume Forecast (Units), By Rig Type 2019-2030
Table 9.3 The Middle East Land Drill Rigs Market Value Forecast (Usd Mn), By Power Type 2019-2030
Table 9.4 The Middle East Land Drill Rigs Market Volume Forecast (Units), By Power Type 2019-2030
Table 9.5the Middle East Land Drill Rigs Market Value Forecast (Usd Mn), Bycountry,2019-2030
Table 9.6the Middle East Land Drill Rigs Market Volume Forecast (Units), By Country 2019-2030
Table 9.7 The Middle East Land Drill Rigs Market Forecast (Usd Mn, Agr %, Cagr %),2019-2030
Table 10.1 South America Land Drill Rigs Market Value Forecast (Usd Mn), By Rig Type 2019-2030
Table 10.2 South Americaland Drill Rigs Market Volume Forecast (Units), By Rig Type 2019-2030
Table 10.3 South America Land Drill Rigs Market Value Forecast (Usd Mn), By Power Type 2019-2030
Table 10.4 South America Land Drill Rigs Market Volume Forecast (Units), By Power Type 2019-2030
Table 10.5south America Land Drill Rigs Market Value Forecast (Usd Mn), Bycountry,2019-2030
Table 10.6south America Land Drill Rigs Market Volume Forecast (Units), By Country 2019-2030
Table 10.7 South America Land Drill Rigs Market Forecast (Usd Mn, Agr %, Cagr %),2019-2030
Table 12.1. Kca Deutag (Ceo, Total Company Sales (Usd), Ebitda (Usd), Strongest Business Region, Headquarters, Founded, No. Of Employees, Website)
Table 12.2 Kca Deutag Selected Recent Developments
Table 12.3 Nabors Industries Ltd. (Ceo, Total Company Sales (Usd), Net Income / Loss (Usd), R&Amp;D Expenditure (Usd), Strongest Business Region, Business Segment In The Market, Headquarters, Founded, No. Of Employees, Ticker, Website)
Table 12.4 Nabors Industries Ltd Selected Recent Developments
Table 12.5 Cactus Drilling Company, Llc. (President, Strongest Business Region, Business Segment In The Market, Headquarters, Founded, No. Of Employees,Website)
Table 12.6 Cactus Drilling Company, Llc Selected Recent Developments
Table 12.7 Sdp Services Ltd. (Ceo, Total Company Sales (Usd), Net Income / Loss (Usd),Strongest Business Region, Business Segment In The Market, Headquarters, Founded, No. Of Employees, Website)
Table 12.8 Sdp Services Ltd. Selected Recent Developments
Table 12.9 Drillmec Inc. (Chairman, Strongest Business Region, Business Segment In The Market, Headquarters, Founded, No. Of Employees, Website)
Table 12.10 Drillmec Inc. Selected Recent Developments
Table 12.11 Marriott Drilling Ltd. (Ceo, Strongest Business Region, Business Segment In The Market, Headquarters, Employees, Founded, Website)
Table 12.12 Marriott Drilling Selected Recent Developments
Table 12.13 China Oilfield Services Ltd. (Ceo, Total Company Sales (Usd), Strongest Business Region, Headquarters, Founded, No. Of Employees, Ticker, Website)
Table 12.14 China Oilfield Services Ltd. Selected Recent Developments
Table 12.15 Helmerich&Amp; Payne (Ceo, Total Company Sales (Usd), Net Income / Loss (Usd), Strongest Business Region, Business Segment In The Market, Headquarters, Founded, No. Of Employees, Ticker, Website)
Table 12.16 Helmerich &Amp; Payne, Inc. Selected Recent Developments
Table 12.17 Parker Drilling (Ceo, Total Company Sales (Usd), Net Income / Loss (Usd), Strongest Business Region, Business Segment In The Market, Headquarters, Founded, No. Of Employees, Ticker, Website)
Table 12.18 Parker Drilling Selected Recent Developments
Table 12.19 Patterson-Uti Energy Inc (Ceo, Total Company Sales (Usd), Net Income / Loss (Usd), Strongest Business Region, Business Segment In The Market, Headquarters, Ticker, Website)
Table 12.20 Patterson-Uti Energy, Inc Selected Recent Developments
Table 12.21 Precision Drilling Corporation (Ceo, Total Company Sales (Usd), Net Income / Loss (Usd), Strongest Business Region, Business Segment In The Market, Headquarters, Founded, No. Of Employees, Ticker, Website)
Table 12.22 Precision Drilling Corporation Selected Recent Developments
Table 12.23 Pioneer Energy Services (Ceo, Total Company Sales (Usd), Net Income / Loss (Usd), Strongest Business Region, Business Segment In The Market, Founded, Headquarters, Ticker, Website)
Table 12.24 Lamprell (Ceo, Total Company Sales (Usd), Net Income / Loss (Usd), Strongest Business Region, Business Segment In The Market, Founded, Headquarters, Employees, Ticker, Website)
Table 12.25 Lamprell Selected Recent Developments
Table 12.26 Bharat Heavy Electricals Ltd. (Chairman, Total Company Sales (Usd), Net Income / Loss (Usd), Strongest Business Region, Business Segment In The Market, Founded, Headquarters, Ticker, Website)
Table 12.27 Honghua Group Ltd(Chairman, Total Company Sales (Usd), Net Income / Loss (Usd), Strongest Business Region, Business Segment In The Market, Founded, Headquarters, Ticker, Website)
Table 12.28 Honghua Group Ltd Selected Recent Developments
List of Figures
Figure 1.1 Global Land Drill Rigs Market Segmentation
Figure 1.2 Global Land Drilling Rigs: Overview
Figure 2.1mobil Land Drill Rig
Figure 2.2 Conventional Drill Rig
Figure 2.3 Land Drilling Rigs Timeline Till 1900
Figure 2.4 Old Drilling Rig/Platform Used In The Early 1900
Figure 3.1 Global Land Drill Rigs Market Forecast: ($Mn, Units), 2019-2030
Figure 3.2 Global Land Drill Rigs Market Forecast By Rig Type, Value (Usd Mn) And Agr %2019-2030
Figure 3.3 Global Land Drill Rigs Market Forecast By Rig Type, Volume (Units) And Agr % 2019-2030
Figure 3.4 Global Land Drill Rigs Market Forecast By Power Type, Value (Usd Mn) And Agr % 2019-2030
Figure 3.5 Global Land Drill Rigs Market Forecast By Power Type, Volume (Units) And Agr % 2019-2030
Figure 3.6 Global Land Drill Rigs Market Forecast By Region, Value (Usd Mn) And Agr %2019-2030
Figure 3.7 Global Land Drill Rigs Market Forecast By Region, Volume (Units) And Agr %2019-2030
Figure 3.8 Global Land Drill Rigs Market Value Share % By Region, 2020
Figure 3.9 Global Land Drilling Rigs Market Agr % By Region 2019-2030
Figure 4.1 Land Drill Rigs Market: Drivers And Restraints, 2020-2030
Figure 4.2 Global Crude Oil Production, (2017-2030 Estimated)
Table 4.1 Land Rig Cost Analysis And Indicative Rates
Figure 4.3 Low Crude Oil Price, 2010-2020
Figure 5.1 North America Land Drill Rigs Market Forecast: (Usd Mn, Agr %), 2019-2030
Figure 5.2 North America Land Drill Rigs Market Forecast: (Units, Agr %) 2019-2030
Figure 5.3 North America Land Drill Rigs Market Forecast By Rig Type, Value (Usd Mn) And Agr % 2019-2030
Figure 5.4 North America Land Drill Rigs Market Forecast By Rig Type, Volume (Units) And Agr % 2019-2030
Figure 5.5 North America Land Drill Rigs Market Forecast By Power Type, Value (Usd Mn) And Agr %2019-2030
Figure 5.6 North America Land Drill Rigs Market Forecast By Power Type, Volume (Units) And Agr % 2019-2030
Figure 5.7 North America Land Drill Rigs Market Forecast By Region, Value (Usd Mn) And Agr % 2019-2030
Figure 5.8 North America Land Drill Rigs Market Forecast By Region, Volume (Units) And Agr %2019-2030
Figure 5.9 North America Land Drill Rigs Market Value Share % By Country, 2020
Figure 5.10 North America Land Drilling Rigs Market Agr % By Region 2019-2030
Figure 6.1 Asia-Pacific Land Drill Rigs Market Forecast: (Usd Mn, Agr %), 2019-2030
Figure 6.2asia-Pacific Land Drill Rigs Market Forecast: (Units, Agr %)2019-2030
Figure 6.3 Asia-Pacific Land Drill Rigs Market Forecast By Rig Type, Value (Usd Mn) And Agr %2019-2030
Figure 6.4 Asia-Pacific Land Drill Rigs Market Forecast By Rig Type, Volume (Units) And Agr % 2019-2030
Figure 6.5 Asia-Pacific Land Drill Rigs Market Forecast By Power Type, Value (Usd Mn And Agr %2019-2030
Figure 6.6 Asia-Pacific Land Drill Rigs Market Forecast By Power Type, Volume (Units) And Agr %2019-2030
Figure 6.7 Asia-Pacific Land Drill Rigs Market Forecast By Region, Value (Usd Mn) And Agr %2019-2030
Figure 6.8 Asia-Pacific Land Drill Rigs Market Forecast By Region, Volume (Units) And Agr %2019-2030
Figure 6.9 Asia-Pacific Land Drill Rigs Market Value Share % By Country, 2020
Figure 6.10 Asia-Pacific Land Drilling Rigs Market Agr % By Region 2019-2030
Figure 7.1 Africa Land Drill Rigs Market Forecast: (Usd Mn, Agr %), 2019-2030
Figure 7.2africa Land Drill Rigs Market Forecast: (Agr %, Units)2019-2030
Figure 7.3 Africa Land Drill Rigs Market Forecast By Rig Type, Value (Usd Mn) And Agr %2019-2030
Figure 7.4 Africa Land Drill Rigs Market Forecast By Rig Type, Volume (Units) And Agr %2019-2030
Figure 7.5 Africa Land Drill Rigs Market Forecast By Power Type, Value (Usd Mn) And Agr %2019-2030
Figure 7.6 Africa Land Drill Rigs Market Forecast By Power Type, Volume (Units) And Agr %2019-2030
Figure 7.7 Africa Land Drill Rigs Market Forecast By Region, Value (Usd Mn) And Agr %2019-2030
Figure 7.8 Africa Land Drill Rigs Market Forecast By Region, Volume (Units) And Agr %2019-2030
Figure 7.9 Africa Land Drill Rigs Market Value Share % By Country, 2020
Figure 7.10 Africa Land Drilling Rigs Market Agr % By Region 2019-2030
Figure 8.1 Europe Land Drill Rigs Market Forecast: (Usd Mn, Agr %), 2019-2030
Figure 8.2europe Land Drill Rigs Market Forecast: (Units, Agr %)2019-2030
Figure 8.3 Europe Land Drill Rigs Market Forecast By Rig Type, Value (Usd Mn) And Agr %2019-2030
Figure 8.4 Europe Land Drill Rigs Market Forecast By Rig Type, Volume (Units) And Agr %2019-2030
Figure 8.5 Europe Land Drill Rigs Market Forecast By Power Type, Value (Usd Mn) And Agr %2019-2030
Figure 8.6europe Land Drill Rigs Market Forecast By Power Type, Volume (Units) And Agr %2019-2030
Figure 8.7 Europe Land Drill Rigs Market Forecast By Region, Value (Usd Mn) And Agr %2019-2030
Figure 8.8 Europe Land Drill Rigs Market Forecast By Region, Volume (Units) And Agr %2019-2030
Figure 8.9 Europe Land Drill Rigs Market Value Share % By Country, 2020
Figure 8.10 Europe Land Drilling Rigs Market Agr % By Region 2019-2030
Figure 9.1 The Middle East Land Drill Rigs Market Forecast: (Usd Mn, Agr %), 2019-2030
Figure 9.2middle East Land Drill Rigs Market Forecast: (Units, Agr %)2019-2030
Figure 9.3 The Middle East Land Drill Rigs Market Forecast By Rig Type, Value (Usd Mn) And Agr % 2019-2030
Figure 9.4 The Middle East Land Drill Rigs Market Forecast By Rig Type, Volume (Units) And Agr % 2019-2030
Figure 9.5 The Middle East Land Drill Rigs Market Forecast By Power Type, Value (Usd Mn) And Agr % 2019-2030
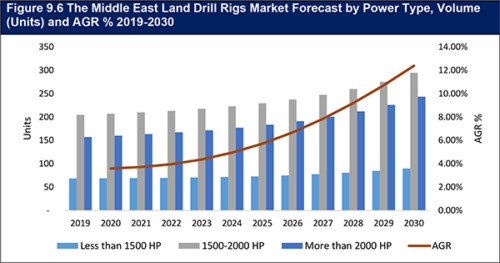
Figure 9.6 The Middle East Land Drill Rigs Market Forecast By Power Type, Volume (Units) And Agr % 2019-2030
Figure 9.7 The Middle East Land Drill Rigs Market Forecast By Region, Value (Usd Mn)And Agr %2019-2030
Figure 9.8 The Middle East Land Drill Rigs Market Forecast By Region, Volume (Units) And Agr %2019-2030
Figure 9.9 The Middle East Land Drill Rigs Market Value Share % By Country, 2020
Figure 9.10 The Middle East Land Drilling Rigs Market Agr % By Region 2019-2030
Figure 10.1 South America Land Drill Rigs Market Forecast: (Usd Mn, Agr %), 2019-2030
Figure 10.2south America Land Drill Rigs Market Forecast: (Units, Agr %) 2019-2030
Figure 10.3 South America Land Drill Rigs Market Forecast By Rig Type, Value (Usd Mn) And Agr % 2019-2030
Figure 10.4 South America Land Drill Rigs Market Forecast By Rig Type, Volume (Units) And Agr %2019-2030
Figure 10.5 South America Land Drill Rigs Market Forecast By Power Type, Value (Usd Mn) And Agr %2019-2030
Figure 10.6 South America Land Drill Rigs Market Forecast By Power Type, Volume (Units) And Agr %2019-2030
Figure 10.7 South America Land Drill Rigs Market Forecast By Region, Value (Usd Mn) And Agr %2019-2030
Figure 10.8 South America Land Drill Rigs Market Forecast By Region, Volume (Units) And Agr %2019-2030
Figure 10.9 South America Land Drill Rigs Market Value Share % By Country, 2020
Figure 10.10 South America Land Drilling Rigs Market Agr % By Region 2019-2030
Figure 11.1 North America Pest Analysis
Figure 11.2 South America Pest Analysis
Figure 11.3 Middle East Pest Analysis
Figure 11.4 Europe Pest Analysis
Figure 11.5 Asia-Pacific Pest Analysis
Figure 11.6 Africa Pest Analysis
Figure 11.7 Porters Five Force Analysis Global Land Drill Rigs Market 2020
Figure 12.1 Kca Deutag Segmental Revenue, 2018 (Usd Mn)
Figure 12.2 Kca Deutag Ebitda 2018 (Usd Mn)
Figure 12.3 Kca Deutag Swot
Figure 12.4 Nabors Industries Ltd Revenue From 2016–2018 (Usd Mn)
Figure 12.5 Nabors Industries Ltd Ebitda From 2016–2018 (Usd Mn)
Figure 12.6 Nabors Industries Ltd Regional Revenue Share % 2018
Figure: 12.7 Nabors Industries Ltd. Swot
Figure: 12.8 Cactus Drilling Company, Llc Swot
Figure: 12.9 Sdp Services Ltd. Swot
Figure: 12.10 Drillmec Inc. Swot
Figure: 12.11 Marriott Drilling Ltd. Swot
Figure: 12.12 China Oilfield Services Ltd. Revenue From 2017–2018 (Usd Mn)
Figure: 12.13 China Oilfield Services Ltd. Business Segmental Revenue From 2018 (Usd Mn)
Figure: 12.14 China Oilfield Services Ltd. Regional Segmental Revenue From 2018 (Usd Mn)
Figure: 12.15 China Oilfield Services Ltd. Swot
Figure: 12.16 Helmerich &Amp; Payne, Inc. Revenue From 2016–2018, (Usd Mn)
Figure: 12.17 Helmerich &Amp; Payne, Inc.Net Income From 2016–2018 (Usd Mn)
Figure: 12.18 Helmerich &Amp; Payne, Inc. Swot
Figure: 12.19 Parker Drilling Revenue From 2016–2018 (Usd Mn)
Figure: 12.20 Parker Drilling Business Segment From 2018 (Usd Mn)
Figure: 12.21 Parker Drilling. Swot
Figure: 12.22 Patterson-Uti Energy Inc Revenue From 2016–2018 (Usd Mn)
Figure: 12.23 Patterson-Uti Energy Inc Business Segment From 2018 (Usd Mn)
Figure: 12.24 Patterson-Uti Energy, Inc Swot
Figure: 12.25 Precision Drilling Corporation Revenue From 2016–2018 (Usd Mn)
Figure: 12.26 Precision Drilling Corporationsegmental Revenue From 2018
Figure: 12.27 Precision Drilling Corporationgeographic Revenue From 2018
Figure: 12.28 Precision Drilling Corporation Swot
Figure: 12.29 Pioneer Energy Services Revenue From 2016–2018 (Usd Mn)
Figure: 12.30 Pioneer Energy Services Segmental Revenue From 2018
Figure: 12.31 Pioneer Energy Services Swot
Figure: 12.32 Lamprell Revenue From 2016–2018 (Usd Mn)
Figure: 12.33 Lamprell Segmental Revenue From 2018
Figure: 12.34 Lamprell Swot
Figure: 12.35 Bharat Heavy Electricals Ltd. Revenue From 2016–2018 (Usd Mn)
Figure: 12.36 Bharat Heavy Electricals Ltd. Segmental Revenue From 2018
Figure: 12.37 Bharat Heavy Electricals Ltd. Swot
Figure: 12.38 Honghua Group Ltd Revenue From 2016–2018 (Usd Mn)
Figure: 12.39 Honghua Group Ltd Segmental Revenue From 2018
Figure: 12.40 Honghua Group Ltd Geographical Revenue From 2018
Figure: 12.41 Honghua Group Swot

