The Glass Packaging Market Report 2022-2032: This report will prove invaluable to leading firms striving for new revenue pockets if they wish to better understand the industry and its underlying dynamics. It will be useful for companies that would like to expand into different industries or to expand their existing operations in a new region.
Glass is a Widely Used Packaging Material
Glass is frequently utilised as a packaging material because of properties including recycle, reuse, and neutral reaction. It prevents illness while keeping foods and drinks fresh for a very long time. For example, beer is preserved by being stored in dark glass bottles. Glass is also used in chemical packing since it has a balanced composition and does not react. Because of its appealing look, glass packaging appeals to consumers. Glass can be recycled endlessly without sacrificing its grade or purity and is entirely recyclable. Recycling glass is a closed-loop process that generates no waste or byproducts. One of the few substances that can then be recycled multiple times without losing quality is glass.
Operational Challenges Associated with Glass Packaging
Glass has a strong and fragile nature. It supports the packaging’s contents and has a rigid form. A strong impact can damage a container, making the contents useless and wasting the material. The ability to sustain a forceful hit without exploding and spilling everything is superior in both metal and fabric. Glass is vulnerable to sudden temperature changes as well. By heating glass and then immediately exposing it to cool water or air, you can cause it to shatter. Fewer items can be sent in a single shipment since this material cannot be packaged as securely inside a cargo container as metal and plastic can. This is due to the fragility of the material. Shipping rates for glass bottles or containers are significantly higher than for comparable plastic or aluminium equivalents due to this along with the aspect that glassware weighs more than plastic or metal.
What Questions Should You Ask before Buying a Market Research Report?
• How is the glass packaging market evolving?
• What is driving and restraining the glass packaging market?
• How will each glass packaging submarket segment grow over the forecast period and how much revenue will these submarkets account for in 2032?
• How will the market shares for each glass packaging submarket develop from 2022 to 2032?
• What will be the main driver for the overall market from 2022 to 2032?
• Will leading glass packaging markets broadly follow the macroeconomic dynamics, or will individual national markets outperform others?
• How will the market shares of the national markets change by 2032 and which geographical region will lead the market in 2032?
• Who are the leading players and what are their prospects over the forecast period?
• What are the glass packaging projects for these leading companies?
• How will the industry evolve during the period between 2020 and 2032? What are the implications of glass packaging projects taking place now and over the next 10 years?
• Is there a greater need for product commercialisation to further scale the glass packaging market?
• Where is the glass packaging market heading and how can you ensure you are at the forefront of the market?
• What are the best investment options for new product and service lines?
• What are the key prospects for moving companies into a new growth path and C-suite?
You need to discover how this will impact the glass packaging market today, and over the next 10 years:
• Our 274-page report provides 131 tables and 128 charts/graphs exclusively to you.
• The report highlights key lucrative areas in the industry so you can target them – NOW.
• It contains in-depth analysis of global, regional and national sales and growth.
• It highlights for you the key successful trends, changes and revenue projections made by your competitors.
This report tells you TODAY how the glass packaging market will develop in the next 10 years, and in line with the variations in COVID-19 economic recession and bounce. This market is more critical now than at any point over the last 10 years.
The report delivers exclusive COVID-19 variations and economic data specific to your market.
To access the data contained in this document please email contactus@visiongain.com
Forecasts to 2032 and other analyses reveal commercial prospects
• In addition to revenue forecasting to 2032, our new study provides you with recent results, growth rates, and market shares.
• You will find original analyses, with business outlooks and developments.
• Discover qualitative analyses (including market dynamics, drivers, opportunities, restraints and challenges), cost structure, impact of rising glass packaging prices and recent developments.
This report includes data analysis and invaluable insight into how COVID-19 will affect the industry and your company. Four COVID-19 recovery patterns and their impact, namely, “V”, “L”, “W” and “U” are discussed in this report.
Segments Covered in the Report
Market Segment by Type
• Silica Glass
• Lime Glass
• Pyrex Glass
• Other Glass Type
Market Segment by Product Type
• Glass Bottles
• Glass Jars
• Glass Flacons
• Tubular Glass Vials
• Other Product Type
Market Segment by Application
• Alcoholic Beverage Packaging
• Non-Alcoholic Beverage Packaging
• Food Packaging
• Pharmaceutical Packaging
• Personal Care Product Packaging
• Other Applications

In addition to the revenue predictions for the overall world market and segments, you will also find revenue forecasts for four regional and 20 leading national markets:
North America
• U.S.
• Canada
Europe
• Germany
• Spain
• United Kingdom
• France
• Italy
• Rest of Europe
Asia Pacific
• China
• Japan
• India
• Australia
• South Korea
• Rest of Asia Pacific
South America
• Brazil
• Mexico
• Rest of South America
Middle East & Africa
• South Africa
• Saudi Arabia
• Turkey
• Rest of MEA
Need industry data? Please contact us today.
The report also includes profiles and for some of the leading companies in the Glass Packaging Market, 2022 to 2032, with a focus on this segment of these companies’ operations.
Leading companies and the potential for market growth
• Amcor Limited
• Acme Vial and Glass Company, LLC
• Ardagh Packaging Holdings Limited
• Beatson Clark Ltd
• Becton, Dickinson and Company
• Bormioli Rocco SPA
• DWK Life Sciences GmbH
• Gerresheimer AG
• Hindusthan National Glass & Industries Limited
• Nipro Corporation
• O. Berk Company, LLC
• Owens-Illinois, Inc.
• Piramal Glass Limited
• Saint Gobain S.A.
• Schott
• Stevanato Group
• Vetropack Holding AG
• Vidrala S.A.
• Vitro Packaging, LLC.
• West Pharmaceutical Services, Inc
Overall world revenue for Glass Packaging Market, 2022 to 2032 in terms of value the market will surpass US$63,351 million in 2022, our work calculates. We predict strong revenue growth through to 2032. Our work identifies which organizations hold the greatest potential. Discover their capabilities, progress, and commercial prospects, helping you stay ahead.
How will the Glass Packaging Market, 2022 to 2032 report help you?
In summary, our 270+ page report provides you with the following knowledge:
• Revenue forecasts to 2032 for Glass Packaging Market, 2022 to 2032 Market, with forecasts for type, product type, application and company size, each forecast at a global and regional level – discover the industry’s prospects, finding the most lucrative places for investments and revenues.
• Revenue forecasts to 2032 for four regional and 20 key national markets – See forecasts for the Glass Packaging Market, 2022 to 2032 market in North America, Europe, Asia-Pacific and LAMEA. Also forecasted is the market in the US, Canada, Mexico, Brazil, Germany, France, UK, Italy, China, India, Japan, and Australia among other prominent economies.
• Prospects for established firms and those seeking to enter the market – including company profiles for 20 of the major companies involved in the Glass Packaging Market, 2022 to 2032.
Find quantitative and qualitative analyses with independent predictions. Receive information that only our report contains, staying informed with invaluable business intelligence.
Information found nowhere else
With our new report, you are less likely to fall behind in knowledge or miss out on opportunities. See how our work could benefit your research, analyses, and decisions. Visiongain’s study is for everybody needing commercial analyses for the Glass Packaging Market, 2022 to 2032, market-leading companies. You will find data, trends and predictions.
To access the data contained in this document please email contactus@visiongain.com
Buy our report today Glass Packaging Market Report 2022-2032: Forecasts by Type (Silica Glass, Pyrex Glass, Lime Glass), by Product Type (Glass Bottles, Glass Jars, Glass Flacons, Tubular Glass Vials), by Application (Alcoholic Beverage Packaging, Non-Alcoholic Beverage Packaging, Food Packaging, Pharmaceutical Packaging, Personal Care Product Packaging) AND Regional and Leading National Market Analysis PLUS Analysis of Leading Companies AND COVID-19 Impact and Recovery Pattern Analysis. Avoid missing out by staying informed – order our report now.
Visiongain is a trading partner with the US Federal Government
CCR Ref number: KD4R6
Do you have any custom requirements we can help you with? Any need for a specific country, geo region, market segment or specific company information? Contact us today, we can discuss your needs and see how we can help: contactus@visiongain.com
1. Report Overview
1.1 Objectives of the Study
1.2 Introduction to Glass Packaging Market
1.3 What This Report Delivers
1.4 Why You Should Read This Report
1.5 Key Questions Answered By This Analytical Report Include:
1.6 Who is This Report For?
1.7 Methodology
1.7.1 Market Definitions
1.7.2 Market Evaluation & Forecasting Methodology
1.7.3 Data Validation
1.8 Frequently Asked Questions (FAQs)
1.9 Associated Visiongain Reports
1.10 About Visiongain
2 Executive Summary
3 Market Overview
3.1 Techniques of Producing Glass Containers
3.1.1 Blown Glass Forming Processes
3.1.2 Tubular Glass Forming Processes
3.2 Recycling glass
3.3 Market Dynamics
3.3.1 Market Driving Factors
3.3.2 Market Restraining Factors
3.3.3 Market Opportunities
3.4 COVID-19 Impact Analysis
3.4.1 COVID-19 Impact on Glass Recycling
3.5 Porter’s Five Forces Analysis
3.5.1 Supplier Power
3.5.2 Buyer Power
3.5.3 Industry Rivalry
3.5.4 Threat from Substitutes
3.5.5 Threat of New Entrants
3.6 PESTLE Analysis
4 Global Glass Packaging Market Analysis by Segment
4.1 Key Findings
4.2 Type
4.2.1 Global Glass Packaging Market Forecast by Type
4.2.2 Global Silica Glass Packaging Market Forecast
4.2.3 Global Lime Glass Packaging Market Forecast
4.2.4 Global Pyrex Glass Packaging Market Forecast
4.2.5 Global Other Glass Packaging Market Forecast
4.3 Product Type
4.3.1 Global Glass Packaging Market Size Estimation and Forecast by Product Type
4.3.2 Global Glass Bottles Packaging Market Forecast
4.3.3 Global Glass Jars Packaging Market Forecast
4.3.4 Global Glass Flacons Packaging Market Forecast
4.3.5 Global Tubular Glass Vials Packaging Market Forecast
4.3.6 Global Other Product Type Packaging Market Forecast
4.4 Application
4.4.1 Global Glass Packaging Market Size Estimation and Forecast by Application
4.4.2 Global Alcoholic Beverage Packaging Market Forecast
4.4.3 Global Non-Alcoholic Beverage Packaging Market Forecast
4.4.4 Global Food Packaging Market Forecast
4.4.5 Global Pharmaceutical Packaging Market Forecast
4.4.6 Global Personal Care Product Packaging Marketing Forecast
4.4.7 Global Other Applications Packaging Market Forecast
5 Global Glass Packaging Market Analysis by Region
5.1 Key Findings
5.2 Regional Market Size Estimation and Forecast
5.3 COVID-19 Impact Analysis: Recovery Scenarios (V, U, W, L)
6 North America Glass Packaging Market Analysis
6.1 Key Findings
6.1.1 The Demand for Glass Packaging in North America is Steady
6.1.2 For its Ardagh Glass Bottles, Kansas City Bier has a Recycling Arrangement
6.2 North America Glass Packaging Market Size Estimation and Forecast
6.3 North America Glass Packaging Market Size Estimation and Forecast by Country
6.4 North America Glass Packaging Market Size Estimation and Forecast by Type
6.5 North America Glass Packaging Market Size Estimation and Forecast by Product Type
6.6 North America Glass Packaging Market Size Estimation and Forecast by Application
6.7 U.S.
6.7.1 Coca Cola is Boosting the Use of Refillable and Returnable Glass Bottles
6.7.2 AGP Produces Extremely Embellished Wine Bottle for Constellation Brands, Inc.
6.8 Canada
6.8.1 Canada Supports the Project of a Bottle Manufacturer
6.8.2 Recycle BC Urged People that Glass Bottles should be Kept at Home
7 Europe Glass Packaging Market Analysis
7.1 Key Findings
7.1.1 Europe Glass Industry Outlook
7.1.2 MAGMA, O-I's Cutting-Edge Glass Container Manufacturing Technology, is Set to Go
7.2 Europe Glass Packaging Market Size Estimation and Forecast
7.3 Europe Glass Packaging Market Size Estimation and Forecast by Country
7.4 Europe Glass Packaging Market Size Estimation and Forecast by Type
7.5 Europe Glass Packaging Market Size Estimation and Forecast by Product Type
7.6 Europe Glass Packaging Market Size Estimation and Forecast by Application
7.7 Germany
7.7.1 Wiegand-Glas Joins Forces to Create a "Greener" Glass Bottle
7.7.2 In Germany, a Research Study on Hydrogen Glass Melting Approved
7.8 UK
7.8.1 UK Glass Industry Outlook
7.8.2 Carlsberg and Encirc have Teamed Up to Test a Low-Carbon Glass Bottle
7.9 France
7.9.1 With the Takeover of Verrerie Du Comtat, Berlin Packaging Expands Rapidly in France
7.9.2 In France, Coca-Cola Europacific Partners Extends the Use of Returnable Glass Bottles in Hotels, Restaurants, and Cafes
7.10 Italy
7.10.1 Bormioli Luigi Introduces an Environment Friendly Lacquering Technique for Glass Flacons
7.10.2 Baralan Launches the Marina Collection of Glass Bottles for Cosmetics and Skincare
7.11 Spain
7.11.1 Berlin Packaging has Bought a Glass Packaging Company in Spain
7.12 Rest of Europe
7.12.1 For Businesses and Retailers, the New Packaging Mark Acts as a Visual Aid
7.12.2 Vetropack Acquires Glassworks in Moldova
7.12.3 The Netherlands is Increasing the Amount of Recycled Glass
8 Asia-Pacific Glass Packaging Market Analysis
8.1 Key Findings
8.2 Asia-Pacific Glass Packaging Market Size Estimation and Forecast
8.3 Asia-Pacific Glass Packaging Market Size Estimation and Forecast by Country
8.4 Asia-Pacific Glass Packaging Market Size Estimation and Forecast by Type
8.5 Asia-Pacific Glass Packaging Market Size Estimation and Forecast by Product Type
8.6 Asia-Pacific Glass Packaging Market Size Estimation and Forecast by Application
8.7 China
8.7.1 China Glass Bottle Market Outlook
8.8 India
8.9 In India, Gerresheimer is Increasing its Glass and Plastic Production Capacity
8.9.1 Consolidated Efforts by the Indian Beauty Industry to Reduce Packaging Waste
8.10 Japan
8.10.1 A Japanese Building Composed Entirely of 700 Donated Windows is Known as a "Zero Waste" Structure
8.10.2 To Help Minimise Plastic Waste, Coca-Cola Japan is Trying 'Fill Your Own Bottle' Water Stations
8.11 South Korea
8.11.1 Pacifiglas, a South Korean Company, has been Purchased by Verescence
8.11.2 South Korea has Banned the Use of Hard-To-Recycle Plastics in Food and Beverage Containers
8.12 Australia
8.13 Titomic Manufactures a Cold Spray Glass Mould Repair Technique that is Automated
8.13.1 Visy Plans to Build a $500 Million Glass Production and Recycling Factory in Australia
8.14 Rest of Asia-Pacific
8.14.1 BGC Anticipates a Rise in Packaging Demand
8.14.2 By 2022, Coca-Cola Philippines Will Phase Out Non-Recyclable Sachets
8.14.3 To Decrease Waste, a Malaysian Brewery Collects Empty Bottles
9 Middle East & Africa Glass Packaging Market Analysis
9.1 Key Findings
9.2 Coca-Cola is Working to Reach its Goal of Making 25% of its Beverage Container Reusable or Returnable
9.3 Middle East & Africa Glass Packaging Market Size Estimation and Forecast
9.4 Middle East & Africa Glass Packaging Market Size Estimation and Forecast by Country
9.5 Middle East & Africa Glass Packaging Market Size Estimation and Forecast by Type
9.6 Middle East & Africa Glass Packaging Market Size Estimation and Forecast by Product Type
9.7 Middle East & Africa Glass Packaging Market Size Estimation and Forecast by Application
9.8 South Africa
9.8.1 Ardagh has Acquired a South African Glass Packaging Company-Consol for $1 Billion
9.8.2 The Glass Sector in South Africa is Attempting to Improve its Circular Economy Performance
9.9 Saudi Arabia
9.9.1 The Construction of a Soda Ash Facility in Saudi Arabia has Begun
9.10 Turkey
9.10.1 Sisecam Invests in Glass Packaging in Eskisehir
9.10.2 Ciner Glass Announced a US$ 85 Million Agreement for a Third Furnace at its Park Cam Plant in Turkey
9.11 Rest of Middle East & Africa
9.11.1 UAE is Taking Initiatives to Promote More Sustainable Packaging
9.11.2 Coca-Cola HBC Purchases a Majority Stake in the Egyptian Coca-Cola Bottling Company
10 South America Glass Packaging Market Analysis
10.1 Key Findings
10.2 South America Glass Packaging Market Size Estimation and Forecast
10.3 South America Glass Packaging Market Size Estimation and Forecast by Country
10.4 South America Glass Packaging Market Size Estimation and Forecast by Type
10.5 South America Glass Packaging Market Size Estimation and Forecast by Product Type
10.6 South America Glass Packaging Market Size Estimation and Forecast by Application
10.7 Brazil
10.7.1 Ardagh is Constructing a Glass Manufacturing Facility in Minas Gerais, Brazil
10.7.2 A Glass Recycling Start-Up Generates New Practices in So Paulo with the Help of O-I Glass
10.8 Mexico
10.8.1 Vitro has Made an Investment in a New Glass Containers Furnace
10.8.2 In Mexico, Direct Pack Develops a Packaging Production Facility
10.9 Rest of South America
10.9.1 Vidrios Riojanos will Build a Glass Production Factory in Argentina
10.9.2 Tecnoglass Intends to Invest $160 Million in Float Glass Factory in Colombia
11 Company Profiles
11.1 Amcor Limited
11.1.1 Company Snapshot
11.1.2 Company Overview
11.1.3 Financial Analysis
11.1.4 Product Benchmarking
11.1.5 Strategic Outlook
11.2 Owens-Illinois, Inc.
11.2.1 Company Snapshot
11.2.2 Company Overview
11.2.3 Financial Analysis
11.2.4 Product Benchmarking
11.2.5 Strategic Outlook
11.3 Saint Gobain S.A.
11.3.1 Company Snapshot
11.3.2 Company Overview
11.3.3 Financial Analysis
11.3.4 Product Benchmarking
11.3.5 Strategic Outlook
11.4 Vitro Packaging, LLC.
11.4.1 Company Snapshot
11.4.2 Company Overview
11.4.3 Product Benchmarking
11.4.4 Strategic Outlook
11.5 Hindusthan National Glass & Industries Limited
11.5.1 Company Snapshot
11.5.2 Company Overview
11.5.3 Financial Analysis
11.5.4 Product Benchmarking
11.6 Gerresheimer AG
11.6.1 Company Snapshot
11.6.2 Company Overview
11.6.3 Financial Analysis
11.6.4 Product Benchmarking
11.6.5 Strategic Outlook
11.7 Bormioli Rocco SPA
11.7.1 Company Snapshot
11.7.2 Company Overview
11.7.3 Product Benchmarking
11.7.4 Strategic Outlook
11.8 Ardagh Packaging Holdings Limited KKK
11.8.1 Company Snapshot
11.8.2 Company Overview
11.8.3 Product Benchmarking
11.8.4 Strategic Outlook
11.9 Vetropack Holding AG
11.9.1 Company Snapshot
11.9.2 Company Overview
11.9.3 Product Benchmark
11.9.4 Strategic Outlook
11.10 Vidrala S.A.
11.10.1 Company Snapshot
11.10.2 Company Overview
11.10.3 Product Benchmarking
11.10.4 Strategic Outlook
11.11 Schott
11.11.1 Company Snapshot
11.11.2 Company Overview
11.11.3 Product Benchmarking
11.11.4 Strategic Outlook
11.12 Becton, Dickinson and Company
11.12.1 Company Snapshot
11.12.2 Company Overview
11.12.3 Financial Analysis
11.12.4 Product Benchmarking
11.12.5 Strategic Outlook
11.13 Nipro Corporation.
11.13.1 Company Snapshot
11.13.2 Company Overview
11.13.3 Product Benchmarking
11.13.4 Strategic Outlook
11.14 West Pharmaceutical Services, Inc.
11.14.1 Company Snapshot
11.14.2 Company Overview
11.14.3 Financial Analysis
11.14.4 Product Benchmarking
11.14.5 Strategic Outlook
11.15 Stevanato Group
11.15.1 Company Snapshot
11.15.2 Company Overview
11.15.3 Product Benchmarking
11.15.4 Strategic Outlook
11.16 O. Berk Company, LLC
11.16.1 Company Snapshot
11.16.2 Company Overview
11.16.3 Product Benchmarking
11.16.4 Strategic Outlook
11.17 DWK Life Sciences GmbH
11.17.1 Company Snapshot
11.17.2 Company Overview
11.17.3 Product Benchmarking
11.17.4 Strategic Outlook
11.18 Beatson Clark Ltd.
11.18.1 Company Snapshot
11.18.2 Company Overview
11.18.3 Product Benchmarking
11.18.4 Strategic Outlook
11.19 Piramal Glass Limited
11.19.1 Company Snapshot
11.19.2 Company Overview
11.19.3 Product Benchmarking
11.19.4 Strategic Outlook
11.20 Acme Vial and Glass Company, LLC
11.20.1 Company Snapshot
11.20.2 Company Overview
11.20.3 Financial Analysis
11.20.4 Product Benchmarking
12 Conclusion and Recommendations
12.1 Conclusion
12.2 Recommendations
13 Glossary
List of Tables
Table 1 Global Glass Packaging Market Forecast, 2022-2032 (USD Mn, AGR (%), CAGR(%))
Table 2 Global Glass Packaging Market Snapshot, 2022 & 2032 (US$ million, CAGR %)
Table 3 Global Glass Packaging Market Forecast, 2022-2032 (USD Mn, AGR (%), CAGR(%)) (V-Shaped Recovery Scenario)
Table 4 Global Glass Packaging Market Forecast, 2022-2032 (USD Mn, AGR (%), CAGR(%)) (U-Shaped Recovery Scenario)
Table 5 Global Glass Packaging Market Forecast, 2022-2032 (USD Mn, AGR (%), CAGR(%)) (W-Shaped Recovery Scenario)
Table 6 Global Glass Packaging Market Forecast, 2022-2032 (USD Mn, AGR (%), CAGR(%)) (L-Shaped Recovery Scenario)
Table 7 Global Glass Packaging Market: PESTLE Analysis
Table 8 Global Glass Packaging Market by Type, 2022-2032 (USD Mn, AGR (%), CAGR(%))
Table 9 Global Silica Glass Market Forecast, 2022-2032 (USD Mn, AGR (%), CAGR(%))
Table 10 Global Silica Glass Market by Region, 2022-2032 (USD Mn, AGR (%), CAGR(%))
Table 11 Global Lime Glass Market Forecast, 2022-2032 (USD Mn, AGR (%), CAGR(%))
Table 12 Global Lime Glass Market by Region, 2022-2032 (USD Mn, AGR (%), CAGR(%))
Table 13 Global Pyrex Glass Market Forecast, 2022-2032 (USD Mn, AGR (%), CAGR(%))
Table 14 Global Pyrex Glass Market by Region, 2022-2032 (USD Mn, AGR (%), CAGR(%))
Table 15 Global Other Glass Type Market Forecast, 2022-2032 (USD Mn, AGR (%), CAGR(%))
Table 16 Global Other Glass Type Market by Region, 2022-2032 (USD Mn, AGR (%), CAGR(%))
Table 17 Global Glass Packaging Market by Product Type, 2022-2032 (USD Mn, AGR (%), CAGR(%))
Table 18 Global Glass Bottles Market Forecast, 2022-2032 (USD Mn, AGR (%), CAGR(%))
Table 19 Global Glass Bottles Market by Region, 2022-2032 (USD Mn, AGR (%), CAGR(%))
Table 20 Global Glass Jars Market Forecast, 2022-2032 (USD Mn, AGR (%), CAGR(%))
Table 21 Global Glass Jars Market by Region, 2022-2032 (USD Mn, AGR (%), CAGR(%))
Table 22 Global Glass Flacons Market Forecast, 2022-2032 (USD Mn, AGR (%), CAGR(%))
Table 23 Global Glass Flacons Market by Region, 2022-2032 (USD Mn, AGR (%), CAGR(%))
Table 24 Global Tubular Glass Vials Market Forecast, 2022-2032 (USD Mn, AGR (%), CAGR(%))
Table 25 Global Tubular Glass Vials Market by Region, 2022-2032 (USD Mn, AGR (%), CAGR(%))
Table 26 Global Other Product Type Market Forecast, 2022-2032 (USD Mn, AGR (%), CAGR(%))
Table 27 Global Other Product Type Market by Region, 2022-2032 (USD Mn, AGR (%), CAGR(%))
Table 28 Global Glass Packaging Market by Application, 2022-2032 (USD Mn, AGR (%), CAGR(%))
Table 29 Global Alcoholic Beverage Packaging Market Forecast, 2022-2032 (USD Mn, AGR (%), CAGR(%))
Table 30 Global Alcoholic Beverage Packaging Market by Region, 2022-2032 (USD Mn, AGR (%), CAGR(%))
Table 31 Global Non-Alcoholic Beverage Packaging Market Forecast, 2022-2032 (USD Mn, AGR (%), CAGR(%))
Table 32 Global Non-Alcoholic Beverage Packaging Market by Region, 2022-2032 (USD Mn, AGR (%), CAGR(%))
Table 33 Global Food Packaging Market Forecast, 2022-2032 (USD Mn, AGR (%), CAGR(%))
Table 34 Global Food Packaging Market by Region, 2022-2032 (USD Mn, AGR (%), CAGR(%))
Table 35 Global Pharmaceutical Packaging Market Forecast, 2022-2032 (USD Mn, AGR (%), CAGR(%))
Table 36 Global Pharmaceutical Packaging Market by Region, 2022-2032 (USD Mn, AGR (%), CAGR(%))
Table 37 Global Personal Care Product Packaging Market Forecast, 2022-2032 (USD Mn, AGR (%), CAGR(%))
Table 38 Global Personal Care Product Packaging Market by Region, 2022-2032 (USD Mn, AGR (%), CAGR(%))
Table 39 Global Other Application Market Forecast, 2022-2032 (USD Mn, AGR (%), CAGR(%))
Table 40 Global Other Application Market by Region, 2022-2032 (USD Mn, AGR (%), CAGR(%))
Table 41 Global Glass Packaging Market by Region, 2022-2032 (USD Mn, AGR (%), CAGR(%))
Table 42 Global Glass Packaging Market by Region, 2022-2032 (USD Mn, AGR (%), CAGR(%)) (V-Shaped Recovery Scenario)
Table 43 Global Glass Packaging Market by Region, 2022-2032 (USD Mn, AGR (%), CAGR(%)) (W-Shaped Recovery Scenario)
Table 44 Global Glass Packaging Market by Region, 2022-2032 (USD Mn, AGR (%), CAGR(%)) (U-Shaped Recovery Scenario)
Table 45 Global Glass Packaging Market by Region, 2022-2032 (USD Mn, AGR (%), CAGR(%)) (L-Shaped Recovery Scenario)
Table 46 North America Glass Packaging Market by Value, 2022-2032 (USD Mn, AGR (%), CAGR(%))
Table 47 North America Glass Packaging Market by Country, 2022-2032 (USD Mn, AGR (%), CAGR(%))
Table 48 North America Glass Packaging Market by Type, 2022-2032 (USD Mn, AGR (%), CAGR(%))
Table 49 North America Glass Packaging Market by Product Type, 2022-2032 (USD Mn, AGR (%), CAGR(%))
Table 50 North America Glass Packaging Market by Application, 2022-2032 (USD Mn, AGR (%), CAGR(%))
Table 51 US Glass Packaging Market by Value, 2022-2032 (USD Mn, AGR (%), CAGR(%))
Table 52 Canada Glass Packaging Market by Value, 2022-2032 (USD Mn, AGR (%), CAGR(%))
Table 53 Europe Glass Packaging Market by Value, 2022-2032 (USD Mn, AGR (%), CAGR(%))
Table 54 Europe Glass Packaging Market by Country, 2022-2032 (USD Mn, AGR (%), CAGR(%))
Table 55 Europe Glass Packaging Market by Type, 2022-2032 (USD Mn, AGR (%), CAGR(%))
Table 56 Europe Glass Packaging Market by Product Type, 2022-2032 (USD Mn, AGR (%), CAGR(%))
Table 57 Europe Glass Packaging Market by Application, 2022-2032 (USD Mn, AGR (%), CAGR(%))
Table 58 Germany Glass Packaging Market by Value, 2022-2032 (USD Mn, AGR (%), CAGR(%))
Table 59 UK Glass Packaging Market by Value, 2022-2032 (USD Mn, AGR (%), CAGR(%))
Table 60 France Glass Packaging Market by Value, 2022-2032 (USD Mn, AGR (%), CAGR(%))
Table 61 Italy Glass Packaging Market by Value, 2022-2032 (USD Mn, AGR (%), CAGR(%))
Table 62 Spain Glass Packaging Market by Value, 2022-2032 (USD Mn, AGR (%), CAGR(%))
Table 63 Rest of Europe Glass Packaging Market by Value, 2022-2032 (USD Mn, AGR (%), CAGR(%))
Table 64 Asia-Pacific Glass Packaging Market by Value, 2022-2032 (USD Mn, AGR (%), CAGR(%))
Table 65 Asia-Pacific Glass Packaging Market by Country, 2022-2032 (USD Mn, AGR (%), CAGR(%))
Table 66 Asia-Pacific Glass Packaging Market by Type, 2022-2032 (USD Mn, AGR (%), CAGR(%))
Table 67 Asia-Pacific Glass Packaging Market by Product Type, 2022-2032 (USD Mn, AGR (%), CAGR(%))
Table 68 Asia-Pacific Glass Packaging Market by Application, 2022-2032 (USD Mn, AGR (%), CAGR(%))
Table 69 China Glass Packaging Market by Value, 2022-2032 (USD Mn, AGR (%), CAGR(%))
Table 70 India Glass Packaging Market by Value, 2022-2032 (USD Mn, AGR (%), CAGR(%))
Table 71 Japan Glass Packaging Market by Value, 2022-2032 (USD Mn, AGR (%), CAGR(%))
Table 72 South Korea Glass Packaging Market by Value, 2022-2032 (USD Mn, AGR (%), CAGR(%))
Table 73 Australia Glass Packaging Market by Value, 2022-2032 (USD Mn, AGR (%), CAGR(%))
Table 74 Rest of Asia-Pacific Glass Packaging Market by Value, 2022-2032 (USD Mn, AGR (%), CAGR(%))
Table 75 Middle East & Africa Glass Packaging Market by Value, 2022-2032 (USD Mn, AGR (%), CAGR(%))
Table 76 Middle East & Africa Glass Packaging Market by Country, 2022-2032 (USD Mn, AGR (%), CAGR(%))
Table 77 Middle East & Africa Glass Packaging Market by Type, 2022-2032 (USD Mn, AGR (%), CAGR(%))
Table 78 Middle East & Africa Glass Packaging Market by Product Type, 2022-2032 (USD Mn, AGR (%), CAGR(%))
Table 79 Middle East & Africa Glass Packaging Market by Application, 2022-2032 (USD Mn, AGR (%), CAGR(%))
Table 80 South Africa Glass Packaging Market by Value, 2022-2032 (USD Mn, AGR (%), CAGR(%))
Table 81 Saudi Arabia Glass Packaging Market by Value, 2022-2032 (USD Mn, AGR (%), CAGR(%))
Table 82 Turkey Glass Packaging Market by Value, 2022-2032 (USD Mn, AGR (%), CAGR(%))
Table 83 Rest of Middle East & Africa Glass Packaging Market by Value, 2022-2032 (USD Mn, AGR (%), CAGR(%))
Table 84 South America Glass Packaging Market by Value, 2022-2032 (USD Mn, AGR (%), CAGR(%))
Table 85 South America Glass Packaging Market by Country, 2022-2032 (USD Mn, AGR (%), CAGR(%))
Table 86 South America Glass Packaging Market by Type, 2022-2032 (USD Mn, AGR (%), CAGR(%))
Table 87 South America Glass Packaging Market by Product Type, 2022-2032 (USD Mn, AGR (%), CAGR(%))
Table 88 South America Glass Packaging Market by Application, 2022-2032 (USD Mn, AGR (%), CAGR(%))
Table 89 Brazil Glass Packaging Market by Value, 2022-2032 (USD Mn, AGR (%), CAGR(%))
Table 90 Mexico Glass Packaging Market by Value, 2022-2032 (USD Mn, AGR (%), CAGR(%))
Table 91 Rest of South America Glass Packaging Market by Value, 2022-2032 (USD Mn, AGR (%), CAGR(%))
Table 92 Amcor Limited: Key Details, (CEO, HQ, Revenue, Founded, No. of Employees, Company Type, Website, Business Segment)
Table 93 Amcor Limited: Product Benchmarking
Table 94 Amcor Limited: Strategic Outlook
Table 95 Owens-Illinois, Inc: Key Details, (CEO, HQ, Revenue, Founded, No. of Employees, Company Type, Website, Business Segment)
Table 96 Owens-Illinois, Inc: Product Benchmarking
Table 97 Owens-Illinois, Inc: Strategic Outlook
Table 98 Saint Gobain S.A.: Key Details, (CEO, HQ, Revenue, Founded, No. of Employees, Company Type, Website, Business Segment)
Table 99 Saint Gobain S.A.: Product Benchmarking
Table 100 Saint Gobain S.A.: Strategic Outlook
Table 101 Vitro Packaging, LLC.: Key Details, (CEO, HQ, Revenue, Founded, No. of Employees, Company Type, Website, Business Segment)
Table 102 Vitro Packaging, LLC.: Product Benchmarking
Table 103 Vitro Packaging, LLC.: Strategic Outlook
Table 104 Hindusthan National Glass & Industries Limited: Key Details, (CEO, HQ, Revenue, Founded, No. of Employees, Company Type, Website, Business Segment)
Table 105 Hindusthan National Glass & Industries Limited: Product Benchmarking
Table 106 Gerresheimer AG: Key Details, (CEO, HQ, Revenue, Founded, No. of Employees, Company Type, Website, Business Segment)
Table 107 Gerresheimer AG: Product Benchmarking
Table 108 Gerresheimer AG: Strategic Outlook
Table 109 Bormioli Rocco SPA: Key Details, (CEO, HQ, Revenue, Founded, No. of Employees, Company Type, Website, Business Segment)
Table 110 Bormioli Rocco SPA: Product Benchmarking
Table 111 Bormioli Rocco SPA: Strategic Outlook
Table 112 Ardagh Packaging Holdings Limited: Key Details, (CEO, HQ, Revenue, Founded, No. of Employees, Company Type, Website, Business Segment)
Table 113 Ardagh Packaging Holdings Limited: Product Benchmarking
Table 114 Ardagh Packaging Holdings Limited: Strategic Outlook
Table 115 Vetropack Holding AG: Key Details, (CEO, HQ, Revenue, Founded, No. of Employees, Company Type, Website, Business Segment)
Table 116 Vetropack Holding AG: Product Benchmarking
Table 117 Vetropack Holding AG: Strategic Outlook
Table 118 Vidrala S.A.: Key Details, (CEO, HQ, Revenue, Founded, No. of Employees, Company Type, Website, Business Segment)
Table 119 Vidrala S.A.: Product Benchmarking
Table 120 Vidrala S.A.: Strategic Outlook
Table 121 Schott: Key Details, (CEO, HQ, Revenue, Founded, No. of Employees, Company Type, Website, Business Segment)
Table 122 Schott: Product Benchmarking
Table 123 Schott: Strategic Outlook
Table 124 Becton, Dickinson and Company: Key Details, (CEO, HQ, Revenue, Founded, No. of Employees, Company Type, Website, Business Segment)
Table 125 Becton, Dickinson and Company: Product Benchmarking
Table 126 Becton, Dickinson and Company: Strategic Outlook
Table 127 Nipro Corporation.: Key Details, (CEO, HQ, Revenue, Founded, No. of Employees, Company Type, Website, Business Segment)
Table 128 Nipro Corporation.: Product Benchmarking
Table 129 Nipro Corporation Strategic Outlook
Table 130 West Pharmaceutical Services, Inc: Key Details, (CEO, HQ, Revenue, Founded, No. of Employees, Company Type, Website, Business Segment)
Table 131 West Pharmaceutical Services, Inc: Product Benchmarking
Table 132 West Pharmaceutical Services, Inc: Strategic Outlook
Table 133 Stevanato Group: Key Details, (CEO, HQ, Revenue, Founded, No. of Employees, Company Type, Website, Business Segment)
Table 134 Stevanato Group: Product Benchmarking
Table 135 Stevanato Group: Strategic Outlook
Table 136 O Berk Company LLC: Key Details, (CEO, HQ, Revenue, Founded, No. of Employees, Company Type, Website, Business Segment)
Table 137 O Berk Company LLC: Product Benchmarking
Table 138 O Berk Company LLC: Strategic Outlook
Table 139 DWK Life Sciences GmbH : Key Details, (CEO, HQ, Revenue, Founded, No. of Employees, Company Type, Website, Business Segment)
Table 140 DWK Life Sciences GmbH : Product Benchmarking
Table 141 DWK Life Sciences GmbH : Strategic Outlook
Table 142 Beatson Clark Ltd: Key Details, (CEO, HQ, Revenue, Founded, No. of Employees, Company Type, Website, Business Segment)
Table 143 Beatson Clark Ltd: Product Benchmarking
Table 144 Beatson Clark Ltd: Strategic Outlook
Table 145 Piramal Glass Limited: Key Details, (CEO, HQ, Revenue, Founded, No. of Employees, Company Type, Website, Business Segment)
Table 146 Piramal Glass Limited: Product Benchmarking
Table 147 Piramal Glass Limited: Strategic Outlook
Table 148 Acme Vial and Glass Company, LLC: Key Details, (CEO, HQ, Revenue, Founded, No. of Employees, Company Type, Website, Business Segment)
Table 149 Acme Vial and Glass Company, LLC: Product Benchmarking
List of Figures
Figure 1 Global Glass Packaging Market Forecast, 2022-2032 (USD Mn, AGR (%))
Figure 2 Global Glass Packaging Market Segmentation
Figure 3 Breakdown of Primary Interviews: By Company Type, Designation, & Region
Figure 4 Blow & Blow Process
Figure 5 Danner Process
Figure 6 Global Glass Packaging Market: Market Dynamics
Figure 7 Global Glass Packaging Market Forecast, 2022-2032 (USD Mn, AGR (%)) (V-Shaped Recovery Scenario)
Figure 8 Global Glass Packaging Market Forecast, 2022-2032 (USD Mn, AGR (%)) (U-Shaped Recovery Scenario)
Figure 9 Global Glass Packaging Market Forecast, 2022-2032 (USD Mn, AGR (%))(W-Shaped Recovery Scenario)
Figure 10 Global Glass Packaging Market Forecast, 2022-2032 (USD Mn, AGR (%))(L-Shaped Recovery Scenario)
Figure 11 Global Glass Packaging Market: Porter’s Five Forces Analysis
Figure 12 Global Glass Packaging Market by Type, 2022-2032 (USD Mn, AGR (%))
Figure 13 Global Silica Glass Market Forecast, 2022-2032 (USD Mn, AGR (%))
Figure 14 Global Silica Glass Market by Region, 2022-2032 (USD Mn, AGR (%))
Figure 15 Global Lime Glass Market Forecast, 2022-2032 (USD Mn, AGR (%))
Figure 16 Global Lime Glass Market by Region, 2022-2032 (USD Mn, AGR (%))
Figure 17 Examples of Pyrex Glass
Figure 18 Global Pyrex Glass Market Forecast, 2022-2032 (USD Mn, AGR (%))
Figure 19 Global Pyrex Glass Market by Region, 2022-2032 (USD Mn, AGR (%))
Figure 20 Global Other Glass Type Market Forecast, 2022-2032 (USD Mn, AGR (%))
Figure 21 Global Other Glass Type Market by Region, 2022-2032 (USD Mn, AGR (%))
Figure 22 Global Glass Packaging Market by Product Type, 2022-2032 (USD Mn, AGR (%))
Figure 23 Global Glass Bottles Market Forecast, 2022-2032 (USD Mn, AGR (%))
Figure 24 Global Glass Bottles Market by Region, 2022-2032 (USD Mn, AGR (%))
Figure 25 Global Glass Jars Market Forecast, 2022-2032 (USD Mn, AGR (%))
Figure 26 Global Glass Jars Market by Region, 2022-2032 (USD Mn, AGR (%))
Figure 27 Global Glass Flacons Market Forecast, 2022-2032 (USD Mn, AGR (%))
Figure 28 Global Glass Flacons Market by Region, 2022-2032 (USD Mn, AGR (%))
Figure 29 Global Tubular Glass Vials Market Forecast, 2022-2032 (USD Mn, AGR (%))
Figure 30 Global Tubular Glass Vials Market by Region, 2022-2032 (USD Mn, AGR (%))
Figure 31 Global Other Product Type Market Forecast, 2022-2032 (USD Mn, AGR (%))
Figure 32 Global Other Product Type Market by Region, 2022-2032 (USD Mn, AGR (%))
Figure 33 Global Glass Packaging Market by Application, 2022-2032 (USD Mn, AGR (%))
Figure 34 Global Alcoholic Beverage Packaging Market Forecast, 2022-2032 (USD Mn, AGR (%))
Figure 35 Global Alcoholic Beverage Packaging Market by Region, 2022-2032 (USD Mn, AGR (%))
Figure 36 Global Non-Alcoholic Beverage Packaging Market Forecast, 2022-2032 (USD Mn, AGR (%))
Figure 37 Global Non-Alcoholic Beverage Packaging Market by Region, 2022-2032 (USD Mn, AGR (%))
Figure 38 Global Food Packaging Market Forecast, 2022-2032 (USD Mn, AGR (%))
Figure 39 Global Food Packaging Market by Region, 2022-2032 (USD Mn, AGR (%))
Figure 40 Global Pharmaceutical Packaging Market Forecast, 2022-2032 (USD Mn, AGR (%))
Figure 41 Global Pharmaceutical Packaging Market by Region, 2022-2032 (USD Mn, AGR (%))
Figure 42 Global Personal Care Product Packaging Market Forecast, 2022-2032 (USD Mn, AGR (%))
Figure 43 Global Personal Care Product Packaging Market by Region, 2022-2032 (USD Mn, AGR (%))
Figure 44 Global Other Application Market Forecast, 2022-2032 (USD Mn, AGR (%))
Figure 45 Global Other Application Market by Region, 2022-2032 (USD Mn, AGR (%))
Figure 46 Global Glass Packaging Market by Region, 2022-2032 (USD Mn, AGR (%))
Figure 47 Global Glass Packaging Market by Region, 2022-2032 (USD Mn, AGR (%)) (V-Shaped Recovery Scenario)
Figure 48 Global Glass Packaging Market by Region, 2022-2032 (USD Mn, AGR (%))(W-Shaped Recovery Scenario)
Figure 49 Global Glass Packaging Market by Region, 2022-2032 (USD Mn, AGR (%))(U-Shaped Recovery Scenario)
Figure 50 Global Glass Packaging Market by Region, 2022-2032 (USD Mn, AGR (%))(L-Shaped Recovery Scenario)
Figure 51 North America Glass Packaging Market by Value, 2022-2032 (USD Mn, AGR (%))
Figure 52 North America Glass Packaging Market by Country, 2022-2032 (USD Mn, AGR (%))
Figure 53 North America Glass Packaging Market by Type, 2022-2032 (USD Mn, AGR (%))
Figure 54 North America Glass Packaging Market by Product Type, 2022-2032 (USD Mn, AGR (%))
Figure 55 North America Glass Packaging Market by Application, 2022-2032 (USD Mn, AGR (%))
Figure 56 US Glass Packaging Market by Value, 2022-2032 (USD Mn, AGR (%))
Figure 57 Canada Glass Packaging Market by Value, 2022-2032 (USD Mn, AGR (%))
Figure 58 Europe Glass Packaging Market by Value, 2022-2032 (USD Mn, AGR (%))
Figure 59 Europe Glass Packaging Market by Country, 2022-2032 (USD Mn, AGR (%))
Figure 60 Europe Glass Packaging Market by Type, 2022-2032 (USD Mn, AGR (%))
Figure 61 Europe Glass Packaging Market by Product Type, 2022-2032 (USD Mn, AGR (%))
Figure 62 Europe Glass Packaging Market by Application, 2022-2032 (USD Mn, AGR (%))
Figure 63 Germany Glass Packaging Market by Value, 2022-2032 (USD Mn, AGR (%))
Figure 64 UK Glass Packaging Market by Value, 2022-2032 (USD Mn, AGR (%))
Figure 65 France Glass Packaging Market by Value, 2022-2032 (USD Mn, AGR (%))
Figure 66 Italy Glass Packaging Market by Value, 2022-2032 (USD Mn, AGR (%))
Figure 67 Spain Glass Packaging Market by Value, 2022-2032 (USD Mn, AGR (%))
Figure 68 Rest of Europe Glass Packaging Market by Value, 2022-2032 (USD Mn, AGR (%))
Figure 69 Asia-Pacific Glass Packaging Market by Value, 2022-2032 (USD Mn, AGR (%))
Figure 70 Asia-Pacific Glass Packaging Market by Country, 2022-2032 (USD Mn, AGR (%))
Figure 71 Asia-Pacific Glass Packaging Market by Type, 2022-2032 (USD Mn, AGR (%))
Figure 72 Asia-Pacific Glass Packaging Market by Product Type, 2022-2032 (USD Mn, AGR (%))
Figure 73 Asia-Pacific Glass Packaging Market by Application, 2022-2032 (USD Mn, AGR (%))
Figure 74 China Glass Packaging Market by Value, 2022-2032 (USD Mn, AGR (%))
Figure 75 India Glass Packaging Market by Value, 2022-2032 (USD Mn, AGR (%))
Figure 76 Japan Glass Packaging Market by Value, 2022-2032 (USD Mn, AGR (%))
Figure 77 South Korea Glass Packaging Market by Value, 2022-2032 (USD Mn, AGR (%))
Figure 78 Australia Glass Packaging Market by Value, 2022-2032 (USD Mn, AGR (%))
Figure 79 Rest of Asia-Pacific Glass Packaging Market by Value, 2022-2032 (USD Mn, AGR (%))
Figure 80 Middle East & Africa Glass Packaging Market by Value, 2022-2032 (USD Mn, AGR (%))
Figure 81 Middle East & Africa Glass Packaging Market by Country, 2022-2032 (USD Mn, AGR (%))
Figure 82 Middle East & Africa Glass Packaging Market by Type, 2022-2032 (USD Mn, AGR (%))
Figure 83 Middle East & Africa Glass Packaging Market by Product Type, 2022-2032 (USD Mn, AGR (%))
Figure 84 Middle East & Africa Glass Packaging Market by Application, 2022-2032 (USD Mn, AGR (%))
Figure 85 South Africa Glass Packaging Market by Value, 2022-2032 (USD Mn, AGR (%))
Figure 86 Saudi Arabia Glass Packaging Market by Value, 2022-2032 (USD Mn, AGR (%))
Figure 87 Turkey Glass Packaging Market by Value, 2022-2032 (USD Mn, AGR (%))
Figure 88 Rest of Middle East & Africa Glass Packaging Market by Value, 2022-2032 (USD Mn, AGR (%))
Figure 89 South America Glass Packaging Market by Value, 2022-2032 (USD Mn, AGR (%))
Figure 90 South America Glass Packaging Market by Country, 2022-2032 (USD Mn, AGR (%))
Figure 91 South America Glass Packaging Market by Type, 2022-2032 (USD Mn, AGR (%))
Figure 92 South America Glass Packaging Market by Product Type, 2022-2032 (USD Mn, AGR (%))
Figure 93 South America Glass Packaging Market by Application, 2022-2032 (USD Mn, AGR (%))
Figure 94 Brazil Glass Packaging Market by Value, 2022-2032 (USD Mn, AGR (%))
Figure 95 Mexico Glass Packaging Market by Value, 2022-2032 (USD Mn, AGR (%))
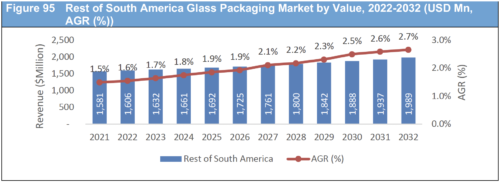
Figure 96 Rest of South America Glass Packaging Market by Value, 2022-2032 (USD Mn, AGR (%))
Figure 97 Amcor Limited: Net Revenue, 2017-2021 (US$ million, AGR%)
Figure 98 Amcor Limited: Gross Profit, 2017-2021 (US$ million, AGR%)
Figure 99 Amcor Limited: Net Profit 2017-2021 (US$ million, AGR%)
Figure 100 Amcor Limited: EBITDA, 2017-2021 (US$ million, AGR%)
Figure 101 Owens-Illinois, Inc: Net Revenue, 2017-2021 (US$ million, AGR%)
Figure 102 Owens-Illinois, Inc: Gross Profit, 2017-2021 (US$ million, AGR%)
Figure 103 Owens-Illinois, Inc: Net Profit 2017-2021 (US$ million, AGR%)
Figure 104 Owens-Illinois, Inc: EBITDA, 2017-2021 (US$ million, AGR%)
Figure 105 Saint Gobain S.A: Net Revenue, 2017-2021 (US$ million, AGR%)
Figure 106 Saint Gobain S.A: Gross Profit, 2017-2021 (US$ million, AGR%)
Figure 107 Saint Gobain S.A: Net Profit 2017-2021 (US$ million, AGR%)
Figure 108 Saint Gobain S.A: EBITDA, 2017-2021 (US$ million, AGR%)
Figure 109 Hindusthan National Glass & Industries Limited: Net Revenue, 2017-2021 (US$ million, AGR%)
Figure 110 Hindusthan National Glass & Industries Limited: Gross Profit, 2017-2021 (US$ million, AGR%)
Figure 111 Hindusthan National Glass & Industries Limited: Net Profit 2017-2021 (US$ million, AGR%)
Figure 112 Hindusthan National Glass & Industries Limited: EBITDA, 2017-2021 (US$ million, AGR%)
Figure 113 Gerresheimer AG: Net Revenue, 2017-2021 (US$ million, AGR%)
Figure 114 Gerresheimer AG: Gross Profit, 2017-2021 (US$ million, AGR%)
Figure 115 Gerresheimer AG: Net Profit 2017-2021 (US$ million, AGR%)
Figure 116 Gerresheimer AG: EBITDA, 2017-2021 (US$ million, AGR%)
Figure 117 Becton, Dickinson and Company: Net Revenue, 2017-2021 (US$ million, AGR%)
Figure 118 Becton, Dickinson and Company: Gross Profit, 2017-2021 (US$ million, AGR%)
Figure 119 Becton, Dickinson and Company: Net Profit 2017-2021 (US$ million, AGR%)
Figure 120 Becton, Dickinson and Company: EBITDA, 2017-2021 (US$ million, AGR%)
Figure 121 West Pharmaceutical Services, Inc: Net Revenue, 2017-2021 (US$ million, AGR%)
Figure 122 West Pharmaceutical Services, Inc: Gross Profit, 2017-2021 (US$ million, AGR%)
Figure 123 West Pharmaceutical Services, Inc: Net Profit 2017-2021 (US$ million, AGR%)
Figure 124 West Pharmaceutical Services, Inc: EBITDA, 2017-2021 (US$ million, AGR%)
Figure 125 Acme Vial and Glass Company, LLC: Net Revenue, 2017-2021 (US$ million, AGR%)
Figure 126 Acme Vial and Glass Company, LLC: Gross Profit, 2017-2021 (US$ million, AGR%)
Figure 127 Acme Vial and Glass Company, LLC: Net Profit 2017-2021 (US$ million, AGR%)
Figure 128 Acme Vial and Glass Company, LLC: EBITDA, 2017-2021 (US$ million, AGR%)
List of Companies Profiled in the report
Amcor Limited
Acme Vial and Glass Company, LLC
Ardagh Packaging Holdings Limited
Beatson Clark Ltd
Becton, Dickinson and Company
Bormioli Rocco SPA
DWK Life Sciences GmbH
Gerresheimer AG
Hindusthan National Glass & Industries Limited
Nipro Corporation
O. Berk Company, LLC
Owens-Illinois, Inc.
Piramal Glass Limited
Saint Gobain S.A.
Schott
Stevanato Group
Vetropack Holding AG
Vidrala S.A.
Vitro Packaging, LLC.
West Pharmaceutical Services, Inc
List of Other Companies Mentioned in the report
AB Container, Inc.
Abtec, Inc.
Advantech Plastics, LLC
AptarGroup Inc.
ARCHANA AMPOULES PVT.LTD.
Associated Bag
Autronic Plastics, Inc.
Ball Corporation
BASF SE
Bermar Associates, Inc.
Berry Global Inc.
Brambles Limited
Brambles Limited
Caplugs
CLASSIC CROWNS & CLOSURES
Classic Packaging Corp.
CPC (Colder Products Company)
Crow Holdings Inc.
CRYSTAL PLASTICS
Dash Packaging Inc.
DS Smith Plc (machines)
Enercon
Ferragamo Packaging
Illing Company
Illing Company, Inc.
Intertape Polymer Group Inc.
Leech Industries, Inc.
MEDIA MANOEUVRE
METAL CLOSURES PVT.LTD.
MJS Packaging
MJS Packaging
MOCAP LLC
Mold-Rite Plastics
Pacific Bridge Packaging, Inc.
PLASTIC EXPORT ZUNDERT(I) PVT.LTD.
Polymer Molding, Inc.
Poppelmann Plastics USA
RISHIRAJ INDUSTRIES
RUDA CONTAINERS
S.K.INDUSTRIES.
SAMIKSHA PACKAGING
SHREE SAMARTH POPLYPLAST INDUSTRY
Silgan Holdings Inc.
Smurfit Kappa Group PLC
Sonoco Product Co.
Tetra Laval
The Rodon Group
VARSA PLASTIC IND.PVT.LTD.
WestRock Company
WS Packaging Group, Inc.
List of Associations Mentioned in the Report
Association for Packaging and Processing Technologies
Association of Industrial Metallizers, Coaters and Laminators
Association of Visual Packaging Manufacturers
Contract Manufacturing and Packaging Association
Contract Packaging Associations
EPS Industry Alliance
Flexible Packaging Association
Foodservice & Packaging Institute
Glass Packaging Institute
Gravure Association of the Americas
Healthcare Compliance Packaging Council
Institute of Packaging Professionals
International Safe Transit Associations
Material Handling Industry of America
National Association of Container Distributors
National Institute of Packaging, Handling & Logistics Engineers
PAC Packaging Consortium
Packaging Associations of Canada
The Independent Packaging Association
World Packaging Organization