Industries > Pharma > European Antibiotics Market Report 2021-2031

European Antibiotics Market Report 2021-2031
Forecasts by Drug Class (Cephalosporin, Penicillin, Fluoroquinolone, Macrolide, Carbapenem, Aminoglycoside, Sulfonamide, 7-AC, Others), by Action Mechanism (Cell Wall Synthesis Inhibitors, Protein Synthesis Inhibitors, DNA Synthesis Inhibitors, RNA Synthesis Inhibitors, Mycolic Acid Inhibitors, Others) by Gender (Male, Female), by Age (0-14 Years, 15-54 Years, 55 Years and Above), by Route of Administration (Oral, Intravenous, Others) AND Regional and Leading National Market Analysis PLUS Analysis of Leading Antibiotics Companies AND COVID-19 Recovery Scenarios
Rising Antimicrobial Resistance to Challenge European Antibiotics Market Growth
Antimicrobial resistance (AMR) has risen dramatically in the last 15 years, becoming a serious global issue. In France, 12 percent of Escherichia coli strains collected from blood cultures are now resistant to third-generation cephalosporins, although global resistance rates for this bacterium could range from 50 to 80 percent in some countries. Carbapenem-resistant Enterobacteriaceae have become a serious global concern in the recent decade, with rates of gram-negative bacteria topping 50% in some countries. According to WHO/Europe research reports, the European Region today faces an accelerated spread of antibiotic resistance. As a result of the COVID-19 pandemic, the long-term problem of improper antibiotic usage by individuals and in health-care settings is escalating. Despite these precautions, the hospital, like many others across Europe, has had to contend with an upsurge in antibiotic-resistant germs during the epidemic.
Contraindications of Antibiotic Resistance to Increase Alternative Antibiotic Therapies In European Market
Antibiotic-resistant microorganism infections are becoming more common and a major global problem. They may be linked to a longer stay in the hospital, higher morbidity and death, and higher costs. Overuse and misuse of antibiotics are key contributors to this problem, and the development of new effective antimicrobials is becoming increasingly constrained.
UNIQUE COVID-19 VARIATIONS– only available in this Visiongain report are dedicated analysis of 4 different rebound scenarios of how the market will develop – no matter how COVID-19 affects the economy.
To access the data contained in this document please email contactus@visiongain.com
Which Factors are Fueling European Antibiotics Industry Growth?
• Growing Burden of Infectious Diseases to Fuel Market Growth
• Rising Ageing Population Patient Pool to Drive Growth
• Adoption of Digital Health Technology to Boost Antibiotics Market Growth
Which Factors are Restraining Growth?
• Strict Regulatory Scenarios to Hamper Market Growth
• Rising Antibiotic Resistance to Restrain Market Growth
How do prominent players strengthen their position throughout the region?
You must read this newly updated report if you are involved in this sector. The report from Visiongain shows you potential revenues up to 2031, evaluate information, trends, opportunities and business outlooks.
Discover how to stay ahead
Our 720+ pages report provides 800+ tables and charts/graphs. Read on to discover the most lucrative areas in the industry and the future market prospects. Our new study lets you assess forecasted sales at overall European market and regional level. See financial results, trends, opportunities, and revenue predictions. Much opportunity remains in this growing European Antibiotics Market. See how to exploit the opportunities.
Forecasts to 2031 and other analyses reveal the commercial prospects
• In addition to revenue forecasting to 2031, our new study provides you with recent results, growth rates, and market shares.
• You find original analyses, with business outlooks and developments.
• Discover qualitative analyses (including market dynamics, drivers, opportunities, restraints and challenges), SWOT Analysis, Porter’s Analysis, product profiles and commercial developments.

Discover sales predictions for the European market and submarkets
Drug Class
• Cephalosporin
• Penicillin
• Fluoroquinolone
• Macrolide
• Carbapenem
• Aminoglycoside
• Sulfonamide
• 7-ACA
• Others
Action Mechanism
• Cell Wall Synthesis Inhibitors
• Protein Synthesis Inhibitors
• DNA Synthesis Inhibitors
• RNA Synthesis Inhibitors
• Mycolic Acid Inhibitors
• Others
Gender
• Male
• Female
Age
• 0-14 years
• 15-54 years
• 55 years and above
Route of Administration
• Oral
• Intravenous
• Others
In addition to the revenue predictions for the overall European market and segments, you will also find revenue forecasts for 12 national markets:
By Region
• Europe
• Germany
• UK
• France
• Italy
• Spain
• Russia
• Denmark
• Norway
• Sweden
• Finland
• Netherlands
• Rest of Europe
Need industry data? Please contact us today.
Leading companies and the potential for market growth
Overall revenue for European Antibiotics Market will surpass $xx million in 2020, our work calculates. We predict strong revenue growth through to 2031. Our work identifies which regions hold the greatest potential. Discover their capabilities, progress, and commercial prospects, helping you stay ahead.
Prospects for established firms and those seeking to enter the market– including company profiles for 16 of the major companies involved in the European Antibiotics market. Some of the companies profiled in this report include Abbott Laboratories, Allergan (AbbVie Inc.), Cipla Ltd, Cumberland Pharmaceuticals, Inc., F. Hoffmann-La Roche Ltd, GlaxoSmithKline Plc, Novartis International AG, Pfizer Inc., Sanofi, Teva Pharmaceutical Industries Ltd., and Viatris (Mylan).
Key Questions Answered by this Report:
• What is the current size of the overall European Antibiotics market? How much will this market be worth from 2021 to 2031?
• What are the main drivers and restraints that will shape the overall European Antibiotics market over the next ten years?
• What are the main segments within the overall European Antibiotics market? How much will each of these segments be worth for the period 2021 to 2031? How will the composition of the market change during that time, and why?
• What factors will affect that industry and market over the next ten years?
• What are the largest national markets for the European Antibiotics? What is their current status and how will they develop over the next ten years? What are their revenue potentials to 2031?
• How will market shares of the leading national markets change by 2031, and which geographical region will lead the market in 2031?
• Which are the leading companies and what are their activities, results, developments, and prospects?
• What are the main trends that will affect the European Antibiotics market between 2021 and 2031?
• What are the main strengths, weaknesses, opportunities, and threats for the market?
• How will the European Antibiotics market evolve over the forecasted period, 2021 to 2031?
• How will market shares of prominent national markets change from 2021, and which countries will lead the market in 2031, achieving highest revenues and fastest growth?
Find quantitative and qualitative analyses with independent predictions. Receive information that only our report contains, staying informed with this invaluable business intelligence.
Information found nowhere else
With our newly report title, you are less likely to fall behind in knowledge or miss out on opportunities. See how our work could benefit your research, analyses, and decisions. Visiongain’s study is intended for everybody needing commercial analyses for the European Antibiotics Market and leading companies. You will find data, trends and predictions.
To access the data contained in this document please email contactus@visiongain.com
Buy our report today European Antibiotics Market Report 2021-2031: Forecasts by Drug Class (Cephalosporin, Penicillin, Fluoroquinolone, Macrolide, Carbapenem, Aminoglycoside, Sulfonamide, 7-AC, Others), by Action Mechanism (Cell Wall Synthesis Inhibitors, Protein Synthesis Inhibitors, DNA Synthesis Inhibitors, RNA Synthesis Inhibitors, Mycolic Acid Inhibitors, Others) by Gender (Male, Female), by Age (0-14 Years, 15-54 Years, 55 Years and Above), by Route of Administration (Oral, Intravenous, Others) AND Regional and Leading National Market Analysis PLUS Analysis of Leading Antibiotics Companies AND COVID-19 Recovery Scenarios. Avoid missing out by staying informed – order our report now.
Visiongain is a trading partner with the US Federal Government
CCR Ref number: KD4R6
Do you have any custom requirements we can help you with? Any need for a specific country, geo region, market segment or specific company information? Contact us today, we can discuss your needs and see how we can help: sara.peerun@visiongain.com
1.1 Introduction to Antibiotics Market
1.2 Antibiotics Market Definition
1.3 Why You Should Read This Report
1.4 What This Report Delivers
1.5 Key Questions Answered By This Analytical Report Include:
1.6 Who is This Report For?
1.7 Methodology
1.7.1 COVID-19 Impact: Recovery Scenarios
1.7.2 Market Evaluation & Forecasting Methodology
1.8 Frequently Asked Questions (FAQs)
1.9 Associated Visiongain Reports
1.10 About Visiongain
2 Executive Summary
3 Market Dynamics
3.1 Drivers
3.1.1 Growing Burden of Infectious Diseases to Fuel Market Growth
3.1.2 Adoption of Digital Health Technology to Boost Antibiotics Market Growth
3.1.3 Rising Ageing Population Patient Pool to Drive Growth
3.2 Restraints
3.2.1 Strict Regulatory Scenarios to Hamper Market Growth
3.2.2 Rising Antibiotic Resistance to Restrain Market Growth
3.3 Opportunities
3.4 SWOT Analysis
3.4.1 Strengths
3.4.2 Weaknesses
3.4.3 Opportunities
3.4.4 Threats
3.5 Industry analysis - Porter’s
3.5.1 Buyer Power
3.5.2 Supplier Power
3.5.3 Competitive Rivalry
3.5.4 Threat of Substitute
3.5.5 Threat of New Entrants
3.6 Industry analysis – PEST Analysis
3.6.1 Political Factors Impacting Antibiotics Market
3.6.2 Economic Factors Impacting Antibiotics Market
3.6.3 Social Factors Impacting Antibiotics Market
3.6.4 Technological Factors Impacting Antibiotics Market
4 European Antibiotics Market by Drug Class
4.1 Cephalosporin Segment Market Forecast, 2021-2031
4.1.1 Rising Prevalence of Infectious Diseases to Fuel Segmental Growth
4.1.2 Recovery Scenarios (V, U, W, L)
4.2 Penicillin Segment Market Forecast, 2021-2031
4.2.1 Penicillin Accounts for Majority of the Antibiotics Market Share
4.2.2 Recovery Scenarios (V, U, W, L)
4.3 Fluoroquinolone Segment Market Forecast, 2021-2031
4.3.1 Fluoroquinolone Segment Anticipated to Witness Highest Growth Over the Forecast Period
4.3.2 Recovery Scenarios (V, U, W, L)
4.4 Macrolide Segment Market Forecast, 2021-2031
4.4.1 Rising Demand of Drugs for Bacterial Skin Infections to Fuel Growth
4.4.2 Recovery Scenarios (V, U, W, L)
4.5 Carbapenem Segment Market Forecast, 2021-2031
4.5.1 Market Overview
4.5.2 Recovery Scenarios (V, U, W, L)
4.6 Aminoglycoside Segment Market Forecast, 2021-2031
4.6.1 Market Overview
4.6.2 Recovery Scenarios (V, U, W, L)
4.7 Sulfonamide Segment Market Forecast, 2021-2031
4.7.1 Market Overview
4.7.2 Recovery Scenarios (V, U, W, L)
4.8 7-ACA Segment Market Forecast, 2021-2031
4.8.1 Market Overview
4.8.2 Recovery Scenarios (V, U, W, L)
4.9 Others Segment Market Forecast, 2021-2031
4.9.1 Recovery Scenarios (V, U, W, L)
5 European Antibiotics Market by Action Mechanism
5.1 Cell Wall Synthesis Inhibitors Segment Market Forecast, 2021-2031
5.1.1 Cell Wall Synthesis Inhibitors Accounts for Majority of the Market Share
5.1.2 Recovery Scenarios (V, U, W, L)
5.2 Protein Synthesis Inhibitors Segment Market Forecast, 2021-2031
5.2.1 R&D Initiatives Projected to Boost Protein Synthesis Inhibitors Growth
5.2.2 Recovery Scenarios (V, U, W, L)
5.3 DNA Synthesis Inhibitors Segment Market Forecast, 2021-2031
5.3.1 Market Overview
5.3.2 Recovery Scenarios (V, U, W, L)
5.4 RNA Synthesis Inhibitors Segment Market Forecast, 2021-2031
5.4.1 RNA Synthesis Inhibitors Anticipated to Witness Fastest CAGR Through 2031
5.4.2 Recovery Scenarios (V, U, W, L)
5.5 Mycolic Acid Inhibitors Segment Market Forecast, 2021-2031
5.5.1 Market Overview
5.5.2 Recovery Scenarios (V, U, W, L)
5.6 Others Segment Market Forecast, 2021-2031
5.6.1 Recovery Scenarios (V, U, W, L)
6 Europe Antibiotics Market by Gender
6.1 Recovery Scenarios (V, U, W, L)
7 Europe Antibiotics Market by Age Group
7.1 Recovery Scenarios (V, U, W, L)
8 Europe Antibiotics Market by Route of Administration
8.1 Recovery Scenarios (V, U, W, L)
9 Europe Antibiotics Market
9.1 Growing Health Awareness to Fuel European Antibiotics Market Through 2031
9.2 Consumption of Antibactetrials in Community Across European Countries by ATC Group
9.3 Consumption of Antibactetrials in Hospital Sector Across European Countries by ATC Group
9.4 DDDs Per 1000 Inhabitants Per Day
9.5 Market Authorization & Reimbursements in Norway
9.6 Top 10 Potential Companies Outside Nordic Region
9.7 Regulatory Scenario Across Europe
9.8 European Antibiotics Market Historic Revenues, 2015-2020
9.8.1 European Antibiotics Market by Country
9.8.2 European Antibiotics Market by Drug Class
9.8.3 European Antibiotics Market by Action Mechanism
9.8.4 European Antibiotics Market by Gender
9.8.5 European Antibiotics Market by Age
9.8.6 European Antibiotics Market by Route of Administration
9.9 Europe Antibiotics Market by Country, Forecast 2021-2031
9.9.1 Recovery Scenarios (V, U, W, L): Europe Antibiotics Market by Country Forecast, 2021-2031
10 Germany Antibiotics Market, Forecast 2021-2031
10.1 German Antibiotics Market to Witness Highest Growth Rate by 2031
10.1.1 Recovery Scenarios (V, U, W, L): Germany Antibiotics Market Forecast, 2021-2031
10.2 Germany Antibiotics Market Forecast by Drug Class (Including COVID-19 Impact Scenarios)
10.3 Germany Antibiotics Market Forecast by Action Mechanism (Including COVID-19 Impact Scenarios)
10.4 Germany Antibiotics Market Forecast by Gender (Including COVID-19 Impact Scenarios)
10.5 Germany Antibiotics Market Forecast by Age Group (Including COVID-19 Impact Scenarios)
10.6 Germany Antibiotics Market Forecast by Route of Administration (Including COVID-19 Impact Scenarios)
11 UK Antibiotics Market, Forecast 2021-2031
11.1 Collaboration Among Healthcare Organizations to Fuel Regional Antibiotics Market Growth
11.1.1 Recovery Scenarios (V, U, W, L): UK Antibiotics Market Forecast, 2021-2031
11.2 UK Antibiotics Market Forecast by Drug Class (Including COVID-19 Impact Scenarios)
11.3 UK Antibiotics Market Forecast by Action Mechanism (Including COVID-19 Impact Scenarios)
11.4 UK Antibiotics Market Forecast by Gender (Including COVID-19 Impact Scenarios)
11.5 UK Antibiotics Market Forecast by Age Group (Including COVID-19 Impact Scenarios)
11.6 UK Antibiotics Market Forecast by Route of Administration (Including COVID-19 Impact Scenarios)
12 France Antibiotics Market, Forecast 2021-2031
12.1 Rising Incidence of Infectious Diseases to Augur French Antibiotics Market Growth
12.1.1 Recovery Scenarios (V, U, W, L): France Antibiotics Market Forecast, 2021-2031
12.2 France Antibiotics Market Forecast by Drug Class (Including COVID-19 Impact Scenarios)
12.3 France Antibiotics Market Forecast by Action Mechanism (Including COVID-19 Impact Scenarios)
12.4 France Antibiotics Market Forecast by Gender (Including COVID-19 Impact Scenarios)
12.5 France Antibiotics Market Forecast by Age Group (Including COVID-19 Impact Scenarios)
12.6 France Antibiotics Market Forecast by Route of Administration (Including COVID-19 Impact Scenarios)
13 Italy Antibiotics Market, Forecast 2021-2031
13.1 High Awareness Regarding Usage of Antibiotics is Anticipated to Boost Italian Antibiotics Market
13.1.1 Recovery Scenarios (V, U, W, L): Italy Antibiotics Market Forecast, 2021-2031
13.2 Italy Antibiotics Market Forecast by Drug Class (Including COVID-19 Impact Scenarios)
13.3 Italy Antibiotics Market Forecast by Action Mechanism (Including COVID-19 Impact Scenarios)
13.4 Italy Antibiotics Market Forecast by Gender (Including COVID-19 Impact Scenarios)
13.5 Italy Antibiotics Market Forecast by Age Group (Including COVID-19 Impact Scenarios)
13.6 Italy Antibiotics Market Forecast by Route of Administration (Including COVID-19 Impact Scenarios)
14 Spain Antibiotics Market, Forecast 2021-2031
14.1 Incidence of Influenza to Boost Regional Market Growth
14.1.1 Recovery Scenarios (V, U, W, L): Spain Antibiotics Market Forecast, 2021-2031
14.2 Spain Antibiotics Market Forecast by Drug Class (Including COVID-19 Impact Scenarios)
14.3 Spain Antibiotics Market Forecast by Action Mechanism (Including COVID-19 Impact Scenarios)
14.4 Spain Antibiotics Market Forecast by Gender (Including COVID-19 Impact Scenarios)
14.5 Spain Antibiotics Market Forecast by Age Group (Including COVID-19 Impact Scenarios)
14.6 Spain Antibiotics Market Forecast by Route of Administration (Including COVID-19 Impact Scenarios)
15 Russia Antibiotics Market, Forecast 2021-2031
15.1 Awareness Regarding Health Issues Anticipated to Boost Antibiotics Market Growth Through 2031
15.1.1 Recovery Scenarios (V, U, W, L): Russia Antibiotics Market Forecast, 2021-2031
15.2 Russia Antibiotics Market Forecast by Drug Class (Including COVID-19 Impact Scenarios)
15.3 Russia Antibiotics Market Forecast by Action Mechanism (Including COVID-19 Impact Scenarios)
15.4 Russia Antibiotics Market Forecast by Gender (Including COVID-19 Impact Scenarios)
15.5 Russia Antibiotics Market Forecast by Age Group (Including COVID-19 Impact Scenarios)
15.6 Russia Antibiotics Market Forecast by Route of Administration (Including COVID-19 Impact Scenarios)
16 Denmark Antibiotics Market, Forecast 2021-2031
16.1.1 Recovery Scenarios (V, U, W, L): Denmark Antibiotics Market Forecast, 2021-2031
16.2 Denmark Antibiotics Market Forecast by Drug Class (Including COVID-19 Impact Scenarios)
16.3 Denmark Antibiotics Market Forecast by Action Mechanism (Including COVID-19 Impact Scenarios)
16.4 Denmark Antibiotics Market Forecast by Gender (Including COVID-19 Impact Scenarios)
16.5 Denmark Antibiotics Market Forecast by Age Group (Including COVID-19 Impact Scenarios)
16.6 Denmark Antibiotics Market Forecast by Route of Administration (Including COVID-19 Impact Scenarios)
17 Norway Antibiotics Market, Forecast 2021-2031
17.1.1 Recovery Scenarios (V, U, W, L): Norway Antibiotics Market Forecast, 2021-2031
17.2 Norway Antibiotics Market Forecast by Drug Class (Including COVID-19 Impact Scenarios)
17.3 Norway Antibiotics Market Forecast by Action Mechanism (Including COVID-19 Impact Scenarios)
17.4 Norway Antibiotics Market Forecast by Gender (Including COVID-19 Impact Scenarios)
17.5 Norway Antibiotics Market Forecast by Age Group (Including COVID-19 Impact Scenarios)
17.6 Norway Antibiotics Market Forecast by Route of Administration (Including COVID-19 Impact Scenarios)
18 Sweden Antibiotics Market, Forecast 2021-2031
18.1.1 Recovery Scenarios (V, U, W, L): Sweden Antibiotics Market Forecast, 2021-2031
18.2 Sweden Antibiotics Market Forecast by Drug Class (Including COVID-19 Impact Scenarios)
18.3 Sweden Antibiotics Market Forecast by Action Mechanism (Including COVID-19 Impact Scenarios)
18.4 Sweden Antibiotics Market Forecast by Gender (Including COVID-19 Impact Scenarios)
18.5 Sweden Antibiotics Market Forecast by Age Group (Including COVID-19 Impact Scenarios)
18.6 Sweden Antibiotics Market Forecast by Route of Administration (Including COVID-19 Impact Scenarios)
19 Finland Antibiotics Market, Forecast 2021-2031
19.1.1 Recovery Scenarios (V, U, W, L): Finland Antibiotics Market Forecast, 2021-2031
19.2 Finland Antibiotics Market Forecast by Drug Class (Including COVID-19 Impact Scenarios)
19.3 Finland Antibiotics Market Forecast by Action Mechanism (Including COVID-19 Impact Scenarios)
19.4 Finland Antibiotics Market Forecast by Gender (Including COVID-19 Impact Scenarios)
19.5 Finland Antibiotics Market Forecast by Age Group (Including COVID-19 Impact Scenarios)
19.6 Finland Antibiotics Market Forecast by Route of Administration (Including COVID-19 Impact Scenarios)
20 Netherlands Antibiotics Market, Forecast 2021-2031
20.1 Market Overview, 2021-2031
20.1.1 Recovery Scenarios (V, U, W, L): Netherlands Antibiotics Market Forecast, 2021-2031
20.2 Netherlands Antibiotics Market Forecast by Drug Class (Including COVID-19 Impact Scenarios)
20.3 Netherlands Antibiotics Market Forecast by Action Mechanism (Including COVID-19 Impact Scenarios)
20.4 Netherlands Antibiotics Market Forecast by Gender (Including COVID-19 Impact Scenarios)
20.5 Netherlands Antibiotics Market Forecast by Age Group (Including COVID-19 Impact Scenarios)
20.6 Netherlands Antibiotics Market Forecast by Route of Administration (Including COVID-19 Impact Scenarios)
21 Rest of Europe Antibiotics Market, Forecast 2021-2031
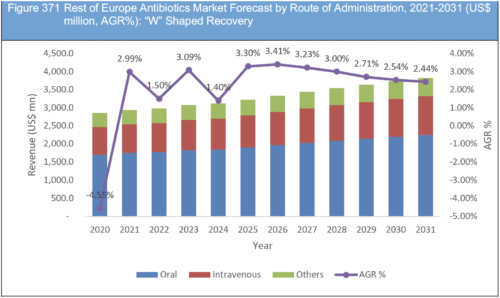
21.1 Market Revenue, 2021-2031
21.1.1 Recovery Scenarios (V, U, W, L): Rest of Europe Antibiotics Market Forecast, 2021-2031
21.2 Rest of Europe Antibiotics Market Forecast by Drug Class (Including COVID-19 Impact Scenarios)
21.3 Rest of Europe Antibiotics Market Forecast by Action Mechanism (Including COVID-19 Impact Scenarios)
21.4 Rest of Europe Antibiotics Market Forecast by Gender (Including COVID-19 Impact Scenarios)
21.5 Rest of Europe Antibiotics Market Forecast by Age Group (Including COVID-19 Impact Scenarios)
21.6 Rest of Europe Antibiotics Market Forecast by Route of Administration (Including COVID-19 Impact Scenarios)
22 Company Profiles
22.1 European Antibiotics Market: Company Wise Ranking
22.2 Key Strategies Followed by Leading Antibiotics Players
22.2.1 Internationalization
22.2.2 Product Range Breadth
22.2.3 Capability Development
22.2.4 Cost Differentiation
22.2.5 Vertical Integration
22.3 Abbott Laboratories
22.3.1 Company Snapshot
22.3.2 Abbott Laboratories Overview
22.3.3 Financial Analysis
22.3.4 Product Benchmarking
22.4 F. Hoffmann-La Roche Ltd.
22.4.1 Company Snapshot
22.4.2 Company Overview
22.4.3 Financial Analysis
22.4.4 Product Benchmarking
22.4.5 Recent Developments, 2019-2020
22.5 GlaxoSmithKline Plc.
22.5.1 Company Snapshot
22.5.2 Company Overview
22.5.3 Financial Analysis
22.5.4 Product Benchmarking
22.5.5 Recent Developments, 2019-2021
22.6 Merck & Co. Inc.
22.6.1 Company Snapshot
22.6.2 Company Overview
22.6.3 Financial Analysis
22.6.4 Product Benchmarking
22.6.5 Recent Developments, 2019-2020
22.7 Viatris (Mylan)
22.7.1 Company Snapshot
22.7.2 Company Overview
22.7.3 Financial Analysis
22.7.4 Product Benchmarking
22.7.5 Recent Developments, 2019-2021
22.8 Novartis International AG
22.8.1 Company Snapshot
22.8.2 Company Overview
22.8.3 Financial Analysis
22.8.4 Product Benchmarking
22.8.5 Recent Developments, 2019-2021
22.9 Pfizer Inc.
22.9.1 Company Snapshot
22.9.2 Company Overview
22.9.3 Financial Analysis
22.9.4 Product Benchmarking
22.9.5 Recent Developments, 2017-2020
22.10 Sanofi
22.10.1 Company Snapshot
22.10.2 Company Overview
22.10.3 Financial Analysis
22.10.4 Product Benchmarking
22.11 Teva Pharmaceutical Industries Ltd.
22.11.1 Company Snapshot
22.11.2 Company Overview
22.11.3 Financial Analysis
22.11.4 Product Benchmarking
22.12 Cipla Ltd.
22.12.1 Company Snapshot
22.12.2 Company Overview
22.12.3 Financial Analysis
22.12.4 Product Benchmarking
22.12.5 Recent Developments, 2019
22.13 Allergan (AbbVie Inc.)
22.13.1 Company Snapshot
22.13.2 Company Overview
22.13.3 Financial Analysis
22.13.4 Product Benchmarking
22.14 Cumberland Pharmaceuticals, Inc
22.14.1 Company Snapshot
22.14.2 Company Overview
22.14.3 Financial Analysis
22.14.4 Product Benchmarking
22.14.5 Recent Developments, 2017-2019
23 Conclusion
23.1 Concluding Remarks
23.2 Recommendations for Market Players
List of Tables
Table 1 Europe Antibiotics Market Snapshot, 2021 & 2031 (US$ million, CAGR %)
Table 2 Europe Antibiotics Market Forecast by Drug Class, 2021-2031 (US$ mn, AGR%, CAGR%)
Table 3 Europe Antibiotics Market Forecast by Cephalosporin, 2021-2031 (US$ mn, AGR%, CAGR%)
Table 4 Europe Antibiotics Market Forecast for Cephalosporin, 2021-2031 (US$ mn, AGR%, CAGR%): "V" Shaped Recovery
Table 5 Europe Antibiotics Market Forecast for Cephalosporin, 2021-2031 (US$ mn, AGR%, CAGR%): "U" Shaped Recovery
Table 6 Europe Antibiotics Market Forecast for Cephalosporin, 2021-2031 (US$ mn, AGR%, CAGR%): "W" Shaped Recovery
Table 7 Europe Antibiotics Market Forecast for Cephalosporin, 2021-2031 (US$ mn, AGR%, CAGR%): "L" Shaped Recovery
Table 8 Europe Antibiotics Market Forecast for Penicillin 2021-2031 (US$ mn, AGR%, CAGR%)
Table 9 Europe Antibiotics Market Forecast for Penicillin 2021-2031 (US$ mn, AGR%, CAGR%): "V" Shaped Recovery
Table 10 Europe Antibiotics Market Forecast for Penicillin 2021-2031 (US$ mn, AGR%, CAGR%): "U" Shaped Recovery
Table 11 Europe Antibiotics Market Forecast for Penicillin 2021-2031 (US$ mn, AGR%, CAGR%): "W" Shaped Recovery
Table 12 Europe Antibiotics Market Forecast for Penicillin 2021-2031 (US$ mn, AGR%, CAGR%): "L" Shaped Recovery
Table 13 Europe Antibiotics Market Forecast for Fluoroquinolone, 2021-2031 (US$ mn, AGR%, CAGR%)
Table 14 Europe Antibiotics Market Forecast for Fluoroquinolone, 2021-2031 (US$ mn, AGR%, CAGR%): "V" Shaped Recovery
Table 15 Europe Antibiotics Market Forecast for Fluoroquinolone, 2021-2031 (US$ mn, AGR%, CAGR%): "U" Shaped Recovery
Table 16 Europe Antibiotics Market Forecast for Fluoroquinolone, 2021-2031 (US$ mn, AGR%, CAGR%): "W" Shaped Recovery
Table 17 Europe Antibiotics Market Forecast for Fluoroquinolone, 2021-2031 (US$ mn, AGR%, CAGR%): "L" Shaped Recovery
Table 18 Europe Antibiotics Market Forecast for Macrolide, 2021-2031 (US$ mn, AGR%, CAGR%)
Table 19 Europe Antibiotics Market Forecast for Macrolide, 2021-2031 (US$ mn, AGR%, CAGR%): "V" Shaped Recovery
Table 20 Europe Antibiotics Market Forecast for Macrolide, 2021-2031 (US$ mn, AGR%, CAGR%): "U" Shaped Recovery
Table 21 Europe Antibiotics Market Forecast for Macrolide, 2021-2031 (US$ mn, AGR%, CAGR%): "W" Shaped Recovery
Table 22 Europe Antibiotics Market Forecast for Macrolide, 2021-2031 (US$ mn, AGR%, CAGR%): "L" Shaped Recovery
Table 23 Europe Antibiotics Market Forecast for Carbapenem, 2021-2031 (US$ mn, AGR%, CAGR%)
Table 24 Europe Antibiotics Market Forecast for Carbapenem, 2021-2031 (US$ mn, AGR%, CAGR%): "V" Shaped Recovery
Table 25 Europe Antibiotics Market Forecast for Carbapenem, 2021-2031 (US$ mn, AGR%, CAGR%): "U" Shaped Recovery
Table 26 Europe Antibiotics Market Forecast for Carbapenem, 2021-2031 (US$ mn, AGR%, CAGR%): "W" Shaped Recovery
Table 27 Europe Antibiotics Market Forecast for Carbapenem, 2021-2031 (US$ mn, AGR%, CAGR%): "L" Shaped Recovery
Table 28 Europe Antibiotics Market Forecast for Aminoglycoside, 2021-2031 (US$ mn, AGR%, CAGR%)
Table 29 Europe Antibiotics Market Forecast for Aminoglycoside, 2021-2031 (US$ mn, AGR%, CAGR%): "V" Shaped Recovery
Table 30 Europe Antibiotics Market Forecast for Aminoglycoside, 2021-2031 (US$ mn, AGR%, CAGR%): "U" Shaped Recovery
Table 31 Europe Antibiotics Market Forecast for Aminoglycoside, 2021-2031 (US$ mn, AGR%, CAGR%): "W" Shaped Recovery
Table 32 Europe Antibiotics Market Forecast for Aminoglycoside, 2021-2031 (US$ mn, AGR%, CAGR%): "L" Shaped Recovery
Table 33 Europe Antibiotics Market Forecast for Sulfonamide, 2021-2031 (US$ mn, AGR%, CAGR%)
Table 34 Europe Antibiotics Market Forecast for Sulfonamide, 2021-2031 (US$ mn, AGR%, CAGR%): "V" Shaped Recovery
Table 35 Europe Antibiotics Market Forecast for Sulfonamide, 2021-2031 (US$ mn, AGR%, CAGR%): "U" Shaped Recovery
Table 36 Europe Antibiotics Market Forecast for Sulfonamide, 2021-2031 (US$ mn, AGR%, CAGR%): "W" Shaped Recovery
Table 37 Europe Antibiotics Market Forecast for Sulfonamide, 2021-2031 (US$ mn, AGR%, CAGR%): "L" Shaped Recovery
Table 38 Europe Antibiotics Market Forecast for 7-ACA, 2021-2031 (US$ mn, AGR%, CAGR%)
Table 39 Europe Antibiotics Market Forecast for 7-ACA, 2021-2031 (US$ mn, AGR%, CAGR%): "V" Shaped Recovery
Table 40 Europe Antibiotics Market Forecast for 7-ACA, 2021-2031 (US$ mn, AGR%, CAGR%): "U" Shaped Recovery
Table 41 Europe Antibiotics Market Forecast for 7-ACA, 2021-2031 (US$ mn, AGR%, CAGR%): "W" Shaped Recovery
Table 42 Europe Antibiotics Market Forecast for 7-ACA, 2021-2031 (US$ mn, AGR%, CAGR%): "L" Shaped Recovery
Table 43 Europe Antibiotics Market Forecast for Others, 2021-2031 (US$ mn, AGR%, CAGR%)
Table 44 Europe Antibiotics Market Forecast for Others, 2021-2031 (US$ mn, AGR%, CAGR%): "V" Shaped Recovery
Table 45 Europe Antibiotics Market Forecast for Others, 2021-2031 (US$ mn, AGR%, CAGR%): "U" Shaped Recovery
Table 46 Europe Antibiotics Market Forecast for Others, 2021-2031 (US$ mn, AGR%, CAGR%): "W" Shaped Recovery
Table 47 Europe Antibiotics Market Forecast for Others, 2021-2031 (US$ mn, AGR%, CAGR%): "L" Shaped Recovery
Table 48 Europe Antibiotics Market Forecast by Action Mechanism, 2021-2031 (US$ mn, AGR%, CAGR%)
Table 49 Europe Antibiotics Market Forecast for Cell Wall Synthesis Inhibitors, 2021-2031 (US$ mn, AGR%, CAGR%)
Table 50 Europe Antibiotics Market Forecast for Cell Wall Synthesis Inhibitors, 2021-2031 (US$ mn, AGR%, CAGR%): "V" Shaped Recovery
Table 51 Europe Antibiotics Market Forecast for Cell Wall Synthesis Inhibitors, 2021-2031 (US$ mn, AGR%, CAGR%): "U" Shaped Recovery
Table 52 Europe Antibiotics Market Forecast for Cell Wall Synthesis Inhibitors, 2021-2031 (US$ mn, AGR%, CAGR%): "W" Shaped Recovery
Table 53 Europe Antibiotics Market Forecast for Cell Wall Synthesis Inhibitors, 2021-2031 (US$ mn, AGR%, CAGR%): "L" Shaped Recovery
Table 54 Europe Antibiotics Market Forecast for Protein Synthesis Inhibitors 2021-2031 (US$ mn, AGR%, CAGR%)
Table 55 Europe Antibiotics Market Forecast for Protein Synthesis Inhibitors 2021-2031 (US$ mn, AGR%, CAGR%): "V" Shaped Recovery
Table 56 Europe Antibiotics Market Forecast for Protein Synthesis Inhibitors 2021-2031 (US$ mn, AGR%, CAGR%): "U" Shaped Recovery
Table 57 Europe Antibiotics Market Forecast for Protein Synthesis Inhibitors 2021-2031 (US$ mn, AGR%, CAGR%): "W" Shaped Recovery
Table 58 Europe Antibiotics Market Forecast for Protein Synthesis Inhibitors 2021-2031 (US$ mn, AGR%, CAGR%): "L" Shaped Recovery
Table 59 Europe Antibiotics Market Forecast for DNA Synthesis Inhibitors 2021-2031 (US$ mn, AGR%, CAGR%)
Table 60 Europe Antibiotics Market Forecast for DNA Synthesis Inhibitors 2021-2031 (US$ mn, AGR%, CAGR%): "V" Shaped Recovery
Table 61 Europe Antibiotics Market Forecast for DNA Synthesis Inhibitors 2021-2031 (US$ mn, AGR%, CAGR%): "U" Shaped Recovery
Table 62 Europe Antibiotics Market Forecast for DNA Synthesis Inhibitors 2021-2031 (US$ mn, AGR%, CAGR%): "W" Shaped Recovery
Table 63 Europe Antibiotics Market Forecast for DNA Synthesis Inhibitors 2021-2031 (US$ mn, AGR%, CAGR%): "L" Shaped Recovery
Table 64 Europe Antibiotics Market Forecast for RNA Synthesis Inhibitors 2021-2031 (US$ mn, AGR%, CAGR%)
Table 65 Europe Antibiotics Market Forecast for RNA Synthesis Inhibitors 2021-2031 (US$ mn, AGR%, CAGR%): "V" Shaped Recovery
Table 66 Europe Antibiotics Market Forecast for RNA Synthesis Inhibitors 2021-2031 (US$ mn, AGR%, CAGR%): "U" Shaped Recovery
Table 67 Europe Antibiotics Market Forecast for RNA Synthesis Inhibitors 2021-2031 (US$ mn, AGR%, CAGR%): "W" Shaped Recovery
Table 68 Europe Antibiotics Market Forecast for RNA Synthesis Inhibitors 2021-2031 (US$ mn, AGR%, CAGR%): "L" Shaped Recovery
Table 69 Europe Antibiotics Market Forecast for Mycolic Acid Inhibitors, 2021-2031 (US$ mn, AGR%, CAGR%)
Table 70 Europe Antibiotics Market Forecast for Mycolic Acid Inhibitors, 2021-2031 (US$ mn, AGR%, CAGR%): "V" Shaped Recovery
Table 71 Europe Antibiotics Market Forecast for Mycolic Acid Inhibitors, 2021-2031 (US$ mn, AGR%, CAGR%): "U" Shaped Recovery
Table 72 Europe Antibiotics Market Forecast for Mycolic Acid Inhibitors, 2021-2031 (US$ mn, AGR%, CAGR%): "W" Shaped Recovery
Table 73 Europe Antibiotics Market Forecast for Mycolic Acid Inhibitors, 2021-2031 (US$ mn, AGR%, CAGR%): "L" Shaped Recovery
Table 74 Europe Antibiotics Market Forecast for Others, 2021-2031 (US$ mn, AGR%, CAGR%)
Table 75 Europe Antibiotics Market Forecast for Others, 2021-2031 (US$ mn, AGR%, CAGR%): "V" Shaped Recovery
Table 76 Europe Antibiotics Market Forecast for Others, 2021-2031 (US$ mn, AGR%, CAGR%): "U" Shaped Recovery
Table 77 Europe Antibiotics Market Forecast for Others, 2021-2031 (US$ mn, AGR%, CAGR%): "W" Shaped Recovery
Table 78 Europe Antibiotics Market Forecast for Others, 2021-2031 (US$ mn, AGR%, CAGR%): "L" Shaped Recovery
Table 79 Europe Antibiotics Market Forecast by Gender, 2021-2031 (US$ mn, AGR%, CAGR%)
Table 80 Europe Antibiotics Market Forecast by Gender, 2021-2031 (US$ mn, AGR%, CAGR%): "V" Shaped Recovery
Table 81 Europe Antibiotics Market Forecast by Gender, 2021-2031 (US$ mn, AGR%, CAGR%): "U" Shaped Recovery
Table 82 Europe Antibiotics Market Forecast by Gender, 2021-2031 (US$ mn, AGR%, CAGR%): "W" Shaped Recovery
Table 83 Europe Antibiotics Market Forecast by Gender, 2021-2031 (US$ mn, AGR%, CAGR%): "L" Shaped Recovery
Table 84 Europe Antibiotics Market Forecast by Age Group, 2021-2031 (US$ mn, AGR%, CAGR%)
Table 85 Europe Antibiotics Market Forecast by Age Group, 2021-2031 (US$ mn, AGR%, CAGR%): "V" Shaped Recovery
Table 86 Europe Antibiotics Market Forecast by Age Group, 2021-2031 (US$ mn, AGR%, CAGR%): "U" Shaped Recovery
Table 87 Europe Antibiotics Market Forecast by Age Group, 2021-2031 (US$ mn, AGR%, CAGR%): "W" Shaped Recovery
Table 88 Europe Antibiotics Market Forecast by Age Group, 2021-2031 (US$ mn, AGR%, CAGR%): "L" Shaped Recovery
Table 89 Europe Antibiotics Market Forecast by Route of Administration, 2021-2031 (US$ mn, AGR%, CAGR%)
Table 90 Europe Antibiotics Market Forecast by Route of Administration, 2021-2031 (US$ mn, AGR%, CAGR%): "V" Shaped Recovery
Table 91 Europe Antibiotics Market Forecast by Route of Administration, 2021-2031 (US$ mn, AGR%, CAGR%): "U" Shaped Recovery
Table 92 Europe Antibiotics Market Forecast by Route of Administration, 2021-2031 (US$ mn, AGR%, CAGR%): "W" Shaped Recovery
Table 93 Europe Antibiotics Market Forecast by Route of Administration, 2021-2031 (US$ mn, AGR%, CAGR%): "L" Shaped Recovery
Table 94 Consumption of antibacterial for systemic use (ATC group J01) in the community, by country and ATC group level 3, EU/EEA, 2019 (expressed as DDD per 1 000 inhabitants per day)
Table 95 Consumption of antibacterials for systemic use (ATC group J01) in the Hospital Sector, by country and ATC group level 3, EU/EEA, 2019 (expressed as DDD per 1 000 inhabitants per day)
Table 96 Europe Antibiotics Market by Country 2015-2020, (US$ mn, AGR%, CAGR%)
Table 97 Europe Antibiotics Market by Drug Class, 2015-2020 (US$ mn, AGR%, CAGR%)
Table 98 Europe Antibiotics Market by Mechanism of Action, 2015-2020 (US$ mn, AGR%, CAGR%)
Table 1 Europe Antibiotics Market Forecast by Country, 2021-2031 (US$ mn, AGR%, CAGR%)
Table 2 Europe Antibiotics Market Forecast by Country, 2021-2031 (US$ mn, AGR%, CAGR%): "V" Shaped Recovery
Table 3 Europe Antibiotics Market Forecast by Country, 2021-2031 (US$ mn, AGR%, CAGR%): "U" Shaped Recovery
Table 4 Europe Antibiotics Market Forecast by Country, 2021-2031 (US$ mn, AGR%, CAGR%): "W" Shaped Recovery
Table 5 Europe Antibiotics Market Forecast by Country, 2021-2031 (US$ mn, AGR%, CAGR%): "L" Shaped Recovery
Table 6 Germany Antibiotics Market Forecast, 2021-2031 (US$ mn, AGR%, CAGR%)
Table 7 Germany Antibiotics Market Forecast, 2021-2031 (US$ mn, AGR%, CAGR%): "V" Shaped Recovery
Table 8 Germany Antibiotics Market Forecast, 2021-2031 (US$ mn, AGR%, CAGR%): "U" Shaped Recovery
Table 9 Germany Antibiotics Market Forecast, 2021-2031 (US$ mn, AGR%, CAGR%): "W" Shaped Recovery
Table 10 Germany Antibiotics Market Forecast, 2021-2031 (US$ mn, AGR%, CAGR%): "L" Shaped Recovery
Table 11 Germany Antibiotics Market Forecast by Drug Class, 2021-2031 (US$ mn, AGR%, CAGR%)
Table 12 Germany Antibiotics Market Forecast by Drug Class, 2021-2031 (US$ mn, AGR%, CAGR%): "V" Shaped Recovery
Table 13 Germany Antibiotics Market Forecast by Drug Class, 2021-2031 (US$ mn, AGR%, CAGR%): "U" Shaped Recovery
Table 14 Germany Antibiotics Market Forecast by Drug Class, 2021-2031 (US$ mn, AGR%, CAGR%): "W" Shaped Recovery
Table 15 Germany Antibiotics Market Forecast by Drug Class, 2021-2031 (US$ mn, AGR%, CAGR%): "L" Shaped Recovery
Table 16 Germany Antibiotics Market Forecast by Action Mechanism, 2021-2031 (US$ mn, AGR%, CAGR%)
Table 17 Germany Antibiotics Market Forecast by Action Mechanism, 2021-2031 (US$ mn, AGR%, CAGR%): "V" Shaped Recovery
Table 18 Germany Antibiotics Market Forecast by Action Mechanism, 2021-2031 (US$ mn, AGR%, CAGR%): "U" Shaped Recovery
Table 19 Germany Antibiotics Market Forecast by Action Mechanism, 2021-2031 (US$ mn, AGR%, CAGR%): "W" Shaped Recovery
Table 20 Germany Antibiotics Market Forecast by Action Mechanism, 2021-2031 (US$ mn, AGR%, CAGR%): "L" Shaped Recovery
Table 21 Germany Antibiotics Market Forecast by Gender, 2021-2031 (US$ mn, AGR%, CAGR%)
Table 22 Germany Antibiotics Market Forecast by Gender, 2021-2031 (US$ mn, AGR%, CAGR%)
Table 23 Germany Antibiotics Market Forecast by Gender, 2021-2031 (US$ mn, AGR%, CAGR%): "U" Shaped Recovery
Table 24 Germany Antibiotics Market Forecast by Gender, 2021-2031 (US$ mn, AGR%, CAGR%): "W" Shaped Recovery
Table 25 Germany Antibiotics Market Forecast by Gender, 2021-2031 (US$ mn, AGR%, CAGR%): "L" Shaped Recovery
Table 26 Germany Antibiotics Market Forecast by Age Group, 2021-2031 (US$ mn, AGR%, CAGR%)
Table 27 Germany Antibiotics Market Forecast by Age Group, 2021-2031 (US$ mn, AGR%, CAGR%)
Table 28 Germany Antibiotics Market Forecast by Age Group, 2021-2031 (US$ mn, AGR%, CAGR%): "U" Shaped Recovery
Table 29 Germany Antibiotics Market Forecast by Age Group, 2021-2031 (US$ mn, AGR%, CAGR%): "W" Shaped Recovery
Table 30 Germany Antibiotics Market Forecast by Age Group, 2021-2031 (US$ mn, AGR%, CAGR%): "L" Shaped Recovery
Table 31 Germany Antibiotics Market Forecast by Route of Administration, 2021-2031 (US$ mn, AGR%, CAGR%)
Table 32 Germany Antibiotics Market Forecast by Route of Administration, 2021-2031 (US$ mn, AGR%, CAGR%)
Table 33 Germany Antibiotics Market Forecast by Route of Administration, 2021-2031 (US$ mn, AGR%, CAGR%): "U" Shaped Recovery
Table 34 Germany Antibiotics Market Forecast by Route of Administration, 2021-2031 (US$ mn, AGR%, CAGR%): "W" Shaped Recovery
Table 35 Germany Antibiotics Market Forecast by Route of Administration, 2021-2031 (US$ mn, AGR%, CAGR%): "L" Shaped Recovery
Table 36 UK Antibiotics Market Forecast, 2021-2031 (US$ mn, AGR%, CAGR%)
Table 37 UK Antibiotics Market Forecast, 2021-2031 (US$ mn, AGR%, CAGR%): "V" Shaped Recovery
Table 38 UK Antibiotics Market Forecast, 2021-2031 (US$ mn, AGR%, CAGR%): "U" Shaped Recovery
Table 39 UK Antibiotics Market Forecast, 2021-2031 (US$ mn, AGR%, CAGR%): "W" Shaped Recovery
Table 40 UK Antibiotics Market Forecast, 2021-2031 (US$ mn, AGR%, CAGR%): "L" Shaped Recovery
Table 41 UK Antibiotics Market Forecast by Drug Class, 2021-2031 (US$ mn, AGR%, CAGR%)
Table 42 UK Antibiotics Market Forecast by Drug Class, 2021-2031 (US$ mn, AGR%, CAGR%): "V" Shaped Recovery
Table 43 UK Antibiotics Market Forecast by Drug Class, 2021-2031 (US$ mn, AGR%, CAGR%): "U" Shaped Recovery
Table 44 UK Antibiotics Market Forecast by Drug Class, 2021-2031 (US$ mn, AGR%, CAGR%): "W" Shaped Recovery
Table 45 UK Antibiotics Market Forecast by Drug Class, 2021-2031 (US$ mn, AGR%, CAGR%): "L" Shaped Recovery
Table 46 UK Antibiotics Market Forecast by Action Mechanism, 2021-2031 (US$ mn, AGR%, CAGR%)
Table 47 UK Antibiotics Market Forecast by Action Mechanism, 2021-2031 (US$ mn, AGR%, CAGR%): "V" Shaped Recovery
Table 48 UK Antibiotics Market Forecast by Action Mechanism, 2021-2031 (US$ mn, AGR%, CAGR%): "U" Shaped Recovery
Table 49 UK Antibiotics Market Forecast by Action Mechanism, 2021-2031 (US$ mn, AGR%, CAGR%): "W" Shaped Recovery
Table 50 UK Antibiotics Market Forecast by Action Mechanism, 2021-2031 (US$ mn, AGR%, CAGR%): "L" Shaped Recovery
Table 51 UK Antibiotics Market Forecast by Gender, 2021-2031 (US$ mn, AGR%, CAGR%)
Table 52 UK Antibiotics Market Forecast by Gender, 2021-2031 (US$ mn, AGR%, CAGR%)
Table 53 UK Antibiotics Market Forecast by Gender, 2021-2031 (US$ mn, AGR%, CAGR%): "U" Shaped Recovery
Table 54 UK Antibiotics Market Forecast by Gender, 2021-2031 (US$ mn, AGR%, CAGR%): "W" Shaped Recovery
Table 55 UK Antibiotics Market Forecast by Gender, 2021-2031 (US$ mn, AGR%, CAGR%): "L" Shaped Recovery
Table 56 UK Antibiotics Market Forecast by Age Group, 2021-2031 (US$ mn, AGR%, CAGR%)
Table 57 UK Antibiotics Market Forecast by Age Group, 2021-2031 (US$ mn, AGR%, CAGR%)
Table 58 UK Antibiotics Market Forecast by Age Group, 2021-2031 (US$ mn, AGR%, CAGR%): "U" Shaped Recovery
Table 59 UK Antibiotics Market Forecast by Age Group, 2021-2031 (US$ mn, AGR%, CAGR%): "W" Shaped Recovery
Table 60 UK Antibiotics Market Forecast by Age Group, 2021-2031 (US$ mn, AGR%, CAGR%): "L" Shaped Recovery
Table 61 UK Antibiotics Market Forecast by Route of Administration, 2021-2031 (US$ mn, AGR%, CAGR%)
Table 62 UK Antibiotics Market Forecast by Route of Administration, 2021-2031 (US$ mn, AGR%, CAGR%)
Table 63 UK Antibiotics Market Forecast by Route of Administration, 2021-2031 (US$ mn, AGR%, CAGR%): "U" Shaped Recovery
Table 64 UK Antibiotics Market Forecast by Route of Administration, 2021-2031 (US$ mn, AGR%, CAGR%): "W" Shaped Recovery
Table 65 UK Antibiotics Market Forecast by Route of Administration, 2021-2031 (US$ mn, AGR%, CAGR%): "L" Shaped Recovery
Table 66 France Antibiotics Market Forecast, 2021-2031 (US$ mn, AGR%, CAGR%)
Table 67 France Antibiotics Market Forecast, 2021-2031 (US$ mn, AGR%, CAGR%): "V" Shaped Recovery
Table 68 France Antibiotics Market Forecast, 2021-2031 (US$ mn, AGR%, CAGR%): "U" Shaped Recovery
Table 69 France Antibiotics Market Forecast, 2021-2031 (US$ mn, AGR%, CAGR%): "W" Shaped Recovery
Table 70 France Antibiotics Market Forecast, 2021-2031 (US$ mn, AGR%, CAGR%): "L" Shaped Recovery
Table 71 France Antibiotics Market Forecast by Drug Class, 2021-2031 (US$ mn, AGR%, CAGR%)
Table 72 France Antibiotics Market Forecast by Drug Class, 2021-2031 (US$ mn, AGR%, CAGR%): "V" Shaped Recovery
Table 73 France Antibiotics Market Forecast by Drug Class, 2021-2031 (US$ mn, AGR%, CAGR%): "U" Shaped Recovery
Table 74 France Antibiotics Market Forecast by Drug Class, 2021-2031 (US$ mn, AGR%, CAGR%): "W" Shaped Recovery
Table 75 France Antibiotics Market Forecast by Drug Class, 2021-2031 (US$ mn, AGR%, CAGR%): "L" Shaped Recovery
Table 76 France Antibiotics Market Forecast by Action Mechanism, 2021-2031 (US$ mn, AGR%, CAGR%)
Table 77 France Antibiotics Market Forecast by Action Mechanism, 2021-2031 (US$ mn, AGR%, CAGR%): "V" Shaped Recovery
Table 78 France Antibiotics Market Forecast by Action Mechanism, 2021-2031 (US$ mn, AGR%, CAGR%): "U" Shaped Recovery
Table 79 France Antibiotics Market Forecast by Action Mechanism, 2021-2031 (US$ mn, AGR%, CAGR%): "W" Shaped Recovery
Table 80 France Antibiotics Market Forecast by Action Mechanism, 2021-2031 (US$ mn, AGR%, CAGR%): "L" Shaped Recovery
Table 81 France Antibiotics Market Forecast by Gender, 2021-2031 (US$ mn, AGR%, CAGR%)
Table 82 France Antibiotics Market Forecast by Gender, 2021-2031 (US$ mn, AGR%, CAGR%): "V" Shaped Recovery
Table 83 France Antibiotics Market Forecast by Gender, 2021-2031 (US$ mn, AGR%, CAGR%): "U" Shaped Recovery
Table 84 France Antibiotics Market Forecast by Gender, 2021-2031 (US$ mn, AGR%, CAGR%): "W" Shaped Recovery
Table 85 France Antibiotics Market Forecast by Gender, 2021-2031 (US$ mn, AGR%, CAGR%): "L" Shaped Recovery
Table 86 France Antibiotics Market Forecast by Age Group, 2021-2031 (US$ mn, AGR%, CAGR%)
Table 87 France Antibiotics Market Forecast by Age Group, 2021-2031 (US$ mn, AGR%, CAGR%): "V" Shaped Recovery
Table 88 France Antibiotics Market Forecast by Age Group, 2021-2031 (US$ mn, AGR%, CAGR%): "U" Shaped Recovery
Table 89 France Antibiotics Market Forecast by Age Group, 2021-2031 (US$ mn, AGR%, CAGR%): "W" Shaped Recovery
Table 90 France Antibiotics Market Forecast by Age Group, 2021-2031 (US$ mn, AGR%, CAGR%): "L" Shaped Recovery
Table 91 France Antibiotics Market Forecast by Route of Administration, 2021-2031 (US$ mn, AGR%, CAGR%)
Table 92 France Antibiotics Market Forecast by Route of Administration, 2021-2031 (US$ mn, AGR%, CAGR%): "V" Shaped Recovery
Table 93 France Antibiotics Market Forecast by Route of Administration, 2021-2031 (US$ mn, AGR%, CAGR%): "U" Shaped Recovery
Table 94 France Antibiotics Market Forecast by Route of Administration, 2021-2031 (US$ mn, AGR%, CAGR%): "W" Shaped Recovery
Table 95 France Antibiotics Market Forecast by Route of Administration, 2021-2031 (US$ mn, AGR%, CAGR%): "L" Shaped Recovery
Table 96 Italy Antibiotics Market Forecast, 2021-2031 (US$ mn, AGR%, CAGR%)
Table 97 Italy Antibiotics Market Forecast, 2021-2031 (US$ mn, AGR%, CAGR%): "V" Shaped Recovery
Table 98 Italy Antibiotics Market Forecast, 2021-2031 (US$ mn, AGR%, CAGR%): "U" Shaped Recovery
Table 99 Italy Antibiotics Market Forecast, 2021-2031 (US$ mn, AGR%, CAGR%): "W" Shaped Recovery
Table 100 Italy Antibiotics Market Forecast, 2021-2031 (US$ mn, AGR%, CAGR%): "L" Shaped Recovery
Table 101 Italy Antibiotics Market Forecast by Drug Class, 2021-2031 (US$ mn, AGR%, CAGR%)
Table 102 Italy Antibiotics Market Forecast by Drug Class, 2021-2031 (US$ mn, AGR%, CAGR%): "V" Shaped Recovery
Table 103 Italy Antibiotics Market Forecast by Drug Class, 2021-2031 (US$ mn, AGR%, CAGR%): "U" Shaped Recovery
Table 104 Italy Antibiotics Market Forecast by Drug Class, 2021-2031 (US$ mn, AGR%, CAGR%): "W" Shaped Recovery
Table 105 Italy Antibiotics Market Forecast by Drug Class, 2021-2031 (US$ mn, AGR%, CAGR%): "L" Shaped Recovery
Table 106 Italy Antibiotics Market Forecast by Action Mechanism, 2021-2031 (US$ mn, AGR%, CAGR%)
Table 107 Italy Antibiotics Market Forecast by Action Mechanism, 2021-2031 (US$ mn, AGR%, CAGR%): "V" Shaped Recovery
Table 108 Italy Antibiotics Market Forecast by Action Mechanism, 2021-2031 (US$ mn, AGR%, CAGR%): "U" Shaped Recovery
Table 109 Italy Antibiotics Market Forecast by Action Mechanism, 2021-2031 (US$ mn, AGR%, CAGR%): "W" Shaped Recovery
Table 110 Italy Antibiotics Market Forecast by Action Mechanism, 2021-2031 (US$ mn, AGR%, CAGR%): "L" Shaped Recovery
Table 111 Italy Antibiotics Market Forecast by Gender, 2021-2031 (US$ mn, AGR%, CAGR%)
Table 112 Italy Antibiotics Market Forecast by Gender, 2021-2031 (US$ mn, AGR%, CAGR%): "V" Shaped Recovery
Table 113 Italy Antibiotics Market Forecast by Gender, 2021-2031 (US$ mn, AGR%, CAGR%): "U" Shaped Recovery
Table 114 Italy Antibiotics Market Forecast by Gender, 2021-2031 (US$ mn, AGR%, CAGR%): "W" Shaped Recovery
Table 115 Italy Antibiotics Market Forecast by Gender, 2021-2031 (US$ mn, AGR%, CAGR%): "L" Shaped Recovery
Table 116 Italy Antibiotics Market Forecast by Age Group, 2021-2031 (US$ mn, AGR%, CAGR%)
Table 117 Italy Antibiotics Market Forecast by Age Group, 2021-2031 (US$ mn, AGR%, CAGR%): "V" Shaped Recovery
Table 118 Italy Antibiotics Market Forecast by Age Group, 2021-2031 (US$ mn, AGR%, CAGR%): "U" Shaped Recovery
Table 119 Italy Antibiotics Market Forecast by Age Group, 2021-2031 (US$ mn, AGR%, CAGR%): "W" Shaped Recovery
Table 120 Italy Antibiotics Market Forecast by Age Group, 2021-2031 (US$ mn, AGR%, CAGR%): "L" Shaped Recovery
Table 121 Italy Antibiotics Market Forecast by Route of Administration, 2021-2031 (US$ mn, AGR%, CAGR%)
Table 122 Italy Antibiotics Market Forecast by Route of Administration, 2021-2031 (US$ mn, AGR%, CAGR%): "V" Shaped Recovery
Table 123 Italy Antibiotics Market Forecast by Route of Administration, 2021-2031 (US$ mn, AGR%, CAGR%): "U" Shaped Recovery
Table 124 Italy Antibiotics Market Forecast by Route of Administration, 2021-2031 (US$ mn, AGR%, CAGR%): "W" Shaped Recovery
Table 125 Italy Antibiotics Market Forecast by Route of Administration, 2021-2031 (US$ mn, AGR%, CAGR%): "L" Shaped Recovery
Table 126 Spain Antibiotics Market Forecast, 2021-2031 (US$ mn, AGR%, CAGR%)
Table 127 Spain Antibiotics Market Forecast, 2021-2031 (US$ mn, AGR%, CAGR%): "V" Shaped Recovery
Table 128 Spain Antibiotics Market Forecast, 2021-2031 (US$ mn, AGR%, CAGR%): "U" Shaped Recovery
Table 129 Spain Antibiotics Market Forecast, 2021-2031 (US$ mn, AGR%, CAGR%): "W" Shaped Recovery
Table 130 Spain Antibiotics Market Forecast, 2021-2031 (US$ mn, AGR%, CAGR%): "L" Shaped Recovery
Table 131 Spain Antibiotics Market Forecast by Drug Class, 2021-2031 (US$ mn, AGR%, CAGR%)
Table 132 Spain Antibiotics Market Forecast by Drug Class, 2021-2031 (US$ mn, AGR%, CAGR%): "V" Shaped Recovery
Table 133 Spain Antibiotics Market Forecast by Drug Class, 2021-2031 (US$ mn, AGR%, CAGR%): "U" Shaped Recovery
Table 134 Spain Antibiotics Market Forecast by Drug Class, 2021-2031 (US$ mn, AGR%, CAGR%): "W" Shaped Recovery
Table 135 Spain Antibiotics Market Forecast by Drug Class, 2021-2031 (US$ mn, AGR%, CAGR%): "L" Shaped Recovery
Table 136 Spain Antibiotics Market Forecast by Action Mechanism, 2021-2031 (US$ mn, AGR%, CAGR%)
Table 137 Spain Antibiotics Market Forecast by Action Mechanism, 2021-2031 (US$ mn, AGR%, CAGR%): "V" Shaped Recovery
Table 138 Spain Antibiotics Market Forecast by Action Mechanism, 2021-2031 (US$ mn, AGR%, CAGR%): "U" Shaped Recovery
Table 139 Spain Antibiotics Market Forecast by Action Mechanism, 2021-2031 (US$ mn, AGR%, CAGR%): "W" Shaped Recovery
Table 140 Spain Antibiotics Market Forecast by Action Mechanism, 2021-2031 (US$ mn, AGR%, CAGR%): "L" Shaped Recovery
Table 141 Spain Antibiotics Market Forecast by Gender, 2021-2031 (US$ mn, AGR%, CAGR%)
Table 142 Spain Antibiotics Market Forecast by Gender, 2021-2031 (US$ mn, AGR%, CAGR%): "V" Shaped Recovery
Table 143 Spain Antibiotics Market Forecast by Gender, 2021-2031 (US$ mn, AGR%, CAGR%): "U" Shaped Recovery
Table 144 Spain Antibiotics Market Forecast by Gender, 2021-2031 (US$ mn, AGR%, CAGR%): "W" Shaped Recovery
Table 145 Spain Antibiotics Market Forecast by Gender, 2021-2031 (US$ mn, AGR%, CAGR%): "L" Shaped Recovery
Table 146 Spain Antibiotics Market Forecast by Age Group, 2021-2031 (US$ mn, AGR%, CAGR%)
Table 147 Spain Antibiotics Market Forecast by Age Group, 2021-2031 (US$ mn, AGR%, CAGR%): "V" Shaped Recovery
Table 148 Spain Antibiotics Market Forecast by Age Group, 2021-2031 (US$ mn, AGR%, CAGR%): "U" Shaped Recovery
Table 149 Spain Antibiotics Market Forecast by Age Group, 2021-2031 (US$ mn, AGR%, CAGR%): "W" Shaped Recovery
Table 150 Spain Antibiotics Market Forecast by Age Group, 2021-2031 (US$ mn, AGR%, CAGR%): "L" Shaped Recovery
Table 151 Spain Antibiotics Market Forecast by Route of Administration, 2021-2031 (US$ mn, AGR%, CAGR%)
Table 152 Russia Antibiotics Market Forecast, 2021-2031 (US$ mn, AGR%, CAGR%)
Table 153 Russia Antibiotics Market Forecast, 2021-2031 (US$ mn, AGR%, CAGR%): "V" Shaped Recovery
Table 154 Russia Antibiotics Market Forecast, 2021-2031 (US$ mn, AGR%, CAGR%): "U" Shaped Recovery
Table 155 Russia Antibiotics Market Forecast, 2021-2031 (US$ mn, AGR%, CAGR%): "W" Shaped Recovery
Table 156 Russia Antibiotics Market Forecast, 2021-2031 (US$ mn, AGR%, CAGR%): "L" Shaped Recovery
Table 157 Russia Antibiotics Market Forecast by Drug Class, 2021-2031 (US$ mn, AGR%, CAGR%)
Table 158 Russia Antibiotics Market Forecast by Drug Class, 2021-2031 (US$ mn, AGR%, CAGR%): "V" Shaped Recovery
Table 159 Russia Antibiotics Market Forecast by Drug Class, 2021-2031 (US$ mn, AGR%, CAGR%): "U" Shaped Recovery
Table 160 Russia Antibiotics Market Forecast by Drug Class, 2021-2031 (US$ mn, AGR%, CAGR%): "W" Shaped Recovery
Table 161 Russia Antibiotics Market Forecast by Drug Class, 2021-2031 (US$ mn, AGR%, CAGR%): "L" Shaped Recovery
Table 162 Russia Antibiotics Market Forecast by Action Mechanism, 2021-2031 (US$ mn, AGR%, CAGR%)
Table 163 Russia Antibiotics Market Forecast by Action Mechanism, 2021-2031 (US$ mn, AGR%, CAGR%): "V" Shaped Recovery
Table 164 Russia Antibiotics Market Forecast by Action Mechanism, 2021-2031 (US$ mn, AGR%, CAGR%): "U" Shaped Recovery
Table 165 Russia Antibiotics Market Forecast by Action Mechanism, 2021-2031 (US$ mn, AGR%, CAGR%): "W" Shaped Recovery
Table 166 Russia Antibiotics Market Forecast by Action Mechanism, 2021-2031 (US$ mn, AGR%, CAGR%): "L" Shaped Recovery
Table 167 Denmark Antibiotics Market Forecast, 2021-2031 (US$ mn, AGR%, CAGR%)
Table 168 Denmark Antibiotics Market Forecast, 2021-2031 (US$ mn, AGR%, CAGR%): "V" Shaped Recovery
Table 169 Denmark Antibiotics Market Forecast, 2021-2031 (US$ mn, AGR%, CAGR%): "U" Shaped Recovery
Table 170 Denmark Antibiotics Market Forecast, 2021-2031 (US$ mn, AGR%, CAGR%): "W" Shaped Recovery
Table 171 Denmark Antibiotics Market Forecast, 2021-2031 (US$ mn, AGR%, CAGR%): "L" Shaped Recovery
Table 172 Denmark Antibiotics Market Forecast by Drug Class, 2021-2031 (US$ mn, AGR%, CAGR%)
Table 173 Denmark Antibiotics Market Forecast by Drug Class, 2021-2031 (US$ mn, AGR%, CAGR%): "V" Shaped Recovery
Table 174 Denmark Antibiotics Market Forecast by Drug Class, 2021-2031 (US$ mn, AGR%, CAGR%): "U" Shaped Recovery
Table 175 Denmark Antibiotics Market Forecast by Drug Class, 2021-2031 (US$ mn, AGR%, CAGR%): "W" Shaped Recovery
Table 176 Denmark Antibiotics Market Forecast by Drug Class, 2021-2031 (US$ mn, AGR%, CAGR%): "L" Shaped Recovery
Table 177 Denmark Antibiotics Market Forecast by Action Mechanism, 2021-2031 (US$ mn, AGR%, CAGR%)
Table 178 Denmark Antibiotics Market Forecast by Action Mechanism, 2021-2031 (US$ mn, AGR%, CAGR%): "V" Shaped Recovery
Table 179 Denmark Antibiotics Market Forecast by Action Mechanism, 2021-2031 (US$ mn, AGR%, CAGR%): "U" Shaped Recovery
Table 180 Denmark Antibiotics Market Forecast by Action Mechanism, 2021-2031 (US$ mn, AGR%, CAGR%): "W" Shaped Recovery
Table 181 Denmark Antibiotics Market Forecast by Action Mechanism, 2021-2031 (US$ mn, AGR%, CAGR%): "L" Shaped Recovery
Table 182 Denmark Antibiotics Market Forecast by Gender, 2021-2031 (US$ mn, AGR%, CAGR%)
Table 183 Denmark Antibiotics Market Forecast by Gender, 2021-2031 (US$ mn, AGR%, CAGR%): "V" Shaped Recovery
Table 184 Denmark Antibiotics Market Forecast by Gender, 2021-2031 (US$ mn, AGR%, CAGR%): "U" Shaped Recovery
Table 185 Denmark Antibiotics Market Forecast by Gender, 2021-2031 (US$ mn, AGR%, CAGR%): "W" Shaped Recovery
Table 186 Denmark Antibiotics Market Forecast by Gender, 2021-2031 (US$ mn, AGR%, CAGR%): "L" Shaped Recovery
Table 187 Denmark Antibiotics Market Forecast by Age Group, 2021-2031 (US$ mn, AGR%, CAGR%)
Table 188 Denmark Antibiotics Market Forecast by Age Group, 2021-2031 (US$ mn, AGR%, CAGR%): "V" Shaped Recovery
Table 189 Denmark Antibiotics Market Forecast by Age Group, 2021-2031 (US$ mn, AGR%, CAGR%): "U" Shaped Recovery
Table 190 Denmark Antibiotics Market Forecast by Age Group, 2021-2031 (US$ mn, AGR%, CAGR%): "W" Shaped Recovery
Table 191 Denmark Antibiotics Market Forecast by Age Group, 2021-2031 (US$ mn, AGR%, CAGR%): "L" Shaped Recovery
Table 192 Denmark Antibiotics Market Forecast by Route of Administration, 2021-2031 (US$ mn, AGR%, CAGR%)
Table 193 Denmark Antibiotics Market Forecast by Route of Administration, 2021-2031 (US$ mn, AGR%, CAGR%): "V" Shaped Recovery
Table 194 Denmark Antibiotics Market Forecast by Route of Administration, 2021-2031 (US$ mn, AGR%, CAGR%): "U" Shaped Recovery
Table 195 Denmark Antibiotics Market Forecast by Route of Administration, 2021-2031 (US$ mn, AGR%, CAGR%): "W" Shaped Recovery
Table 196 Denmark Antibiotics Market Forecast by Route of Administration, 2021-2031 (US$ mn, AGR%, CAGR%): "L" Shaped Recovery
Table 197 Norway Antibiotics Market Forecast, 2021-2031 (US$ mn, AGR%, CAGR%)
Table 198 Norway Antibiotics Market Forecast, 2021-2031 (US$ mn, AGR%, CAGR%): "V" Shaped Recovery
Table 199 Norway Antibiotics Market Forecast, 2021-2031 (US$ mn, AGR%, CAGR%): "U" Shaped Recovery
Table 200 Norway Antibiotics Market Forecast, 2021-2031 (US$ mn, AGR%, CAGR%): "W" Shaped Recovery
Table 201 Norway Antibiotics Market Forecast, 2021-2031 (US$ mn, AGR%, CAGR%): "L" Shaped Recovery
Table 202 Norway Antibiotics Market Forecast by Drug Class, 2021-2031 (US$ mn, AGR%, CAGR%)
Table 203 Norway Antibiotics Market Forecast by Drug Class, 2021-2031 (US$ mn, AGR%, CAGR%): "V" Shaped Recovery
Table 204 Norway Antibiotics Market Forecast by Drug Class, 2021-2031 (US$ mn, AGR%, CAGR%): "U" Shaped Recovery
Table 205 Norway Antibiotics Market Forecast by Drug Class, 2021-2031 (US$ mn, AGR%, CAGR%): "W" Shaped Recovery
Table 206 Norway Antibiotics Market Forecast by Drug Class, 2021-2031 (US$ mn, AGR%, CAGR%): "L" Shaped Recovery
Table 207 Norway Antibiotics Market Forecast by Action Mechanism, 2021-2031 (US$ mn, AGR%, CAGR%)
Table 208 Norway Antibiotics Market Forecast by Action Mechanism, 2021-2031 (US$ mn, AGR%, CAGR%): "V" Shaped Recovery
Table 209 Norway Antibiotics Market Forecast by Action Mechanism, 2021-2031 (US$ mn, AGR%, CAGR%): "U" Shaped Recovery
Table 210 Norway Antibiotics Market Forecast by Action Mechanism, 2021-2031 (US$ mn, AGR%, CAGR%): "W" Shaped Recovery
Table 211 Norway Antibiotics Market Forecast by Action Mechanism, 2021-2031 (US$ mn, AGR%, CAGR%): "L" Shaped Recovery
Table 212 Norway Antibiotics Market Forecast by Gender, 2021-2031 (US$ mn, AGR%, CAGR%)
Table 213 Norway Antibiotics Market Forecast by Gender, 2021-2031 (US$ mn, AGR%, CAGR%): "V" Shaped Recovery
Table 214 Norway Antibiotics Market Forecast by Gender, 2021-2031 (US$ mn, AGR%, CAGR%): "U" Shaped Recovery
Table 215 Norway Antibiotics Market Forecast by Gender, 2021-2031 (US$ mn, AGR%, CAGR%): "W" Shaped Recovery
Table 216 Norway Antibiotics Market Forecast by Gender, 2021-2031 (US$ mn, AGR%, CAGR%): "L" Shaped Recovery
Table 217 Norway Antibiotics Market Forecast by Age Group, 2021-2031 (US$ mn, AGR%, CAGR%)
Table 218 Norway Antibiotics Market Forecast by Age Group, 2021-2031 (US$ mn, AGR%, CAGR%): "V" Shaped Recovery
Table 219 Norway Antibiotics Market Forecast by Age Group, 2021-2031 (US$ mn, AGR%, CAGR%): "U" Shaped Recovery
Table 220 Norway Antibiotics Market Forecast by Age Group, 2021-2031 (US$ mn, AGR%, CAGR%): "W" Shaped Recovery
Table 221 Norway Antibiotics Market Forecast by Age Group, 2021-2031 (US$ mn, AGR%, CAGR%): "L" Shaped Recovery
Table 222 Norway Antibiotics Market Forecast by Route of Administration, 2021-2031 (US$ mn, AGR%, CAGR%)
Table 223 Norway Antibiotics Market Forecast by Route of Administration, 2021-2031 (US$ mn, AGR%, CAGR%): "V" Shaped Recovery
Table 224 Norway Antibiotics Market Forecast by Route of Administration, 2021-2031 (US$ mn, AGR%, CAGR%): "U" Shaped Recovery
Table 225 Norway Antibiotics Market Forecast by Route of Administration, 2021-2031 (US$ mn, AGR%, CAGR%): "W" Shaped Recovery
Table 226 Norway Antibiotics Market Forecast by Route of Administration, 2021-2031 (US$ mn, AGR%, CAGR%): "L" Shaped Recovery
Table 227 Sweden Antibiotics Market Forecast, 2021-2031 (US$ mn, AGR%, CAGR%)
Table 228 Sweden Antibiotics Market Forecast, 2021-2031 (US$ mn, AGR%, CAGR%): "V" Shaped Recovery
Table 229 Sweden Antibiotics Market Forecast, 2021-2031 (US$ mn, AGR%, CAGR%): "U" Shaped Recovery
Table 230 Sweden Antibiotics Market Forecast, 2021-2031 (US$ mn, AGR%, CAGR%): "W" Shaped Recovery
Table 231 Sweden Antibiotics Market Forecast, 2021-2031 (US$ mn, AGR%, CAGR%): "L" Shaped Recovery
Table 232 Sweden Antibiotics Market Forecast by Drug Class, 2021-2031 (US$ mn, AGR%, CAGR%)
Table 233 Sweden Antibiotics Market Forecast by Drug Class, 2021-2031 (US$ mn, AGR%, CAGR%): "V" Shaped Recovery
Table 234 Sweden Antibiotics Market Forecast by Drug Class, 2021-2031 (US$ mn, AGR%, CAGR%): "U" Shaped Recovery
Table 235 Sweden Antibiotics Market Forecast by Drug Class, 2021-2031 (US$ mn, AGR%, CAGR%): "W" Shaped Recovery
Table 236 Sweden Antibiotics Market Forecast by Drug Class, 2021-2031 (US$ mn, AGR%, CAGR%): "L" Shaped Recovery
Table 237 Sweden Antibiotics Market Forecast by Action Mechanism, 2021-2031 (US$ mn, AGR%, CAGR%)
Table 238 Sweden Antibiotics Market Forecast by Action Mechanism, 2021-2031 (US$ mn, AGR%, CAGR%): "V" Shaped Recovery
Table 239 Sweden Antibiotics Market Forecast by Action Mechanism, 2021-2031 (US$ mn, AGR%, CAGR%): "U" Shaped Recovery
Table 240 Sweden Antibiotics Market Forecast by Action Mechanism, 2021-2031 (US$ mn, AGR%, CAGR%): "W" Shaped Recovery
Table 241 Sweden Antibiotics Market Forecast by Action Mechanism, 2021-2031 (US$ mn, AGR%, CAGR%): "L" Shaped Recovery
Table 242 Sweden Antibiotics Market Forecast by Gender, 2021-2031 (US$ mn, AGR%, CAGR%)
Table 243 Sweden Antibiotics Market Forecast by Gender, 2021-2031 (US$ mn, AGR%, CAGR%): "V" Shaped Recovery
Table 244 Sweden Antibiotics Market Forecast by Gender, 2021-2031 (US$ mn, AGR%, CAGR%): "U" Shaped Recovery
Table 245 Sweden Antibiotics Market Forecast by Gender, 2021-2031 (US$ mn, AGR%, CAGR%): "W" Shaped Recovery
Table 246 Sweden Antibiotics Market Forecast by Gender, 2021-2031 (US$ mn, AGR%, CAGR%): "L" Shaped Recovery
Table 247 Sweden Antibiotics Market Forecast by Age Group, 2021-2031 (US$ mn, AGR%, CAGR%)
Table 248 Sweden Antibiotics Market Forecast by Age Group, 2021-2031 (US$ mn, AGR%, CAGR%): "V" Shaped Recovery
Table 249 Sweden Antibiotics Market Forecast by Age Group, 2021-2031 (US$ mn, AGR%, CAGR%): "U" Shaped Recovery
Table 250 Sweden Antibiotics Market Forecast by Age Group, 2021-2031 (US$ mn, AGR%, CAGR%): "W" Shaped Recovery
Table 251 Sweden Antibiotics Market Forecast by Age Group, 2021-2031 (US$ mn, AGR%, CAGR%): "L" Shaped Recovery
Table 252 Sweden Antibiotics Market Forecast by Route of Administration, 2021-2031 (US$ mn, AGR%, CAGR%)
Table 253 Sweden Antibiotics Market Forecast by Route of Administration, 2021-2031 (US$ mn, AGR%, CAGR%): "V" Shaped Recovery
Table 254 Sweden Antibiotics Market Forecast by Route of Administration, 2021-2031 (US$ mn, AGR%, CAGR%): "U" Shaped Recovery
Table 255 Sweden Antibiotics Market Forecast by Route of Administration, 2021-2031 (US$ mn, AGR%, CAGR%): "W" Shaped Recovery
Table 256 Sweden Antibiotics Market Forecast by Route of Administration, 2021-2031 (US$ mn, AGR%, CAGR%): "L" Shaped Recovery
Table 257 Finland Antibiotics Market Forecast, 2021-2031 (US$ mn, AGR%, CAGR%)
Table 258 Finland Antibiotics Market Forecast, 2021-2031 (US$ mn, AGR%, CAGR%): "V" Shaped Recovery
Table 259 Finland Antibiotics Market Forecast, 2021-2031 (US$ mn, AGR%, CAGR%): "U" Shaped Recovery
Table 260 Finland Antibiotics Market Forecast, 2021-2031 (US$ mn, AGR%, CAGR%): "W" Shaped Recovery
Table 261 Finland Antibiotics Market Forecast, 2021-2031 (US$ mn, AGR%, CAGR%): "L" Shaped Recovery
Table 262 Finland Antibiotics Market Forecast by Drug Class, 2021-2031 (US$ mn, AGR%, CAGR%)
Table 263 Finland Antibiotics Market Forecast by Drug Class, 2021-2031 (US$ mn, AGR%, CAGR%): "V" Shaped Recovery
Table 264 Finland Antibiotics Market Forecast by Drug Class, 2021-2031 (US$ mn, AGR%, CAGR%): "U" Shaped Recovery
Table 265 Finland Antibiotics Market Forecast by Drug Class, 2021-2031 (US$ mn, AGR%, CAGR%): "W" Shaped Recovery
Table 266 Finland Antibiotics Market Forecast by Drug Class, 2021-2031 (US$ mn, AGR%, CAGR%): "L" Shaped Recovery
Table 267 Finland Antibiotics Market Forecast by Action Mechanism, 2021-2031 (US$ mn, AGR%, CAGR%)
Table 268 Finland Antibiotics Market Forecast by Action Mechanism, 2021-2031 (US$ mn, AGR%, CAGR%): "V" Shaped Recovery
Table 269 Finland Antibiotics Market Forecast by Action Mechanism, 2021-2031 (US$ mn, AGR%, CAGR%): "U" Shaped Recovery
Table 270 Finland Antibiotics Market Forecast by Action Mechanism, 2021-2031 (US$ mn, AGR%, CAGR%): "W" Shaped Recovery
Table 271 Finland Antibiotics Market Forecast by Action Mechanism, 2021-2031 (US$ mn, AGR%, CAGR%): "L" Shaped Recovery
Table 272 Finland Antibiotics Market Forecast by Gender, 2021-2031 (US$ mn, AGR%, CAGR%)
Table 273 Finland Antibiotics Market Forecast by Gender, 2021-2031 (US$ mn, AGR%, CAGR%): "V" Shaped Recovery
Table 274 Finland Antibiotics Market Forecast by Gender, 2021-2031 (US$ mn, AGR%, CAGR%): "U" Shaped Recovery
Table 275 Finland Antibiotics Market Forecast by Gender, 2021-2031 (US$ mn, AGR%, CAGR%): "W" Shaped Recovery
Table 276 Finland Antibiotics Market Forecast by Gender, 2021-2031 (US$ mn, AGR%, CAGR%): "L" Shaped Recovery
Table 277 Finland Antibiotics Market Forecast by Route of Administration, 2021-2031 (US$ mn, AGR%, CAGR%)
Table 278 Finland Antibiotics Market Forecast by Route of Administration, 2021-2031 (US$ mn, AGR%, CAGR%): "V" Shaped Recovery
Table 279 Finland Antibiotics Market Forecast by Route of Administration, 2021-2031 (US$ mn, AGR%, CAGR%): "U" Shaped Recovery
Table 280 Finland Antibiotics Market Forecast by Route of Administration, 2021-2031 (US$ mn, AGR%, CAGR%): "W" Shaped Recovery
Table 281 Finland Antibiotics Market Forecast by Route of Administration, 2021-2031 (US$ mn, AGR%, CAGR%): "L" Shaped Recovery
Table 282 Netherlands Antibiotics Market Forecast, 2021-2031 (US$ mn, AGR%, CAGR%)
Table 283 Netherlands Antibiotics Market Forecast, 2021-2031 (US$ mn, AGR%, CAGR%): "V" Shaped Recovery
Table 284 Netherlands Antibiotics Market Forecast, 2021-2031 (US$ mn, AGR%, CAGR%): "U" Shaped Recovery
Table 285 Netherlands Antibiotics Market Forecast, 2021-2031 (US$ mn, AGR%, CAGR%): "W" Shaped Recovery
Table 286 Netherlands Antibiotics Market Forecast, 2021-2031 (US$ mn, AGR%, CAGR%): "L" Shaped Recovery
Table 287 Netherlands Antibiotics Market Forecast by Drug Class, 2021-2031 (US$ mn, AGR%, CAGR%)
Table 288 Netherlands Antibiotics Market Forecast by Drug Class, 2021-2031 (US$ mn, AGR%, CAGR%): "V" Shaped Recovery
Table 289 Netherlands Antibiotics Market Forecast by Drug Class, 2021-2031 (US$ mn, AGR%, CAGR%): "U" Shaped Recovery
Table 290 Netherlands Antibiotics Market Forecast by Drug Class, 2021-2031 (US$ mn, AGR%, CAGR%): "W" Shaped Recovery
Table 291 Netherlands Antibiotics Market Forecast by Drug Class, 2021-2031 (US$ mn, AGR%, CAGR%): "L" Shaped Recovery
Table 292 Netherlands Antibiotics Market Forecast by Action Mechanism, 2021-2031 (US$ mn, AGR%, CAGR%)
Table 293 Netherlands Antibiotics Market Forecast by Action Mechanism, 2021-2031 (US$ mn, AGR%, CAGR%): "V" Shaped Recovery
Table 294 Netherlands Antibiotics Market Forecast by Action Mechanism, 2021-2031 (US$ mn, AGR%, CAGR%): "U" Shaped Recovery
Table 295 Netherlands Antibiotics Market Forecast by Action Mechanism, 2021-2031 (US$ mn, AGR%, CAGR%): "W" Shaped Recovery
Table 296 Netherlands Antibiotics Market Forecast by Action Mechanism, 2021-2031 (US$ mn, AGR%, CAGR%): "L" Shaped Recovery
Table 297 Netherlands Antibiotics Market Forecast by Gender, 2021-2031 (US$ mn, AGR%, CAGR%)
Table 298 Netherlands Antibiotics Market Forecast by Gender, 2021-2031 (US$ mn, AGR%, CAGR%): "V" Shaped Recovery
Table 299 Netherlands Antibiotics Market Forecast by Gender, 2021-2031 (US$ mn, AGR%, CAGR%): "U" Shaped Recovery
Table 300 Netherlands Antibiotics Market Forecast by Gender, 2021-2031 (US$ mn, AGR%, CAGR%): "W" Shaped Recovery
Table 301 Netherlands Antibiotics Market Forecast by Gender, 2021-2031 (US$ mn, AGR%, CAGR%): "L" Shaped Recovery
Table 302 Netherlands Antibiotics Market Forecast by Age Group, 2021-2031 (US$ mn, AGR%, CAGR%)
Table 303 Netherlands Antibiotics Market Forecast by Age Group, 2021-2031 (US$ mn, AGR%, CAGR%): "V" Shaped Recovery
Table 304 Netherlands Antibiotics Market Forecast by Age Group, 2021-2031 (US$ mn, AGR%, CAGR%): "U" Shaped Recovery
Table 305 Netherlands Antibiotics Market Forecast by Age Group, 2021-2031 (US$ mn, AGR%, CAGR%): "W" Shaped Recovery
Table 306 Netherlands Antibiotics Market Forecast by Age Group, 2021-2031 (US$ mn, AGR%, CAGR%): "L" Shaped Recovery
Table 307 Netherlands Antibiotics Market Forecast by Route of Administration, 2021-2031 (US$ mn, AGR%, CAGR%)
Table 308 Netherlands Antibiotics Market Forecast by Route of Administration, 2021-2031 (US$ mn, AGR%, CAGR%): "V" Shaped Recovery
Table 309 Netherlands Antibiotics Market Forecast by Route of Administration, 2021-2031 (US$ mn, AGR%, CAGR%): "U" Shaped Recovery
Table 310 Netherlands Antibiotics Market Forecast by Route of Administration, 2021-2031 (US$ mn, AGR%, CAGR%): "W" Shaped Recovery
Table 311 Netherlands Antibiotics Market Forecast by Route of Administration, 2021-2031 (US$ mn, AGR%, CAGR%): "L" Shaped Recovery
Table 312 Rest of Europe Antibiotics Market Forecast, 2021-2031 (US$ mn, AGR%, CAGR%)
Table 313 Rest of Europe Antibiotics Market Forecast, 2021-2031 (US$ mn, AGR%, CAGR%): "V" Shaped Recovery
Table 314 Rest of Europe Antibiotics Market Forecast, 2021-2031 (US$ mn, AGR%, CAGR%): "U" Shaped Recovery
Table 315 Rest of Europe Antibiotics Market Forecast, 2021-2031 (US$ mn, AGR%, CAGR%): "W" Shaped Recovery
Table 316 Rest of Europe Antibiotics Market Forecast, 2021-2031 (US$ mn, AGR%, CAGR%): "L" Shaped Recovery
Table 317 Rest of Europe Antibiotics Market Forecast by Drug Class, 2021-2031 (US$ mn, AGR%, CAGR%)
Table 318 Rest of Europe Antibiotics Market Forecast by Drug Class, 2021-2031 (US$ mn, AGR%, CAGR%): "V" Shaped Recovery
Table 319 Rest of Europe Antibiotics Market Forecast by Drug Class, 2021-2031 (US$ mn, AGR%, CAGR%): "U" Shaped Recovery
Table 320 Rest of Europe Antibiotics Market Forecast by Drug Class, 2021-2031 (US$ mn, AGR%, CAGR%): "W" Shaped Recovery
Table 321 Rest of Europe Antibiotics Market Forecast by Drug Class, 2021-2031 (US$ mn, AGR%, CAGR%): "L" Shaped Recovery
Table 322 Rest of Europe Antibiotics Market Forecast by Action Mechanism, 2021-2031 (US$ mn, AGR%, CAGR%)
Table 323 Rest of Europe Antibiotics Market Forecast by Action Mechanism, 2021-2031 (US$ mn, AGR%, CAGR%): "V" Shaped Recovery
Table 324 Rest of Europe Antibiotics Market Forecast by Action Mechanism, 2021-2031 (US$ mn, AGR%, CAGR%): "U" Shaped Recovery
Table 325 Rest of Europe Antibiotics Market Forecast by Action Mechanism, 2021-2031 (US$ mn, AGR%, CAGR%): "W" Shaped Recovery
Table 326 Rest of Europe Antibiotics Market Forecast by Action Mechanism, 2021-2031 (US$ mn, AGR%, CAGR%): "L" Shaped Recovery
Table 327 RoEu Antibiotics Market Forecast by Gender, 2021-2031 (US$ mn, AGR%, CAGR%)
Table 328 RoEu Antibiotics Market Forecast by Gender, 2021-2031 (US$ mn, AGR%, CAGR%): "V" Shaped Recovery
Table 329 RoEu Antibiotics Market Forecast by Gender, 2021-2031 (US$ mn, AGR%, CAGR%): "U" Shaped Recovery
Table 330 RoEu Antibiotics Market Forecast by Gender, 2021-2031 (US$ mn, AGR%, CAGR%): "W" Shaped Recovery
Table 331 RoEu Antibiotics Market Forecast by Gender, 2021-2031 (US$ mn, AGR%, CAGR%): "L" Shaped Recovery
Table 332 RoEu Antibiotics Market Forecast by Age Group, 2021-2031 (US$ mn, AGR%, CAGR%)
Table 333 RoEu Antibiotics Market Forecast by Age Group, 2021-2031 (US$ mn, AGR%, CAGR%): "V" Shaped Recovery
Table 334 RoEu Antibiotics Market Forecast by Age Group, 2021-2031 (US$ mn, AGR%, CAGR%): "U" Shaped Recovery
Table 335 RoEu Antibiotics Market Forecast by Age Group, 2021-2031 (US$ mn, AGR%, CAGR%): "W" Shaped Recovery
Table 336 RoEu Antibiotics Market Forecast by Age Group, 2021-2031 (US$ mn, AGR%, CAGR%): "L" Shaped Recovery
Table 337 RoEu Antibiotics Market Forecast by Route of Administration, 2021-2031 (US$ mn, AGR%, CAGR%)
Table 338 RoEu Antibiotics Market Forecast by Route of Administration, 2021-2031 (US$ mn, AGR%, CAGR%): "V" Shaped Recovery
Table 339 RoEu Antibiotics Market Forecast by Route of Administration, 2021-2031 (US$ mn, AGR%, CAGR%): "U" Shaped Recovery
Table 340 RoEu Antibiotics Market Forecast by Route of Administration, 2021-2031 (US$ mn, AGR%, CAGR%): "W" Shaped Recovery
Table 341 RoEu Antibiotics Market Forecast by Route of Administration, 2021-2031 (US$ mn, AGR%, CAGR%): "L" Shaped Recovery
Table 342 European Antibiotics Market: Company Ranking
Table 343 Abbott Laboratories: Key Details, (CEO, HQ, Revenue, Founded, No. of Employees, Company Type, Website, Business Segment)
Table 344 Abbott Laboratories: Product Benchmarking
Table 345 F.Hoffmann-La Roche Ltd.: Key Details, (CEO, HQ, Revenue, Founded, No. of Employees, Company Type, Website, Business Segment)
Table 346 F.Hoffmann-La Roche Ltd.: Product Benchmarking
Table 347 F.Hoffmann-La Roche Ltd.: Recent Developments, 2019-2020
Table 348 GlaxoSmithKline Plc.: Key Details, (CEO, HQ, Revenue, Founded, No. of Employees, Company Type, Website, Business Segment)
Table 349 GlaxoSmithKline Plc.: Product Benchmarking
Table 350 GlaxoSmithKline Plc.: Recent Developments, 2019-2021
Table 351 Merck & Co. Inc.: Key Details, (CEO, HQ, Revenue, Founded, No. of Employees, Company Type, Website, Business Segment)
Table 352 Merck & Co. Inc.: Product Benchmarking
Table 353 Merck & Co. Inc.: Recent Developments, 2019-2020
Table 354 Viatris: Key Details, (CEO, HQ, Revenue, Founded, No. of Employees, Company Type, Website, Business Segment)
Table 355 Viatris: Product Benchmarking
Table 356 Viatris: Recent Developments, 2019-2021
Table 357 Novartis International AG: Key Details, (CEO, HQ, Revenue, Founded, No. of Employees, Company Type, Website, Business Segment)
Table 358 Novartis International AG: Product Benchmarking
Table 359 Novartis International AG: Recent Developments, 2019-2021
Table 360 Pfizer Inc: Key Details, (CEO, HQ, Revenue, Founded, No. of Employees, Company Type, Website, Business Segment)
Table 361 Pfizer Inc: Product Benchmarking
Table 362 Pfizer Inc: Recent Developments, 2017-2020
Table 363 Sanofi: Key Details, (CEO, HQ, Revenue, Founded, No. of Employees, Company Type, Website, Business Segment)
Table 364 Sanofi: Product Benchmarking
Table 365 Teva Pharmaceutical Industries Ltd: Key Details, (CEO, HQ, Revenue, Founded, No. of Employees, Company Type, Website, Business Segment)
Table 366 Teva Pharmaceutical Industries Ltd: Product Benchmarking
Table 367 Cipla Ltd: Key Details, (CEO, HQ, Revenue, Founded, No. of Employees, Company Type, Website, Business Segment)
Table 368 Cipla Ltd: Product Benchmarking
Table 369 Cipla Ltd: Recent Developments, 2019
Table 370 Allergan (AbbVie Inc.): Key Details, (CEO, HQ, Revenue, Founded, No. of Employees, Company Type, Website, Business Segment)
Table 371 Allergan (AbbVie Inc.): Product Benchmarking
Table 372 Cumberland Pharmaceuticals, Inc: Key Details, (CEO, HQ, Revenue, Founded, No. of Employees, Company Type, Website, Business Segment)
Table 373 Cumberland Pharmaceuticals, Inc: Product Benchmarking
Table 374 Cumberland Pharmaceuticals, Inc: Recent Developments, 2017-2019
List of Figures
Figure 1 European Antibiotics Market Segmentation
Figure 2 Antibiotics Market: Market Trends
Figure 3 Antibiotics Market: SWOT Analysis
Figure 4 Porter’s Analysis
Figure 5 PEST Analysis
Figure 6 Antibiotics Market Forecast by Drug Class, 2021-2031 (US$ million, AGR %)
Figure 7 Europe Antibiotics Market Share Forecast by Drug Class, 2021, 2026, 2031 (%)
Figure 8 European Antibiotics Market for Cephalosporin Segment: Revenue Forecast 2021-2031 (US$ million, AGR%)
Figure 9 European Antibiotics Market for Cephalosporin Segment, Revenue Forecast 2021-2031 (US$ million, AGR%): “V” Shaped Recovery
Figure 10 Europe Antibiotics Market for Cephalosporin Segment, Revenue Forecast 2021-2031 (US$ million, AGR%): “U” Shaped Recovery
Figure 11 European Antibiotics Market for Cephalosporin Segment, Revenue Forecast 2021-2031 (US$ million, AGR%): “W” Shaped Recovery
Figure 12 European Antibiotics Market for Cephalosporin Segment, Revenue Forecast 2021-2031 (US$ million, AGR%): “L” Shaped Recovery
Figure 13 European Antibiotics Market for Penicillin Segment: Revenue Forecast 2021-2031 (US$ million, AGR%)
Figure 14 European Antibiotics Market for Penicillin Segment, Revenue Forecast 2021-2031 (US$ million, AGR%): “V” Shaped Recovery
Figure 15 European Antibiotics Market for Penicillin Segment, Revenue Forecast 2021-2031 (US$ million, AGR%): “U” Shaped Recovery
Figure 16 European Antibiotics Market for Penicillin Segment, Revenue Forecast 2021-2031 (US$ million, AGR%): “W” Shaped Recovery
Figure 17 European Antibiotics Market for Penicillin Segment, Revenue Forecast 2021-2031 (US$ million, AGR%): “L” Shaped Recovery
Figure 18 European Antibiotics Market for Fluoroquinolone Segment: Revenue Forecast 2021-2031 (US$ million, AGR%)
Figure 19 European Antibiotics Market for Fluoroquinolone Segment, Revenue Forecast 2021-2031 (US$ million, AGR%): “V” Shaped Recovery
Figure 20 European Antibiotics Market for Fluoroquinolone Segment, Revenue Forecast 2021-2031 (US$ million, AGR%): “U” Shaped Recovery
Figure 21 European Antibiotics Market for Fluoroquinolone Segment, Revenue Forecast 2021-2031 (US$ million, AGR%): “W” Shaped Recovery
Figure 22 European Antibiotics Market for Fluoroquinolone Segment, Revenue Forecast 2021-2031 (US$ million, AGR%): “L” Shaped Recovery
Figure 23 European Antibiotics Market for Macrolide Segment: Revenue Forecast 2021-2031 (US$ million, AGR%)
Figure 24 European Antibiotics Market for Macrolide Segment, Revenue Forecast 2021-2031 (US$ million, AGR%): “V” Shaped Recovery
Figure 25 European Antibiotics Market for Macrolide Segment, Revenue Forecast 2021-2031 (US$ million, AGR%): “U” Shaped Recovery
Figure 26 European Antibiotics Market for Macrolide Segment, Revenue Forecast 2021-2031 (US$ million, AGR%): “W” Shaped Recovery
Figure 27 European Antibiotics Market for Macrolide Segment, Revenue Forecast 2021-2031 (US$ million, AGR%): “L” Shaped Recovery
Figure 28 European Antibiotics Market for Carbapenem Segment: Revenue Forecast 2021-2031 (US$ million, AGR%)
Figure 29 European Antibiotics Market for Carbapenem Segment, Revenue Forecast 2021-2031 (US$ million, AGR%): “V” Shaped Recovery
Figure 30 European Antibiotics Market for Carbapenem Segment, Revenue Forecast 2021-2031 (US$ million, AGR%): “U” Shaped Recovery
Figure 31 European Antibiotics Market for Carbapenem Segment, Revenue Forecast 2021-2031 (US$ million, AGR%): “W” Shaped Recovery
Figure 32 European Antibiotics Market for Carbapenem Segment, Revenue Forecast 2021-2031 (US$ million, AGR%): “L” Shaped Recovery
Figure 33 European Antibiotics Market for Aminoglycoside Segment: Revenue Forecast 2021-2031 (US$ million, AGR%)
Figure 34 European Antibiotics Market for Aminoglycoside Segment, Revenue Forecast 2021-2031 (US$ million, AGR%): “V” Shaped Recovery
Figure 35 European Antibiotics Market for Aminoglycoside Segment, Revenue Forecast 2021-2031 (US$ million, AGR%): “U” Shaped Recovery
Figure 36 European Antibiotics Market for Aminoglycoside Segment, Revenue Forecast 2021-2031 (US$ million, AGR%): “W” Shaped Recovery
Figure 37 European Antibiotics Market for Aminoglycoside Segment, Revenue Forecast 2021-2031 (US$ million, AGR%): “L” Shaped Recovery
Figure 38 European Antibiotics Market for Sulfonamide Segment: Revenue Forecast 2021-2031 (US$ million, AGR%)
Figure 39 European Antibiotics Market for Sulfonamide Segment, Revenue Forecast 2021-2031 (US$ million, AGR%): “V” Shaped Recovery
Figure 40 European Antibiotics Market for Sulfonamide Segment, Revenue Forecast 2021-2031 (US$ million, AGR%): “U” Shaped Recovery
Figure 41 European Antibiotics Market for Sulfonamide Segment, Revenue Forecast 2021-2031 (US$ million, AGR%): “W” Shaped Recovery
Figure 42 European Antibiotics Market for Sulfonamide Segment, Revenue Forecast 2021-2031 (US$ million, AGR%): “L” Shaped Recovery
Figure 43 European Antibiotics Market for 7-ACA Segment: Revenue Forecast 2021-2031 (US$ million, AGR%)
Figure 44 European Antibiotics Market for 7-ACA Segment, Revenue Forecast 2021-2031 (US$ million, AGR%): “V” Shaped Recovery
Figure 45 European Antibiotics Market for 7-ACA Segment, Revenue Forecast 2021-2031 (US$ million, AGR%): “U” Shaped Recovery
Figure 46 European Antibiotics Market for 7-ACA Segment, Revenue Forecast 2021-2031 (US$ million, AGR%): “W” Shaped Recovery
Figure 47 European Antibiotics Market for 7-ACA Segment, Revenue Forecast 2021-2031 (US$ million, AGR%): “L” Shaped Recovery
Figure 48 European Antibiotics Market for Others Segment: Revenue Forecast 2021-2031 (US$ million, AGR%)
Figure 49 European Antibiotics Market for Others Segment, Revenue Forecast 2021-2031 (US$ million, AGR%): “V” Shaped Recovery
Figure 50 European Antibiotics Market for Others Segment, Revenue Forecast 2021-2031 (US$ million, AGR%): “U” Shaped Recovery
Figure 51 European Antibiotics Market for Others Segment, Revenue Forecast 2021-2031 (US$ million, AGR%): “W” Shaped Recovery
Figure 52 European Antibiotics Market for Others Segment, Revenue Forecast 2021-2031 (US$ million, AGR%): “L” Shaped Recovery
Figure 53 European Antibiotics Market Forecast by Action Mechanism, 2021-2031 (US$ million, AGR %)
Figure 54 European Antibiotics Market Share Forecast by Action Mechanism, 2021, 2026, 2031 (%)
Figure 55 European Antibiotics Market for Cell Wall Synthesis Inhibitors Segment: Revenue Forecast 2021-2031 (US$ million, AGR%)
Figure 56 European Antibiotics Market for Cell Wall Synthesis Inhibitors Segment, Revenue Forecast 2021-2031 (US$ million, AGR%): “V” Shaped Recovery
Figure 57 European Antibiotics Market for Cell Wall Synthesis Inhibitors Segment, Revenue Forecast 2021-2031 (US$ million, AGR%): “U” Shaped Recovery
Figure 58 European Antibiotics Market for Cell Wall Synthesis Inhibitors Segment, Revenue Forecast 2021-2031 (US$ million, AGR%): “W” Shaped Recovery
Figure 59 European Antibiotics Market for Cell Wall Synthesis Inhibitors Segment, Revenue Forecast 2021-2031 (US$ million, AGR%): “L” Shaped Recovery
Figure 60 European Antibiotics Market for Protein Synthesis Inhibitors Segment: Revenue Forecast 2021-2031 (US$ million, AGR%)
Figure 61 European Antibiotics Market for Protein Synthesis Inhibitors Segment, Revenue Forecast 2021-2031 (US$ million, AGR%): “V” Shaped Recovery
Figure 62 European Antibiotics Market for Protein Synthesis Inhibitors Segment, Revenue Forecast 2021-2031 (US$ million, AGR%): “U” Shaped Recovery
Figure 63 European Antibiotics Market for Protein Synthesis Inhibitors Segment, Revenue Forecast 2021-2031 (US$ million, AGR%): “W” Shaped Recovery
Figure 64 European Antibiotics Market for Protein Synthesis Inhibitors Segment, Revenue Forecast 2021-2031 (US$ million, AGR%): “L” Shaped Recovery
Figure 65 European Antibiotics Market for DNA Synthesis Inhibitors Segment: Revenue Forecast 2021-2031 (US$ million, AGR%)
Figure 66 European Antibiotics Market for DNA Synthesis Inhibitors Segment, Revenue Forecast 2021-2031 (US$ million, AGR%): “V” Shaped Recovery
Figure 67 European Antibiotics Market for DNA Synthesis Inhibitors Segment, Revenue Forecast 2021-2031 (US$ million, AGR%): “U” Shaped Recovery
Figure 68 European Antibiotics Market for DNA Synthesis Inhibitors Segment, Revenue Forecast 2021-2031 (US$ million, AGR%): “W” Shaped Recovery
Figure 69 European Antibiotics Market for DNA Synthesis Inhibitors Segment, Revenue Forecast 2021-2031 (US$ million, AGR%): “L” Shaped Recovery
Figure 70 European Antibiotics Market for RNA Synthesis Inhibitors Segment: Revenue Forecast 2021-2031 (US$ million, AGR%)
Figure 71 European Antibiotics Market for RNA Synthesis Inhibitors Segment, Revenue Forecast 2021-2031 (US$ million, AGR%): “V” Shaped Recovery
Figure 72 European Antibiotics Market for RNA Synthesis Inhibitors Segment, Revenue Forecast 2021-2031 (US$ million, AGR%): “U” Shaped Recovery
Figure 73 European Antibiotics Market for RNA Synthesis Inhibitors Segment, Revenue Forecast 2021-2031 (US$ million, AGR%): “W” Shaped Recovery
Figure 74 European Antibiotics Market for RNA Synthesis Inhibitors Segment, Revenue Forecast 2021-2031 (US$ million, AGR%): “L” Shaped Recovery
Figure 75 European Antibiotics Market for Mycolic Acid Inhibitors Segment: Revenue Forecast 2021-2031 (US$ million, AGR%)
Figure 76 European Antibiotics Market for Mycolic Acid Inhibitors Segment, Revenue Forecast 2021-2031 (US$ million, AGR%): “V” Shaped Recovery
Figure 77 European Antibiotics Market for Mycolic Acid Inhibitors Segment, Revenue Forecast 2021-2031 (US$ million, AGR%): “U” Shaped Recovery
Figure 78 European Antibiotics Market for Mycolic Acid Inhibitors Segment, Revenue Forecast 2021-2031 (US$ million, AGR%): “W” Shaped Recovery
Figure 79 European Antibiotics Market for Mycolic Acid Inhibitors Segment, Revenue Forecast 2021-2031 (US$ million, AGR%): “L” Shaped Recovery
Figure 80 European Antibiotics Market for Others Segment: Revenue Forecast 2021-2031 (US$ million, AGR%)
Figure 81 European Antibiotics Market for Others Segment, Revenue Forecast 2021-2031 (US$ million, AGR%): “V” Shaped Recovery
Figure 82 European Antibiotics Market for Others Segment, Revenue Forecast 2021-2031 (US$ million, AGR%): “U” Shaped Recovery
Figure 83 European Antibiotics Market for Others Segment, Revenue Forecast 2021-2031 (US$ million, AGR%): “W” Shaped Recovery
Figure 84 European Antibiotics Market for Others Segment, Revenue Forecast 2021-2031 (US$ million, AGR%): “L” Shaped Recovery
Figure 85 European Antibiotics Market Forecast by Gender, 2021-2031 (US$ million, AGR %)
Figure 86 European Antibiotics Market by Gender Segment, Revenue Forecast 2021-2031 (US$ million, AGR%): “V” Shaped Recovery
Figure 87 European Antibiotics Market by Gender Segment, Revenue Forecast 2021-2031 (US$ million, AGR%): “U” Shaped Recovery
Figure 88 European Antibiotics Market by Gender Segment, Revenue Forecast 2021-2031 (US$ million, AGR%): “W” Shaped Recovery
Figure 89 European Antibiotics Market by Gender Segment, Revenue Forecast 2021-2031 (US$ million, AGR%): “L” Shaped Recovery
Figure 90 European Antibiotics Market Forecast by Age Group, 2021-2031 (US$ million, AGR %)
Figure 91 European Antibiotics Market by Age Group Segment, Revenue Forecast 2021-2031 (US$ million, AGR%): “V” Shaped Recovery
Figure 92 European Antibiotics Market by Age Group Segment, Revenue Forecast 2021-2031 (US$ million, AGR%): “U” Shaped Recovery
Figure 93 European Antibiotics Market by Age Group Segment, Revenue Forecast 2021-2031 (US$ million, AGR%): “W” Shaped Recovery
Figure 94 European Antibiotics Market by Age Group Segment, Revenue Forecast 2021-2031 (US$ million, AGR%): “L” Shaped Recovery
Figure 95 European Antibiotics Market Forecast by Route of Administration, 2021-2031 (US$ million, AGR %)
Figure 96 European Antibiotics Market by Route of Administration Segment, Revenue Forecast 2021-2031 (US$ million, AGR%): “V” Shaped Recovery
Figure 97 European Antibiotics Market by Route of Administration Segment, Revenue Forecast 2021-2031 (US$ million, AGR%): “U” Shaped Recovery
Figure 98 European Antibiotics Market by Route of Administration Segment, Revenue Forecast 2021-2031 (US$ million, AGR%): “W” Shaped Recovery
Figure 99 European Antibiotics Market by Route of Administration Segment, Revenue Forecast 2021-2031 (US$ million, AGR%): “L” Shaped Recovery
Figure 100 Consumption of antibacterials for systemic use (ATC group J01) in the community, by country and ATC group level 3, EU/EEA, 2019 (expressed as DDD per 1 000 inhabitants per day)
Figure 1 Europe Antibiotics Market by Country, 2015-2020 (US$ million, AGR%)
Figure 2 Europe Antibiotics Market by Drug Class, 2015-2020 (US$ million, AGR%)
Figure 3 Europe Antibiotics Market by Action Mechanism, 2015-2020 (US$ million, AGR%)
Figure 4 Europe Antibiotics Market by Gender, 2015-2020 (US$ million, AGR%)
Figure 5 Europe Antibiotics Market by Age, 2015-2020 (US$ million, AGR%)
Figure 6 Europe Antibiotics Market by Route of Administration, 2015-2020 (US$ million, AGR%)
Figure 7 Europe Antibiotics Market Forecast by Country 2021-2031 (US$ million)
Figure 8 Europe Antibiotics Market Share Forecast by Country 2021, 2026, 2031 (%)
Figure 9 Europe Antibiotics Market by Country Forecast, 2021-2031 (US$ million, AGR%): “V” Shaped Recovery
Figure 10 Europe Antibiotics Market Country Forecast, 2021-2031 (US$ million, AGR%): “U” Shaped Recovery
Figure 11 Europe Antibiotics Market Country Forecast, 2021-2031 (US$ million, AGR%): “W” Shaped Recovery
Figure 12 Europe Antibiotics Market Country Forecast, 2021-2031 (US$ million, AGR%): “L” Shaped Recovery
Figure 13 Germany Antibiotics Market Forecast, 2021-2031 (US$ million)
Figure 14 Germany Antibiotics Market Forecast, 2021-2031 (US$ million, AGR%): “V” Shaped Recovery
Figure 15 Germany Antibiotics Market Forecast, 2021-2031 (US$ million, AGR%): “U” Shaped Recovery
Figure 16 Germany Antibiotics Market Forecast, 2021-2031 (US$ million, AGR%): “W” Shaped Recovery
Figure 17 Germany Antibiotics Market Forecast, 2021-2031 (US$ million, AGR%): “L” Shaped Recovery
Figure 18 Germany Antibiotics Market Forecast by Drug Class, 2021-2031 (US$ million, AGR%)
Figure 19 Germany Antibiotics Market Forecast by Drug Class, 2021-2031 (US$ million, AGR%): “V” Shaped Recovery
Figure 20 Germany Antibiotics Market Forecast by Drug Class, 2021-2031 (US$ million, AGR%): “U” Shaped Recovery
Figure 21 Germany Antibiotics Market Forecast by Drug Class, 2021-2031 (US$ million, AGR%): “W” Shaped Recovery
Figure 22 Germany Antibiotics Market Forecast by Drug Class, 2021-2031 (US$ million, AGR%): “L” Shaped Recovery
Figure 23 Germany Antibiotics Market Forecast by Action Mechanism, 2021-2031 (US$ million, AGR%)
Figure 24 Germany Antibiotics Market Forecast by Action Mechanism, 2021-2031 (US$ million, AGR%): “V” Shaped Recovery
Figure 25 Germany Antibiotics Market Forecast by Action Mechanism, 2021-2031 (US$ million, AGR%): “U” Shaped Recovery
Figure 26 Germany Antibiotics Market Forecast by Action Mechanism, 2021-2031 (US$ million, AGR%): “W” Shaped Recovery
Figure 27 Germany Antibiotics Market Forecast by Action Mechanism, 2021-2031 (US$ million, AGR%): “L” Shaped Recovery
Figure 28 Germany Antibiotics Market Forecast by Gender, 2021-2031 (US$ million, AGR%)
Figure 29 Germany Antibiotics Market Forecast by Gender, 2021-2031 (US$ million, AGR%): “V” Shaped Recovery
Figure 30 Germany Antibiotics Market Forecast by Gender, 2021-2031 (US$ million, AGR%): “U” Shaped Recovery
Figure 31 Germany Antibiotics Market Forecast by Gender, 2021-2031 (US$ million, AGR%): “W” Shaped Recovery
Figure 32 Germany Antibiotics Market Forecast by Gender, 2021-2031 (US$ million, AGR%): “L” Shaped Recovery
Figure 33 Germany Antibiotics Market Forecast by Age Group, 2021-2031 (US$ million, AGR%)
Figure 34 Germany Antibiotics Market Forecast by Age Group, 2021-2031 (US$ million, AGR%): “V” Shaped Recovery
Figure 35 Germany Antibiotics Market Forecast by Age Group, 2021-2031 (US$ million, AGR%): “U” Shaped Recovery
Figure 36 Germany Antibiotics Market Forecast by Age Group, 2021-2031 (US$ million, AGR%): “W” Shaped Recovery
Figure 37 Germany Antibiotics Market Forecast by Age Group, 2021-2031 (US$ million, AGR%): “L” Shaped Recovery
Figure 38 Germany Antibiotics Market Forecast by Route of Administration, 2021-2031 (US$ million, AGR%)
Figure 39 Germany Antibiotics Market Forecast by Route of Administration, 2021-2031 (US$ million, AGR%): “V” Shaped Recovery
Figure 40 Germany Antibiotics Market Forecast by Route of Administration, 2021-2031 (US$ million, AGR%): “U” Shaped Recovery
Figure 41 Germany Antibiotics Market Forecast by Route of Administration, 2021-2031 (US$ million, AGR%): “W” Shaped Recovery
Figure 42 Germany Antibiotics Market Forecast by Route of Administration, 2021-2031 (US$ million, AGR%): “L” Shaped Recovery
Figure 43 UK Antibiotics Market Forecast, 2021-2031 (US$ million)
Figure 44 UK Antibiotics Market Forecast, 2021-2031 (US$ million, AGR%): “V” Shaped Recovery
Figure 45 UK Antibiotics Market Forecast, 2021-2031 (US$ million, AGR%): “U” Shaped Recovery
Figure 46 UK Antibiotics Market Forecast, 2021-2031 (US$ million, AGR%): “W” Shaped Recovery
Figure 47 UK Antibiotics Market Forecast, 2021-2031 (US$ million, AGR%): “L” Shaped Recovery
Figure 48 UK Antibiotics Market Forecast by Drug Class, 2021-2031 (US$ million, AGR%)
Figure 49 UK Antibiotics Market Forecast by Drug Class, 2021-2031 (US$ million, AGR%): “V” Shaped Recovery
Figure 50 UK Antibiotics Market Forecast by Drug Class, 2021-2031 (US$ million, AGR%): “U” Shaped Recovery
Figure 51 UK Antibiotics Market Forecast by Drug Class, 2021-2031 (US$ million, AGR%): “W” Shaped Recovery
Figure 52 UK Antibiotics Market Forecast by Drug Class, 2021-2031 (US$ million, AGR%): “L” Shaped Recovery
Figure 53 UK Antibiotics Market Forecast by Action Mechanism, 2021-2031 (US$ million, AGR%)
Figure 54 UK Antibiotics Market Forecast by Action Mechanism, 2021-2031 (US$ million, AGR%): “V” Shaped Recovery
Figure 55 UK Antibiotics Market Forecast by Action Mechanism, 2021-2031 (US$ million, AGR%): “U” Shaped Recovery
Figure 56 UK Antibiotics Market Forecast by Action Mechanism, 2021-2031 (US$ million, AGR%): “W” Shaped Recovery
Figure 57 UK Antibiotics Market Forecast by Action Mechanism, 2021-2031 (US$ million, AGR%): “L” Shaped Recovery
Figure 58 UK Antibiotics Market Forecast by Gender, 2021-2031 (US$ million, AGR%)
Figure 59 UK Antibiotics Market Forecast by Gender, 2021-2031 (US$ million, AGR%): “V” Shaped Recovery
Figure 60 UK Antibiotics Market Forecast by Gender, 2021-2031 (US$ million, AGR%): “U” Shaped Recovery
Figure 61 UK Antibiotics Market Forecast by Gender, 2021-2031 (US$ million, AGR%): “W” Shaped Recovery
Figure 62 UK Antibiotics Market Forecast by Gender, 2021-2031 (US$ million, AGR%): “L” Shaped Recovery
Figure 63 UK Antibiotics Market Forecast by Age Group, 2021-2031 (US$ million, AGR%)
Figure 64 UK Antibiotics Market Forecast by Age Group, 2021-2031 (US$ million, AGR%): “V” Shaped Recovery
Figure 65 UK Antibiotics Market Forecast by Age Group, 2021-2031 (US$ million, AGR%): “U” Shaped Recovery
Figure 66 UK Antibiotics Market Forecast by Age Group, 2021-2031 (US$ million, AGR%): “W” Shaped Recovery
Figure 67 UK Antibiotics Market Forecast by Age Group, 2021-2031 (US$ million, AGR%): “L” Shaped Recovery
Figure 68 UK Antibiotics Market Forecast by Route of Administration, 2021-2031 (US$ million, AGR%)
Figure 69 UK Antibiotics Market Forecast by Route of Administration, 2021-2031 (US$ million, AGR%): “V” Shaped Recovery
Figure 70 UK Antibiotics Market Forecast by Route of Administration, 2021-2031 (US$ million, AGR%): “U” Shaped Recovery
Figure 71 UK Antibiotics Market Forecast by Route of Administration, 2021-2031 (US$ million, AGR%): “W” Shaped Recovery
Figure 72 UK Antibiotics Market Forecast by Route of Administration, 2021-2031 (US$ million, AGR%): “L” Shaped Recovery
Figure 73 France Antibiotics Market Forecast, 2021-2031 (US$ million)
Figure 74 France Antibiotics Market Forecast, 2021-2031 (US$ million, AGR%): “V” Shaped Recovery
Figure 75 France Antibiotics Market Forecast, 2021-2031 (US$ million, AGR%): “U” Shaped Recovery
Figure 76 France Antibiotics Market Forecast, 2021-2031 (US$ million, AGR%): “W” Shaped Recovery
Figure 77 France Antibiotics Market Forecast, 2021-2031 (US$ million, AGR%): “L” Shaped Recovery
Figure 78 France Antibiotics Market Forecast by Drug Class, 2021-2031 (US$ million, AGR%)
Figure 79 France Antibiotics Market Forecast by Drug Class, 2021-2031 (US$ million, AGR%): “V” Shaped Recovery
Figure 80 France Antibiotics Market Forecast by Drug Class, 2021-2031 (US$ million, AGR%): “U” Shaped Recovery
Figure 81 France Antibiotics Market Forecast by Drug Class, 2021-2031 (US$ million, AGR%): “W” Shaped Recovery
Figure 82 France Antibiotics Market Forecast by Drug Class, 2021-2031 (US$ million, AGR%): “L” Shaped Recovery
Figure 83 France Antibiotics Market Forecast by Action Mechanism, 2021-2031 (US$ million, AGR%)
Figure 84 France Antibiotics Market Forecast by Action Mechanism, 2021-2031 (US$ million, AGR%): “V” Shaped Recovery
Figure 85 France Antibiotics Market Forecast by Action Mechanism, 2021-2031 (US$ million, AGR%): “U” Shaped Recovery
Figure 86 France Antibiotics Market Forecast by Action Mechanism, 2021-2031 (US$ million, AGR%): “W” Shaped Recovery
Figure 87 France Antibiotics Market Forecast by Action Mechanism, 2021-2031 (US$ million, AGR%): “L” Shaped Recovery
Figure 88 France Antibiotics Market Forecast by Gender, 2021-2031 (US$ million, AGR%)
Figure 89 France Antibiotics Market Forecast by Gender, 2021-2031 (US$ million, AGR%): “V” Shaped Recovery
Figure 90 France Antibiotics Market Forecast by Gender, 2021-2031 (US$ million, AGR%): “U” Shaped Recovery
Figure 91 France Antibiotics Market Forecast by Gender, 2021-2031 (US$ million, AGR%): “W” Shaped Recovery
Figure 92 France Antibiotics Market Forecast by Gender, 2021-2031 (US$ million, AGR%): “L” Shaped Recovery
Figure 93 France Antibiotics Market Forecast by Age Group, 2021-2031 (US$ million, AGR%)
Figure 94 France Antibiotics Market Forecast by Age Group, 2021-2031 (US$ million, AGR%): “V” Shaped Recovery
Figure 95 France Antibiotics Market Forecast by Age Group, 2021-2031 (US$ million, AGR%): “U” Shaped Recovery
Figure 96 France Antibiotics Market Forecast by Age Group, 2021-2031 (US$ million, AGR%): “W” Shaped Recovery
Figure 97 France Antibiotics Market Forecast by Age Group, 2021-2031 (US$ million, AGR%): “L” Shaped Recovery
Figure 98 France Antibiotics Market Forecast by Route of Administration, 2021-2031 (US$ million, AGR%)
Figure 99 France Antibiotics Market Forecast by Route of Administration, 2021-2031 (US$ million, AGR%): “V” Shaped Recovery
Figure 100 France Antibiotics Market Forecast by Route of Administration, 2021-2031 (US$ million, AGR%): “U” Shaped Recovery
Figure 101 France Antibiotics Market Forecast by Route of Administration, 2021-2031 (US$ million, AGR%): “W” Shaped Recovery
Figure 102 France Antibiotics Market Forecast by Route of Administration, 2021-2031 (US$ million, AGR%): “L” Shaped Recovery
Figure 103 Italy Antibiotics Market Forecast, 2021-2031 (US$ million)
Figure 104 Italy Antibiotics Market Forecast, 2021-2031 (US$ million, AGR%): “V” Shaped Recovery
Figure 105 Italy Antibiotics Market Forecast, 2021-2031 (US$ million, AGR%): “U” Shaped Recovery
Figure 106 Italy Antibiotics Market Forecast, 2021-2031 (US$ million, AGR%): “W” Shaped Recovery
Figure 107 Italy Antibiotics Market Forecast, 2021-2031 (US$ million, AGR%): “L” Shaped Recovery
Figure 108 Italy Antibiotics Market Forecast by Drug Class, 2021-2031 (US$ million, AGR%)
Figure 109 Italy Antibiotics Market Forecast by Drug Class, 2021-2031 (US$ million, AGR%): “V” Shaped Recovery
Figure 110 Italy Antibiotics Market Forecast by Drug Class, 2021-2031 (US$ million, AGR%): “U” Shaped Recovery
Figure 111 Italy Antibiotics Market Forecast by Drug Class, 2021-2031 (US$ million, AGR%): “W” Shaped Recovery
Figure 112 Italy Antibiotics Market Forecast by Drug Class, 2021-2031 (US$ million, AGR%): “L” Shaped Recovery
Figure 113 Italy Antibiotics Market Forecast by Action Mechanism, 2021-2031 (US$ million, AGR%)
Figure 114 Italy Antibiotics Market Forecast by Action Mechanism, 2021-2031 (US$ million, AGR%): “V” Shaped Recovery
Figure 115 Italy Antibiotics Market Forecast by Action Mechanism, 2021-2031 (US$ million, AGR%): “U” Shaped Recovery
Figure 116 Italy Antibiotics Market Forecast by Action Mechanism, 2021-2031 (US$ million, AGR%): “W” Shaped Recovery
Figure 117 Italy Antibiotics Market Forecast by Action Mechanism, 2021-2031 (US$ million, AGR%): “L” Shaped Recovery
Figure 118 Italy Antibiotics Market Forecast by Gender, 2021-2031 (US$ million, AGR%)
Figure 119 Italy Antibiotics Market Forecast by Gender, 2021-2031 (US$ million, AGR%): “V” Shaped Recovery
Figure 120 Italy Antibiotics Market Forecast by Gender, 2021-2031 (US$ million, AGR%): “U” Shaped Recovery
Figure 121 Italy Antibiotics Market Forecast by Gender, 2021-2031 (US$ million, AGR%): “W” Shaped Recovery
Figure 122 Italy Antibiotics Market Forecast by Gender, 2021-2031 (US$ million, AGR%): “L” Shaped Recovery
Figure 123 Italy Antibiotics Market Forecast by Age Group, 2021-2031 (US$ million, AGR%)
Figure 124 Italy Antibiotics Market Forecast by Age Group, 2021-2031 (US$ million, AGR%): “V” Shaped Recovery
Figure 125 Italy Antibiotics Market Forecast by Age Group, 2021-2031 (US$ million, AGR%): “U” Shaped Recovery
Figure 126 Italy Antibiotics Market Forecast by Age Group, 2021-2031 (US$ million, AGR%): “W” Shaped Recovery
Figure 127 Italy Antibiotics Market Forecast by Age Group, 2021-2031 (US$ million, AGR%): “L” Shaped Recovery
Figure 128 Italy Antibiotics Market Forecast by Route of Administration, 2021-2031 (US$ million, AGR%)
Figure 129 Italy Antibiotics Market Forecast by Route of Administration, 2021-2031 (US$ million, AGR%): “V” Shaped Recovery
Figure 130 Italy Antibiotics Market Forecast by Route of Administration, 2021-2031 (US$ million, AGR%): “U” Shaped Recovery
Figure 131 Italy Antibiotics Market Forecast by Route of Administration, 2021-2031 (US$ million, AGR%): “W” Shaped Recovery
Figure 132 Italy Antibiotics Market Forecast by Route of Administration, 2021-2031 (US$ million, AGR%): “L” Shaped Recovery
Figure 133 Spain Antibiotics Market Forecast, 2021-2031 (US$ million)
Figure 134 Spain Antibiotics Market Forecast, 2021-2031 (US$ million, AGR%): “V” Shaped Recovery
Figure 135 Spain Antibiotics Market Forecast, 2021-2031 (US$ million, AGR%): “U” Shaped Recovery
Figure 136 Spain Antibiotics Market Forecast, 2021-2031 (US$ million, AGR%): “W” Shaped Recovery
Figure 137 Spain Antibiotics Market Forecast, 2021-2031 (US$ million, AGR%): “L” Shaped Recovery
Figure 138 Spain Antibiotics Market Forecast by Drug Class, 2021-2031 (US$ million, AGR%)
Figure 139 Spain Antibiotics Market Forecast by Drug Class, 2021-2031 (US$ million, AGR%): “V” Shaped Recovery
Figure 140 Spain Antibiotics Market Forecast by Drug Class, 2021-2031 (US$ million, AGR%): “U” Shaped Recovery
Figure 141 Spain Antibiotics Market Forecast by Drug Class, 2021-2031 (US$ million, AGR%): “W” Shaped Recovery
Figure 142 Spain Antibiotics Market Forecast by Drug Class, 2021-2031 (US$ million, AGR%): “L” Shaped Recovery
Figure 143 Spain Antibiotics Market Forecast by Action Mechanism, 2021-2031 (US$ million, AGR%)
Figure 144 Spain Antibiotics Market Forecast by Action Mechanism, 2021-2031 (US$ million, AGR%): “V” Shaped Recovery
Figure 145 Spain Antibiotics Market Forecast by Action Mechanism, 2021-2031 (US$ million, AGR%): “U” Shaped Recovery
Figure 146 Spain Antibiotics Market Forecast by Action Mechanism, 2021-2031 (US$ million, AGR%): “W” Shaped Recovery
Figure 147 Spain Antibiotics Market Forecast by Action Mechanism, 2021-2031 (US$ million, AGR%): “L” Shaped Recovery
Figure 148 Spain Antibiotics Market Forecast by Gender, 2021-2031 (US$ million, AGR%)
Figure 149 Spain Antibiotics Market Forecast by Gender, 2021-2031 (US$ million, AGR%): “V” Shaped Recovery
Figure 150 Spain Antibiotics Market Forecast by Gender, 2021-2031 (US$ million, AGR%): “U” Shaped Recovery
Figure 151 Spain Antibiotics Market Forecast by Gender, 2021-2031 (US$ million, AGR%): “W” Shaped Recovery
Figure 152 Spain Antibiotics Market Forecast by Gender, 2021-2031 (US$ million, AGR%): “L” Shaped Recovery
Figure 153 Spain Antibiotics Market Forecast by Age Group, 2021-2031 (US$ million, AGR%)
Figure 154 Spain Antibiotics Market Forecast by Age Group, 2021-2031 (US$ million, AGR%): “V” Shaped Recovery
Figure 155 Spain Antibiotics Market Forecast by Age Group, 2021-2031 (US$ million, AGR%): “U” Shaped Recovery
Figure 156 Spain Antibiotics Market Forecast by Age Group, 2021-2031 (US$ million, AGR%): “W” Shaped Recovery
Figure 157 Spain Antibiotics Market Forecast by Age Group, 2021-2031 (US$ million, AGR%): “L” Shaped Recovery
Figure 158 Spain Antibiotics Market Forecast by Route of Administration, 2021-2031 (US$ million, AGR%)
Figure 159 Spain Antibiotics Market Forecast by Route of Administration, 2021-2031 (US$ million, AGR%): “V” Shaped Recovery
Figure 160 Spain Antibiotics Market Forecast by Route of Administration, 2021-2031 (US$ million, AGR%): “U” Shaped Recovery
Figure 161 Spain Antibiotics Market Forecast by Route of Administration, 2021-2031 (US$ million, AGR%): “W” Shaped Recovery
Figure 162 Spain Antibiotics Market Forecast by Route of Administration, 2021-2031 (US$ million, AGR%): “L” Shaped Recovery
Figure 163 Russia Antibiotics Market Forecast, 2021-2031 (US$ million)
Figure 164 Russia Antibiotics Market Forecast, 2021-2031 (US$ million, AGR%): “V” Shaped Recovery
Figure 165 Russia Antibiotics Market Forecast, 2021-2031 (US$ million, AGR%): “U” Shaped Recovery
Figure 166 Russia Antibiotics Market Forecast, 2021-2031 (US$ million, AGR%): “W” Shaped Recovery
Figure 167 Russia Antibiotics Market Forecast, 2021-2031 (US$ million, AGR%): “L” Shaped Recovery
Figure 168 Russia Antibiotics Market Forecast by Drug Class, 2021-2031 (US$ million, AGR%)
Figure 169 Russia Antibiotics Market Forecast by Drug Class, 2021-2031 (US$ million, AGR%): “V” Shaped Recovery
Figure 170 Russia Antibiotics Market Forecast by Drug Class, 2021-2031 (US$ million, AGR%): “U” Shaped Recovery
Figure 171 Russia Antibiotics Market Forecast by Drug Class, 2021-2031 (US$ million, AGR%): “W” Shaped Recovery
Figure 172 Russia Antibiotics Market Forecast by Drug Class, 2021-2031 (US$ million, AGR%): “L” Shaped Recovery
Figure 173 Russia Antibiotics Market Forecast by Action Mechanism, 2021-2031 (US$ million, AGR%)
Figure 174 Russia Antibiotics Market Forecast by Action Mechanism, 2021-2031 (US$ million, AGR%): “V” Shaped Recovery
Figure 175 Russia Antibiotics Market Forecast by Action Mechanism, 2021-2031 (US$ million, AGR%): “U” Shaped Recovery
Figure 176 Russia Antibiotics Market Forecast by Action Mechanism, 2021-2031 (US$ million, AGR%): “W” Shaped Recovery
Figure 177 Russia Antibiotics Market Forecast by Action Mechanism, 2021-2031 (US$ million, AGR%): “L” Shaped Recovery
Figure 178 Russia Antibiotics Market Forecast by Gender, 2021-2031 (US$ million, AGR%)
Figure 179 Russia Antibiotics Market Forecast by Gender, 2021-2031 (US$ million, AGR%): “V” Shaped Recovery
Figure 180 Russia Antibiotics Market Forecast by Gender, 2021-2031 (US$ million, AGR%): “U” Shaped Recovery
Figure 181 Russia Antibiotics Market Forecast by Gender, 2021-2031 (US$ million, AGR%): “W” Shaped Recovery
Figure 182 Russia Antibiotics Market Forecast by Gender, 2021-2031 (US$ million, AGR%): “L” Shaped Recovery
Figure 183 Russia Antibiotics Market Forecast by Age Group, 2021-2031 (US$ million, AGR%)
Figure 184 Russia Antibiotics Market Forecast by Age Group, 2021-2031 (US$ million, AGR%): “V” Shaped Recovery
Figure 185 Russia Antibiotics Market Forecast by Age Group, 2021-2031 (US$ million, AGR%): “U” Shaped Recovery
Figure 186 Russia Antibiotics Market Forecast by Age Group, 2021-2031 (US$ million, AGR%): “W” Shaped Recovery
Figure 187 Russia Antibiotics Market Forecast by Age Group, 2021-2031 (US$ million, AGR%): “L” Shaped Recovery
Figure 188 Russia Antibiotics Market Forecast by Route of Administration, 2021-2031 (US$ million, AGR%)
Figure 189 Russia Antibiotics Market Forecast by Route of Administration, 2021-2031 (US$ million, AGR%): “V” Shaped Recovery
Figure 190 Russia Antibiotics Market Forecast by Route of Administration, 2021-2031 (US$ million, AGR%): “U” Shaped Recovery
Figure 191 Russia Antibiotics Market Forecast by Route of Administration, 2021-2031 (US$ million, AGR%): “W” Shaped Recovery
Figure 192 Russia Antibiotics Market Forecast by Route of Administration, 2021-2031 (US$ million, AGR%): “L” Shaped Recovery
Figure 193 Denmark Antibiotics Market Forecast, 2021-2031 (US$ million)
Figure 194 Denmark Antibiotics Market Forecast, 2021-2031 (US$ million, AGR%): “V” Shaped Recovery
Figure 195 Denmark Antibiotics Market Forecast, 2021-2031 (US$ million, AGR%): “U” Shaped Recovery
Figure 196 Denmark Antibiotics Market Forecast, 2021-2031 (US$ million, AGR%): “W” Shaped Recovery
Figure 197 Denmark Antibiotics Market Forecast, 2021-2031 (US$ million, AGR%): “L” Shaped Recovery
Figure 198 Denmark Antibiotics Market Forecast by Drug Class, 2021-2031 (US$ million, AGR%)
Figure 199 Denmark Antibiotics Market Forecast by Drug Class, 2021-2031 (US$ million, AGR%): “V” Shaped Recovery
Figure 200 Denmark Antibiotics Market Forecast by Drug Class, 2021-2031 (US$ million, AGR%): “U” Shaped Recovery
Figure 201 Denmark Antibiotics Market Forecast by Drug Class, 2021-2031 (US$ million, AGR%): “W” Shaped Recovery
Figure 202 Denmark Antibiotics Market Forecast by Drug Class, 2021-2031 (US$ million, AGR%): “L” Shaped Recovery
Figure 203 Denmark Antibiotics Market Forecast by Action Mechanism, 2021-2031 (US$ million, AGR%)
Figure 204 Denmark Antibiotics Market Forecast by Action Mechanism, 2021-2031 (US$ million, AGR%): “V” Shaped Recovery
Figure 205 Denmark Antibiotics Market Forecast by Action Mechanism, 2021-2031 (US$ million, AGR%): “U” Shaped Recovery
Figure 206 Denmark Antibiotics Market Forecast by Action Mechanism, 2021-2031 (US$ million, AGR%): “W” Shaped Recovery
Figure 207 Denmark Antibiotics Market Forecast by Action Mechanism, 2021-2031 (US$ million, AGR%): “L” Shaped Recovery
Figure 208 Denmark Antibiotics Market Forecast by Gender, 2021-2031 (US$ million, AGR%)
Figure 209 Denmark Antibiotics Market Forecast by Gender, 2021-2031 (US$ million, AGR%): “V” Shaped Recovery
Figure 210 Denmark Antibiotics Market Forecast by Gender, 2021-2031 (US$ million, AGR%): “U” Shaped Recovery
Figure 211 Denmark Antibiotics Market Forecast by Gender, 2021-2031 (US$ million, AGR%): “W” Shaped Recovery
Figure 212 Denmark Antibiotics Market Forecast by Gender, 2021-2031 (US$ million, AGR%): “L” Shaped Recovery
Figure 213 Denmark Antibiotics Market Forecast by Age Group, 2021-2031 (US$ million, AGR%)
Figure 214 Denmark Antibiotics Market Forecast by Age Group, 2021-2031 (US$ million, AGR%): “V” Shaped Recovery
Figure 215 Denmark Antibiotics Market Forecast by Age Group, 2021-2031 (US$ million, AGR%): “U” Shaped Recovery
Figure 216 Denmark Antibiotics Market Forecast by Age Group, 2021-2031 (US$ million, AGR%): “W” Shaped Recovery
Figure 217 Denmark Antibiotics Market Forecast by Age Group, 2021-2031 (US$ million, AGR%): “L” Shaped Recovery
Figure 218 Denmark Antibiotics Market Forecast by Route of Administration, 2021-2031 (US$ million, AGR%)
Figure 219 Denmark Antibiotics Market Forecast by Route of Administration, 2021-2031 (US$ million, AGR%): “V” Shaped Recovery
Figure 220 Denmark Antibiotics Market Forecast by Route of Administration, 2021-2031 (US$ million, AGR%): “U” Shaped Recovery
Figure 221 Denmark Antibiotics Market Forecast by Route of Administration, 2021-2031 (US$ million, AGR%): “W” Shaped Recovery
Figure 222 Denmark Antibiotics Market Forecast by Route of Administration, 2021-2031 (US$ million, AGR%): “L” Shaped Recovery
Figure 223 Norway Antibiotics Market Forecast, 2021-2031 (US$ million)
Figure 224 Norway Antibiotics Market Forecast, 2021-2031 (US$ million, AGR%): “V” Shaped Recovery
Figure 225 Norway Antibiotics Market Forecast, 2021-2031 (US$ million, AGR%): “U” Shaped Recovery
Figure 226 Norway Antibiotics Market Forecast, 2021-2031 (US$ million, AGR%): “W” Shaped Recovery
Figure 227 Norway Antibiotics Market Forecast, 2021-2031 (US$ million, AGR%): “L” Shaped Recovery
Figure 228 Norway Antibiotics Market Forecast by Drug Class, 2021-2031 (US$ million, AGR%)
Figure 229 Norway Antibiotics Market Forecast by Drug Class, 2021-2031 (US$ million, AGR%): “V” Shaped Recovery
Figure 230 Norway Antibiotics Market Forecast by Drug Class, 2021-2031 (US$ million, AGR%): “U” Shaped Recovery
Figure 231 Norway Antibiotics Market Forecast by Drug Class, 2021-2031 (US$ million, AGR%): “W” Shaped Recovery
Figure 232 Norway Antibiotics Market Forecast by Drug Class, 2021-2031 (US$ million, AGR%): “L” Shaped Recovery
Figure 233 Norway Antibiotics Market Forecast by Action Mechanism, 2021-2031 (US$ million, AGR%)
Figure 234 Norway Antibiotics Market Forecast by Action Mechanism, 2021-2031 (US$ million, AGR%): “V” Shaped Recovery
Figure 235 Norway Antibiotics Market Forecast by Action Mechanism, 2021-2031 (US$ million, AGR%): “U” Shaped Recovery
Figure 236 Norway Antibiotics Market Forecast by Action Mechanism, 2021-2031 (US$ million, AGR%): “W” Shaped Recovery
Figure 237 Norway Antibiotics Market Forecast by Action Mechanism, 2021-2031 (US$ million, AGR%): “L” Shaped Recovery
Figure 238 Norway Antibiotics Market Forecast by Gender, 2021-2031 (US$ million, AGR%)
Figure 239 Norway Antibiotics Market Forecast by Gender, 2021-2031 (US$ million, AGR%): “V” Shaped Recovery
Figure 240 Norway Antibiotics Market Forecast by Gender, 2021-2031 (US$ million, AGR%): “U” Shaped Recovery
Figure 241 Norway Antibiotics Market Forecast by Gender, 2021-2031 (US$ million, AGR%): “W” Shaped Recovery
Figure 242 Norway Antibiotics Market Forecast by Gender, 2021-2031 (US$ million, AGR%): “L” Shaped Recovery
Figure 243 Norway Antibiotics Market Forecast by Age Group, 2021-2031 (US$ million, AGR%)
Figure 244 Norway Antibiotics Market Forecast by Age Group, 2021-2031 (US$ million, AGR%): “V” Shaped Recovery
Figure 245 Norway Antibiotics Market Forecast by Age Group, 2021-2031 (US$ million, AGR%): “U” Shaped Recovery
Figure 246 Norway Antibiotics Market Forecast by Age Group, 2021-2031 (US$ million, AGR%): “W” Shaped Recovery
Figure 247 Norway Antibiotics Market Forecast by Age Group, 2021-2031 (US$ million, AGR%): “L” Shaped Recovery
Figure 248 Norway Antibiotics Market Forecast by Route of Administration, 2021-2031 (US$ million, AGR%)
Figure 249 Norway Antibiotics Market Forecast by Route of Administration, 2021-2031 (US$ million, AGR%): “V” Shaped Recovery
Figure 250 Norway Antibiotics Market Forecast by Route of Administration, 2021-2031 (US$ million, AGR%): “U” Shaped Recovery
Figure 251 Norway Antibiotics Market Forecast by Route of Administration, 2021-2031 (US$ million, AGR%): “W” Shaped Recovery
Figure 252 Norway Antibiotics Market Forecast by Route of Administration, 2021-2031 (US$ million, AGR%): “L” Shaped Recovery
Figure 253 Sweden Antibiotics Market Forecast, 2021-2031 (US$ million)
Figure 254 Sweden Antibiotics Market Forecast, 2021-2031 (US$ million, AGR%): “V” Shaped Recovery
Figure 255 Sweden Antibiotics Market Forecast, 2021-2031 (US$ million, AGR%): “U” Shaped Recovery
Figure 256 Sweden Antibiotics Market Forecast, 2021-2031 (US$ million, AGR%): “W” Shaped Recovery
Figure 257 Sweden Antibiotics Market Forecast, 2021-2031 (US$ million, AGR%): “L” Shaped Recovery
Figure 258 Sweden Antibiotics Market Forecast by Drug Class, 2021-2031 (US$ million, AGR%)
Figure 259 Sweden Antibiotics Market Forecast by Drug Class, 2021-2031 (US$ million, AGR%): “V” Shaped Recovery
Figure 260 Sweden Antibiotics Market Forecast by Drug Class, 2021-2031 (US$ million, AGR%): “U” Shaped Recovery
Figure 261 Sweden Antibiotics Market Forecast by Drug Class, 2021-2031 (US$ million, AGR%): “W” Shaped Recovery
Figure 262 Sweden Antibiotics Market Forecast by Drug Class, 2021-2031 (US$ million, AGR%): “L” Shaped Recovery
Figure 263 Sweden Antibiotics Market Forecast by Action Mechanism, 2021-2031 (US$ million, AGR%)
Figure 264 Sweden Antibiotics Market Forecast by Action Mechanism, 2021-2031 (US$ million, AGR%): “V” Shaped Recovery
Figure 265 Sweden Antibiotics Market Forecast by Action Mechanism, 2021-2031 (US$ million, AGR%): “U” Shaped Recovery
Figure 266 Sweden Antibiotics Market Forecast by Action Mechanism, 2021-2031 (US$ million, AGR%): “W” Shaped Recovery
Figure 267 Sweden Antibiotics Market Forecast by Action Mechanism, 2021-2031 (US$ million, AGR%): “L” Shaped Recovery
Figure 268 Sweden Antibiotics Market Forecast by Gender, 2021-2031 (US$ million, AGR%)
Figure 269 Sweden Antibiotics Market Forecast by Gender, 2021-2031 (US$ million, AGR%): “V” Shaped Recovery
Figure 270 Sweden Antibiotics Market Forecast by Gender, 2021-2031 (US$ million, AGR%): “U” Shaped Recovery
Figure 271 Sweden Antibiotics Market Forecast by Gender, 2021-2031 (US$ million, AGR%): “W” Shaped Recovery
Figure 272 Sweden Antibiotics Market Forecast by Gender, 2021-2031 (US$ million, AGR%): “L” Shaped Recovery
Figure 273 Sweden Antibiotics Market Forecast by Age Group, 2021-2031 (US$ million, AGR%)
Figure 274 Sweden Antibiotics Market Forecast by Age Group, 2021-2031 (US$ million, AGR%): “V” Shaped Recovery
Figure 275 Sweden Antibiotics Market Forecast by Age Group, 2021-2031 (US$ million, AGR%): “U” Shaped Recovery
Figure 276 Sweden Antibiotics Market Forecast by Age Group, 2021-2031 (US$ million, AGR%): “W” Shaped Recovery
Figure 277 Sweden Antibiotics Market Forecast by Age Group, 2021-2031 (US$ million, AGR%): “L” Shaped Recovery
Figure 278 Sweden Antibiotics Market Forecast by Route of Administration, 2021-2031 (US$ million, AGR%)
Figure 279 Sweden Antibiotics Market Forecast by Route of Administration, 2021-2031 (US$ million, AGR%): “V” Shaped Recovery
Figure 280 Sweden Antibiotics Market Forecast by Route of Administration, 2021-2031 (US$ million, AGR%): “U” Shaped Recovery
Figure 281 Sweden Antibiotics Market Forecast by Route of Administration, 2021-2031 (US$ million, AGR%): “W” Shaped Recovery
Figure 282 Sweden Antibiotics Market Forecast by Route of Administration, 2021-2031 (US$ million, AGR%): “L” Shaped Recovery
Figure 283 Finland Antibiotics Market Forecast, 2021-2031 (US$ million)
Figure 284 Finland Antibiotics Market Forecast, 2021-2031 (US$ million, AGR%): “V” Shaped Recovery
Figure 285 Finland Antibiotics Market Forecast, 2021-2031 (US$ million, AGR%): “U” Shaped Recovery
Figure 286 Finland Antibiotics Market Forecast, 2021-2031 (US$ million, AGR%): “W” Shaped Recovery
Figure 287 Finland Antibiotics Market Forecast, 2021-2031 (US$ million, AGR%): “L” Shaped Recovery
Figure 288 Finland Antibiotics Market Forecast by Drug Class, 2021-2031 (US$ million, AGR%)
Figure 289 Finland Antibiotics Market Forecast by Drug Class, 2021-2031 (US$ million, AGR%): “V” Shaped Recovery
Figure 290 Finland Antibiotics Market Forecast by Drug Class, 2021-2031 (US$ million, AGR%): “U” Shaped Recovery
Figure 291 Finland Antibiotics Market Forecast by Drug Class, 2021-2031 (US$ million, AGR%): “W” Shaped Recovery
Figure 292 Finland Antibiotics Market Forecast by Drug Class, 2021-2031 (US$ million, AGR%): “L” Shaped Recovery
Figure 293 Finland Antibiotics Market Forecast by Action Mechanism, 2021-2031 (US$ million, AGR%)
Figure 294 Finland Antibiotics Market Forecast by Action Mechanism, 2021-2031 (US$ million, AGR%): “V” Shaped Recovery
Figure 295 Finland Antibiotics Market Forecast by Action Mechanism, 2021-2031 (US$ million, AGR%): “U” Shaped Recovery
Figure 296 Finland Antibiotics Market Forecast by Action Mechanism, 2021-2031 (US$ million, AGR%): “W” Shaped Recovery
Figure 297 Finland Antibiotics Market Forecast by Action Mechanism, 2021-2031 (US$ million, AGR%): “L” Shaped Recovery
Figure 298 Finland Antibiotics Market Forecast by Gender, 2021-2031 (US$ million, AGR%)
Figure 299 Finland Antibiotics Market Forecast by Gender, 2021-2031 (US$ million, AGR%): “V” Shaped Recovery
Figure 300 Finland Antibiotics Market Forecast by Gender, 2021-2031 (US$ million, AGR%): “U” Shaped Recovery
Figure 301 Finland Antibiotics Market Forecast by Gender, 2021-2031 (US$ million, AGR%): “W” Shaped Recovery
Figure 302 Finland Antibiotics Market Forecast by Gender, 2021-2031 (US$ million, AGR%): “L” Shaped Recovery
Figure 303 Finland Antibiotics Market Forecast by Age Group, 2021-2031 (US$ million, AGR%)
Figure 304 Finland Antibiotics Market Forecast by Age Group, 2021-2031 (US$ million, AGR%): “V” Shaped Recovery
Figure 305 Finland Antibiotics Market Forecast by Age Group, 2021-2031 (US$ million, AGR%): “U” Shaped Recovery
Figure 306 Finland Antibiotics Market Forecast by Age Group, 2021-2031 (US$ million, AGR%): “W” Shaped Recovery
Figure 307 Finland Antibiotics Market Forecast by Age Group, 2021-2031 (US$ million, AGR%): “L” Shaped Recovery
Figure 308 Finland Antibiotics Market Forecast by Route of Administration, 2021-2031 (US$ million, AGR%)
Figure 309 Finland Antibiotics Market Forecast by Route of Administration, 2021-2031 (US$ million, AGR%): “V” Shaped Recovery
Figure 310 Finland Antibiotics Market Forecast by Route of Administration, 2021-2031 (US$ million, AGR%): “U” Shaped Recovery
Figure 311 Finland Antibiotics Market Forecast by Route of Administration, 2021-2031 (US$ million, AGR%): “W” Shaped Recovery
Figure 312 Finland Antibiotics Market Forecast by Route of Administration, 2021-2031 (US$ million, AGR%): “L” Shaped Recovery
Figure 313 Netherlands Antibiotics Market Forecast, 2021-2031 (US$ million)
Figure 314 Netherlands Antibiotics Market Forecast, 2021-2031 (US$ million, AGR%): “V” Shaped Recovery
Figure 315 Netherlands Antibiotics Market Forecast, 2021-2031 (US$ million, AGR%): “U” Shaped Recovery
Figure 316 Netherlands Antibiotics Market Forecast, 2021-2031 (US$ million, AGR%): “W” Shaped Recovery
Figure 317 Netherlands Antibiotics Market Forecast, 2021-2031 (US$ million, AGR%): “L” Shaped Recovery
Figure 318 Netherlands Antibiotics Market Forecast by Drug Class, 2021-2031 (US$ million, AGR%)
Figure 319 Netherlands Antibiotics Market Forecast by Drug Class, 2021-2031 (US$ million, AGR%): “V” Shaped Recovery
Figure 320 Netherlands Antibiotics Market Forecast by Drug Class, 2021-2031 (US$ million, AGR%): “U” Shaped Recovery
Figure 321 Netherlands Antibiotics Market Forecast by Drug Class, 2021-2031 (US$ million, AGR%): “W” Shaped Recovery
Figure 322 Netherlands Antibiotics Market Forecast by Drug Class, 2021-2031 (US$ million, AGR%): “L” Shaped Recovery
Figure 323 Netherlands Antibiotics Market Forecast by Action Mechanism, 2021-2031 (US$ million, AGR%)
Figure 324 Netherlands Antibiotics Market Forecast by Action Mechanism, 2021-2031 (US$ million, AGR%): “V” Shaped Recovery
Figure 325 Netherlands Antibiotics Market Forecast by Action Mechanism, 2021-2031 (US$ million, AGR%): “U” Shaped Recovery
Figure 326 Netherlands Antibiotics Market Forecast by Action Mechanism, 2021-2031 (US$ million, AGR%): “W” Shaped Recovery
Figure 327 Netherlands Antibiotics Market Forecast by Action Mechanism, 2021-2031 (US$ million, AGR%): “L” Shaped Recovery
Figure 328 Netherlands Antibiotics Market Forecast by Gender, 2021-2031 (US$ million, AGR%)
Figure 329 Netherlands Antibiotics Market Forecast by Gender, 2021-2031 (US$ million, AGR%): “V” Shaped Recovery
Figure 330 Netherlands Antibiotics Market Forecast by Gender, 2021-2031 (US$ million, AGR%): “U” Shaped Recovery
Figure 331 Netherlands Antibiotics Market Forecast by Gender, 2021-2031 (US$ million, AGR%): “W” Shaped Recovery
Figure 332 Netherlands Antibiotics Market Forecast by Gender, 2021-2031 (US$ million, AGR%): “L” Shaped Recovery
Figure 333 Netherlands Antibiotics Market Forecast by Age Group, 2021-2031 (US$ million, AGR%)
Figure 334 Netherlands Antibiotics Market Forecast by Age Group, 2021-2031 (US$ million, AGR%): “V” Shaped Recovery
Figure 335 Netherlands Antibiotics Market Forecast by Age Group, 2021-2031 (US$ million, AGR%): “U” Shaped Recovery
Figure 336 Netherlands Antibiotics Market Forecast by Age Group, 2021-2031 (US$ million, AGR%): “W” Shaped Recovery
Figure 337 Netherlands Antibiotics Market Forecast by Age Group, 2021-2031 (US$ million, AGR%): “L” Shaped Recovery
Figure 338 Netherlands Antibiotics Market Forecast by Route of Administration, 2021-2031 (US$ million, AGR%)
Figure 339 Netherlands Antibiotics Market Forecast by Route of Administration, 2021-2031 (US$ million, AGR%): “V” Shaped Recovery
Figure 340 Netherlands Antibiotics Market Forecast by Route of Administration, 2021-2031 (US$ million, AGR%): “U” Shaped Recovery
Figure 341 Netherlands Antibiotics Market Forecast by Route of Administration, 2021-2031 (US$ million, AGR%): “W” Shaped Recovery
Figure 342 Netherlands Antibiotics Market Forecast by Route of Administration, 2021-2031 (US$ million, AGR%): “L” Shaped Recovery
Figure 343 Rest of Europe Antibiotics Market Forecast, 2021-2031 (US$ million)
Figure 344 Rest of Europe Antibiotics Market Forecast, 2021-2031 (US$ million, AGR%): “V” Shaped Recovery
Figure 345 Rest of Europe Antibiotics Market Forecast, 2021-2031 (US$ million, AGR%): “U” Shaped Recovery
Figure 346 Rest of Europe Antibiotics Market Forecast, 2021-2031 (US$ million, AGR%): “W” Shaped Recovery
Figure 347 Rest of Europe Antibiotics Market Forecast, 2021-2031 (US$ million, AGR%): “L” Shaped Recovery
Figure 348 Rest of Europe Antibiotics Market Forecast by Drug Class, 2021-2031 (US$ million, AGR%)
Figure 349 Rest of Europe Antibiotics Market Forecast by Drug Class, 2021-2031 (US$ million, AGR%): “V” Shaped Recovery
Figure 350 Rest of Europe Antibiotics Market Forecast by Drug Class, 2021-2031 (US$ million, AGR%): “U” Shaped Recovery
Figure 351 Rest of Europe Antibiotics Market Forecast by Drug Class, 2021-2031 (US$ million, AGR%): “W” Shaped Recovery
Figure 352 Rest of Europe Antibiotics Market Forecast by Drug Class, 2021-2031 (US$ million, AGR%): “L” Shaped Recovery
Figure 353 Rest of Europe Antibiotics Market Forecast by Action Mechanism, 2021-2031 (US$ million, AGR%)
Figure 354 Rest of Europe Antibiotics Market Forecast by Action Mechanism, 2021-2031 (US$ million, AGR%): “V” Shaped Recovery
Figure 355 Rest of Europe Antibiotics Market Forecast by Action Mechanism, 2021-2031 (US$ million, AGR%): “U” Shaped Recovery
Figure 356 Rest of Europe Antibiotics Market Forecast by Action Mechanism, 2021-2031 (US$ million, AGR%): “W” Shaped Recovery
Figure 357 Rest of Europe Antibiotics Market Forecast by Action Mechanism, 2021-2031 (US$ million, AGR%): “L” Shaped Recovery
Figure 358 Rest of Europe Antibiotics Market Forecast by Gender, 2021-2031 (US$ million, AGR%)
Figure 359 Rest of Europe Antibiotics Market Forecast by Gender, 2021-2031 (US$ million, AGR%): “V” Shaped Recovery
Figure 360 Rest of Europe Antibiotics Market Forecast by Gender, 2021-2031 (US$ million, AGR%): “U” Shaped Recovery
Figure 361 Rest of Europe Antibiotics Market Forecast by Gender, 2021-2031 (US$ million, AGR%): “W” Shaped Recovery
Figure 362 Rest of Europe Antibiotics Market Forecast by Gender, 2021-2031 (US$ million, AGR%): “L” Shaped Recovery
Figure 363 Rest of Europe Antibiotics Market Forecast by Age Group, 2021-2031 (US$ million, AGR%)
Figure 364 Rest of Europe Antibiotics Market Forecast by Age Group, 2021-2031 (US$ million, AGR%): “V” Shaped Recovery
Figure 365 Rest of Europe Antibiotics Market Forecast by Age Group, 2021-2031 (US$ million, AGR%): “U” Shaped Recovery
Figure 366 Rest of Europe Antibiotics Market Forecast by Age Group, 2021-2031 (US$ million, AGR%): “W” Shaped Recovery
Figure 367 Rest of Europe Antibiotics Market Forecast by Age Group, 2021-2031 (US$ million, AGR%): “L” Shaped Recovery
Figure 368 Rest of Europe Antibiotics Market Forecast by Route of Administration, 2021-2031 (US$ million, AGR%)
Figure 369 Rest of Europe Antibiotics Market Forecast by Route of Administration, 2021-2031 (US$ million, AGR%): “V” Shaped Recovery
Figure 370 Rest of Europe Antibiotics Market Forecast by Route of Administration, 2021-2031 (US$ million, AGR%): “U” Shaped Recovery
Figure 371 Rest of Europe Antibiotics Market Forecast by Route of Administration, 2021-2031 (US$ million, AGR%): “W” Shaped Recovery
Figure 372 Rest of Europe Antibiotics Market Forecast by Route of Administration, 2021-2031 (US$ million, AGR%): “L” Shaped Recovery
Figure 373 Abbott Laboratories: Net Revenue, 2016-2020 (US$ million, AGR%)
Figure 374 Abbott Laboratories: R&D Expenses, 2016-2020 (US$ million, AGR%)
Figure 375 Abbott Laboratories: Gross Profit, 2016-2020 (US$ million, AGR%)
Figure 376 Abbott Laboratories: Net Income, 2016-2020 (US$ million, AGR%)
Figure 377 Abbott Laboratories: EBDITA, 2016-2020 (US$ million, AGR%)
Figure 378 F.Hoffmann-La Roche Ltd.: Net Revenue, 2016-2020 (US$ million, AGR%)
Figure 379 F.Hoffmann-La Roche Ltd.: R&D Expenses, 2016-2020 (US$ million, AGR%)
Figure 380 F.Hoffmann-La Roche Ltd.: Gross Profit, 2016-2020 (US$ million, AGR%)
Figure 381 F.Hoffmann-La Roche Ltd.: Net Income, 2016-2020 (US$ million, AGR%)
Figure 382 F.Hoffmann-La Roche Ltd.: EBDITA, 2016-2020 (US$ million, AGR%)
Figure 383 GlaxoSmithKline Plc.: Net Revenue, 2016-2020 (US$ million, AGR%)
Figure 384 GlaxoSmithKline Plc.: R&D Expenses, 2016-2020 (US$ million, AGR%)
Figure 385 GlaxoSmithKline Plc.: Gross Profit, 2016-2020 (US$ million, AGR%)
Figure 386 GlaxoSmithKline Plc.: Net Income, 2016-2020 (US$ million, AGR%)
Figure 387 GlaxoSmithKline Plc.: EBDITA, 2016-2020 (US$ million, AGR%)
Figure 388 Merck & Co. Inc.: Net Revenue, 2016-2020 (US$ million, AGR%)
Figure 389 Merck & Co. Inc.: R&D Expenses, 2016-2020 (US$ million, AGR%)
Figure 390 Merck & Co. Inc.: Gross Profit, 2016-2020 (US$ million, AGR%)
Figure 391 Merck & Co. Inc.: Net Income, 2016-2020 (US$ million, AGR%)
Figure 392 Merck & Co. Inc.: EBDITA, 2016-2020 (US$ million, AGR%)
Figure 393 Viatris: Net Revenue, 2016-2020 (US$ million, AGR%)
Figure 394 Viatris: R&D Expenses, 2016-2020 (US$ million, AGR%)
Figure 395 Viatris: Gross Profit, 2016-2020 (US$ million, AGR%)
Figure 396 Viatris: Net Income, 2016-2020 (US$ million, AGR%)
Figure 397 Viatris: EBDITA, 2016-2020 (US$ million, AGR%)
Figure 398 Novartis International AG: Net Revenue, 2016-2020 (US$ million, AGR%)
Figure 399 Novartis International AG: R&D Expenses, 2016-2020 (US$ million, AGR%)
Figure 400 Novartis International AG: Gross Profit, 2016-2020 (US$ million, AGR%)
Figure 401 Novartis International AG: Net Income, 2016-2020 (US$ million, AGR%)
Figure 402 Novartis International AG: EBDITA, 2016-2020 (US$ million, AGR%)
Figure 403 Pfizer Inc: Net Revenue, 2016-2020 (US$ million, AGR%)
Figure 404 Pfizer Inc: R&D Expenses, 2016-2020 (US$ million, AGR%)
Figure 405 Pfizer Inc: Gross Profit, 2016-2020 (US$ million, AGR%)
Figure 406 Pfizer Inc: Net Income, 2016-2020 (US$ million, AGR%)
Figure 407 Pfizer Inc: EBDITA, 2016-2020 (US$ million, AGR%)
Figure 408 Sanofi: Net Revenue, 2016-2020 (US$ million, AGR%)
Figure 409 Sanofi: R&D Expenses, 2016-2020 (US$ million, AGR%)
Figure 410 Sanofi: Gross Profit, 2016-2020 (US$ million, AGR%)
Figure 411 Sanofi: Net Income, 2016-2020 (US$ million, AGR%)
Figure 412 Sanofi: EBDITA, 2016-2020 (US$ million, AGR%)
Figure 413 Teva Pharmaceutical Industries Ltd: Net Revenue, 2016-2020 (US$ million, AGR%)
Figure 414 Teva Pharmaceutical Industries Ltd: R&D Expenses, 2016-2020 (US$ million, AGR%)
Figure 415 Teva Pharmaceutical Industries Ltd: Gross Profit, 2016-2020 (US$ million, AGR%)
Figure 416 Teva Pharmaceutical Industries Ltd: Net Income, 2016-2020 (US$ million, AGR%)
Figure 417 Teva Pharmaceutical Industries Ltd: EBDITA, 2016-2020 (US$ million, AGR%)
Figure 418 Cipla Ltd: Net Revenue, 2016-2020 (US$ million, AGR%)
Figure 419 Cipla Ltd: EBDITA, 2016-2020 (US$ million, AGR%)
Figure 420 Allergan (AbbVie Inc.): Net Revenue, 2016-2020 (US$ million, AGR%)
Figure 421 Allergan (AbbVie Inc.): R&D Expenses, 2016-2020 (US$ million, AGR%)
Figure 422 Allergan (AbbVie Inc.): Gross Profit, 2016-2020 (US$ million, AGR%)
Figure 423 Allergan (AbbVie Inc.): Net Income, 2016-2020 (US$ million, AGR%)
Figure 424 Allergan (AbbVie Inc.): EBDITA, 2016-2020 (US$ million, AGR%)
Figure 425 Cumberland Pharmaceuticals, Inc: Net Revenue, 2016-2020 (US$ million, AGR%)
Figure 426 Cumberland Pharmaceuticals, Inc: R&D Expenses, 2016-2020 (US$ million, AGR%)
Figure 427 Cumberland Pharmaceuticals, Inc: Gross Profit, 2016-2020 (US$ million, AGR%)
Figure 428 Cumberland Pharmaceuticals, Inc: Net Income, 2016-2020 (US$ million, AGR%)
Figure 429 Cumberland Pharmaceuticals, Inc: EBDITA, 2016-2020 (US$ million, AGR%)
Abbott Laboratories
Allergan (AbbVie Inc.)
Cipla Ltd
Cumberland Pharmaceuticals, Inc.
F. Hoffmann-La Roche Ltd
GlaxoSmithKline Plc
Novartis International AG
Pfizer Inc.
Sanofi
Teva Pharmaceutical Industries Ltd.
Viatris (Mylan)
List of Other Companies
Achaogen
Adenium Biotech ApS
Alaxia Pharma
Allecra Therapeutics
AstraZeneca PLC
Bayer AG
Biocidium Biopharmaceuticals
BioVersys AG
Bugworks
Cadila Healthcare
Cellceutix Corporation
Cempra
ContraFect
DAIICHI SANKYO COMPANY, LIMITED
DebioPharm
Dr. Reddy's Laboratories
Eli Lilly and Company
Evotec Pharmaceuticals
EYDO Pharma
Galapagos
Johnson & Johnson Services, Inc.
Kyorin Pharmaceutical
Macleod Pharmaceuticals
Meiji Seika Pharma
MerLion Pharmaceuticals
MGB-Biopharma
MicuRx Pharmaceuticals
Nabriva Therapeutics
Nektar Therapeutics
Northern Antibiotics
Ostuka
Paratek Pharmaceuticals
Phico Therapeutics
Redx Pharma
Savara Pharmaceuticals
SHIONOGI Co., Ltd.
Summit Therapeutics
The Medicines Company
Theravance Biopharma
Torrent Pharmaceuticals
TTY Biopharma
Unichem Laboratories
Zydus Pharmaceuticals, Inc.
List of Organizations Mentioned in the Report
Alliance for the Prudent Use of Antibiotics
American Medical Association
Antibiotic Research UK
BEAM (Biotech companies in Europe combating Anti-Microbial Resistance) Alliance
Centers for Disease Control and Prevention
European Centre for Disease Prevention and Control (ECDC)
European Medicines Agency (EMA)
Food and Drug Administration (FDA)
Global Antibiotic Research & Development Partnership (GARDP)
Global Antimicrobial Resistance Surveillance System (GLASS)
Infectious Diseases Society of America
International Society of Antimicrobial Chemotherapy
Journal of Medical Society
Microbiology Society
National Institute for Health and Clinical Excellence (NICE)
National Institutes of Health (NIH)
Society of Hospital Medicine
The British Society for Antimicrobial Chemotherapy (BSAC)
The Infectious Diseases Society of America (IDSA)
World Health Organization (WHO)
Download sample pages
Complete the form below to download your free sample pages for European Antibiotics Market Report 2021-2031Related reports
-

eClinical Solution Market Report 2019-2029
E-Clinical solution is an electronic medium of clinical study and research in pharmaceutical and biotechnical industry, the eClinical software helps...
Full DetailsPublished: 01 January 1970 -

Pharma Clinical Trial Services Market and Industry Forecast 2020-2030
The pharma clinical trial services market is expected to grow at a CAGR of 10% in the first half of...
Full DetailsPublished: 20 March 2020 -

Artificial Intelligence (AI) in Drug Discovery Market Report 2021-2031
Factors such as increasing data volumes for analysis, quick turnaround time for the discovery and development new drug, computing power,...Full DetailsPublished: 31 March 2021 -

Automation in Biopharma Industry 2020-2030
The automation in biopharma industry market is estimated to grow at a CAGR of 4.3% over the forecast period.
...Full DetailsPublished: 30 April 2020 -

Antibiotics Market Report 2021-2031
The rising prevalence of tuberculosis, malaria, pneumonia, bacterial skin infections, HIV/AIDS, urinary tract infections (UTI), and other diseases will support...Full DetailsPublished: 15 April 2021 -
HIV and HBV Therapies Market Report 2022-2032
The global HIV and HBV Therapies market is estimated to be valued at US$36.2 billion in 2022 and is projected...Full DetailsPublished: 11 November 2022 -

Global Clinical Trial Management System Market Forecast 2020-2030
The global market for clinical trial management systems was valued to be $1,152m in 2019 and is valued to reach...
Full DetailsPublished: 17 March 2020 -

Cancer Biologics Therapies Market Report 2021-2031
The main drivers for the growth include technological advancements in the development of novel biomarkers, rising preference for minimally or...Full DetailsPublished: 01 April 2021 -

Antibiotics Market Report 2023-2033
The global Antibiotics market is projected to grow at a CAGR of 4.15% by 2033...Full DetailsPublished: 31 January 2023 -
Antiviral Drugs Treatment Market Report 2021-2031
Rising incidences of viral infection; increasing geriatric population is projected to propel the demand for anti-viral drugs; advancement in anti-viral...Full DetailsPublished: 26 April 2021
Download sample pages
Complete the form below to download your free sample pages for European Antibiotics Market Report 2021-2031Do you have any custom requirements we can help you with?
Any specific country, geo region, market segment or specific company information?
Email us today, we can discuss your needs and see how we can help: jamie.roberts@visiongain.com
Would you like a free report overview of the report of your choice?
If so, please drop an email to Jamie Roberts stating your chosen report title to jamie.roberts@visiongain.com
Visiongain’s reports are based on comprehensive primary and secondary research. Those studies provide global market forecasts (sales by drug and class, with sub-markets and leading nations covered) and analyses of market drivers and restraints (including SWOT analysis) and current pipeline developments. To find out more about our reports methodology, please email jamie.roberts@visiongain.com
“Thank you for this Gene Therapy R&D Market report and for how easy the process was. Your colleague was very helpful and the report is just right for my purpose. This is the 2nd good report from Visiongain and a good price.”
Dr Luz Chapa Azuella, Mexico
American Association of Colleges of Pharmacy
American College of Clinical Pharmacy
American Pharmacists Association
American Society for Pharmacy Law
American Society of Consultant Pharmacists
American Society of Health-System Pharmacists
Association of Special Pharmaceutical Manufacturers
Australian College of Pharmacy
Biotechnology Industry Organization
Canadian Pharmacists Association
Canadian Society of Hospital Pharmacists
Chinese Pharmaceutical Association
College of Psychiatric and Neurologic Pharmacists
Danish Association of Pharmaconomists
European Association of Employed Community Pharmacists in Europe
European Medicines Agency
Federal Drugs Agency
General Medical Council
Head of Medicines Agency
International Federation of Pharmaceutical Manufacturers & Associations
International Pharmaceutical Federation
International Pharmaceutical Students’ Federation
Medicines and Healthcare Products Regulatory Agency
National Pharmacy Association
Norwegian Pharmacy Association
Ontario Pharmacists Association
Pakistan Pharmacists Association
Pharmaceutical Association of Mauritius
Pharmaceutical Group of the European Union
Pharmaceutical Society of Australia
Pharmaceutical Society of Ireland
Pharmaceutical Society Of New Zealand
Pharmaceutical Society of Northern Ireland
Professional Compounding Centers of America
Royal Pharmaceutical Society
The American Association of Pharmaceutical Scientists
The BioIndustry Association
The Controlled Release Society
The European Federation of Pharmaceutical Industries and Associations
The European Personalised Medicine Association
The Institute of Clinical Research
The International Society for Pharmaceutical Engineering
The Pharmaceutical Association of Israel
The Pharmaceutical Research and Manufacturers of America
The Pharmacy Guild of Australia
The Society of Hospital Pharmacists of Australia
Don’t Miss Out!
Latest Pharma news
Retinal Gene Therapy Market
The global Retinal Gene Therapy market is projected to grow at a CAGR of 9.6% by 2034
26 July 2024
HIV Drugs and Injectables Market
The global HIV Drugs & Injectables market is projected to grow at a CAGR of 4.6 % by 2034
24 July 2024
Digital Twin Technology in Pharmaceutical Manufacturing Market
The global Digital Twin Technology in Pharmaceutical Manufacturing market is projected to grow at a CAGR of 31.3% by 2034
23 July 2024
Specialty Pharma Market
The global Specialty Pharma market is projected to grow at a CAGR of 7.5% by 2034
22 July 2024


