Industries > Pharma > Drug Delivery Technologies Market Report 2021-2031

Drug Delivery Technologies Market Report 2021-2031
Forecasts by Technology (Oral Drug Delivery Therapy, Injectable Drug Delivery, Topical Drug Delivery, Pulmonary Drug Delivery, Implantable Drug Delivery, Ocular Drug Delivery, Others), by Indication (Infectious Diseases, Cancer, Cardiovascular Diseases, Diabetes, Respiratory Diseases, Central Nervous System Disorders, Others), by Distribution Channel (Hospitals, Homecare Settings, Others) AND Regional and Leading National Market Analysis PLUS Analysis of Leading Drug Delivery Companies AND COVID-19 Recovery Scenarios
The global Drug Delivery Technologies market was valued at US$ US$xx bn in 2020 and is projected to grow at a CAGR of xx% during the forecast period 2021-2031. The rising geriatric population, increasing prevalence of infectious diseases, cancer, cardiovascular diseases, diabetes, respiratory diseases, central nervous system disorders, and other diseases is a major driver propelling the market growth. Growing clinical advantages of advanced drug delivery system, rising R&D investments by biopharmaceutical companies, and developing healthcare infrastructure in emerging economies are some of the major factors that boost the Global Drug Delivery Technologies market.
How has COVID-19 had a significant negative impact on the Drug Delivery Technologies Market?
The COVID-19 pandemic has a significant negative impact on the Drug Delivery Technologies drug market globally. The COVID-19 outbreak in 2020 led to international border controls, country-wide lockdowns, pharmaceutical manufacturing restrictions & limitations. This pandemic has hampered the production and distribution of Drug Delivery Technologies.
COVID-19 would undoubtedly have an effect on chronic and infectious diseases patients and their care for the near future. Creating support networks for physicians and patients will help to break down walls and provide patients with appropriate access to potentially life-saving services.
This report includes data analysis and invaluable insight into how COVID-19 will affect your industry. Access this report today.
To access the data contained in this document please email contactus@visiongain.com

How this Report Will Benefit you?
Visiongain’s 530+ page report provides 356 tables and 352 charts/graphs. Our new study is suitable for anyone requiring commercial, in-depth analyses for the global Drug Delivery Technologies market, along with detailed segment analysis in the market. Our new study will help you evaluate the overall global and regional market for Drug Delivery Technologies. Get the financial analysis of the overall market and different segments including drug class, indication, patient demographics, end-user, and distribution channel and capture higher market share. We believe that high opportunity remains in this fast-growing inflammatory bowel disease drugs market. See how to use the existing and upcoming opportunities in this market to gain revenue benefits in the near future. Moreover, the report would help you to improve your strategic decision-making, allowing you to frame growth strategies, reinforce the analysis of other market players, and maximise the productivity of the company.
What are the current market drivers?
Rise in consumption of drugs is expected to propel the demand for advanced drug delivery technology. According to the WHO, the prevalence of chronic illness cases is expected to increase by 57%, with higher illness cases in low- & middle-income nations. Additionally, the outbreak of pandemics in the current & past such as COVID19, SARS, Ebola, MERS, and H1N1 have added to the upsurge in drug consumption and vaccination.
Usage convenience and cost-effectiveness of drug delivery technology further driver the market adoption. Pharmaceutical companies like Pfizer, Roche, Novartis, GSK, and BDC are constantly investing in development of drug delivery systems to enhance the oral bioavailability of novel medicines using varied excipients. Also, the rising number of patients with chronic diseases along with growing healthcare awareness is projected to boost the demand for Drug Delivery Technologies.
Where are the market opportunities?
Rising adoption of self-administrative drug delivery methods is gaining popularity. Technological advantages are supporting the development of drug delivery methods that are easily understood and conveniently used by patients without constant supervision of medical practitioner. So, drug makers are drifting from conventional drug delivery techniques to the innovative and enhanced delivery techniques, thereby improving the drug solubility, dispersion, and targeting within the patient.
Escalating investments in drug development are creating opportunities for biopharmaceutical companies to innovate novel drug delivery techniques that offer higher solubility of drugs with self-administration. For increasing the efficacy of novel drugs, the companies develop the transportation system as well, which encourages the private and the public funding agencies to invest in research of drug delivery system. In 2020, Novus Therapeutics, entered into a second phase for clinical trial for its OP0201 product. The drug is developed is combination of surfactant molecule and nasal aerosol technique device.
Need industry data? Please contact us today.
Competitive Landscape
The major players operating in the inflammatory bowel disease drugs market are Novartis AG, Gilead Sciences, Inc., GlaxoSmithKline, Pfizer Inc., F. Hoffmann-La Roche AG, Johnson & Johnson , Kindeva Drug Delivery, Eli Lilly and Company, AstraZeneca, Boehringer Ingelheim, Amgen Inc., Bristol Myers Squibb, Sanofi , Becton, Dickinson and Company (BD), Bayer AG
These leading players operating in this market have adopted various strategies comprising M&A, investment in R&D, collaborations, partnerships, regional business expansion, and new drugs launch. For instance, August 2020, Johnson entered into strategic acquisition of Momenta Pharmaceuticals, Inc. (Momenta) to expand portfolio of its novel treatment for autoimmune illness application.
To access the data contained in this document please email contactus@visiongain.com
Buy our report today Drug Delivery Technologies Market Report 2021-2031: Forecasts by Technology (Oral Drug Delivery Therapy, Injectable Drug Delivery, Topical Drug Delivery, Pulmonary Drug Delivery, Implantable Drug Delivery, Ocular Drug Delivery, Others), by Indication (Infectious Diseases, Cancer, Cardiovascular Diseases, Diabetes, Respiratory Diseases, Central Nervous System Disorders, Others), by Distribution Channel (Hospitals, Homecare Settings, Others) AND Regional and Leading National Market Analysis PLUS Analysis of Leading Drug Delivery Companies AND COVID-19 Recovery Scenarios. Avoid missing out by staying informed – order our report now.
Visiongain is a trading partner with the US Federal Government
CCR Ref number: KD4R6
Do you have any custom requirements we can help you with? Any need for a specific country, geo region, market segment or specific company information? Contact us today, we can discuss your needs and see how we can help: sara.peerun@visiongain.com
1.1 Introduction to Drug Delivery Technologies Market
1.2 Why You Should Read This Report
1.3 What This Report Delivers
1.4 Key Questions Answered By This Analytical Report Include:
1.5 Who is This Report For?
1.6 Methodology
1.6.1 Primary Research
1.6.2 Secondary Research
1.6.3 Market Evaluation & Forecast Methodology
1.7 Frequently Asked Questions (FAQs)
1.8 Associated Visiongain Reports
1.9 About Visiongain
2 Executive Summary
3 Market Dynamics
3.1 Drivers for Drug Delivery Technologies Market
3.1.1 Increasing Demand for Pharmaceuticals
3.1.2 Adoption of Advanced Drug Delivery System is projected to boost the Market Growth
3.1.3 Increasing Geriatric Population around the World is Boosting the Demand for Drug Delivery Technologies
3.1.4 Investing In Modern Drug Delivery Technology by Players To Maximise the Revenue Share in the Market
3.2 Restraints for Drug Delivery Technologies Market
3.2.1 Stringent Regulations Associated with Product Launch Hinders the Market Growth
3.2.2 Risk of Injuries Due To Needle Stick Delivery System & Poor Efficiency
3.3 Opportunities for Drug Delivery Technologies Market
3.3.1 Adoption of Self-Administrative Drug Delivery Methods is Gaining Popularity
3.3.2 Rising Awareness and Adoption for Quality Medical Treatment Due To Rising Disposable Income
3.3.3 Rising Public-Private Funding For Development, Expansion And Adoption Of Novel Drug Delivery Technologies
3.4 Trends for Drug Delivery Technologies Market
3.4.1 Outbreak of COVID-19 Pandemic
3.4.2 Reducing the Environmental Impact with Technology Advancements in Drug Delivery Technology
3.4.3 Developing Connected Drug Delivery Systems With Remote Access
3.5 SWOT Analysis for Drug Delivery Technologies Market
3.5.1 Strengths: Drug Delivery Technologies Market
3.5.1.1 Rising Need for Effective Drugs’ Absorption and Convenient Self-Administration Emphasizes the Importance of the R&D Investment
3.5.2 Weaknesses: Drug Delivery Technologies Market
3.5.2.1 Financial Loss Due To Innovative Drug Delivery Technology Failure Has Been a Perennial Problem
3.5.3 Opportunities: Drug Delivery Technologies Market
3.5.3.1 Increase in Number of Collaborations between Biopharmaceutical Companies
3.5.4 Threats: Drug Delivery Technologies Market
3.5.4.1 Adverse-Drug Reactions and Drug Delivery-Based Injuries could Limit the Adoption of Drugs
3.6 Porter’s Five Forces Analysis: Drug Delivery Technologies Market
3.6.1 Bargaining Power of Supplier: High
3.6.2 Bargaining Power of Buyer: Moderate
3.6.3 Competitive Rivalry: High
3.6.4 Threat of New Entrants: Moderate
3.6.5 Threat of Substitutes: Low
3.7 PEST Analysis: Drug Delivery Technologies Market
3.7.1 Political Factors Impacting Drug Delivery Technologies Market
3.7.2 Economic Factors Impacting Drug Delivery Technologies Market
3.7.3 Social Factors Impacting Drug Delivery Technologies Market
3.7.4 Technological Factors Impacting Drug Delivery Technologies Market
4 COVID-19 Impact: Global Drug Delivery Technologies Market
4.1 Global Drug Delivery Technologies Market Forecast, 2021-2031
4.2 COVID-19 Impact Overview
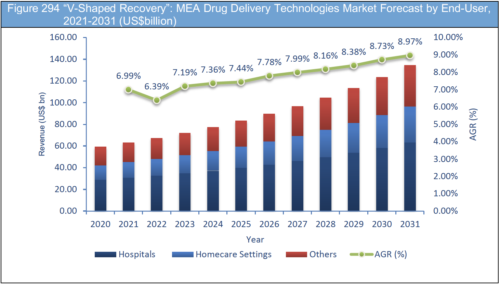
4.3 "V" shaped Recovery - Rapid Decline - Sharp Borrow -Rapid Recovery
4.4 "U" Shaped Recovery -Rapid Decline Early Then Slow - Gradual at the Bottom - Slow Recovery at First - Faster Recovery Later On
4.5 "W" Shaped Recovery -Rapid Decline - Rapid Recovery- Return of Virus - Another Sharp Decline -Recovery
4.6 "L" Shaped Recovery - Rapid Decline - Then Slow Growth
5 Global Drug Delivery Technologies Market Size Forecast 2021-2031 by Technology
5.1 Oral Drug Delivery Therapy Segment: Revenue Forecast 2021-2031
5.1.1 Oral Drug Delivery Therapy is the Largest Revenue Grossing Segment
5.1.2 Recovery Forecasts (V, U, W, L)
5.2 Injectable Drug Delivery Segment: Revenue Forecast 2021-2031
5.2.1 Rising Prevalence of Chronic Diseases is Driving Injectables Segment
5.2.2 Recovery Forecasts (V, U, W, L)
5.3 Topical Drug Delivery Segment: Revenue Forecast 2021-2031
5.3.1 Rising Incidence Of Skin & Tissue Related Illness Bosting the Adoption Of Topical Drugs
5.3.2 Recovery Forecasts (V, U, W, L)
5.4 Pulmonary Drug Delivery Segment: Revenue Forecast 2021-2031
5.4.1 Market For Pulmonary Drug Delivery Is Increasing Due To Innovations In Excipients, Propellants, And Device Technologies
5.4.2 Recovery Forecasts (V, U, W, L)
5.5 Implantable Drug Delivery Segment: Revenue Forecast 2021-2031
5.5.1 Merger Of Implantable Devices With Novel Drug Therapies, Has Considerably Increased
5.5.2 Recovery Forecasts (V, U, W, L)
5.6 Ocular Drug Delivery Segment: Revenue Forecast 2021-2031
5.6.1 Rising Investments In Research & Development
5.6.2 Recovery Forecasts (V, U, W, L)
5.7 Other Drug Delivery Technologies Segment: Revenue Forecast 2021-2031
5.7.1 Adoption Nasal Drug Delivery Technologies is expected to boost the Others Segment Growth
5.7.2 Recovery Forecasts (V, U, W, L)
6 Global Drug Delivery Technologies Market Size Forecast 2021-2031 by Indication
6.1 Infectious Diseases Therapy Segment: Revenue Forecast 2021-2031
6.1.1 Infectious Diseases Therapy is the Largest Revenue Grossing Segment
6.1.2 Recovery Forecasts (V, U, W, L)
6.2 Cancer Segment: Revenue Forecast 2021-2031
6.2.1 Adaptation Of Nanotechnology Has Also Impacted Positively On The Cancer Segment Growth
6.2.2 Recovery Forecasts (V, U, W, L)
6.3 Cardiovascular Diseases Segment: Revenue Forecast 2021-2031
6.3.1 Growing Geriatric Population, Technological Advancements, Coupled With Rising Cardiovascular Illness Are Factors Driving The Growth Of This Segment
6.3.2 Recovery Forecasts (V, U, W, L)
6.4 Diabetes Segment: Revenue Forecast 2021-2031
6.4.1 Technical Advances That Promote The Effective Drug Functioning Coupled With Minimal Administration Of Dosage
6.4.2 Recovery Forecasts (V, U, W, L)
6.5 Respiratory Diseases Segment: Revenue Forecast 2021-2031
6.5.1 Increasing Incidences Of Chronic Respiratory Disorders Is Driving The Respiratory Diseases Segment
6.5.2 Recovery Forecasts (V, U, W, L)
6.6 Central Nervous System Disorders Segment: Revenue Forecast 2021-2031
6.6.1 Public-Private Investments Are Factors Driving The Growth Of CNS Disorders Segment
6.6.2 Recovery Forecasts (V, U, W, L)
6.7 Other Indications Segment: Revenue Forecast 2021-2031
6.7.1 Other Indications Market Is Expected To Grow At A Lucrative CAGR During The Forecast Period
6.7.2 Recovery Forecasts (V, U, W, L)
7 Drug Delivery Technologies Market by End-User Forecast, 2021-2031
7.1 Hospitals Segment Market Forecast, 2021-2031
7.1.1 Hospitals Segment Accounted for the Largest Revenue Share
7.1.2 Recovery Scenarios (V, U, W, L)
7.2 Homecare Settings Segment Market Forecast, 2021-2031
7.2.1 Advancement In Portable & Wearable Medical Devices Drives the Homecare Settings Market
7.2.2 Recovery Scenarios (V, U, W, L)
7.3 Other End-User Segment: Revenue Forecast 2021-2031
7.3.1 Increasing Preference for ACS Is Driving The Growth Of This Segment
7.3.2 Recovery Forecasts (V, U, W, L)
8 National Drug Delivery Technologies Market Forecast, 2021-2031
8.1 Global Drug Delivery Technologies Market by Region Forecast 2021-2031
8.1 Recovery Scenarios (V, U, W, L)
9 North America Drug Delivery Technologies Market, 2021-2031
9.1 North America is the Largest Revenue Grossing Region in the Global Market
9.2 North America Drug Delivery Technologies Market by Country, Forecast 2021-2031
9.2.1 Recovery Scenarios (V, U, W, L): North America Drug Delivery Technologies Market Forecast by Country, 2021-2031
9.3 North America Drug Delivery Technologies Market Forecast by Technology
9.3.1 Recovery Scenarios (V, U, W, L): North America Drug Delivery Technologies Market Forecast by Technology, 2021-2031
9.4 North America Drug Delivery Technologies Market Forecast by Indication
9.4.1 Recovery Scenarios (V, U, W, L): North America Drug Delivery Technologies Market Forecast by Indication, 2021-2031
9.5 North America Drug Delivery Technologies Market Forecast by End-User
9.5.1 Recovery Scenarios (V, U, W, L): North America Drug Delivery Technologies Market Forecast by End-User, 2021-2031
9.6 U.S. Drug Delivery Technologies Market Forecast, 2021-2031
9.6.1 Presence of Leading Players is a Major factor driving the U.S. Drug Delivery Technologies Market
9.6.2 Presence of Highly Developed Healthcare Infrastructure
9.6.3 Recovery Scenarios: U.S. Drug Delivery Technologies Market Forecast, 2021-2031
9.7 Canada Drug Delivery Technologies Market Forecast, 2021-2031
9.7.1 Canada Market Anticipated To Witness the Fastest Growth in the North America Region
9.7.2 Growing Research for Drug Delivery Technologies in Canada
9.7.3 Recovery Scenarios: Canada Drug Delivery Technologies Market Forecast, 2021-2031
10 Europe Drug Delivery Technologies Market, 2021-2031
10.1 Second Largest Market in the Global Market
10.2 Europe Drug Delivery Technologies Market by Country, Forecast 2021-2031
10.2.1 Recovery Scenarios (V, U, W, L): Europe Drug Delivery Technologies Market Forecast by Country, 2021-2031
10.3 Europe Drug Delivery Technologies Market Forecast by Technology
10.3.1 Recovery Scenarios (V, U, W, L): Europe Drug Delivery Technologies Market Forecast by Technology, 2021-2031
10.4 Europe Drug Delivery Technologies Market Forecast by Indication
10.4.1 Recovery Scenarios (V, U, W, L): Europe Drug Delivery Technologies Market Forecast by Indication, 2021-2031
10.5 Europe Drug Delivery Technologies Market Forecast by End-User
10.5.1 Recovery Scenarios (V, U, W, L): Europe Drug Delivery Technologies Market Forecast by End-User, 2021-2031
10.6 Germany Drug Delivery Technologies Market Forecast, 2021-2031
10.6.1 Growing Geriatric Population In This Region Is Expected To Boost The Regional Market Growth
10.6.2 Rising Expansion of Pharmaceutical Industry in Germany
10.6.3 Recovery Scenarios: Germany Drug Delivery Technologies Market Forecast, 2021-2031
10.7 UK Drug Delivery Technologies Market Forecast, 2021-2031
10.7.1 Presence of Well-Developed R&D Infrastructure
10.7.2 Rise in Prevalence of Chronic Diseases in the UK
10.7.3 Recovery Scenarios: UK Drug Delivery Technologies Market Forecast, 2021-2031
10.8 France Drug Delivery Technologies Market Forecast, 2021-2031
10.8.1 Growing Demand for Advanced Healthcare Services
10.8.2 Pharmaceutical Companies Looking For Opportunities In The French Market
10.8.3 Recovery Scenarios: France Drug Delivery Technologies Market Forecast, 2021-2031
10.9 Italy Drug Delivery Technologies Market Forecast, 2021-2031
10.9.1 Pharmaceutical Manufacturing Hub
10.9.2 Highly Efficient Healthcare System in Italy is projected to drive the Market Growth
10.9.3 Recovery Scenarios: Italy Drug Delivery Technologies Market Forecast, 2021-2031
10.10 Spain Drug Delivery Technologies Market Forecast, 2021-2031
10.10.1 Demand for Drugs Is Influenced By the Growth of the Pharmaceutical Industry
10.10.2 Spanish Economy Is Growing Strong
10.10.3 Recovery Scenarios: Spain Drug Delivery Technologies Market Forecast, 2021-2031
10.11 Russia Drug Delivery Technologies Market Forecast, 2021-2031
10.11.1 Growing Government Support for the Development of Advanced Cancer Therapies
10.11.2 Unmet Pharmaceutical Needs
10.11.3 Recovery Scenarios: Russia Drug Delivery Technologies Market Forecast, 2021-2031
10.12 Rest of Europe Drug Delivery Technologies Market Forecast, 2021-2031
10.12.1 Increasing Prevalence of Cancer
10.12.2 Recovery Scenarios: Rest of Europe Drug Delivery Technologies Market Forecast, 2021-2031
11 Asia Pacific Drug Delivery Technologies Market, 2021-2031
11.1 Asia Pacific is the Fastest Growing Market
11.2 Asia Pacific Drug Delivery Technologies Market by Country, Forecast 2021-2031
11.2.1 Recovery Scenarios (V, U, W, L): Asia Pacific Drug Delivery Technologies Market Forecast by Country, 2021-2031
11.3 Asia Pacific Drug Delivery Technologies Market Forecast by Technology
11.3.1 Recovery Scenarios (V, U, W, L): Asia Pacific Drug Delivery Technologies Market Forecast by Technology, 2021-2031
11.4 Asia Pacific Drug Delivery Technologies Market Forecast by Indication
11.4.1 Recovery Scenarios (V, U, W, L): Asia Pacific Drug Delivery Technologies Market Forecast by Indication, 2021-2031
11.5 Asia Pacific Drug Delivery Technologies Market Forecast by End-User
11.5.1 Recovery Scenarios (V, U, W, L): Asia Pacific Drug Delivery Technologies Market Forecast by End-User, 2021-2031
11.6 Japan Drug Delivery Technologies Market Forecast, 2021-2031
11.6.1 Japan Accounted For the Largest Market Share in the Asia Pacific Region
11.6.2 Supportive Government Policies is Expected to Drive the Market Growth
11.6.3 Recovery Scenarios: Japan Drug Delivery Technologies Market Forecast, 2021-2031
11.7 China Drug Delivery Technologies Market Forecast, 2021-2031
11.7.1 Rising Prevalence of Cancer and Autoimmune Diseases in China expected to Drive the Market Growth
11.7.2 Increasing Healthcare Spending In China
11.7.3 Recovery Scenarios: China Drug Delivery Technologies Market Forecast, 2021-2031
11.8 India Drug Delivery Technologies Market Forecast, 2021-2031
11.8.1 Developing Healthcare Infrastructure
11.8.2 Increasing Prevalence of Cancer
11.8.3 Recovery Scenarios: India Drug Delivery Technologies Market Forecast, 2021-2031
11.9 Australia Drug Delivery Technologies Market Forecast, 2021-2031
11.9.1 Government Programs to Expand Access to Quality Healthcare
11.9.2 Launch of Cell-based Therapies in Australia is Projected to Boost the Market Growth
11.9.3 Recovery Scenarios: Australia Drug Delivery Technologies Market Forecast, 2021-2031
11.10 South Korea Drug Delivery Technologies Market Forecast, 2021-2031
11.10.1 Growing Healthcare Awareness among People
11.10.2 Rising Cancer Incidence is Expected to Drive theSouth Korea Market
11.10.3 Recovery Scenarios: South Korea Drug Delivery Technologies Market Forecast, 2021-2031
11.11 Rest of Asia Pacific Drug Delivery Technologies Market Forecast, 2021-2031
11.11.1 Rising Disposable Income
11.11.2 Recovery Scenarios: Rest of Asia Pacific Drug Delivery Technologies Market Forecast, 2021-2031
12 Latin America Drug Delivery Technologies Market, 2021-2031
12.1 Latin America Drug Delivery Technologies Market
12.2 Latin America Drug Delivery Technologies Market by Country, Forecast 2021-2031
12.2.1 Recovery Scenarios (V, U, W, L): Latin America Drug Delivery Technologies Market Forecast by Country, 2021-2031
12.3 Latin America Drug Delivery Technologies Market Forecast by Technology
12.3.1 Recovery Scenarios (V, U, W, L): Latin America Drug Delivery Technologies Market Forecast by Technology, 2021-2031
12.4 Latin America Drug Delivery Technologies Market Forecast by Indication
12.4.1 Recovery Scenarios (V, U, W, L): Latin America Drug Delivery Technologies Market Forecast by Indication, 2021-2031
12.5 Latin America Drug Delivery Technologies Market Forecast by End-User
12.5.1 Recovery Scenarios (V, U, W, L): Latin America Drug Delivery Technologies Market Forecast by End-User, 2021-2031
12.6 Brazil Drug Delivery Technologies Market Forecast, 2021-2031
12.6.1 Fastest Growing Economy in Latin America
12.6.2 High Potential Manufacturing Environment
12.6.3 Recovery Scenarios: Brazil Drug Delivery Technologies Market Forecast, 2021-2031
12.7 Mexico Drug Delivery Technologies Market Forecast, 2021-2031
12.7.1 Lower Manufacturing Costs than In the US
12.7.2 Strategic Initiatives Undertaken By Market Players
12.7.3 Recovery Scenarios: Mexico Drug Delivery Technologies Market Forecast, 2021-2031
12.8 Rest of Latin America Drug Delivery Technologies Market Forecast, 2021-2031
12.8.1 Evolving Healthcare Infrastructure in Latin America
12.8.2 Recovery Scenarios: Rest of Latin America Drug Delivery Technologies Market Forecast, 2021-2031
13 MEA Drug Delivery Technologies Market, 2021-2031
13.1 Rising Prevalence of Cancer in MEA Region
13.2 MEA Drug Delivery Technologies Market by Country, Forecast 2021-2031
13.2.1 Recovery Scenarios (V, U, W, L): MEA Drug Delivery Technologies Market Forecast by Country, 2021-2031
13.3 MEA Drug Delivery Technologies Market Forecast by Technology
13.3.1 Recovery Scenarios (V, U, W, L): MEA Drug Delivery Technologies Market Forecast by Technology, 2021-2031
13.4 MEA Drug Delivery Technologies Market Forecast by Indication
13.4.1 Recovery Scenarios (V, U, W, L): MEA Drug Delivery Technologies Market Forecast by Indication, 2021-2031
13.5 MEA Drug Delivery Technologies Market Forecast by End-User
13.5.1 Recovery Scenarios (V, U, W, L): MEA Drug Delivery Technologies Market Forecast by End-User, 2021-2031
13.6 South Africa Drug Delivery Technologies Market Forecast, 2021-2031
13.6.1 Prevalence of Chronic Diseases in South Africa is Increasing Rapidly
13.6.2 Polution From Mining Lead to Severe Medical Conditions
13.6.3 Recovery Scenarios: South Africa Drug Delivery Technologies Market Forecast, 2021-2031
13.7 GCC Drug Delivery Technologies Market Forecast, 2021-2031
13.7.1 Presence of Huge Growth Opportunities
13.7.2 Advances in Immuno-Oncology Have Lead In A Paradigm Change
13.7.3 Recovery Scenarios: GCC Drug Delivery Technologies Market Forecast, 2021-2031
13.8 Rest of MEA Drug Delivery Technologies Market Forecast, 2021-2031
13.8.1 Cancer Is One of the Leading Causes of Death in Rest of MEA
13.8.2 Recovery Scenarios: Rest of MEA Drug Delivery Technologies Market Forecast, 2021-2031
14 Company Profiles: Drug Delivery Technologies Market
14.1 Drug Delivery Technologies Market: Company Share Analysis
14.2 Drug Delivery Technologies Market Recent Developments, 2018-2021
14.3 Novartis AG
14.3.1 Company Snapshot
14.3.2 Company Overview
14.3.3 Financial Analysis
14.3.3.1 Net Revenue, 2016-2020
14.3.3.2 Business Segments Revenue Shares, 2020
14.3.3.3 Pharmaceuticals Business Unit Revenue Shares, 2020
14.3.3.4 Regional Revenue Shares, 2020
14.3.4 Product Benchmarking
14.3.5 Recent Developments, 2017-2021
14.4 Gilead Sciences, Inc.
14.4.1 Company Snapshot
14.4.2 Company Overview
14.4.3 Financial Analysis
14.4.3.1 Net Revenue, 2016-2020
14.4.3.2 Business Segments Revenue Shares, 2020
14.4.3.3 Regional Revenue Shares, 2020
14.4.4 Product Benchmarking
14.4.5 Recent Developments
14.5 GlaxoSmithKline plc.
14.5.1 Company Snapshot
14.5.2 Company Overview
14.5.3 Financial Analysis
14.5.3.1 Revenue, 2016-2020
14.5.3.2 Pharmaceutical Business Revenue Share, 2020
14.5.3.3 Regional Revenue Shares, 2020
14.5.4 Product Benchmarking
14.5.5 Recent Developments, 2018-2021
14.6 Pfizer Inc.
14.6.1 Company Snapshot
14.6.2 Company Overview
14.6.3 Financial Analysis
14.6.3.1 Net Revenue, 2016-2020
14.6.3.2 Product Revenue Shares, 2020
14.6.3.3 Regional Revenue Shares, 2020
14.6.4 Product Benchmarking
14.6.5 Recent Developments, 2018-2021
14.7 F. Hoffmann-La Roche Ltd.
14.7.1 Company Snapshot
14.7.2 Company Overview
14.7.3 Financial Analysis
14.7.3.1 Net Revenue, 2016-2020
14.7.3.2 Product Revenue Shares, 2020
14.7.3.3 Regional Revenue Shares, 2020
14.7.4 Product Benchmarking
14.7.5 Recent Developments, 2018-2021
14.8 Johnson & Johnson
14.8.1 Company Snapshot
14.8.2 Company Overview
14.8.3 Financial Analysis
14.8.3.1 Revenue, 2016-2020
14.8.3.2 Product Revenue Share, 2020
14.8.3.3 Region Revenue Share, 2020
14.8.4 Product Benchmarking
14.8.5 Recent Developments, 2018-2021
14.9 KINDEVA DRUG DELIVERY
14.9.1 Company Snapshot
14.9.2 Company Overview
14.9.3 Financial Analysis
14.9.3.1 Net Revenue, 2016-2020
14.9.4 Product Benchmarking
14.9.5 Recent Developments, 2018-2021
14.10 Eli Lilly and Company
14.10.1 Company Snapshot
14.10.2 Company Overview
14.10.3 Financial Analysis
14.10.3.1 Net Revenue, 2016-2020
14.10.4 Product Benchmarking
14.10.5 Recent Developments, 2018-2021
14.11 AstraZeneca
14.11.1 Company Snapshot
14.11.2 Company Overview
14.11.3 Financial Analysis
14.11.3.1 Net Revenue, 2016-2020
14.11.3.2 Product Revenue Shares, 2020
14.11.3.3 Regional Revenue Shares, 2020
14.11.4 Product Benchmarking
14.11.5 Recent Developments, 2018-2021
14.12 Boehringer Ingelheim International GmbH
14.12.1 Company Snapshot
14.12.2 Company Overview
14.12.3 Financial Analysis
14.12.3.1 Net Revenue, 2016-2020
14.12.3.2 Product Revenue Share, 2020
14.12.3.3 Region Revenue Share, 2020
14.12.4 Product Benchmarking
14.12.5 Recent Developments, 2018-2021
14.13 Amgen Inc.
14.13.1 Company Snapshot
14.13.2 Company Overview
14.13.3 Financial Analysis
14.13.3.1 Net Revenue, 2016-2020
14.13.4 Product Benchmarking
14.13.5 Recent Developments, 2018-2021
14.14 Bristol-Myers Squibb Company
14.14.1 Company Snapshot
14.14.2 Company Overview
14.14.3 Financial Analysis
14.14.3.1 Net Revenue, 2016-2020
14.14.3.2 Regional Revenue Shares, 2020
14.14.4 Product Benchmarking
14.14.5 Recent Developments, 2018-2021
14.15 Sanofi
14.15.1 Company Snapshot
14.15.2 Company Overview
14.15.3 Financial Analysis
14.15.3.1 Net Revenue, 2016-2020
14.15.3.2 Product Revenue Share, 2020
14.15.3.3 Region Revenue Share, 2020
14.15.4 Product Benchmarking
14.15.5 Recent Developments, 2018-2021
14.16 Becton, Dickinson and Company
14.16.1 Company Snapshot
14.16.2 Company Overview
14.16.3 Financial Analysis
14.16.3.1 Net Revenue, 2016-2020
14.16.3.2 Product Revenue Share, 2020
14.16.3.3 Region Revenue Share, 2020
14.16.4 Product Benchmarking
14.16.5 Recent Developments, 2018-2021
14.17 Bayer AG
14.17.1 Company Snapshot
14.17.2 Company Overview
14.17.3 Financial Analysis
14.17.3.1 Net Revenue, 2016-2020
14.17.3.2 Product Revenue Share, 2020
14.17.3.3 Region Revenue Share, 2020
14.17.4 Product Benchmarking
14.17.5 Recent Developments, 2018-2021
15 Conclusion and Recommendations
15.1 Concluding Remarks from Visiongain
15.2 Recommendations for Market Players
15.3 Leading Regions and Fastest Growing Region (North America Region Accounted for the Largest Market Share)
List of Tables
Table 1 Global Drug Delivery Technologies Market, 2020 & 2031 (US$bn, CAGR %)
Table 2 Major M&A and Collaborations: Drug Delivery Market
Table 3 Global Drug Delivery Technologies Market Size Forecast: Revenue ($bn), AGR (%), CAGR (%), 2021-2031
Table 4 Global Drug Delivery Technologies Market Size Forecast: Revenue ($bn), AGR (%), CAGR (%), 2021-2031: "V" Shaped Recovery
Table 5 Global Drug Delivery Technologies Market Size Forecast: Revenue ($bn), AGR (%), CAGR (%), 2021-2031: "U" Shaped Recovery
Table 6 Global Drug Delivery Technologies Market Size Forecast: Revenue ($bn), AGR (%), CAGR (%), 2021-2031: "W" Shaped Recovery
Table 7 Global Drug Delivery Technologies Market Size Forecast: Revenue ($bn), AGR (%), CAGR (%), 2021-2031: "L" Shaped Recovery
Table 8 Global Drug Delivery Technologies Market Forecast by Technology, 2021-2031 (US$billion, AGR %, CAGR %)
Table 9 Global Oral Drug Delivery Therapy Segment: Revenue Forecast 2021-2031 (US$billion, AGR%, CAGR%)
Table 10 “V” Shaped Recovery: Global Oral Drug Delivery Therapy Segment: Revenue Forecast 2021-2031 (US$billion, AGR%, CAGR%)
Table 11 “U” Shaped Recovery: Global Oral Drug Delivery Therapy Segment: Revenue Forecast 2021-2031 (US$billion, AGR%, CAGR%)
Table 12 “W” Shaped Recovery: Global Oral Drug Delivery Therapy Segment: Revenue Forecast 2021-2031 (US$billion, AGR%, CAGR%)
Table 13 “L” Shaped Recovery: Global Oral Drug Delivery Therapy Segment: Revenue Forecast 2021-2031 (US$billion, AGR%, CAGR%)
Table 14 Global Injectable Drug Delivery Segment: Revenue Forecast 2021-2031 (US$billion, AGR%, CAGR%)
Table 15 “V” Shaped Recovery: Global Injectable Drug Delivery Segment, Revenue Forecast 2021-2031 (US$billion, AGR%, CAGR%)
Table 16 “U” Shaped Recovery: Global Injectable Drug Delivery Segment, Revenue Forecast 2021-2031 (US$billion, AGR%, CAGR%)
Table 17 “W” Shaped Recovery: Global Injectable Drug Delivery Segment, Revenue Forecast 2021-2031 (US$billion, AGR%, CAGR%)
Table 18 “L” Shaped Recovery: Global Injectable Drug Delivery Segment, Revenue Forecast 2021-2031 (US$billion, AGR%, CAGR%)
Table 19 Global Topical Drug Delivery Segment: Revenue Forecast 2021-2031 (US$billion, AGR%, CAGR%)
Table 20 “V” Shaped Recovery: Global Topical Drug Delivery Segment, Revenue Forecast 2021-2031 (US$billion, AGR%, CAGR%)
Table 21 “U” Shaped Recovery: Global Topical Drug Delivery Segment, Revenue Forecast 2021-2031 (US$billion, AGR%, CAGR%)
Table 22 “W” Shaped Recovery: Global Topical Drug Delivery Segment, Revenue Forecast 2021-2031 (US$billion, AGR%, CAGR%)
Table 23 “L” Shaped Recovery: Global Topical Drug Delivery Segment, Revenue Forecast 2021-2031 (US$billion, AGR%, CAGR%)
Table 24 Global Pulmonary Drug Delivery Segment: Revenue Forecast 2021-2031 (US$billion, AGR%, CAGR%)
Table 25 “V” Shaped Recovery: Global Pulmonary Drug Delivery Segment, Revenue Forecast 2021-2031 (US$billion, AGR%, CAGR%)
Table 26 “U” Shaped Recovery: Global Pulmonary Drug Delivery Segment, Revenue Forecast 2021-2031 (US$billion, AGR%, CAGR%)
Table 27 “W” Shaped Recovery: Global Pulmonary Drug Delivery Segment, Revenue Forecast 2021-2031 (US$billion, AGR%, CAGR%)
Table 28 “L” Shaped Recovery: Global Pulmonary Drug Delivery Segment, Revenue Forecast 2021-2031 (US$billion, AGR%, CAGR%)
Table 29 Global Implantable Drug Delivery Segment: Revenue Forecast 2021-2031 (US$billion, AGR%, CAGR%)
Table 30 “V” Shaped Recovery: Global Implantable Drug Delivery Segment, Revenue Forecast 2021-2031 (US$billion, AGR%, CAGR%)
Table 31 “U” Shaped Recovery: Global Implantable Drug Delivery Segment, Revenue Forecast 2021-2031 (US$billion, AGR%, CAGR%)
Table 32 “W” Shaped Recovery: Global Implantable Drug Delivery Segment, Revenue Forecast 2021-2031 (US$billion, AGR%, CAGR%)
Table 33 “L” Shaped Recovery: Global Implantable Drug Delivery Segment, Revenue Forecast 2021-2031 (US$billion, AGR%, CAGR%)
Table 34 Global Ocular Drug Delivery Segment: Revenue Forecast 2021-2031 (US$billion, AGR%, CAGR%)
Table 35 “V” Shaped Recovery: Global Ocular Drug Delivery Segment, Revenue Forecast 2021-2031 (US$billion, AGR%, CAGR%)
Table 36 “U” Shaped Recovery: Global Ocular Drug Delivery Segment, Revenue Forecast 2021-2031 (US$billion, AGR%, CAGR%)
Table 37 “W” Shaped Recovery: Global Ocular Drug Delivery Segment, Revenue Forecast 2021-2031 (US$billion, AGR%, CAGR%)
Table 38 “L” Shaped Recovery: Global Ocular Drug Delivery Segment, Revenue Forecast 2021-2031 (US$billion, AGR%, CAGR%)
Table 39 Global Others Segment: Revenue Forecast 2021-2031 (US$billion, AGR%, CAGR%)
Table 40 “V” Shaped Recovery: Global Others Segment, Revenue Forecast 2021-2031 (US$billion, AGR%, CAGR%)
Table 41 “U” Shaped Recovery: Global Others Segment, Revenue Forecast 2021-2031 (US$billion, AGR%, CAGR%)
Table 42 “W” Shaped Recovery: Global Others Segment, Revenue Forecast 2021-2031 (US$billion, AGR%, CAGR%)
Table 43 “L” Shaped Recovery: Global Others Segment, Revenue Forecast 2021-2031 (US$billion, AGR%, CAGR%)
Table 44 Global Drug Delivery Technologies Market Size Forecast by Indication, 2021-2031 (US$billion, AGR %, CAGR %)
Table 45 Global Infectious Diseases Therapy Segment: Revenue Forecast 2021-2031 (US$billion, AGR%, CAGR%)
Table 46 “V” Shaped Recovery: Global Infectious Diseases Therapy Segment: Revenue Forecast 2021-2031 (US$billion, AGR%, CAGR%)
Table 47 “U” Shaped Recovery: Global Infectious Diseases Therapy Segment: Revenue Forecast 2021-2031 (US$billion, AGR%, CAGR%)
Table 48 “W” Shaped Recovery: Global Infectious Diseases Therapy Segment: Revenue Forecast 2021-2031 (US$billion, AGR%, CAGR%)
Table 49 “L” Shaped Recovery: Global Infectious Diseases Therapy Segment: Revenue Forecast 2021-2031 (US$billion, AGR%, CAGR%)
Table 50 Global Cancer Segment: Revenue Forecast 2021-2031 (US$billion, AGR%, CAGR%)
Table 51 “V” Shaped Recovery: Global Cancer Segment, Revenue Forecast 2021-2031 (US$billion, AGR%, CAGR%)
Table 52 “U” Shaped Recovery: Global Cancer Segment, Revenue Forecast 2021-2031 (US$billion, AGR%, CAGR%)
Table 53 “W” Shaped Recovery: Global Cancer Segment, Revenue Forecast 2021-2031 (US$billion, AGR%, CAGR%)
Table 54 “L” Shaped Recovery: Global Cancer Segment, Revenue Forecast 2021-2031 (US$billion, AGR%, CAGR%)
Table 55 Global Cardiovascular Diseases Segment: Revenue Forecast 2021-2031 (US$billion, AGR%, CAGR%)
Table 56 “V” Shaped Recovery: Global Cardiovascular Diseases Segment, Revenue Forecast 2021-2031 (US$billion, AGR%, CAGR%)
Table 57 “U” Shaped Recovery: Global Cardiovascular Diseases Segment, Revenue Forecast 2021-2031 (US$billion, AGR%, CAGR%)
Table 58 “W” Shaped Recovery: Global Cardiovascular Diseases Segment, Revenue Forecast 2021-2031 (US$billion, AGR%, CAGR%)
Table 59 “L” Shaped Recovery: Global Cardiovascular Diseases Segment, Revenue Forecast 2021-2031 (US$billion, AGR%, CAGR%)
Table 60 Global Diabetes Segment: Revenue Forecast 2021-2031 (US$billion, AGR%, CAGR%)
Table 61 “V” Shaped Recovery: Global Diabetes Segment, Revenue Forecast 2021-2031 (US$billion, AGR%, CAGR%)
Table 62 “U” Shaped Recovery: Global Diabetes Segment, Revenue Forecast 2021-2031 (US$billion, AGR%, CAGR%)
Table 63 “W” Shaped Recovery: Global Diabetes Segment, Revenue Forecast 2021-2031 (US$billion, AGR%, CAGR%)
Table 64 “L” Shaped Recovery: Global Diabetes Segment, Revenue Forecast 2021-2031 (US$billion, AGR%, CAGR%)
Table 65 Global Respiratory Diseases Segment: Revenue Forecast 2021-2031 (US$billion, AGR%, CAGR%)
Table 66 “V” Shaped Recovery: Global Respiratory Diseases Segment, Revenue Forecast 2021-2031 (US$billion, AGR%, CAGR%)
Table 67 “U” Shaped Recovery: Global Respiratory Diseases Segment, Revenue Forecast 2021-2031 (US$billion, AGR%, CAGR%)
Table 68 “W” Shaped Recovery: Global Respiratory Diseases Segment, Revenue Forecast 2021-2031 (US$billion, AGR%, CAGR%)
Table 69 “L” Shaped Recovery: Global Respiratory Diseases Segment, Revenue Forecast 2021-2031 (US$billion, AGR%, CAGR%)
Table 70 Global Central Nervous System Disorders Segment: Revenue Forecast 2021-2031 (US$billion, AGR%, CAGR%)
Table 71 “V” Shaped Recovery: Global Central Nervous System Disorders Segment, Revenue Forecast 2021-2031 (US$billion, AGR%, CAGR%)
Table 72 “U” Shaped Recovery: Global Central Nervous System Disorders Segment, Revenue Forecast 2021-2031 (US$billion, AGR%, CAGR%)
Table 73 “W” Shaped Recovery: Global Central Nervous System Disorders Segment, Revenue Forecast 2021-2031 (US$billion, AGR%, CAGR%)
Table 74 “L” Shaped Recovery: Global Central Nervous System Disorders Segment, Revenue Forecast 2021-2031 (US$billion, AGR%, CAGR%)
Table 75 Global Other Indications Segment: Revenue Forecast 2021-2031 (US$billion, AGR%, CAGR%)
Table 76 “V” Shaped Recovery: Global Other Indications Segment, Revenue Forecast 2021-2031 (US$billion, AGR%, CAGR%)
Table 77 “U” Shaped Recovery: Global Other Indications Segment, Revenue Forecast 2021-2031 (US$billion, AGR%, CAGR%)
Table 78 “W” Shaped Recovery: Global Other Indications Segment, Revenue Forecast 2021-2031 (US$billion, AGR%, CAGR%)
Table 79 “L” Shaped Recovery: Global Other Indications Segment, Revenue Forecast 2021-2031 (US$billion, AGR%, CAGR%)
Table 80 Global Drug Delivery Technologies Market Forecast by End-User, 2021-2031 (US$bn, AGR%, CAGR%)
Table 81 Global Hospitals Segment Forecast, 2021-2031 (US$bn, AGR%, CAGR%)
Table 82 Global Hospitals Segment Forecast, 2021-2031 (US$bn, AGR%, CAGR%): "V" Shaped Recovery
Table 83 Global Hospitals Segment Forecast, 2021-2031 (US$bn, AGR%, CAGR%): "U" Shaped Recovery
Table 84 Global Hospitals Segment Forecast, 2021-2031 (US$bn, AGR%, CAGR%): "W" Shaped Recovery
Table 85 Global Hospitals Segment Forecast, 2021-2031 (US$bn, AGR%, CAGR%): "L" Shaped Recovery
Table 86 Global Homecare Settings Segment Forecast, 2021-2031 (US$bn, AGR%, CAGR%)
Table 87 Global Homecare Settings Segment Forecast, 2021-2031 (US$bn, AGR%, CAGR%): "V" Shaped Recovery
Table 88 Global Homecare Settings Segment Forecast, 2021-2031 (US$bn, AGR%, CAGR%): "U" Shaped Recovery
Table 89 Global Homecare Settings Segment Forecast, 2021-2031 (US$bn, AGR%, CAGR%): "W" Shaped Recovery
Table 90 Global Homecare Settings Segment Forecast, 2021-2031 (US$bn, AGR%, CAGR%): "L" Shaped Recovery
Table 91 Global Other End-User Segment: Revenue Forecast 2021-2031 (US$billion, AGR%, CAGR%)
Table 92 “V” Shaped Recovery: Global Other End-User Segment, Revenue Forecast 2021-2031 (US$billion, AGR%, CAGR%)
Table 93 “U” Shaped Recovery: Global Other End-User Segment, Revenue Forecast 2021-2031 (US$billion, AGR%, CAGR%)
Table 94 “W” Shaped Recovery: Global Other End-User Segment, Revenue Forecast 2021-2031 (US$billion, AGR%, CAGR%)
Table 95 “L” Shaped Recovery: Global Other End-User Segment, Revenue Forecast 2021-2031 (US$billion, AGR%, CAGR%)
Table 96 Global Drug Delivery Technologies Market Forecast by Region, 2021-2031 (US$bn, AGR%, CAGR%)
Table 97 Global Drug Delivery Technologies Market Forecast by Region, 2021-2031 (US$bn, AGR%, CAGR%): "V" Shaped Recovery
Table 98 Global Drug Delivery Technologies Market Forecast by Region, 2021-2031 (US$bn, AGR%, CAGR%): "U" Shaped Recovery
Table 99 Global Drug Delivery Technologies Market Forecast by Region, 2021-2031 (US$bn, AGR%, CAGR%): "W" Shaped Recovery
Table 100 Global Drug Delivery Technologies Market Forecast by Region, 2021-2031 (US$bn, AGR%, CAGR%): "L" Shaped Recovery
Table 101 North America Drug Delivery Technologies Market Forecast, 2021-2031 (US$bn, AGR%, CAGR%)
Table 102 North America Drug Delivery Technologies Market Forecast by Country, 2021-2031 (US$bn, AGR%, CAGR%)
Table 103 “V-Shaped Recovery”: North America Drug Delivery Technologies Market Forecast by Country, 2021-2031 (US$bn, AGR%, CAGR%)
Table 104 “U-Shaped Recovery”: North America Drug Delivery Technologies Market Forecast by Country, 2021-2031 (US$bn, AGR%, CAGR%)
Table 105 “W-Shaped Recovery”: North America Drug Delivery Technologies Market Forecast by Country, 2021-2031 (US$bn, AGR%, CAGR%)
Table 106 “L-Shaped Recovery”: North America Drug Delivery Technologies Market Forecast by Country, 2021-2031 (US$bn, AGR%, CAGR%)
Table 107 North America Drug Delivery Technologies Market Forecast by Technology, 2021-2031 (US$billion, AGR %, CAGR %)
Table 108 “V-Shaped Recovery”: North America Drug Delivery Technologies Market Forecast by Technology, 2021-2031 (US$billion, AGR %, CAGR %)
Table 109 “U-Shaped Recovery”: North America Drug Delivery Technologies Market Forecast by Technology, 2021-2031 (US$billion, AGR %, CAGR %)
Table 110 “W-Shaped Recovery”: North America Drug Delivery Technologies Market Forecast by Technology, 2021-2031 (US$billion, AGR %, CAGR %)
Table 111 “L-Shaped Recovery”: North America Drug Delivery Technologies Market Forecast by Technology, 2021-2031 (US$billion, AGR %, CAGR %)
Table 112 North America Drug Delivery Technologies Market Forecast by indiation, 2021-2031 (US$billion, AGR %, CAGR %)
Table 113 “V-Shaped Recovery”: North America Drug Delivery Technologies Market Forecast by indiation, 2021-2031 (US$billion, AGR %, CAGR %)
Table 114 “U-Shaped Recovery”: North America Drug Delivery Technologies Market Forecast by indiation, 2021-2031 (US$billion, AGR %, CAGR %)
Table 115 “W-Shaped Recovery”: North America Drug Delivery Technologies Market Forecast by indiation, 2021-2031 (US$billion, AGR %, CAGR %)
Table 116 “L-Shaped Recovery”: North America Drug Delivery Technologies Market Forecast by indiation, 2021-2031 (US$billion, AGR %, CAGR %)
Table 117 North America Drug Delivery Technologies Market Forecast by End-User, 2021-2031 (US$bn, AGR%, CAGR%)
Table 118 “V-Shaped Recovery”: North America Drug Delivery Technologies Market Forecast by End-User, 2021-2031 (US$bn, AGR%, CAGR%)
Table 119 “U-Shaped Recovery”: North America Drug Delivery Technologies Market Forecast by End-User, 2021-2031 (US$bn, AGR%, CAGR%)
Table 120 “W-Shaped Recovery”: North America Drug Delivery Technologies Market Forecast by End-User, 2021-2031 (US$bn, AGR%, CAGR%)
Table 121 “L-Shaped Recovery”: North America Drug Delivery Technologies Market Forecast by End-User, 2021-2031 (US$bn, AGR%, CAGR%)
Table 122 U.S. Drug Delivery Technologies Market Forecast, 2021-2031 (US$bn, AGR%, CAGR%)
Table 123 U.S. Drug Delivery Technologies Forecast, 2021-2031 (US$bn, AGR%, CAGR%): "V" Shaped Recovery
Table 124 U.S. Drug Delivery Technologies Forecast, 2021-2031 (US$bn, AGR%, CAGR%): "U" Shaped Recovery
Table 125 U.S. Drug Delivery Technologies Forecast, 2021-2031 (US$bn, AGR%, CAGR%): "W" Shaped Recovery
Table 126 U.S. Drug Delivery Technologies Forecast, 2021-2031 (US$bn, AGR%, CAGR%): "L" Shaped Recovery
Table 127 Canada Drug Delivery Technologies Market Forecast, 2021-2031 (US$bn, AGR%, CAGR%)
Table 128 Canada Drug Delivery Technologies Forecast, 2021-2031 (US$bn, AGR%, CAGR%): "V" Shaped Recovery
Table 129 Canada Drug Delivery Technologies Forecast, 2021-2031 (US$bn, AGR%, CAGR%): "U" Shaped Recovery
Table 130 Canada Drug Delivery Technologies Forecast, 2021-2031 (US$bn, AGR%, CAGR%): "W" Shaped Recovery
Table 131 Canada Drug Delivery Technologies Forecast, 2021-2031 (US$bn, AGR%, CAGR%): "L" Shaped Recovery
Table 132 Europe Drug Delivery Technologies Market Forecast, 2021-2031 (US$bn, AGR%, CAGR%)
Table 133 Europe Drug Delivery Technologies Market Forecast by Country, 2021-2031 (US$bn, AGR%, CAGR%)
Table 134 “V-Shaped Recovery”: Europe Drug Delivery Technologies Market Forecast by Country, 2021-2031 (US$bn, AGR%, CAGR%)
Table 135 “U-Shaped Recovery”: Europe Drug Delivery Technologies Market Forecast by Country, 2021-2031 (US$bn, AGR%, CAGR%)
Table 136 “W-Shaped Recovery”: Europe Drug Delivery Technologies Market Forecast by Country, 2021-2031 (US$bn, AGR%, CAGR%)
Table 137 “L-Shaped Recovery”: Europe Drug Delivery Technologies Market Forecast by Country, 2021-2031 (US$bn, AGR%, CAGR%)
Table 138 Europe Drug Delivery Technologies Market Forecast by Technology, 2021-2031 (US$billion, AGR %, CAGR %)
Table 139 “V-Shaped Recovery”: Europe Drug Delivery Technologies Market Forecast by Technology, 2021-2031 (US$billion, AGR %, CAGR %)
Table 140 “U-Shaped Recovery”: Europe Drug Delivery Technologies Market Forecast by Technology, 2021-2031 (US$billion, AGR %, CAGR %)
Table 141 “W-Shaped Recovery”: Europe Drug Delivery Technologies Market Forecast by Technology, 2021-2031 (US$billion, AGR %, CAGR %)
Table 142 “L-Shaped Recovery”: Europe Drug Delivery Technologies Market Forecast by Technology, 2021-2031 (US$billion, AGR %, CAGR %)
Table 143 Europe Drug Delivery Technologies Market Forecast by indiation, 2021-2031 (US$billion, AGR %, CAGR %)
Table 144 “V-Shaped Recovery”: Europe Drug Delivery Technologies Market Forecast by indiation, 2021-2031 (US$billion, AGR %, CAGR %)
Table 145 “U-Shaped Recovery”: Europe Drug Delivery Technologies Market Forecast by indiation, 2021-2031 (US$billion, AGR %, CAGR %)
Table 146 “W-Shaped Recovery”: Europe Drug Delivery Technologies Market Forecast by indiation, 2021-2031 (US$billion, AGR %, CAGR %)
Table 147 “L-Shaped Recovery”: Europe Drug Delivery Technologies Market Forecast by indiation, 2021-2031 (US$billion, AGR %, CAGR %)
Table 148 Europe Drug Delivery Technologies Market Forecast by End-User, 2021-2031 (US$bn, AGR%, CAGR%)
Table 149 “V-Shaped Recovery”: Europe Drug Delivery Technologies Market Forecast by End-User, 2021-2031 (US$bn, AGR%, CAGR%)
Table 150 “U-Shaped Recovery”: Europe Drug Delivery Technologies Market Forecast by End-User, 2021-2031 (US$bn, AGR%, CAGR%)
Table 151 “W-Shaped Recovery”: Europe Drug Delivery Technologies Market Forecast by End-User, 2021-2031 (US$bn, AGR%, CAGR%)
Table 152 “L-Shaped Recovery”: Europe Drug Delivery Technologies Market Forecast by End-User, 2021-2031 (US$bn, AGR%, CAGR%)
Table 153 Germany Drug Delivery Technologies Market Forecast, 2021-2031 (US$bn, AGR%, CAGR %)
Table 154 Germany Drug Delivery Technologies Forecast, 2021-2031 (US$bn, AGR%, CAGR%): "V" Shaped Recovery
Table 155 Germany Drug Delivery Technologies Forecast, 2021-2031 (US$bn, AGR%, CAGR%): "U" Shaped Recovery
Table 156 Germany Drug Delivery Technologies Forecast, 2021-2031 (US$bn, AGR%, CAGR%): "W" Shaped Recovery
Table 157 Germany Drug Delivery Technologies Forecast, 2021-2031 (US$bn, AGR%, CAGR%): "L" Shaped Recovery
Table 158 UK Drug Delivery Technologies Market Forecast, 2021-2031 (US$bn, AGR%, CAGR%)
Table 159 UK Drug Delivery Technologies Forecast, 2021-2031 (US$bn, AGR%, CAGR%): "V" Shaped Recovery
Table 160 UK Drug Delivery Technologies Forecast, 2021-2031 (US$bn, AGR%, CAGR%): "U" Shaped Recovery
Table 161 UK Drug Delivery Technologies Forecast, 2021-2031 (US$bn, AGR%, CAGR%): "W" Shaped Recovery
Table 162 UK Drug Delivery Technologies Forecast, 2021-2031 (US$bn, AGR%, CAGR%): "L" Shaped Recovery
Table 163 France Drug Delivery Technologies Market Forecast, 2021-2031 (US$bn, AGR%, CAGR%)
Table 164 France Drug Delivery Technologies Forecast, 2021-2031 (US$bn, AGR%, CAGR%): "V" Shaped Recovery
Table 165 France Drug Delivery Technologies Forecast, 2021-2031 (US$bn, AGR%, CAGR%): "U" Shaped Recovery
Table 166 France Drug Delivery Technologies Forecast, 2021-2031 (US$bn, AGR%, CAGR%): "W" Shaped Recovery
Table 167 France Drug Delivery Technologies Forecast, 2021-2031 (US$bn, AGR%, CAGR%): "L" Shaped Recovery
Table 168 Italy Drug Delivery Technologies Market Forecast, 2021-2031 (US$bn, AGR%, CAGR%)
Table 169 Italy Drug Delivery Technologies Forecast, 2021-2031 (US$bn, AGR%, CAGR%): "V" Shaped Recovery
Table 170 Italy Drug Delivery Technologies Forecast, 2021-2031 (US$bn, AGR%, CAGR%): "U" Shaped Recovery
Table 171 Italy Drug Delivery Technologies Forecast, 2021-2031 (US$bn, AGR%, CAGR%): "W" Shaped Recovery
Table 172 Italy Drug Delivery Technologies Forecast, 2021-2031 (US$bn, AGR%, CAGR%): "L" Shaped Recovery
Table 173 Spain Drug Delivery Technologies Market Forecast, 2021-2031 (US$bn, AGR%, CAGR%)
Table 174 Spain Drug Delivery Technologies Forecast, 2021-2031 (US$bn, AGR%, CAGR%): "V" Shaped Recovery
Table 175 Spain Drug Delivery Technologies Forecast, 2021-2031 (US$bn, AGR%, CAGR%): "U" Shaped Recovery
Table 176 Spain Drug Delivery Technologies Forecast, 2021-2031 (US$bn, AGR%, CAGR%): "W" Shaped Recovery
Table 177 Spain Drug Delivery Technologies Forecast, 2021-2031 (US$bn, AGR%, CAGR%): "L" Shaped Recovery
Table 178 Russia Drug Delivery Technologies Market Forecast, 2021-2031 (US$bn, AGR%, CAGR%)
Table 179 Russia Drug Delivery Technologies Forecast, 2021-2031 (US$bn, AGR%, CAGR%): "V" Shaped Recovery
Table 180 Russia Drug Delivery Technologies Forecast, 2021-2031 (US$bn, AGR%, CAGR%): "U" Shaped Recovery
Table 181 Russia Drug Delivery Technologies Forecast, 2021-2031 (US$bn, AGR%, CAGR%): "W" Shaped Recovery
Table 182 Russia Drug Delivery Technologies Forecast, 2021-2031 (US$bn, AGR%, CAGR%): "L" Shaped Recovery
Table 183 Rest of Europe Drug Delivery Technologies Market Forecast, 2021-2031 (US$bn, AGR%, CAGR%)
Table 184 Rest of Europe Drug Delivery Technologies Forecast, 2021-2031 (US$bn, AGR%, CAGR%): "V" Shaped Recovery
Table 185 Rest of Europe Drug Delivery Technologies Forecast, 2021-2031 (US$bn, AGR%, CAGR%): "U" Shaped Recovery
Table 186 Rest of Europe Drug Delivery Technologies Forecast, 2021-2031 (US$bn, AGR%, CAGR%): "W" Shaped Recovery
Table 187 Rest of Europe Drug Delivery Technologies Forecast, 2021-2031 (US$bn, AGR%, CAGR%): "L" Shaped Recovery
Table 188 Asia Pacific Drug Delivery Technologies Market Forecast, 2021-2031 (US$bn, AGR%, CAGR%)
Table 189 Asia Pacific Drug Delivery Technologies Market Forecast by Country, 2021-2031 (US$bn, AGR%, CAGR%)
Table 190 “V-Shaped Recovery”: Asia Pacific Drug Delivery Technologies Market Forecast by Country, 2021-2031 (US$bn, AGR%, CAGR%)
Table 191 “U-Shaped Recovery”: Asia Pacific Drug Delivery Technologies Market Forecast by Country, 2021-2031 (US$bn, AGR%, CAGR%)
Table 192 “W-Shaped Recovery”: Asia Pacific Drug Delivery Technologies Market Forecast by Country, 2021-2031 (US$bn, AGR%, CAGR%)
Table 193 “L-Shaped Recovery”: Asia Pacific Drug Delivery Technologies Market Forecast by Country, 2021-2031 (US$bn, AGR%, CAGR%)
Table 194 Asia Pacific Drug Delivery Technologies Market Forecast by Technology, 2021-2031 (US$billion, AGR %, CAGR %)
Table 195 “V-Shaped Recovery”: Asia Pacific Drug Delivery Technologies Market Forecast by Technology, 2021-2031 (US$billion, AGR %, CAGR %)
Table 196 “U-Shaped Recovery”: Asia Pacific Drug Delivery Technologies Market Forecast by Technology, 2021-2031 (US$billion, AGR %, CAGR %)
Table 197 “W-Shaped Recovery”: Asia Pacific Drug Delivery Technologies Market Forecast by Technology, 2021-2031 (US$billion, AGR %, CAGR %)
Table 198 “L-Shaped Recovery”: Asia Pacific Drug Delivery Technologies Market Forecast by Technology, 2021-2031 (US$billion, AGR %, CAGR %)
Table 199 Asia Pacific Drug Delivery Technologies Market Forecast by indiation, 2021-2031 (US$billion, AGR %, CAGR %)
Table 200 “V-Shaped Recovery”: Asia Pacific Drug Delivery Technologies Market Forecast by indiation, 2021-2031 (US$billion, AGR %, CAGR %)
Table 201 “U-Shaped Recovery”: Asia Pacific Drug Delivery Technologies Market Forecast by indiation, 2021-2031 (US$billion, AGR %, CAGR %)
Table 202 “W-Shaped Recovery”: Asia Pacific Drug Delivery Technologies Market Forecast by indiation, 2021-2031 (US$billion, AGR %, CAGR %)
Table 203 “L-Shaped Recovery”: Asia Pacific Drug Delivery Technologies Market Forecast by indiation, 2021-2031 (US$billion, AGR %, CAGR %)
Table 204 Asia Pacific Drug Delivery Technologies Market Forecast by End-User, 2021-2031 (US$bn, AGR%, CAGR%)
Table 205 “V-Shaped Recovery”: Asia Pacific Drug Delivery Technologies Market Forecast by End-User, 2021-2031 (US$bn, AGR%, CAGR%)
Table 206 “U-Shaped Recovery”: Asia Pacific Drug Delivery Technologies Market Forecast by End-User, 2021-2031 (US$bn, AGR%, CAGR%)
Table 207 “W-Shaped Recovery”: Asia Pacific Drug Delivery Technologies Market Forecast by End-User, 2021-2031 (US$bn, AGR%, CAGR%)
Table 208 “L-Shaped Recovery”: Asia Pacific Drug Delivery Technologies Market Forecast by End-User, 2021-2031 (US$bn, AGR%, CAGR%)
Table 209 Japan Drug Delivery Technologies Market Forecast, 2021-2031 (US$bn, AGR%, CAGR%)
Table 210 Japan Drug Delivery Technologies Forecast, 2021-2031 (US$bn, AGR%, CAGR%): "V" Shaped Recovery
Table 211 Japan Drug Delivery Technologies Forecast, 2021-2031 (US$bn, AGR%, CAGR%): "U" Shaped Recovery
Table 212 Japan Drug Delivery Technologies Forecast, 2021-2031 (US$bn, AGR%, CAGR%): "W" Shaped Recovery
Table 213 Japan Drug Delivery Technologies Forecast, 2021-2031 (US$bn, AGR%, CAGR%): "L" Shaped Recovery
Table 214 China Drug Delivery Technologies Market Forecast, 2021-2031 (US$bn, AGR%, CAGR%)
Table 215 China Drug Delivery Technologies Forecast, 2021-2031 (US$bn, AGR%, CAGR%): "V" Shaped Recovery
Table 216 China Drug Delivery Technologies Forecast, 2021-2031 (US$bn, AGR%, CAGR%): "U" Shaped Recovery
Table 217 China Drug Delivery Technologies Forecast, 2021-2031 (US$bn, AGR%, CAGR%): "W" Shaped Recovery
Table 218 China Drug Delivery Technologies Forecast, 2021-2031 (US$bn, AGR%, CAGR%): "L" Shaped Recovery
Table 219 .India Drug Delivery Technologies Market Forecast, 2021-2031 (US$bn, AGR%, CAGR%)
Table 220 India Drug Delivery Technologies Forecast, 2021-2031 (US$bn, AGR%, CAGR%): "V" Shaped Recovery
Table 221 India Drug Delivery Technologies Forecast, 2021-2031 (US$bn, AGR%, CAGR%): "U" Shaped Recovery
Table 222 India Drug Delivery Technologies Forecast, 2021-2031 (US$bn, AGR%, CAGR%): "W" Shaped Recovery
Table 223 India Drug Delivery Technologies Forecast, 2021-2031 (US$bn, AGR%, CAGR%): "L" Shaped Recovery
Table 224 Australia Drug Delivery Technologies Market Forecast, 2021-2031 (US$bn, AGR%, CAGR%)
Table 225 Australia Drug Delivery Technologies Forecast, 2021-2031 (US$bn, AGR%, CAGR%): "V" Shaped Recovery
Table 226 Australia Drug Delivery Technologies Forecast, 2021-2031 (US$bn, AGR%, CAGR%): "U" Shaped Recovery
Table 227 Australia Drug Delivery Technologies Forecast, 2021-2031 (US$bn, AGR%, CAGR%): "W" Shaped Recovery
Table 228 Australia Drug Delivery Technologies Forecast, 2021-2031 (US$bn, AGR%, CAGR%): "L" Shaped Recovery
Table 229 South Korea Drug Delivery Technologies Market Forecast, 2021-2031 (US$bn, AGR%, CAGR%)
Table 230 South Korea Drug Delivery Technologies Forecast, 2021-2031 (US$bn, AGR%, CAGR%): "V" Shaped Recovery
Table 231 South Korea Drug Delivery Technologies Forecast, 2021-2031 (US$bn, AGR%, CAGR%): "U" Shaped Recovery
Table 232 South Korea Drug Delivery Technologies Forecast, 2021-2031 (US$bn, AGR%, CAGR%): "W" Shaped Recovery
Table 233 South Korea Drug Delivery Technologies Forecast, 2021-2031 (US$bn, AGR%, CAGR%): "L" Shaped Recovery
Table 234 Rest of Asia Pacific Drug Delivery Technologies Market Forecast, 2021-2031 (US$bn, AGR%, CAGR%)
Table 235 Rest of Asia Pacific Drug Delivery Technologies Forecast, 2021-2031 (US$bn, AGR%, CAGR%): "V" Shaped Recovery
Table 236 Rest of Asia Pacific Drug Delivery Technologies Forecast, 2021-2031 (US$bn, AGR%, CAGR%): "U" Shaped Recovery
Table 237 Rest of Asia Pacific Drug Delivery Technologies Forecast, 2021-2031 (US$bn, AGR%, CAGR%): "W" Shaped Recovery
Table 238 Rest of Asia Pacific Drug Delivery Technologies Forecast, 2021-2031 (US$bn, AGR%, CAGR%): "L" Shaped Recovery
Table 239 Latin America Drug Delivery Technologies Market Forecast, 2021-2031 (US$bn, AGR%, CAGR%)
Table 240 Latin America Drug Delivery Technologies Market Forecast by Country, 2021-2031 (US$bn, AGR%, CAGR%)
Table 241 “V-Shaped Recovery”: Latin America Drug Delivery Technologies Market Forecast by Country, 2021-2031 (US$bn, AGR%, CAGR%)
Table 242 “U-Shaped Recovery”: Latin America Drug Delivery Technologies Market Forecast by Country, 2021-2031 (US$bn, AGR%, CAGR%)
Table 243 “W-Shaped Recovery”: Latin America Drug Delivery Technologies Market Forecast by Country, 2021-2031 (US$bn, AGR%, CAGR%)
Table 244 “L-Shaped Recovery”: Latin America Drug Delivery Technologies Market Forecast by Country, 2021-2031 (US$bn, AGR%, CAGR%)
Table 245 Latin America Drug Delivery Technologies Market Forecast by Technology, 2021-2031 (US$billion, AGR %, CAGR %)
Table 246 “V-Shaped Recovery”: Latin America Drug Delivery Technologies Market Forecast by Technology, 2021-2031 (US$billion, AGR %, CAGR %)
Table 247 “U-Shaped Recovery”: Latin America Drug Delivery Technologies Market Forecast by Technology, 2021-2031 (US$billion, AGR %, CAGR %)
Table 248 “W-Shaped Recovery”: Latin America Drug Delivery Technologies Market Forecast by Technology, 2021-2031 (US$billion, AGR %, CAGR %)
Table 249 “L-Shaped Recovery”: Latin America Drug Delivery Technologies Market Forecast by Technology, 2021-2031 (US$billion, AGR %, CAGR %)
Table 250 Latin America Drug Delivery Technologies Market Forecast by indiation, 2021-2031 (US$billion, AGR %, CAGR %)
Table 251 “V-Shaped Recovery”: Latin America Drug Delivery Technologies Market Forecast by indiation, 2021-2031 (US$billion, AGR %, CAGR %)
Table 252 “U-Shaped Recovery”: Latin America Drug Delivery Technologies Market Forecast by indiation, 2021-2031 (US$billion, AGR %, CAGR %)
Table 253 “W-Shaped Recovery”: Latin America Drug Delivery Technologies Market Forecast by indiation, 2021-2031 (US$billion, AGR %, CAGR %)
Table 254 “L-Shaped Recovery”: Latin America Drug Delivery Technologies Market Forecast by indiation, 2021-2031 (US$billion, AGR %, CAGR %)
Table 255 Latin America Drug Delivery Technologies Market Forecast by End-User, 2021-2031 (US$bn, AGR%, CAGR%)
Table 256 “V-Shaped Recovery”: Latin America Drug Delivery Technologies Market Forecast by End-User, 2021-2031 (US$bn, AGR%, CAGR%)
Table 257 “U-Shaped Recovery”: Latin America Drug Delivery Technologies Market Forecast by End-User, 2021-2031 (US$bn, AGR%, CAGR%)
Table 258 “W-Shaped Recovery”: Latin America Drug Delivery Technologies Market Forecast by End-User, 2021-2031 (US$bn, AGR%, CAGR%)
Table 259 “L-Shaped Recovery”: Latin America Drug Delivery Technologies Market Forecast by End-User, 2021-2031 (US$bn, AGR%, CAGR%)
Table 260 Brazil Drug Delivery Technologies Market Forecast, 2021-2031 (US$bn, AGR%, CAGR%)
Table 261 Brazil Drug Delivery Technologies Forecast, 2021-2031 (US$bn, AGR%, CAGR%): "V" Shaped Recovery
Table 262 Brazil Drug Delivery Technologies Forecast, 2021-2031 (US$bn, AGR%, CAGR%): "U" Shaped Recovery
Table 263 Brazil Drug Delivery Technologies Forecast, 2021-2031 (US$bn, AGR%, CAGR%): "W" Shaped Recovery
Table 264 Brazil Drug Delivery Technologies Forecast, 2021-2031 (US$bn, AGR%, CAGR%): "L" Shaped Recovery
Table 265 Mexico Drug Delivery Technologies Market Forecast, 2021-2031 (US$bn, AGR%, CAGR%)
Table 266 Mexico Drug Delivery Technologies Forecast, 2021-2031 (US$bn, AGR%, CAGR%): "V" Shaped Recovery
Table 267 Mexico Drug Delivery Technologies Forecast, 2021-2031 (US$bn, AGR%, CAGR%): "U" Shaped Recovery
Table 268 Mexico Drug Delivery Technologies Forecast, 2021-2031 (US$bn, AGR%, CAGR%): "W" Shaped Recovery
Table 269 Mexico Drug Delivery Technologies Forecast, 2021-2031 (US$bn, AGR%, CAGR%): "L" Shaped Recovery
Table 270 Rest of Latin America Drug Delivery Technologies Market Forecast, 2021-2031 (US$bn, AGR%, CAGR%)
Table 271 Rest of Latin America Drug Delivery Technologies Forecast, 2021-2031 (US$bn, AGR%, CAGR%): "V" Shaped Recovery
Table 272 Rest of Latin America Drug Delivery Technologies Forecast, 2021-2031 (US$bn, AGR%, CAGR%): "U" Shaped Recovery
Table 273 Rest of Latin America Drug Delivery Technologies Forecast, 2021-2031 (US$bn, AGR%, CAGR%): "W" Shaped Recovery
Table 274 Rest of Latin America Drug Delivery Technologies Forecast, 2021-2031 (US$bn, AGR%, CAGR%): "L" Shaped Recovery
Table 275 MEA Drug Delivery Technologies Market Forecast, 2021-2031 (US$bn, AGR%, CAGR%)
Table 276 MEA Drug Delivery Technologies Market Forecast by Country, 2021-2031 (US$bn, AGR%, CAGR%)
Table 277 “V-Shaped Recovery”: MEA Drug Delivery Technologies Market Forecast by Country, 2021-2031 (US$bn, AGR%, CAGR%)
Table 278 “U-Shaped Recovery”: MEA Drug Delivery Technologies Market Forecast by Country, 2021-2031 (US$bn, AGR%, CAGR%)
Table 279 “W-Shaped Recovery”: MEA Drug Delivery Technologies Market Forecast by Country, 2021-2031 (US$bn, AGR%, CAGR%)
Table 280 “L-Shaped Recovery”: MEA Drug Delivery Technologies Market Forecast by Country, 2021-2031 (US$bn, AGR%, CAGR%)
Table 281 MEA Drug Delivery Technologies Market Forecast by Technology, 2021-2031 (US$billion, AGR %, CAGR %)
Table 282 “V-Shaped Recovery”: MEA Drug Delivery Technologies Market Forecast by Technology, 2021-2031 (US$billion, AGR %, CAGR %)
Table 283 “U-Shaped Recovery”: MEA Drug Delivery Technologies Market Forecast by Technology, 2021-2031 (US$billion, AGR %, CAGR %)
Table 284 “W-Shaped Recovery”: MEA Drug Delivery Technologies Market Forecast by Technology, 2021-2031 (US$billion, AGR %, CAGR %)
Table 285 “L-Shaped Recovery”: MEA Drug Delivery Technologies Market Forecast by Technology, 2021-2031 (US$billion, AGR %, CAGR %)
Table 286 MEA Drug Delivery Technologies Market Forecast by indiation, 2021-2031 (US$billion, AGR %, CAGR %)
Table 287 “V-Shaped Recovery”: MEA Drug Delivery Technologies Market Forecast by indiation, 2021-2031 (US$billion, AGR %, CAGR %)
Table 288 “U-Shaped Recovery”: MEA Drug Delivery Technologies Market Forecast by indiation, 2021-2031 (US$billion, AGR %, CAGR %)
Table 289 “W-Shaped Recovery”: MEA Drug Delivery Technologies Market Forecast by indiation, 2021-2031 (US$billion, AGR %, CAGR %)
Table 290 “L-Shaped Recovery”: MEA Drug Delivery Technologies Market Forecast by indiation, 2021-2031 (US$billion, AGR %, CAGR %)
Table 291 MEA Drug Delivery Technologies Market Forecast by End-User, 2021-2031 (US$bn, AGR%, CAGR%)
Table 292 “V-Shaped Recovery”: MEA Drug Delivery Technologies Market Forecast by End-User, 2021-2031 (US$bn, AGR%, CAGR%)
Table 293 “U-Shaped Recovery”: MEA Drug Delivery Technologies Market Forecast by End-User, 2021-2031 (US$bn, AGR%, CAGR%)
Table 294 “W-Shaped Recovery”: MEA Drug Delivery Technologies Market Forecast by End-User, 2021-2031 (US$bn, AGR%, CAGR%)
Table 295 “L-Shaped Recovery”: MEA Drug Delivery Technologies Market Forecast by End-User, 2021-2031 (US$bn, AGR%, CAGR%)
Table 296 South Africa Drug Delivery Technologies Market Forecast, 2021-2031 (US$bn, AGR%, CAGR%)
Table 297 South Africa Drug Delivery Technologies Forecast, 2021-2031 (US$bn, AGR%, CAGR%): "V" Shaped Recovery
Table 298 South Africa Drug Delivery Technologies Forecast, 2021-2031 (US$bn, AGR%, CAGR%): "U" Shaped Recovery
Table 299 South Africa Drug Delivery Technologies Forecast, 2021-2031 (US$bn, AGR%, CAGR%): "W" Shaped Recovery
Table 300 South Africa Drug Delivery Technologies Forecast, 2021-2031 (US$bn, AGR%, CAGR%): "L" Shaped Recovery
Table 301 GCC Drug Delivery Technologies Market Forecast, 2021-2031 (US$bn, AGR%, CAGR%)
Table 302 GCC Drug Delivery Technologies Forecast, 2021-2031 (US$bn, AGR%, CAGR%): "V" Shaped Recovery
Table 303 GCC Drug Delivery Technologies Forecast, 2021-2031 (US$bn, AGR%, CAGR%): "U" Shaped Recovery
Table 304 GCC Drug Delivery Technologies Forecast, 2021-2031 (US$bn, AGR%, CAGR%): "W" Shaped Recovery
Table 305 GCC Drug Delivery Technologies Forecast, 2021-2031 (US$bn, AGR%, CAGR%): "L" Shaped Recovery
Table 306 Rest of MEA Drug Delivery Technologies Market Forecast, 2021-2031 (US$bn, AGR%, CAGR%)
Table 307 Rest of MEA Drug Delivery Technologies Forecast, 2021-2031 (US$bn, AGR%, CAGR%): "V" Shaped Recovery
Table 308 Rest of MEA Drug Delivery Technologies Forecast, 2021-2031 (US$bn, AGR%, CAGR%): "U" Shaped Recovery
Table 309 Rest of MEA Drug Delivery Technologies Forecast, 2021-2031 (US$bn, AGR%, CAGR%): "W" Shaped Recovery
Table 310 Rest of MEA Drug Delivery Technologies Forecast, 2021-2031 (US$bn, AGR%, CAGR%): "L" Shaped Recovery
Table 311 Drug Delivery Technology Market Recent Developments, 2018-2021
Table 312 Novartis AG: Key Details, (MD, HQ, Revenue, Founded, No. of Employees, Company Type, Website, Business Segment)
Table 313 Novartis AG: Product Benchmarking
Table 314 Novartis AG : Recent Developments, 2018-2021
Table 315 Gilead Sciences, Inc.: Key Details, (CEO, HQ, Revenue, Founded, No. of Employees, Company Type, Website, Business Segment)
Table 316 Kite Corporate (Gilead Sciences, Inc.): Product Benchmarking
Table 317 GILEAD SCIENCES: Recent Developments, 2019-2021
Table 318 GlaxoSmithKline plc.: Key Details, (MD, HQ, Revenue, Founded, No. of Employees, Company Type, Website, Business Segment)
Table 319 GlaxoSmithKline plc: Product Benchmarking
Table 320 GlaxoSmithKline plc: Recent Developments, 2018-2021
Table 321 Pfizer Inc.: Key Details, (CEO, HQ, Revenue, Founded, No. of Employees, Company Type, Website, Business Segment)
Table 322 Pfizer Inc.: Product Benchmarking
Table 323 Pfizer Inc. : Recent Developments, 2018-2021
Table 324 F. Hoffmann-La Roche Ltd.: Key Details, (CEO, HQ, Revenue, Founded, No. of Employees, Company Type, Website, Business Segment)
Table 325 F. Hoffmann-La Roche Ltd.: Product Benchmarking
Table 326 F. Hoffmann-La Roche Ltd.: Recent Developments, 2018-2021
Table 327 Johnson & Johnson: Key Details, (CEO, HQ, Founded, No. of Employees, Company Type, Website)
Table 328 Johnson & Johnson: Product Benchmarking
Table 329 Johnson & Johnson: Recent Developments, 2018-2021
Table 330 KINDEVA DRUG DELIVERY: Key Details, (CEO, HQ, Revenue, Founded, No. of Employees, Company Type, Website, Business Segment)
Table 331 KINDEVA DRUG DELIVERY: Product Benchmarking
Table 332 KINDEVA DRUG DELIVERY : Recent Developments, 2018-2021
Table 333 Eli Lilly and Company: Key Details, (CEO, HQ, Revenue, Founded, No. of Employees, Company Type, Website, Business Segment)
Table 334 Eli Lilly and Company: Product Benchmarking
Table 335 Eli Lilly and Company: Recent Developments, 2018-2021
Table 336 AstraZeneca: Key Details, (CEO, HQ, Revenue, Founded, No. of Employees, Company Type, Website, Business Segment)
Table 337 AstraZeneca: Product Benchmarking
Table 338 AstraZeneca : Recent Developments, 2018-2021
Table 339 Boehringer Ingelheim International GmbH: Key Details, (CEO, HQ, Revenue, Founded, No. of Employees, Company Type, Website, Business Segment)
Table 340 Boehringer Ingelheim International GmbH: Product Benchmarking
Table 341 BOEHRINGER INGELHEIM: Recent Developments, 2018-2021
Table 342 Amgen Inc.: Key Details, (CEO, HQ, Revenue, Founded, No. of Employees, Company Type, Website, Business Segment)
Table 343 Amgen Inc.: Product Benchmarking
Table 344 Amgen Inc.: Recent Developments, 2018-2021
Table 345 Bristol-Myers Squibb Company: Key Details, (CEO, HQ, Revenue, Founded, No. of Employees, Company Type, Website, Business Segment)
Table 346 Bristol-Myers Squibb Company: Product Benchmarking
Table 347 Bristol-Myers Squibb Company: Recent Developments, 2018-2021
Table 348 Sanofi: Key Details, (CEO, HQ, Revenue, Founded, No. of Employees, Company Type, Website, Business Segment)
Table 349 Sanofi: Product Benchmarking
Table 350 SANOFI: Recent Developments, 2018-2021
Table 351 Becton, Dickinson and Company: Key Details, (CEO, HQ, Revenue, Founded, No. of Employees, Company Type, Website, Business Segment)
Table 352 Becton, Dickinson and Company: Product Benchmarking
Table 353 Becton, Dickinson and Company: Recent Developments, 2018-2021
Table 354 Bayer AG: Key Details, (CEO, HQ, Revenue, Founded, No. of Employees, Company Type, Website, Business Segment)
Table 355 Bayer AG: Product Benchmarking
Table 356 Bayer AG : Recent Developments, 2018-2021
List of Figures
Figure 1 Global Drug Delivery Technologies Market Size Forecast 2021-2031 (US$bn, AGR %)
Figure 2 Global Drug Delivery Technologies Market Segmentation
Figure 3 Global Drug Delivery Technologies Market: Market Trends
Figure 4 Global Drug Delivery Technologies Market: SWOT Analysis
Figure 5 Global Drug Delivery Technologies Market: Porter’s Five Forces Analysis
Figure 6 Global Drug Delivery Technologies Market: PEST Analysis
Figure 7 Global Drug Delivery Technologies Market Size Forecast 2021-2031 (US$bn, AGR %)
Figure 8 Global Drug Delivery Technologies Market Size Forecast 2021-2031 (US$bn, AGR %): "V" Shaped Recovery
Figure 9 Global Drug Delivery Technologies Market Size Forecast 2021-2031 (US$bn, AGR %): "U" Shaped Recovery
Figure 10 Global Drug Delivery Technologies Market Size Forecast 2021-2031 (US$bn, AGR %): "W" Shaped Recovery
Figure 11 Global Drug Delivery Technologies Market Size Forecast 2021-2031 (US$bn, AGR %): "L" Shaped Recovery
Figure 12 Global Oral Drug Delivery Therapy Segment: Revenue Forecast 2021-2031 (US$billion, AGR%)
Figure 13 “V” Shaped Recovery: Global Oral Drug Delivery Therapy Segment, Revenue Forecast 2021-2031 (US$billion, AGR%)
Figure 14 “U” Shaped Recovery: Global Oral Drug Delivery Therapy Segment, Revenue Forecast 2021-2031 (US$billion, AGR%)
Figure 15 “W” Shaped Recovery: Global Oral Drug Delivery Therapy Segment, Revenue Forecast 2021-2031 (US$billion, AGR%)
Figure 16 “L” Shaped Recovery: Global Oral Drug Delivery Therapy Segment, Revenue Forecast 2021-2031 (US$billion, AGR%)
Figure 17 Global Injectable Drug Delivery Segment: Revenue Forecast 2021-2031 (US$billion, AGR%)
Figure 18 “V” Shaped Recovery: Global Injectable Drug Delivery Segment, Revenue Forecast 2021-2031 (US$billion, AGR%)
Figure 19 “U” Shaped Recovery: Global Injectable Drug Delivery Segment, Revenue Forecast 2021-2031 (US$billion, AGR%)
Figure 20 “W” Shaped Recovery: Global Injectable Drug Delivery Segment, Revenue Forecast 2021-2031 (US$billion, AGR%)
Figure 21 “L” Shaped Recovery: Global Injectable Drug Delivery Segment, Revenue Forecast 2021-2031 (US$billion, AGR%)
Figure 22 Global Topical Drug Delivery Segment: Revenue Forecast 2021-2031 (US$billion, AGR%)
Figure 23 “V” Shaped Recovery: Global Topical Drug Delivery Segment, Revenue Forecast 2021-2031 (US$billion, AGR%)
Figure 24 “U” Shaped Recovery: Global Topical Drug Delivery Segment, Revenue Forecast 2021-2031 (US$billion, AGR%)
Figure 25 “W” Shaped Recovery: Global Topical Drug Delivery Segment, Revenue Forecast 2021-2031 (US$billion, AGR%)
Figure 26 “L” Shaped Recovery: Global Topical Drug Delivery Segment, Revenue Forecast 2021-2031 (US$billion, AGR%)
Figure 27 Global Pulmonary Drug Delivery Segment: Revenue Forecast 2021-2031 (US$billion, AGR%)
Figure 28 “V” Shaped Recovery: Global Pulmonary Drug Delivery Segment, Revenue Forecast 2021-2031 (US$billion, AGR%)
Figure 29 “U” Shaped Recovery: Global Pulmonary Drug Delivery Segment, Revenue Forecast 2021-2031 (US$billion, AGR%)
Figure 30 “W” Shaped Recovery: Global Pulmonary Drug Delivery Segment, Revenue Forecast 2021-2031 (US$billion, AGR%)
Figure 31 “L” Shaped Recovery: Global Pulmonary Drug Delivery Segment, Revenue Forecast 2021-2031 (US$billion, AGR%)
Figure 32 Global Implantable Drug Delivery Segment: Revenue Forecast 2021-2031 (US$billion, AGR%)
Figure 33 “V” Shaped Recovery: Global Implantable Drug Delivery Segment, Revenue Forecast 2021-2031 (US$billion, AGR%)
Figure 34 “U” Shaped Recovery: Global Implantable Drug Delivery Segment, Revenue Forecast 2021-2031 (US$billion, AGR%)
Figure 35 “W” Shaped Recovery: Global Implantable Drug Delivery Segment, Revenue Forecast 2021-2031 (US$billion, AGR%)
Figure 36 “L” Shaped Recovery: Global Implantable Drug Delivery Segment, Revenue Forecast 2021-2031 (US$billion, AGR%)
Figure 37 Global Ocular Drug Delivery Segment: Revenue Forecast 2021-2031 (US$billion, AGR%)
Figure 38 “V” Shaped Recovery: Global Ocular Drug Delivery Segment, Revenue Forecast 2021-2031 (US$billion, AGR%)
Figure 39 “U” Shaped Recovery: Global Ocular Drug Delivery Segment, Revenue Forecast 2021-2031 (US$billion, AGR%)
Figure 40 “W” Shaped Recovery: Global Ocular Drug Delivery Segment, Revenue Forecast 2021-2031 (US$billion, AGR%)
Figure 41 “L” Shaped Recovery: Global Ocular Drug Delivery Segment, Revenue Forecast 2021-2031 (US$billion, AGR%)
Figure 42 Global Others Segment: Revenue Forecast 2021-2031 (US$billion, AGR%)
Figure 43 “V” Shaped Recovery: Global Others Segment, Revenue Forecast 2021-2031 (US$billion, AGR%)
Figure 44 “U” Shaped Recovery: Global Others Segment, Revenue Forecast 2021-2031 (US$billion, AGR%)
Figure 45 “W” Shaped Recovery: Global Others Segment, Revenue Forecast 2021-2031 (US$billion, AGR%)
Figure 46 “L” Shaped Recovery: Global Others Segment, Revenue Forecast 2021-2031 (US$billion, AGR%)
Figure 47 Global Drug Delivery Technologies Market Share Forecast by Indication, 2021, 2026, 2031 (%)
Figure 48 Global Infectious Diseases Therapy Segment: Revenue Forecast 2021-2031 (US$billion, AGR%)
Figure 49 “V” Shaped Recovery: Global Infectious Diseases Therapy Segment, Revenue Forecast 2021-2031 (US$billion, AGR%)
Figure 50 “U” Shaped Recovery: Global Infectious Diseases Therapy Segment, Revenue Forecast 2021-2031 (US$billion, AGR%)
Figure 51 “W” Shaped Recovery: Global Infectious Diseases Therapy Segment, Revenue Forecast 2021-2031 (US$billion, AGR%)
Figure 52 “L” Shaped Recovery: Global Infectious Diseases Therapy Segment, Revenue Forecast 2021-2031 (US$billion, AGR%)
Figure 53 Global Cancer Segment: Revenue Forecast 2021-2031 (US$billion, AGR%)
Figure 54 “V” Shaped Recovery: Global Cancer Segment, Revenue Forecast 2021-2031 (US$billion, AGR%)
Figure 55 “U” Shaped Recovery: Global Cancer Segment, Revenue Forecast 2021-2031 (US$billion, AGR%)
Figure 56 “W” Shaped Recovery: Global Cancer Segment, Revenue Forecast 2021-2031 (US$billion, AGR%)
Figure 57 “L” Shaped Recovery: Global Cancer Segment, Revenue Forecast 2021-2031 (US$billion, AGR%)
Figure 58 Global Cardiovascular Diseases Segment: Revenue Forecast 2021-2031 (US$billion, AGR%)
Figure 59 “V” Shaped Recovery: Global Cardiovascular Diseases Segment, Revenue Forecast 2021-2031 (US$billion, AGR%)
Figure 60 “U” Shaped Recovery: Global Cardiovascular Diseases Segment, Revenue Forecast 2021-2031 (US$billion, AGR%)
Figure 61 “W” Shaped Recovery: Global Cardiovascular Diseases Segment, Revenue Forecast 2021-2031 (US$billion, AGR%)
Figure 62 “L” Shaped Recovery: Global Cardiovascular Diseases Segment, Revenue Forecast 2021-2031 (US$billion, AGR%)
Figure 63 Global Diabetes Segment: Revenue Forecast 2021-2031 (US$billion, AGR%)
Figure 64 “V” Shaped Recovery: Global Diabetes Segment, Revenue Forecast 2021-2031 (US$billion, AGR%)
Figure 65 “U” Shaped Recovery: Global Diabetes Segment, Revenue Forecast 2021-2031 (US$billion, AGR%)
Figure 66 “W” Shaped Recovery: Global Diabetes Segment, Revenue Forecast 2021-2031 (US$billion, AGR%)
Figure 67 “L” Shaped Recovery: Global Diabetes Segment, Revenue Forecast 2021-2031 (US$billion, AGR%)
Figure 68 Global Respiratory Diseases Segment: Revenue Forecast 2021-2031 (US$billion, AGR%)
Figure 69 “V” Shaped Recovery: Global Respiratory Diseases Segment, Revenue Forecast 2021-2031 (US$billion, AGR%)
Figure 70 “U” Shaped Recovery: Global Respiratory Diseases Segment, Revenue Forecast 2021-2031 (US$billion, AGR%)
Figure 71 “W” Shaped Recovery: Global Respiratory Diseases Segment, Revenue Forecast 2021-2031 (US$billion, AGR%)
Figure 72 “L” Shaped Recovery: Global Respiratory Diseases Segment, Revenue Forecast 2021-2031 (US$billion, AGR%)
Figure 73 Global Central Nervous System Disorders Segment: Revenue Forecast 2021-2031 (US$billion, AGR%)
Figure 74 “V” Shaped Recovery: Global Central Nervous System Disorders Segment, Revenue Forecast 2021-2031 (US$billion, AGR%)
Figure 75 “U” Shaped Recovery: Global Central Nervous System Disorders Segment, Revenue Forecast 2021-2031 (US$billion, AGR%)
Figure 76 “W” Shaped Recovery: Global Central Nervous System Disorders Segment, Revenue Forecast 2021-2031 (US$billion, AGR%)
Figure 77 “L” Shaped Recovery: Global Central Nervous System Disorders Segment, Revenue Forecast 2021-2031 (US$billion, AGR%)
Figure 78 Global Other Indications Segment: Revenue Forecast 2021-2031 (US$billion, AGR%)
Figure 79 “V” Shaped Recovery: Global Other Indications Segment, Revenue Forecast 2021-2031 (US$billion, AGR%)
Figure 80 “U” Shaped Recovery: Global Other Indications Segment, Revenue Forecast 2021-2031 (US$billion, AGR%)
Figure 81 “W” Shaped Recovery: Global Other Indications Segment, Revenue Forecast 2021-2031 (US$billion, AGR%)
Figure 82 “L” Shaped Recovery: Global Other Indications Segment, Revenue Forecast 2021-2031 (US$billion, AGR%)
Figure 83 Global Drug Delivery Technologies Market Share Forecast by End-User, 2021, 2026, 2031 (%)
Figure 84 Global Hospitals Segment: Revenue Forecast 2021-2031 (US$billion, AGR%)
Figure 85 Global Hospitals Segment, Revenue Forecast 2021-2031 (US$billion, AGR%): “V” Shaped Recovery
Figure 86 Global Hospitals Segment, Revenue Forecast 2021-2031 (US$billion, AGR%): “U” Shaped Recovery
Figure 87 Global Hospitals Segment, Revenue Forecast 2021-2031 (US$billion, AGR%): “W” Shaped Recovery
Figure 88 Global Hospitals Segment, Revenue Forecast 2021-2031 (US$billion, AGR%): “L” Shaped Recovery
Figure 89 Global Homecare Settings Segment: Revenue Forecast 2021-2031 (US$billion, AGR%)
Figure 90 Global Homecare Settings Segment, Revenue Forecast 2021-2031 (US$billion, AGR%): “V” Shaped Recovery
Figure 91 Global Homecare Settings Segment, Revenue Forecast 2021-2031 (US$billion, AGR%): “U” Shaped Recovery
Figure 92 Global Homecare Settings Segment, Revenue Forecast 2021-2031 (US$billion, AGR%): “W” Shaped Recovery
Figure 93 Global Homecare Settings Segment, Revenue Forecast 2021-2031 (US$billion, AGR%): “L” Shaped Recovery
Figure 94 Global Other End-User Segment: Revenue Forecast 2021-2031 (US$billion, AGR%)
Figure 95 “V” Shaped Recovery: Global Other End-User Segment, Revenue Forecast 2021-2031 (US$billion, AGR%)
Figure 96 “U” Shaped Recovery: Global Other End-User Segment, Revenue Forecast 2021-2031 (US$billion, AGR%)
Figure 97 “W” Shaped Recovery: Global Other End-User Segment, Revenue Forecast 2021-2031 (US$billion, AGR%)
Figure 98 “L” Shaped Recovery: Global Other End-User Segment, Revenue Forecast 2021-2031 (US$billion, AGR%)
Figure 99 Global Drug Delivery Technologies Market Forecast, 2021-2031 (US$billion): “V” Shaped Recovery
Figure 100 Global Drug Delivery Technologies Market Forecast, 2021-2031 (US$billion): “U” Shaped Recovery
Figure 101 Global Drug Delivery Technologies Market Forecast, 2021-2031 (US$billion, AGR%): “W” Shaped Recovery
Figure 102 Global Drug Delivery Technologies Market Forecast, 2021-2031 (US$billion, AGR%): “L” Shaped Recovery
Figure 103 North America Drug Delivery Technologies Market Forecast 2021-2031 (US$billion, AGR%)
Figure 104 North America Drug Delivery Technologies Market Forecast by Country 2021-2031 (US$billion)
Figure 105 “V-Shaped Recovery”: North America Drug Delivery Technologies Market Forecast by Country 2021-2031 (US$billion)
Figure 106 “U-Shaped Recovery”: North America Drug Delivery Technologies Market Forecast by Country 2021-2031 (US$billion)
Figure 107 “W-Shaped Recovery”: North America Drug Delivery Technologies Market Forecast by Country 2021-2031 (US$billion)
Figure 108 “L-Shaped Recovery”: North America Drug Delivery Technologies Market Forecast by Country 2021-2031 (US$billion)
Figure 109 North America Drug Delivery Technologies Market Forecast by Technology, 2021-2031 (US$billion)
Figure 110 “V-Shaped Recovery”: North America Drug Delivery Technologies Market Forecast by Technology, 2021-2031 (US$billion)
Figure 111 “U-Shaped Recovery”: North America Drug Delivery Technologies Market Forecast by Technology, 2021-2031 (US$billion)
Figure 112 “W-Shaped Recovery”: North America Drug Delivery Technologies Market Forecast by Technology, 2021-2031 (US$billion)
Figure 113 “L-Shaped Recovery”: North America Drug Delivery Technologies Market Forecast by Technology, 2021-2031 (US$billion)
Figure 114 North America Drug Delivery Technologies Market Forecast by Indication, 2021-2031 (US$billion)
Figure 115 “V-Shaped Recovery”: North America Drug Delivery Technologies Market Forecast by Indication, 2021-2031 (US$billion)
Figure 116 “U-Shaped Recovery”: North America Drug Delivery Technologies Market Forecast by Indication, 2021-2031 (US$billion)
Figure 117 “W-Shaped Recovery”: North America Drug Delivery Technologies Market Forecast by Indication, 2021-2031 (US$billion)
Figure 118 “L-Shaped Recovery”: North America Drug Delivery Technologies Market Forecast by Indication, 2021-2031 (US$billion)
Figure 119 North America Drug Delivery Technologies Market Forecast by End-User, 2021-2031 (US$billion)
Figure 120 “V-Shaped Recovery”: North America Drug Delivery Technologies Market Forecast by End-User, 2021-2031 (US$billion)
Figure 121 “U-Shaped Recovery”: North America Drug Delivery Technologies Market Forecast by End-User, 2021-2031 (US$billion)
Figure 122 “W-Shaped Recovery”: North America Drug Delivery Technologies Market Forecast by End-User, 2021-2031 (US$billion)
Figure 123 “L-Shaped Recovery”: North America Drug Delivery Technologies Market Forecast by End-User, 2021-2031 (US$billion)
Figure 124 U.S. Drug Delivery Technologies Market Forecast, 2021-2031 (US$billion, AGR %)
Figure 125 U.S. Drug Delivery Technologies Market Revenue Forecast 2021-2031 (US$billion, AGR%): “V” Shaped Recovery
Figure 126 U.S. Drug Delivery Technologies Market Revenue Forecast 2021-2031 (US$billion, AGR%): “U” Shaped Recovery
Figure 127 U.S. Drug Delivery Technologies Market Revenue Forecast 2021-2031 (US$billion, AGR%): “W” Shaped Recovery
Figure 128 U.S. Drug Delivery Technologies Market Revenue Forecast 2021-2031 (US$billion, AGR%): “L” Shaped Recovery
Figure 129 Canada Drug Delivery Technologies Market Forecast, 2021-2031 (US$billion, AGR %)
Figure 130 Canada Drug Delivery Technologies Market Revenue Forecast 2021-2031 (US$billion, AGR%): “V” Shaped Recovery
Figure 131 Canada Drug Delivery Technologies Market Revenue Forecast 2021-2031 (US$billion, AGR%): “U” Shaped Recovery
Figure 132 Canada Drug Delivery Technologies Market Revenue Forecast 2021-2031 (US$billion, AGR%): “W” Shaped Recovery
Figure 133 Canada Drug Delivery Technologies Market Revenue Forecast 2021-2031 (US$billion, AGR%): “L” Shaped Recovery
Figure 134 Europe Drug Delivery Technologies Market Forecast 2021-2031 (US$billion, AGR%)
Figure 135 Europe Drug Delivery Technologies Market Forecast by Country 2021-2031 (US$billion)
Figure 136 “V-Shaped Recovery”: Europe Drug Delivery Technologies Market Forecast by Country 2021-2031 (US$billion)
Figure 137 “U-Shaped Recovery”: Europe Drug Delivery Technologies Market Forecast by Country 2021-2031 (US$billion)
Figure 138 “W-Shaped Recovery”: Europe Drug Delivery Technologies Market Forecast by Country 2021-2031 (US$billion)
Figure 139 “L-Shaped Recovery”: Europe Drug Delivery Technologies Market Forecast by Country 2021-2031 (US$billion)
Figure 140 Europe Drug Delivery Technologies Market Forecast by Technology, 2021-2031 (US$billion)
Figure 141 “V-Shaped Recovery”: Europe Drug Delivery Technologies Market Forecast by Technology, 2021-2031 (US$billion)
Figure 142 “U-Shaped Recovery”: Europe Drug Delivery Technologies Market Forecast by Technology, 2021-2031 (US$billion)
Figure 143 “W-Shaped Recovery”: Europe Drug Delivery Technologies Market Forecast by Technology, 2021-2031 (US$billion)
Figure 144 “L-Shaped Recovery”: Europe Drug Delivery Technologies Market Forecast by Technology, 2021-2031 (US$billion)
Figure 145 Europe Drug Delivery Technologies Market Forecast by Indication, 2021-2031 (US$billion)
Figure 146 “V-Shaped Recovery”: Europe Drug Delivery Technologies Market Forecast by Indication, 2021-2031 (US$billion)
Figure 147 “U-Shaped Recovery”: Europe Drug Delivery Technologies Market Forecast by Indication, 2021-2031 (US$billion)
Figure 148 “W-Shaped Recovery”: Europe Drug Delivery Technologies Market Forecast by Indication, 2021-2031 (US$billion)
Figure 149 “L-Shaped Recovery”: Europe Drug Delivery Technologies Market Forecast by Indication, 2021-2031 (US$billion)
Figure 150 Europe Drug Delivery Technologies Market Forecast by End-User, 2021-2031 (US$billion)
Figure 151 “V-Shaped Recovery”: Europe Drug Delivery Technologies Market Forecast by End-User, 2021-2031 (US$billion)
Figure 152 “U-Shaped Recovery”: Europe Drug Delivery Technologies Market Forecast by End-User, 2021-2031 (US$billion)
Figure 153 “W-Shaped Recovery”: Europe Drug Delivery Technologies Market Forecast by End-User, 2021-2031 (US$billion)
Figure 154 “L-Shaped Recovery”: Europe Drug Delivery Technologies Market Forecast by End-User, 2021-2031 (US$billion)
Figure 155 Germany Drug Delivery Technologies Market Forecast, 2021-2031 (US$billion, AGR %)
Figure 156 Germany Drug Delivery Technologies Market Revenue Forecast 2021-2031 (US$billion, AGR%): “V” Shaped Recovery
Figure 157 Germany Drug Delivery Technologies Market Revenue Forecast 2021-2031 (US$billion, AGR%): “U” Shaped Recovery
Figure 158 Germany Drug Delivery Technologies Market Revenue Forecast 2021-2031 (US$billion, AGR%): “W” Shaped Recovery
Figure 159 Germany Drug Delivery Technologies Market Revenue Forecast 2021-2031 (US$billion, AGR%): “L” Shaped Recovery
Figure 160 UK Drug Delivery Technologies Market Forecast, 2021-2031 (US$billion, AGR %)
Figure 161 UK Drug Delivery Technologies Market Revenue Forecast 2021-2031 (US$billion, AGR%): “V” Shaped Recovery
Figure 162 UK Drug Delivery Technologies Market Revenue Forecast 2021-2031 (US$billion, AGR%): “U” Shaped Recovery
Figure 163 UK Drug Delivery Technologies Market Revenue Forecast 2021-2031 (US$billion, AGR%): “W” Shaped Recovery
Figure 164 UK Drug Delivery Technologies Market Revenue Forecast 2021-2031 (US$billion, AGR%): “L” Shaped Recovery
Figure 165 France Drug Delivery Technologies Market Forecast, 2021-2031 (US$billion, AGR %)
Figure 166 France Drug Delivery Technologies Market Revenue Forecast 2021-2031 (US$billion, AGR%): “V” Shaped Recovery
Figure 167 France Drug Delivery Technologies Market Revenue Forecast 2021-2031 (US$billion, AGR%): “U” Shaped Recovery
Figure 168 France Drug Delivery Technologies Market Revenue Forecast 2021-2031 (US$billion, AGR%): “W” Shaped Recovery
Figure 169 France Drug Delivery Technologies Market Revenue Forecast 2021-2031 (US$billion, AGR%): “L” Shaped Recovery
Figure 170 Italy Drug Delivery Technologies Market Forecast, 2021-2031 (US$billion, AGR %)
Figure 171 Italy Drug Delivery Technologies Market Revenue Forecast 2021-2031 (US$billion, AGR%): “V” Shaped Recovery
Figure 172 Italy Drug Delivery Technologies Market Revenue Forecast 2021-2031 (US$billion, AGR%): “U” Shaped Recovery
Figure 173 Italy Drug Delivery Technologies Market Revenue Forecast 2021-2031 (US$billion, AGR%): “W” Shaped Recovery
Figure 174 Italy Drug Delivery Technologies Market Revenue Forecast 2021-2031 (US$billion, AGR%): “L” Shaped Recovery
Figure 175 Spain Drug Delivery Technologies Market Forecast, 2021-2031 (US$billion, AGR %)
Figure 176 Spain Drug Delivery Technologies Market Revenue Forecast 2021-2031 (US$billion, AGR%): “V” Shaped Recovery
Figure 177 Spain Drug Delivery Technologies Market Revenue Forecast 2021-2031 (US$billion, AGR%): “U” Shaped Recovery
Figure 178 Spain Drug Delivery Technologies Market Revenue Forecast 2021-2031 (US$billion, AGR%): “W” Shaped Recovery
Figure 179 Spain Drug Delivery Technologies Market Revenue Forecast 2021-2031 (US$billion, AGR%): “L” Shaped Recovery
Figure 180 Russia Drug Delivery Technologies Market Forecast, 2021-2031 (US$billion, AGR %)
Figure 181 Russia Drug Delivery Technologies Market Revenue Forecast 2021-2031 (US$billion, AGR%): “V” Shaped Recovery
Figure 182 Russia Drug Delivery Technologies Market Revenue Forecast 2021-2031 (US$billion, AGR%): “U” Shaped Recovery
Figure 183 Russia Drug Delivery Technologies Market Revenue Forecast 2021-2031 (US$billion, AGR%): “W” Shaped Recovery
Figure 184 Russia Drug Delivery Technologies Market Revenue Forecast 2021-2031 (US$billion, AGR%): “L” Shaped Recovery
Figure 185 Rest of Europe Drug Delivery Technologies Market Forecast, 2021-2031 (US$billion, AGR %)
Figure 186 Rest of Europe Drug Delivery Technologies Market Revenue Forecast 2021-2031 (US$billion, AGR%): “V” Shaped Recovery
Figure 187 Rest of Europe Drug Delivery Technologies Market Revenue Forecast 2021-2031 (US$billion, AGR%): “U” Shaped Recovery
Figure 188 Rest of Europe Drug Delivery Technologies Market Revenue Forecast 2021-2031 (US$billion, AGR%): “W” Shaped Recovery
Figure 189 Rest of Europe Drug Delivery Technologies Market Revenue Forecast 2021-2031 (US$billion, AGR%): “L” Shaped Recovery
Figure 190 Asia Pacific Drug Delivery Technologies Market Forecast 2021-2031 (US$billion, AGR%)
Figure 191 Asia Pacific Drug Delivery Technologies Market Forecast by Country 2021-2031 (US$billion)
Figure 192 “V-Shaped Recovery”: Asia Pacific Drug Delivery Technologies Market Forecast by Country 2021-2031 (US$billion)
Figure 193 “U-Shaped Recovery”: Asia Pacific Drug Delivery Technologies Market Forecast by Country 2021-2031 (US$billion)
Figure 194 “W-Shaped Recovery”: Asia Pacific Drug Delivery Technologies Market Forecast by Country 2021-2031 (US$billion)
Figure 195 “L-Shaped Recovery”: Asia Pacific Drug Delivery Technologies Market Forecast by Country 2021-2031 (US$billion)
Figure 196 Asia Pacific Drug Delivery Technologies Market Forecast by Technology, 2021-2031 (US$billion)
Figure 197 “V-Shaped Recovery”: Asia Pacific Drug Delivery Technologies Market Forecast by Technology, 2021-2031 (US$billion)
Figure 198 “U-Shaped Recovery”: Asia Pacific Drug Delivery Technologies Market Forecast by Technology, 2021-2031 (US$billion)
Figure 199 “W-Shaped Recovery”: Asia Pacific Drug Delivery Technologies Market Forecast by Technology, 2021-2031 (US$billion)
Figure 200 “L-Shaped Recovery”: Asia Pacific Drug Delivery Technologies Market Forecast by Technology, 2021-2031 (US$billion)
Figure 201 Asia Pacific Drug Delivery Technologies Market Forecast by Indication, 2021-2031 (US$billion)
Figure 202 “V-Shaped Recovery”: Asia Pacific Drug Delivery Technologies Market Forecast by Indication, 2021-2031 (US$billion)
Figure 203 “U-Shaped Recovery”: Asia Pacific Drug Delivery Technologies Market Forecast by Indication, 2021-2031 (US$billion)
Figure 204 “W-Shaped Recovery”: Asia Pacific Drug Delivery Technologies Market Forecast by Indication, 2021-2031 (US$billion)
Figure 205 “L-Shaped Recovery”: Asia Pacific Drug Delivery Technologies Market Forecast by Indication, 2021-2031 (US$billion)
Figure 206 Asia Pacific Drug Delivery Technologies Market Forecast by End-User, 2021-2031 (US$billion)
Figure 207 “V-Shaped Recovery”: Asia Pacific Drug Delivery Technologies Market Forecast by End-User, 2021-2031 (US$billion)
Figure 208 “U-Shaped Recovery”: Asia Pacific Drug Delivery Technologies Market Forecast by End-User, 2021-2031 (US$billion)
Figure 209 “W-Shaped Recovery”: Asia Pacific Drug Delivery Technologies Market Forecast by End-User, 2021-2031 (US$billion)
Figure 210 “L-Shaped Recovery”: Asia Pacific Drug Delivery Technologies Market Forecast by End-User, 2021-2031 (US$billion)
Figure 211 Japan Drug Delivery Technologies Market Forecast, 2021-2031 (US$billion, AGR %)
Figure 212 Japan Drug Delivery Technologies Market Revenue Forecast 2021-2031 (US$billion, AGR%): “V” Shaped Recovery
Figure 213 Japan Drug Delivery Technologies Market Revenue Forecast 2021-2031 (US$billion, AGR%): “U” Shaped Recovery
Figure 214 Japan Drug Delivery Technologies Market Revenue Forecast 2021-2031 (US$billion, AGR%): “W” Shaped Recovery
Figure 215 Japan Drug Delivery Technologies Market Revenue Forecast 2021-2031 (US$billion, AGR%): “L” Shaped Recovery
Figure 216 China Drug Delivery Technologies Market Forecast, 2021-2031 (US$billion, AGR %)
Figure 217 China Drug Delivery Technologies Market Revenue Forecast 2021-2031 (US$billion, AGR%): “V” Shaped Recovery
Figure 218 China Drug Delivery Technologies Market Revenue Forecast 2021-2031 (US$billion, AGR%): “U” Shaped Recovery
Figure 219 China Drug Delivery Technologies Market Revenue Forecast 2021-2031 (US$billion, AGR%): “W” Shaped Recovery
Figure 220 China Drug Delivery Technologies Market Revenue Forecast 2021-2031 (US$billion, AGR%): “L” Shaped Recovery
Figure 221 India Drug Delivery Technologies Market Forecast, 2021-2031 (US$billion, AGR %)
Figure 222 India Drug Delivery Technologies Market Revenue Forecast 2021-2031 (US$billion, AGR%): “V” Shaped Recovery
Figure 223 India Drug Delivery Technologies Market Revenue Forecast 2021-2031 (US$billion, AGR%): “U” Shaped Recovery
Figure 224 India Drug Delivery Technologies Market Revenue Forecast 2021-2031 (US$billion, AGR%): “W” Shaped Recovery
Figure 225 India Drug Delivery Technologies Market Revenue Forecast 2021-2031 (US$billion, AGR%): “L” Shaped Recovery
Figure 226 Australia Drug Delivery Technologies Market Forecast, 2021-2031 (US$billion, AGR %)
Figure 227 Australia Drug Delivery Technologies Market Revenue Forecast 2021-2031 (US$billion, AGR%): “V” Shaped Recovery
Figure 228 Australia Drug Delivery Technologies Market Revenue Forecast 2021-2031 (US$billion, AGR%): “U” Shaped Recovery
Figure 229 Australia Drug Delivery Technologies Market Revenue Forecast 2021-2031 (US$billion, AGR%): “W” Shaped Recovery
Figure 230 Australia Drug Delivery Technologies Market Revenue Forecast 2021-2031 (US$billion, AGR%): “L” Shaped Recovery
Figure 231 South Korea Drug Delivery Technologies Market Forecast, 2021-2031 (US$billion, AGR %)
Figure 232 South Korea Drug Delivery Technologies Market Revenue Forecast 2021-2031 (US$billion, AGR%): “V” Shaped Recovery
Figure 233 South Korea Drug Delivery Technologies Market Revenue Forecast 2021-2031 (US$billion, AGR%): “U” Shaped Recovery
Figure 234 South Korea Drug Delivery Technologies Market Revenue Forecast 2021-2031 (US$billion, AGR%): “W” Shaped Recovery
Figure 235 South Korea Drug Delivery Technologies Market Revenue Forecast 2021-2031 (US$billion, AGR%): “L” Shaped Recovery
Figure 236 Rest of Asia Pacific Drug Delivery Technologies Market Forecast, 2021-2031 (US$billion, AGR %)
Figure 237 Rest of Asia Pacific Drug Delivery Technologies Market Revenue Forecast 2021-2031 (US$billion, AGR%): “V” Shaped Recovery
Figure 238 Rest of Asia Pacific Drug Delivery Technologies Market Revenue Forecast 2021-2031 (US$billion, AGR%): “U” Shaped Recovery
Figure 239 Rest of Asia Pacific Drug Delivery Technologies Market Revenue Forecast 2021-2031 (US$billion, AGR%): “W” Shaped Recovery
Figure 240 Rest of Asia Pacific Drug Delivery Technologies Market Revenue Forecast 2021-2031 (US$billion, AGR%): “L” Shaped Recovery
Figure 241 Latin America Drug Delivery Technologies Market Forecast 2021-2031 (US$billion, AGR%)
Figure 242 Latin America Drug Delivery Technologies Market Forecast by Country 2021-2031 (US$billion)
Figure 243 “V-Shaped Recovery”: Latin America Drug Delivery Technologies Market Forecast by Country 2021-2031 (US$billion)
Figure 244 “U-Shaped Recovery”: Latin America Drug Delivery Technologies Market Forecast by Country 2021-2031 (US$billion)
Figure 245 “W-Shaped Recovery”: Latin America Drug Delivery Technologies Market Forecast by Country 2021-2031 (US$billion)
Figure 246 “L-Shaped Recovery”: Latin America Drug Delivery Technologies Market Forecast by Country 2021-2031 (US$billion)
Figure 247 Latin America Drug Delivery Technologies Market Forecast by Technology, 2021-2031 (US$billion)
Figure 248 “V-Shaped Recovery”: Latin America Drug Delivery Technologies Market Forecast by Technology, 2021-2031 (US$billion)
Figure 249 “U-Shaped Recovery”: Latin America Drug Delivery Technologies Market Forecast by Technology, 2021-2031 (US$billion)
Figure 250 “W-Shaped Recovery”: Latin America Drug Delivery Technologies Market Forecast by Technology, 2021-2031 (US$billion)
Figure 251 “L-Shaped Recovery”: Latin America Drug Delivery Technologies Market Forecast by Technology, 2021-2031 (US$billion)
Figure 252 Latin America Drug Delivery Technologies Market Forecast by Indication, 2021-2031 (US$billion)
Figure 253 “V-Shaped Recovery”: Latin America Drug Delivery Technologies Market Forecast by Indication, 2021-2031 (US$billion)
Figure 254 “U-Shaped Recovery”: Latin America Drug Delivery Technologies Market Forecast by Indication, 2021-2031 (US$billion)
Figure 255 “W-Shaped Recovery”: Latin America Drug Delivery Technologies Market Forecast by Indication, 2021-2031 (US$billion)
Figure 256 “L-Shaped Recovery”: Latin America Drug Delivery Technologies Market Forecast by Indication, 2021-2031 (US$billion)
Figure 257 Latin America Drug Delivery Technologies Market Forecast by End-User, 2021-2031 (US$billion)
Figure 258 “V-Shaped Recovery”: Latin America Drug Delivery Technologies Market Forecast by End-User, 2021-2031 (US$billion)
Figure 259 “U-Shaped Recovery”: Latin America Drug Delivery Technologies Market Forecast by End-User, 2021-2031 (US$billion)
Figure 260 “W-Shaped Recovery”: Latin America Drug Delivery Technologies Market Forecast by End-User, 2021-2031 (US$billion)
Figure 261 “L-Shaped Recovery”: Latin America Drug Delivery Technologies Market Forecast by End-User, 2021-2031 (US$billion)
Figure 262 Brazil Drug Delivery Technologies Market Forecast, 2021-2031 (US$billion, AGR %)
Figure 263 Brazil Drug Delivery Technologies Market Revenue Forecast 2021-2031 (US$billion, AGR%): “V” Shaped Recovery
Figure 264 Brazil Drug Delivery Technologies Market Revenue Forecast 2021-2031 (US$billion, AGR%): “U” Shaped Recovery
Figure 265 Brazil Drug Delivery Technologies Market Revenue Forecast 2021-2031 (US$billion, AGR%): “W” Shaped Recovery
Figure 266 Brazil Drug Delivery Technologies Market Revenue Forecast 2021-2031 (US$billion, AGR%): “L” Shaped Recovery
Figure 267 Mexico Drug Delivery Technologies Market Forecast, 2021-2031 (US$billion, AGR %)
Figure 268 Mexico Drug Delivery Technologies Market Revenue Forecast 2021-2031 (US$billion, AGR%): “V” Shaped Recovery
Figure 269 Mexico Drug Delivery Technologies Market Revenue Forecast 2021-2031 (US$billion, AGR%): “U” Shaped Recovery
Figure 270 Mexico Drug Delivery Technologies Market Revenue Forecast 2021-2031 (US$billion, AGR%): “W” Shaped Recovery
Figure 271 Mexico Drug Delivery Technologies Market Revenue Forecast 2021-2031 (US$billion, AGR%): “L” Shaped Recovery
Figure 272 Rest of Latin America Drug Delivery Technologies Market Forecast, 2021-2031 (US$billion, AGR %)
Figure 273 Rest of Latin America Drug Delivery Technologies Market Revenue Forecast 2021-2031 (US$billion, AGR%): “V” Shaped Recovery
Figure 274 Rest of Latin America Drug Delivery Technologies Market Revenue Forecast 2021-2031 (US$billion, AGR%): “U” Shaped Recovery
Figure 275 Rest of Latin America Drug Delivery Technologies Market Revenue Forecast 2021-2031 (US$billion, AGR%): “W” Shaped Recovery
Figure 276 Rest of Latin America Drug Delivery Technologies Market Revenue Forecast 2021-2031 (US$billion, AGR%): “L” Shaped Recovery
Figure 277 MEA Drug Delivery Technologies Market Forecast 2021-2031 (US$billion, AGR%)
Figure 278 MEA Drug Delivery Technologies Market Forecast by Country 2021-2031 (US$billion)
Figure 279 “V-Shaped Recovery”: MEA Drug Delivery Technologies Market Forecast by Country 2021-2031 (US$billion)
Figure 280 “U-Shaped Recovery”: MEA Drug Delivery Technologies Market Forecast by Country 2021-2031 (US$billion)
Figure 281 “W-Shaped Recovery”: MEA Drug Delivery Technologies Market Forecast by Country 2021-2031 (US$billion)
Figure 282 “L-Shaped Recovery”: MEA Drug Delivery Technologies Market Forecast by Country 2021-2031 (US$billion)
Figure 283 MEA Drug Delivery Technologies Market Forecast by Technology, 2021-2031 (US$billion)
Figure 284 “V-Shaped Recovery”: MEA Drug Delivery Technologies Market Forecast by Technology, 2021-2031 (US$billion)
Figure 285 “U-Shaped Recovery”: MEA Drug Delivery Technologies Market Forecast by Technology, 2021-2031 (US$billion)
Figure 286 “W-Shaped Recovery”: MEA Drug Delivery Technologies Market Forecast by Technology, 2021-2031 (US$billion)
Figure 287 “L-Shaped Recovery”: MEA Drug Delivery Technologies Market Forecast by Technology, 2021-2031 (US$billion)
Figure 288 MEA Drug Delivery Technologies Market Forecast by Indication, 2021-2031 (US$billion)
Figure 289 “V-Shaped Recovery”: MEA Drug Delivery Technologies Market Forecast by Indication, 2021-2031 (US$billion)
Figure 290 “U-Shaped Recovery”: MEA Drug Delivery Technologies Market Forecast by Indication, 2021-2031 (US$billion)
Figure 291 “W-Shaped Recovery”: MEA Drug Delivery Technologies Market Forecast by Indication, 2021-2031 (US$billion)
Figure 292 “L-Shaped Recovery”: MEA Drug Delivery Technologies Market Forecast by Indication, 2021-2031 (US$billion)
Figure 293 MEA Drug Delivery Technologies Market Forecast by End-User, 2021-2031 (US$billion)
Figure 294 “V-Shaped Recovery”: MEA Drug Delivery Technologies Market Forecast by End-User, 2021-2031 (US$billion)
Figure 295 “U-Shaped Recovery”: MEA Drug Delivery Technologies Market Forecast by End-User, 2021-2031 (US$billion)
Figure 296 “W-Shaped Recovery”: MEA Drug Delivery Technologies Market Forecast by End-User, 2021-2031 (US$billion)
Figure 297 “L-Shaped Recovery”: MEA Drug Delivery Technologies Market Forecast by End-User, 2021-2031 (US$billion)
Figure 298 South Africa Drug Delivery Technologies Market Forecast, 2021-2031 (US$billion, AGR %)
Figure 299 South Africa Drug Delivery Technologies Market Revenue Forecast 2021-2031 (US$billion, AGR%): “V” Shaped Recovery
Figure 300 South Africa Drug Delivery Technologies Market Revenue Forecast 2021-2031 (US$billion, AGR%): “U” Shaped Recovery
Figure 301 South Africa Drug Delivery Technologies Market Revenue Forecast 2021-2031 (US$billion, AGR%): “W” Shaped Recovery
Figure 302 South Africa Drug Delivery Technologies Market Revenue Forecast 2021-2031 (US$billion, AGR%): “L” Shaped Recovery
Figure 303 GCC Drug Delivery Technologies Market Forecast, 2021-2031 (US$billion, AGR %)
Figure 304 GCC Drug Delivery Technologies Market Revenue Forecast 2021-2031 (US$billion, AGR%): “V” Shaped Recovery
Figure 305 GCC Drug Delivery Technologies Market Revenue Forecast 2021-2031 (US$billion, AGR%): “U” Shaped Recovery
Figure 306 GCC Drug Delivery Technologies Market Revenue Forecast 2021-2031 (US$billion, AGR%): “W” Shaped Recovery
Figure 307 GCC Drug Delivery Technologies Market Revenue Forecast 2021-2031 (US$billion, AGR%): “L” Shaped Recovery
Figure 308 Rest of MEA Drug Delivery Technologies Market Forecast, 2021-2031 (US$billion, AGR %)
Figure 309 Rest of MEA Drug Delivery Technologies Market Revenue Forecast 2021-2031 (US$billion, AGR%): “V” Shaped Recovery
Figure 310 Rest of MEA Drug Delivery Technologies Market Revenue Forecast 2021-2031 (US$billion, AGR%): “U” Shaped Recovery
Figure 311 Rest of MEA Drug Delivery Technologies Market Revenue Forecast 2021-2031 (US$billion, AGR%): “W” Shaped Recovery
Figure 312 Rest of MEA Drug Delivery Technologies Market Revenue Forecast 2021-2031 (US$billion, AGR%): “L” Shaped Recovery
Figure 313 Cellular Immunotherapy Market: Company Share Analysis, 2020
Figure 314 Novartis AG: Net Revenue, 2016-2020 (US$billion, AGR%)
Figure 315 Novartis AG: Business Segments Revenue Shares, 2020
Figure 316 Novartis AG: Pharmaceuticals Business Unit Revenue Shares, 2020
Figure 317 Novartis AG: Regional Revenue Shares, 2020
Figure 318 Gilead Sciences, Inc.: Net Revenue, 2016-2020 (US$billion, AGR%)
Figure 319 Gilead Sciences, Inc.: Business Segments Revenue Shares, 2020
Figure 320 Gilead Sciences, Inc.: Regional Revenue Shares, 2020
Figure 321 GlaxoSmithKline plc.: Net Revenue, 2016-2020 (US$billion, AGR%)
Figure 322 GlaxoSmithKline plc.: Pharmaceutical Business Revenue Shares, 2020
Figure 323 GlaxoSmithKline plc.: Regional Revenue Shares, 2020
Figure 324 Pfizer Inc.: Net Revenue, 2016-2020 (US$billion, AGR%)
Figure 325 Pfizer Inc.: Product Segment Revenue Shares, 2020
Figure 326 Pfizer Inc.: Regional Segment Revenue Shares, 2020
Figure 327 F. Hoffmann-La Roche Ltd.: Net Revenue, 2016-2020 (US$billion, AGR%)
Figure 328 F. Hoffmann-La Roche Ltd.: Product Revenue Shares, 2020
Figure 329 F. Hoffmann-La Roche Ltd.: Regional Revenue Shares, 2020
Figure 330 Johnson & Johnson: Net Revenue, 2016-2020 (US$billion, AGR%)
Figure 331 Johnson & Johnson: Product Revenue Shares, 2020
Figure 332 Johnson & Johnson: Region Revenue Shares, 2020
Figure 333 KINDEVA DRUG DELIVERY: Net Revenue, 2016-2020 (US$Billion, AGR%)
Figure 334 Eli Lilly and Company: Net Revenue, 2016-2020 (US$billion, AGR%)
Figure 335 AstraZeneca: Net Revenue, 2016-2020 (US$billion, AGR%)
Figure 336 AstraZeneca: Product Revenue Shares, 2020
Figure 337 AstraZeneca: Regional Revenue Shares, 2020
Figure 338 Boehringer Ingelheim International GmbH: Net Revenue, 2016-2020 (US$Billion, AGR%)
Figure 339 Boehringer Ingelheim International GmbH: Product Revenue Shares, 2020
Figure 340 Boehringer Ingelheim International GmbH: Region Revenue Shares, 2020
Figure 341 Amgen Inc.: Net Revenue, 2016-2020 (US$billion, AGR%)
Figure 342 Bristol-Myers Squibb Company: Net Revenue, 2016-2020 (US$billion, AGR%)
Figure 343 Bristol-Myers Squibb Company: Regional Revenue Shares, 2020
Figure 344 Sanofi: Net Revenue, 2016-2020 (US$Billion, AGR%)
Figure 345 Sanofi: Product Revenue Shares, 2020
Figure 346 Sanofi: Region Revenue Shares, 2020
Figure 347 Becton, Dickinson and Company: Net Revenue, 2016-2020 (US$Billion, AGR%)
Figure 348 Becton, Dickinson and Company: Product Revenue Shares, 2020
Figure 349 Becton, Dickinson and Company: Region Revenue Shares, 2020
Figure 350 Bayer AG: Net Revenue, 2016-2020 (US$Billion, AGR%)
Figure 351 Bayer AG: Product Revenue Shares, 2020
Figure 352 Bayer AG: Region Revenue Shares, 2020
Amgen Inc.
AstraZeneca
Bayer AG
Becton, Dickinson and Company (BD)
Boehringer Ingelheim
Bristol Myers Squibb
Eli Lilly and Company
F. Hoffmann-La Roche AG
Gilead Sciences, Inc.
GlaxoSmithKline
Johnson & Johnson
Kindeva Drug Delivery
Novartis AG
Pfizer Inc.
Sanofi
List of Companies Mentioned in the Report:
Abingworth
Acorn Campus Ventures
Adaptimmune
AFA Försäkring
AGF Private Equity
AgonOx
Agreen Biotech
Aju IB Investment
Alaska Permanent Fund
Alexandria Ventures
Allos Therapeutics
Altor BioScience
Amgen
Applied Immune Technologies
Aquilo Capital Management
ARCH Venture Partners
Artax Biopharma
AstraZeneca
Atara Biotherapeutics
Atlas Venture
Autolus (spin off from UCL)
AVG Ventures
Banca Esperia
BankInvest Biomedical Venture
Bayer
Baylor College of Medicine
Bellicum Pharmaceuticals
Bezos Expeditions
Biogen
BioNTech
Biotecnol
bluebird bio
Bpifrance
Brace Pharma Capital
Bristol-Myers Squibb
Broad Institute
Broadfin Capital
Cabaret Biotech
California Institute for Regenerative Medicine
California Institute of Technology
California Stem Cell Agency
Cancer Prevention and Research Institute of Texas
Caribou Sciences
CARsgen
Casdin Capital
Catalyst
Celdara
Celgene
Cell Therapy Catapult
Cellectis
CELLforCURE
Cellular Biomedicine Group
Cellular Therapeutics
Celyad
Children with Leukaemia
Chinese PLA General Hospital
City of Hope Medical Center
CLL Global Research Foundation Alliance
Cold Genesys
Conkwest
Cowen Investment
CRISPR Therapeutics
CrunchFund
Cyto Pulse
Dartmouth College
Deerfield Partners
Dendreon Corporation
Deutsche Krebshilfe
Duke University
Easton Capital
EcoR1 Capital
Editas Medicine
Edmond Venture Capital
Ehime University
Eisai
Eli Lilly
Endocyte
Erasmus University
Eureka Therapeutics
Fate Therapeutics
Felicis Ventures
Fidelity Biosciences
Fiverings Co.
Flagship Ventures
Forbion Capital Partners
Foresite Capital
Formula Pharmaceuticals
Fred Hutchinson Cancer Research Center
Fujita Health University
GammaCell Biotechnologies
Genentech
Genzyme (Sanofi)
Genzyme Ventures
Gilead Sciences
GlaxoSmithKline
Google Ventures
Griffin Securities
H. Lee Moffitt Cancer Center and Research Institute
Harbinger Venture Capital
Harvard University
Healthcare investment company Syncona
Heat Biologics
Herlev Hospital
High Line Venture Partners
ImmunoCellular Therapeutics
Immunocore
Imperial Innovations
IMS Health Capital
Innovative Genome Initiative
Intellia Therapeutics
Intrexon
Iowa State University
Jannsen Biotech
Jennison Associates
Jichi Medical University
JMP Securities
John Hopkins University
John Wayne Cancer Institute
Jonsson Comprehensive Cancer Center
JP Moulton Charitable Foundation
Juno Therapeutics
Karolinska University Hospital
Keio University, School of Medicine
Khosla Ventures
Kite Pharma
Leiden University Medical Center
Leukemia and Lymphoma Society
Ligand Pharmaceuticals
Lion Biotechnologies
Lonza Biologics
Loyola University
M.D. Anderson Cancer Center
Massachusetts Institute of Technology
MaxCyte
Mayo Clinic
Medigene
Memorial Sloan Kettering Cancer Center
Merck
Merck Serono
Mie University
Millennium Pharmaceuticals
MolMed
Monash University
Morphotek
Mustang Therapeutics
Nagoya University
Nantes University Hospital
Nantworks
National Cancer Institute
National Institute of Health
National University of Singapore
NeoStem
New Enterprise Associates (NEA)
New Leaf Venture
Novartis
Novartis Institute for Biomedical Research (NIBR)
Novo A/S
Oberland Capital Healthcare
ODYSSEE Venture
Ohio University
Omega Funds
Oncodesign Biotechnology
OnCyte
Ono Pharmaceutical Co.
Onyx Pharmaceuticals
Opexa Therapeutics
Opus Bio
OrbiMed Advisors
Oxford BioMedica
Partners Innovation Fund
Pasteur Institute
Peking University
Perceptive Advisors
Perelman School of Medicine, University of Pennsylvania
Peter MacCallum Cancer Centre, University of Melbourne
Pfizer
Pharmacyclics
Polaris Partners
Pontifax
Precision Biosciences/Pregenen
Precision Genome Engineering
Progenitor Cell Therapy
Pure MHC
QueensBridge Venture Partners
Quogue Capital
QVT Financial
RA capital Management
Ramius Capital Group
Redmile Group
Remeditex Ventures
Renji Hospital
Ridgeway Capital Partners
Riverbank Capital Securities
Roche
Rock Spring Capital
Roswell Park Cancer Institute
Sabby Capital
San Raffaele Hospital (OSR)
Sanderling Ventures
Sangamo Biosciences
Sanofi-Genzyme BioVentures
Seattle Children's Hospital
Seattle Genetics
Sectoral Asset Management
Servier
Shanghai Cancer Institute
Sheba Medical Center
Shenzhen Second People's Hospital
Shionogi
Silicon Valley Bank
Sorrento Therapeutics
Southwest Hospital
Spectrum Pharmaceuticals
SR One
St. Jude Children’s Research Hospital
Stage Cell Therapeutics
Statcom Co.
Suma Ventures
Sun Yat-Sen University
Sunol Molecular Corporation
SV Angel
Swedish Cancer Society
T-Cell Factory
T. Rowe Price Associates
Takara Bio
Tel Aviv Sourasky Medical Centre
TETHYS
Texas Children's Hospital
The Children's Hospital of Philadelphia
The Christie NHS Foundation Trust
The Methodist Hospital System
The Netherlands Cancer Institute
Theravectys
Thermo Fisher Scientific
Third Rock Ventures
Three Arch Opportunity Fund
TILT Biotherapeutics
TNK Therapeutics (wholly owned subsidiary of Sorrento Therapeutics)
Transposagen Biopharmaceuticals
TVM Capital
Two Blades Foundation
TxCell
University College of London
University Health Network
University of California
University of Connecticut
University of Florida
University of Milano-Bicocca
University of Minnesota
University of Oxford
University of Southern California
University of Zurich
Unum Therapeutics
Uppsala University
Valeant Pharmaceuticals
venBio
Venrock
Versant Ventures
Viking Global Investors
Weill Cornell Medical College
Weizmann Institute of Science
Wellington Management
X-Body
Y Combinator
Yuan Capital
ZIOPHARM Oncology
List of Organizations Mentioned in the Report:
ACRF Centre for Advanced Drug Delivery Technologies
Agencia Nacional de Vigiloncia Sanitaria (ANVISA)
American Cancer Society (ACS)
Center for Biologics Evaluation and Research (CBER)
Center for Devices and Radiological Health (CDRH)
Center of Excellence in Immunology (CEI)
Centers for Disease Control and Prevention (CDC)
Centers for Medicare & Medicaid Services programs
European Medicines Agency (EMA)
European Union
Experimental Transplantation & Immunotherapy Branch at CCR
Food and Drug Administration (FDA)
French Government
Government of Japan
Health Ministry (Italy)
Indian Council of Medical Research (ICMR)
Institute for Healthcare Improvement (IHI)
International Agency for Research on Cancer (IARC)
Italian Industry Group Farmindustria
Japanese Ministry of Health, Labour and Welfare
Laboratory of Tumor Immunology and Biology at CCR
Medicines and Healthcare Products Regulatory Agency (MHRA)
Ministry of Health, Labour & Welfare (MHLW)
National Cancer Institute (NCI)
National Cancer Institute's Center for Cancer Research (CCR)
National Development and Reform Commission (NDRC)
National Institutes of Health (NIH)
NCBI
NCI's Division of Cancer Biology's Cancer Immunology, Hematology, and Etiology Branch (CIHEB)
The Therapeutic Goods Administration
United Nations (UN)
University of Connecticut
World Health Organization (WHO)
Download sample pages
Complete the form below to download your free sample pages for Drug Delivery Technologies Market Report 2021-2031Related reports
-
Artificial Intelligence (AI) in Drug Discovery Market Report 2021-2031
Factors such as increasing data volumes for analysis, quick turnaround time for the discovery and development new drug, computing power,...Full DetailsPublished: 31 March 2021 -

Pharma Contract Sales Market Report 2021-2031
Pharma services companies are widening their service offerings (either organically or inorganically through M&A) to become full-service providers, simplifying their...Full DetailsPublished: 13 July 2021 -

Direct-to-Patient Market Report 2021-2031
Over the last few years, Direct-to-Patient has gained widespread attention. DTP companies offer their customers, who are patients, in this...Full DetailsPublished: 24 June 2021 -

Big Data Analytics in Healthcare Market Report 2021-2031
Healthcare has never been more personalized and affordable to anyone. Digital consulting applications use artificial intelligence to provide medical advice...Full DetailsPublished: 11 May 2021 -

Stem Cell Technologies and Applications Market Report 2021-2031
Factors such as rising prevalence of chronic and genetic diseases, increasing application areas of stem cell technologies, technological advancements, and...Full DetailsPublished: 10 August 2021 -

Clinical Trial Supply and Logistics Market for Pharma 2021-2031
Digital innovation in clinical trials and renewed focus on home production will ensure a high growth market for supply chain...Full DetailsPublished: 08 July 2021 -
Colon Targeting Drug Delivery Market Report 2020-2030
The colon targeting drug delivery market is estimated to grow at a CAGR of 9.23% over the forecast period.
...Full DetailsPublished: 14 May 2020 -
Protein Engineering Market Report 2021-2031
Growing investment in drug R&D by pharmaceutical and biopharmaceutical companies; investment by government for novel vaccine development for COVID-19; rising...Full DetailsPublished: 11 February 2021 -
Global Stem Cell Technologies and Applications Market 2020-2030
The global stem cell technologies and applications market is estimated to have reached US $17,791.8 million 2020 and is expected...
Full DetailsPublished: 24 March 2020 -
Inhalation & Nasal Spray Generic Drugs Market Report 2021-2031
Rising prevalence of chronic respiratory diseases including asthma, COPD, and allergic rhinitis; rising geriatric population, escalating investment in drug R&D...Full DetailsPublished: 22 March 2021
Download sample pages
Complete the form below to download your free sample pages for Drug Delivery Technologies Market Report 2021-2031Do you have any custom requirements we can help you with?
Any specific country, geo region, market segment or specific company information?
Email us today, we can discuss your needs and see how we can help: jamie.roberts@visiongain.com
Would you like a free report overview of the report of your choice?
If so, please drop an email to Jamie Roberts stating your chosen report title to jamie.roberts@visiongain.com
Visiongain’s reports are based on comprehensive primary and secondary research. Those studies provide global market forecasts (sales by drug and class, with sub-markets and leading nations covered) and analyses of market drivers and restraints (including SWOT analysis) and current pipeline developments. To find out more about our reports methodology, please email jamie.roberts@visiongain.com
“Thank you for this Gene Therapy R&D Market report and for how easy the process was. Your colleague was very helpful and the report is just right for my purpose. This is the 2nd good report from Visiongain and a good price.”
Dr Luz Chapa Azuella, Mexico
American Association of Colleges of Pharmacy
American College of Clinical Pharmacy
American Pharmacists Association
American Society for Pharmacy Law
American Society of Consultant Pharmacists
American Society of Health-System Pharmacists
Association of Special Pharmaceutical Manufacturers
Australian College of Pharmacy
Biotechnology Industry Organization
Canadian Pharmacists Association
Canadian Society of Hospital Pharmacists
Chinese Pharmaceutical Association
College of Psychiatric and Neurologic Pharmacists
Danish Association of Pharmaconomists
European Association of Employed Community Pharmacists in Europe
European Medicines Agency
Federal Drugs Agency
General Medical Council
Head of Medicines Agency
International Federation of Pharmaceutical Manufacturers & Associations
International Pharmaceutical Federation
International Pharmaceutical Students’ Federation
Medicines and Healthcare Products Regulatory Agency
National Pharmacy Association
Norwegian Pharmacy Association
Ontario Pharmacists Association
Pakistan Pharmacists Association
Pharmaceutical Association of Mauritius
Pharmaceutical Group of the European Union
Pharmaceutical Society of Australia
Pharmaceutical Society of Ireland
Pharmaceutical Society Of New Zealand
Pharmaceutical Society of Northern Ireland
Professional Compounding Centers of America
Royal Pharmaceutical Society
The American Association of Pharmaceutical Scientists
The BioIndustry Association
The Controlled Release Society
The European Federation of Pharmaceutical Industries and Associations
The European Personalised Medicine Association
The Institute of Clinical Research
The International Society for Pharmaceutical Engineering
The Pharmaceutical Association of Israel
The Pharmaceutical Research and Manufacturers of America
The Pharmacy Guild of Australia
The Society of Hospital Pharmacists of Australia
Don’t Miss Out!
Latest Pharma news
Retinal Gene Therapy Market
The global Retinal Gene Therapy market is projected to grow at a CAGR of 9.6% by 2034
26 July 2024
HIV Drugs and Injectables Market
The global HIV Drugs & Injectables market is projected to grow at a CAGR of 4.6 % by 2034
24 July 2024
Digital Twin Technology in Pharmaceutical Manufacturing Market
The global Digital Twin Technology in Pharmaceutical Manufacturing market is projected to grow at a CAGR of 31.3% by 2034
23 July 2024
Specialty Pharma Market
The global Specialty Pharma market is projected to grow at a CAGR of 7.5% by 2034
22 July 2024


