Industries > Pharma > Clinical Trial Supply and Logistics Market for Pharma 2021-2031

Clinical Trial Supply and Logistics Market for Pharma 2021-2031
Forecasts by Packaging & Storage (CTS Packaging & Storage, Labelling, Stability Storage, Randomisation and Blinding, Return and Reconciliation, Others), by Phase (Pre-Clinical Phase, CT Phase I, CT Phase II, CT Phase III, CT Phase III-IV, Post Launch), by Logistics & Distribution (CTS Logistics & Distribution, Medical Devices Transport, Point-of-Care Devices, Bedside Diagnostics, Ancillary Supplies), by Manufacturing (Investigational Medicinal Products, Medical Devices, Powder Blending & Tableting, Test Kits, Ancillary Products, Other), by CT Solutions (Comparator Sourcing, Demand Calculation, Supply Forecast, Inventory Management), by Type (CTS Manufacturing, CTS Logistics & Distribution, CTS Solutions, CTS Packaging & Storage), Direct-to-Patient (Depot-to-Patient Model, Site-to-Patient Model, Direct-From-Patient Model, Hybrid Model), by End-user (CRO’s, Pharma & Biotech, Other) AND Regional and Leading National Market Analysis PLUS Analysis of Leading Clinical Trial Supply and Logistics Companies AND COVID-19 Recovery Scenarios
The Clinical Trials Supply and Logistics Market for Pharma 2021-2031: This report will prove invaluable to leading firms striving for new revenue pockets if they wish to better understand the industry and its underlying dynamics. It will be useful for companies that would like to expand into different industries or to expand their existing operations in a new region.
One Of The Factors Driving The Clinical Trial Supply And Logistics Market Will Be The Demand For Biological And Orphan Drugs
The development of new drugs, therapies, and medical devices is increasing, which will help the market grow. The global clinical trial supply and logistics market is largely driven by technological advancements in pharmaceutical and biologics, particularly in the areas of testing and development of new medical procedures, products, drugs, and experiments.
Pharmaceutical and Biotech firms entering into strategic partnerships with Supply and logistics providers and CROs
Pharmaceutical and biopharmaceutical companies are entering into strategic agreements for better distribution channels and better reach to customers, as well as outsourcing clinical trial supply and logistics to CROs, with the goal of increasing profit margins and expanding their product portfolio to new markets. For better market reach, many companies expanding into developing geographies outsource supply and logistics services to supply and logistics service providers.
What Are These Questions You Should Ask Before Buying A Market Research Report?
• How is the clinical trials supply and logistics market evolving?
• What is driving and restraining the clinical trials supply and logistics market?
• How will each clinical trials supply and logistics submarket segment grow over the forecast period and how much revenue will these submarkets account for in 2031?
• How will the market shares for each clinical trials supply and logistics submarket develop from 2021 to 2031?
• What will be the main driver for the overall market from 2021 to 2031?
• Will leading clinical trials supply and logistics markets broadly follow the macroeconomic dynamics, or will individual national markets outperform others?
• How will the market shares of the national markets change by 2031 and which geographical region will lead the market in 2031?
• Who are the leading players and what are their prospects over the forecast period?
• What are the clinical trials supply and logistics projects for these leading companies?
• How will the industry evolve during the period between 2019 and 2031?What are the implication of clinical trials supply and logistics projects taking place now and over the next 10 years?
• Is there a greater need for product commercialisation to further scale the clinical trials supply and logistics market?
• Where is the clinical trials supply and logistics market heading? And how can you ensure you are at the forefront of the market?
• What can be the best investment options for new product and service lines?
• What are the key prospects for moving companies into a new growth path? C-suite?
You need to discover how this will impact the clinical trials supply and logistics market today, and over the next 10 years:
• Our 683-page report provides 393 tables and 383 charts/graphs exclusively to you.
• The report highlights key lucrative areas in the industry so you can target them – NOW.
• Contains in-depth analyse of global, regional and national sales and growth
• Highlights for you the key successful trends, changes and revenue projections made by your competitors
This report tells you TODAY how the clinical trials supply and logistics market will develop in the next 10 years, and in-line with the variations in COVID-19 economic recession and bounce. This market is more critical now than at any point over the last 10 years.
This report includes data analysis and invaluable insight into how COVID-19 will affect your industry. Access this report today.
To access the data contained in this document please email contactus@visiongain.com
Forecasts to 2031 and other analyses reveal the commercial prospects
• In addition to revenue forecasting to 2031, our new study provides you with recent results, growth rates, and market shares.
• You find original analyses, with business outlooks and developments.
• Discover qualitative analyses (including market dynamics, drivers, opportunities, restraints and challenges), cost structure, impact of rising clinical trials supply and logistics prices and recent developments.
This report includes data analysis and invaluable insight into how COVID-19 will affect the industry and your company. Four COVID-19 recovery patterns and their impact, namely, V, L, W and U are discussed in this report.
Global Clinical Trials Supply and Logistics Market Breakdown by Type
• CTS Manufacturing
• CTS Logistics & Distribution
• CTS Solutions
• CTS Packaging & Storage
Global Clinical Trials Supply and Logistics Market Breakdown by CTS Manufacturing
• Investigational Medicinal product (IMP)
• Medical Devices
• Powder Blending & Tableting
• Test Kits
• Ancillary Products
• Other CT Materials Manufacturing
Global Clinical Trials Supply and Logistics Market Breakdown by CTS Logistics & Distribution
• Biological Samples
• Medical Devices Transport
• Point-of-Care Devices
• Bedside Diagnostics
• Ancillary Supplies
Global Clinical Trials Supply and Logistics Market Breakdown by CT Solutions
• Comparator Sourcing
• Demand Calculation
• Supply Forecast
• Inventory Management
Global Clinical Trials Supply and Logistics Market Breakdown by CTS Packaging & Storage
• Packaging
• Labeling
• Stability Storage
• Randomization and Blinding
• Return and Reconciliation
• Others
Global Clinical Trials Supply and Logistics Market Breakdown by Phase
• Pre-Clinical Phase
• CT Phase I
• CT Phase II
• CT Phase III
• CT Phase III-IV
• Post Launch
Global Clinical Trials Supply and Logistics Market Breakdown by DTP Model
• Depot-to-Patient Model
• Site-to-Patient Model
• Direct-From-Patient Model
• Hybrid Model

In addition to the revenue predictions for the overall world market and segments, you will also find revenue forecasts for 4 regional and 20 leading national markets:
• North America Clinical Trials Supply and Logistics Market, 2021 to 2031 Market Outlook
• U.S. Clinical Trials Supply and Logistics Market, 2021 to 2031 Market Forecast & COVID Impact Analysis
• Canada Clinical Trials Supply and Logistics Market, 2021 to 2031 Market Forecast & COVID Impact Analysis
• Mexico Clinical Trials Supply and Logistics Market, 2021 to 2031 Market Forecast & COVID Impact Analysis
• Europe Clinical Trials Supply and Logistics Market, 2021 to 2031 Market Outlook
• Germany Clinical Trials Supply and Logistics Market, 2021 to 2031 Market Forecast & COVID Impact Analysis
• Spain Clinical Trials Supply and Logistics Market, 2021 to 2031 Market Forecast & COVID Impact Analysis
• United Kingdom Clinical Trials Supply and Logistics Market, 2021 to 2031 Market Forecast & COVID Impact Analysis
• France Clinical Trials Supply and Logistics Market, 2021 to 2031 Market Forecast & COVID Impact Analysis
• Italy Clinical Trials Supply and Logistics Market, 2021 to 2031 Market Forecast & COVID Impact Analysis
• Rest of Europe Market Forecast & COVID Impact Analysis
• Asia Pacific Clinical Trials Supply and Logistics Market, 2021 to 2031 Market Outlook
• China Clinical Trials Supply and Logistics Market, 2021 to 2031 Market Forecast & COVID Impact Analysis
• Japan Clinical Trials Supply and Logistics Market, 2021 to 2031 Market Forecast & COVID Impact Analysis
• India Clinical Trials Supply and Logistics Market, 2021 to 2031 Market Forecast & COVID Impact Analysis
• Australia Clinical Trials Supply and Logistics Market, 2021 to 2031 Market Forecast & COVID Impact Analysis
• South Korea Clinical Trials Supply and Logistics Market, 2021 to 2031 Market Forecast & COVID Impact Analysis
• Rest of Asia Pacific Market Forecast & COVID Impact Analysis
• LAMEA Clinical Trials Supply and Logistics Market, 2021 to 2031 Market Outlook
• Brazil Clinical Trials Supply and Logistics Market, 2021 to 2031 Market Forecast & COVID Impact Analysis
• Turkey Clinical Trials Supply and Logistics Market, 2021 to 2031 Market Forecast & COVID Impact Analysis
• Saudi Arabia Clinical Trials Supply and Logistics Market, 2021 to 2031 Market Forecast & COVID Impact Analysis
• South Africa Clinical Trials Supply and Logistics Market, 2021 to 2031 Market Forecast & COVID Impact Analysis
• UAE Clinical Trials Supply and Logistics Market, 2021 to 2031 Market Forecast & COVID Impact Analysis
• Rest of Latin America, Middle East and Africa
Need industry data? Please contact us today.
The report also includes profiles and for some of the leading companies in the Clinical Trials Supply and Logistics Market, 2021 to 2031, with a focus on this segment of these companies’ operations.
Leading companies and the potential for market growth:
• Catalent, Inc.
• Thermo Fisher Scientific Inc.
• UDG Healthcare PLC
• Infosys Limited
• PRA Health Sciences, Inc.
• Eurofins Scientific SE
• United Parcel Service, Inc. (UPS)
• FedEx Corporation (FedEx)
• Kerry Logistics Network Limited
• Kuehne und Nagel International AG
• Bilcare Limited
• Mayne Pharma Group Ltd
• Intertek Group PLC
• The Almac Group
• Parexel International
• Biocair
• PCI Services
• Lonza’s Capsules & Health Ingredients (CHI)
• Movianto (Walden)
Overall world revenue for Clinical Trials Supply and Logistics Market, 2021 to 2031 in terms of value the market will surpass US$xx million in 2021, our work calculates. We predict strong revenue growth through to 2031. Our work identifies which organizations hold the greatest potential. Discover their capabilities, progress, and commercial prospects, helping you stay ahead.
How the Clinical Trials Supply and Logistics Market, 2021 to 2031 Market report helps you?
In summary, our 680+ page report provides you with the following knowledge:
• Revenue forecasts to 2031 for Clinical Trials Supply and Logistics Market, 2021 to 2031 Market, with forecasts for Type, CTS Manufacturing, CTS Logistics & Distribution, CTS Solutions, CTS Packaging & Storage, Phase, DTP Model, each forecasted at a global and regional level– discover the industry’s prospects, finding the most lucrative places for investments and revenues
• Revenue forecasts to 2031 for 4 regional and 20 key national markets – See forecasts for the Clinical Trials Supply and Logistics Market, 2021 to 2031 market in North America, Europe, Asia-Pacific and LAMEA. Also forecasted is the market in the US, Canada, Mexico, Brazil, Germany, France, UK, Italy, China, India, Japan, and Australia among other prominent economies.
• Prospects for established firms and those seeking to enter the market– including company profiles for 20 of the major companies involved in the Clinical Trials Supply and Logistics Market, 2021 to 2031 Market.
Find quantitative and qualitative analyses with independent predictions. Receive information that only our report contains, staying informed with this invaluable business intelligence.
Information found nowhere else
With our newly report title, you are less likely to fall behind in knowledge or miss out on opportunities. See how our work could benefit your research, analyses, and decisions. Visiongain’s study is for everybody needing commercial analyses for the Clinical Trials Supply and Logistics Market, 2021 to 2031 Market and leading companies. You will find data, trends and predictions.
To access the data contained in this document please email contactus@visiongain.com
Buy our report today Clinical Trial Supply and Logistics Market for Pharma 2021-2031: Forecasts by Packaging & Storage (CTS Packaging & Storage, Labelling, Stability Storage, Randomisation and Blinding, Return and Reconciliation, Others), by Phase (Pre-Clinical Phase, CT Phase I, CT Phase II, CT Phase III, CT Phase III-IV, Post Launch), by Logistics & Distribution (CTS Logistics & Distribution, Medical Devices Transport, Point-of-Care Devices, Bedside Diagnostics, Ancillary Supplies), by Manufacturing (Investigational Medicinal Products, Medical Devices, Powder Blending & Tableting, Test Kits, Ancillary Products, Other), by CT Solutions (Comparator Sourcing, Demand Calculation, Supply Forecast, Inventory Management), by Type (CTS Manufacturing, CTS Logistics & Distribution, CTS Solutions, CTS Packaging & Storage), Direct-to-Patient (Depot-to-Patient Model, Site-to-Patient Model, Direct-From-Patient Model, Hybrid Model), by End-user (CRO’s, Pharma & Biotech, Other) AND Regional and Leading National Market Analysis PLUS Analysis of Leading Clinical Trial Supply and Logistics Companies AND COVID-19 Recovery Scenarios. Avoid missing out by staying informed – order our report now.
Visiongain is a trading partner with the US Federal Government
CCR Ref number: KD4R6
Do you have any custom requirements we can help you with? Any need for a specific country, geo region, market segment or specific company information? Contact us today, we can discuss your needs and see how we can help: sara.peerun@visiongain.com
1.1 Introduction to Clinical Trials Supply and Logistics Market
1.1.1 Sponsors And Contract Research Firms Involved In Drug Discovery Have Recognised The Importance Of Clinical Trials Logistics
1.1.2 Clinical Trials Are Time-Consuming Endeavours That Necessitate The Coordination Of Numerous Roles And Processes.
1.1.3 The Global Clinical Trials Supply Market Is Booming, Due To Rising Prevalence Of Chronic Diseases
1.1.4 Many pharmaceutical companies Are Quickly Adopting DTP Model
1.2 Global Clinical Trial Supply and Logistics Market Definition
1.3 Direct-to-Patient Model
1.4 Why You Should Read This Report
1.5 What This Report Delivers
1.6 Key Questions Answered By This Analytical Report Include:
1.7 Who is This Report For?
1.8 Methodology
1.8.1 Primary Research
1.8.2 Secondary Research
1.8.3 Market Evaluation & Forecasting Methodology
1.9 Frequently Asked Questions (FAQs)
1.10 Associated Visiongain Reports
1.11 About Visiongain
2 Executive Summary
2.1 Europe Is Largest Market Segment Because Innovative And Unique Therapeutic Choices Are In High Demand
2.2 The Logistics And Distribution Segment Dominated The Entire Clinical Trial Materials And Supplies Market
2.3 DTP Clinical Trials Will Continue To Be A Viable Option Beyond The Pandemic
3 Market Dynamics
3.1 Market Driving Factors
3.1.1 One Of The Factors Driving The Clinical Trial Supply And Logistics Market Will Be The Demand For Biological And Orphan Drugs
3.1.2 Increasing innovations in Clinical trial supply and logistics
3.1.3 Pharmaceutical and Biotech firms entering into strategic partnerships with Supply and logistics providers and CROs
3.1.4 Rapid Growth in Market Due to Covid-19 Pandemic
3.1.5 Increased R&D investments and government support expanded the research possibilities
3.1.6 Globalization of Clinical Trials:
3.1.7 DTP Model May Help To Boost Patient Retention
3.1.8 Adopting DTP Elements In Clinical Trials Can Help Improve The Patient Experience During The Entire Process
3.2 Market Restrainting Factors
3.2.1 High Financial Cost
3.2.2 DTP Not Be Fit For All Clinical Trial Studies
3.2.3 Clinical Trial Length Is Influenced By A Number Of Factors
3.2.4 Several Technology Advancements And Chances For Centralised Coordination Have The Potential To Reduce Drug Development Schedules
3.2.5 Difficulties In Recruiting And Retaining Participants
3.2.6 There Are Various Issues Unique To Certain Illness Regions Or Trial Types That Can Make Recruiting And Retaining Participants In Sufficient Numbers Particularly Difficult
3.2.7 Increasing Competition For Qualified Investigators And Sites
3.2.8 Sponsors' Experiences With The Competition Are Influenced To Some Extent By The Size Of Their Company And The Diseases They Specialise In
3.3 Opportunities in the Global Market
3.3.1 AI and Machine Learning are Evolving with More Data
3.3.2 Virtual Trials And Technology Are Gaining Acceptance Among Patients And Sites
3.3.3 Big Companies are Driving the Market
3.3.4 Advantages of Real-world Clinical Trials
3.3.5 New-Age Clinical Studies
3.4 Challenges
3.4.1 Outsourcing Is One Of The Trends That Is Driving Both Opportunities And Challenges
3.4.2 Lockdowns Have Resulted In Clinical Logistical Challenges
3.4.3 Many Funding Sources with Pros and Cons
3.4.4 Patient Recruitment/Access
3.4.5 Absence of Proper Communication Channels
3.4.6 Coordinators Working In Global Clinical Trial Logistics Must Be Part Of An Unbiased Team
3.4.7 When There Is A Change In Leadership, Things Start To Fall Apart
3.5 SWOT Analysis
3.6 PEST Analysis
3.6.1 Political Factors
3.6.2 Economic Factors
3.6.3 Sociocultural Factors
3.6.4 Technological Factors
3.7 Porter’s Five Forces Analysis:
3.7.1 Threat of New Entrants
3.7.2 Power of Suppliers
3.7.3 Power of Buyers
3.7.4 Availability of Substitutes
3.7.5 Competitive Rivalry
4 Global Clinical Trials Supply and Logistics Market Analysis
4.1 Global Market Size Estimation and Forecast
4.1.1 Pre-COVID-19 Market Scenario
4.1.2 Post-COVID-19 Market Scenarios (V, W, U, L-Shaped Recovery Analysis)
5 Global Clinical Trials Supply and Logistics Market By Region
5.1 North America
5.2 Europe
5.3 Asia-Pacific
5.4 LAMEA
5.5 Regional Market Size Estimation and Forecast
5.5.1 Pre-COVID-19 Market Scenario
5.5.2 Post-COVID-19 Market Scenarios (V, W, U, L-Shaped Recovery Analysis)
6 Global Clinical Trials Supply and Logistics Market By Type
6.1 CTS Manufacturing
6.2 CTS Logistics & Distribution
6.3 CTS Solutions
6.4 CTS Packaging and Storage
6.5 Global Market Size Estimation and Forecast By Type
6.5.1 Pre-COVID-19 Market Scenario
6.5.2 Post-COVID-19 Market Scenarios (V, W, U, L-Shaped Recovery Analysis)
7 Global Clinical Trials Supply and Logistics Market By Manufacturing
7.1 Investigational Medicinal product (IMP)
7.2 Medical Devices
7.3 Powder Blending & Tableting
7.4 Ancillary Products
7.5 Global Market Size Estimation and Forecast By Manufacturing
7.5.1 Pre-COVID-19 Market Scenario
7.5.2 Post-COVID-19 Market Scenarios (V, W, U, L-Shaped Recovery Analysis)
8 Global Clinical Trials Supply and Logistics Market By Logistics & Distribution
8.1 CTS Logistics & Distribution
8.2 Medical Devices Transport
8.3 Point-of-Care Devices
8.4 Bedside Diagnostics:
8.5 Ancillary Supplies:
8.6 Global Market Size Estimation and Forecast By Logistics & Distribution
8.6.1 Pre-COVID-19 Market Scenario
8.6.2 Post-COVID-19 Market Scenarios (V, W, U, L-Shaped Recovery Analysis)
9 Global Clinical Trials Supply and Logistics Market By CT Solutions
9.1 Global Market Size Estimation and Forecast By CT Solutions
9.1.1 Pre-COVID-19 Market Scenario
9.1.2 Post-COVID-19 Market Scenarios (V, W, U, L-Shaped Recovery Analysis)
10 Global Clinical Trials Supply and Logistics Market by Packaging & Storage
10.1 Global Market Size Estimation and Forecast By Packaging & Storage
10.1.1 Pre-COVID-19 Market Scenario
10.1.2 Post-COVID-19 Market Scenarios (V, W, U, L-Shaped Recovery Analysis)
11 Global Market Size Estimation and Forecast by Phase
11.1 Global Market Size Estimation and Forecast By Phase
11.1.1 Pre-COVID-19 Market Scenario
11.1.2 Post-COVID-19 Market Scenarios (V, W, U, L-Shaped Recovery Analysis)
12 Global Clinical Trial Supply & Logistics Market by Direct-to-Patient Model
12.1 Segment Overview
12.1.1 Depot-to-Patient Model
12.1.2 Site-to-Patient Model
12.1.3 Direct-From-Patient Model
12.1.4 Hybrid Model
12.1.5 Patient Centricity Has Moved To The Forefront Which Is Driving The Adoption Of DTP Services In Virtual Clinical Trials
12.1.6 For Sponsors, DTP Services Can Boost Participation And Retention, And Potentially Lower Trial Costs
12.1.7 Despite DTP Limitations, Clinical Companies are Opting for it
12.1.8 Entrepreneurs Have Faced Inertia From Corporations Who Are Often Unwilling To Take On The Risk Of New Clinical Modalities
12.1.9 The Preferences Of Clinical Research Participants Are Changing, Driving Stakeholders To Build More Virtual, Patient-Centric Approaches.
12.1.10 COVID-19 Places Additional Financial Pressure On Drug Developers
12.1.11 Clinical Trial Delays Can Amount To Significant Losses Ranging From $600,000 To $8 Million Per Day
12.1.12 Digital Tools Can Generate Cost Savings In The Form Of Reduced Investigator Fees, Site Monitoring Costs, Patient Travel Costs, And Improved Patient Retention
12.1.13 The Regulatory Landscape Is Changing, Encouraging The Adoption Of Software-Enabled Clinical Trials
12.1.14 The Coronavirus Vaccine Has Exposed The Inefficiencies In Drug Development Process
12.1.15 FDA Continues To Pave A Path For Clinical Trial Innovation Going Forward
12.1.16 Virtual Control Arms And Real-World Evidence Platforms
12.1.17 Shift Toward Direct-To-Patient (DTP) Deliveries
12.1.18 Sponsors Need To Understand The Challenges Associated With DTP/DFP
12.1.19 Adopting The Decentralized Trial Approach Introduces New Challenges
12.1.20 DTP Clinical Trials Offer Several Benefits To Sponsors And Patients Alike
12.1.21 Real-World Evidence Is Not A New Category Within Pharma IT
12.1.22 The Majority Of RWE Companies Built To Date Focus On Oncology Data
12.1.23 RWE Companies Are Adopting And Evolving
12.1.24 Clinical Supply Chain Optimization Will Be a High Growth Market in Coming Years
12.1.25 Due To The Lack Of Digital Infrastructure, Close To 95% Of Trials Are Delayed
12.1.26 Randomization and Trial Supply Management (RTSM) Technology in Direct-to-Patient Trials
12.1.27 Should The RTSM Include And Address Patient Names Or Are The CMO/Courier Responsible For Coordinating The Process?
12.1.28 CROs Play Crucial Role in DTP Model Clinical Trials
12.2 Global Market Size Estimation and Forecast Analysis
12.2.1 Pre-COVID-19 Market Scenario
12.2.2 Post-COVID-19 Market Scenarios (V, W, U, L- Shaped Recovery Analysis)
13 North America Clinical Trials Supply and Logistics Market Analysis
13.1 North America Market Outlook
13.1.1 Innovation Of Clinical Trials In North American Region Leading to Market Growth:
13.1.2 R&D Investments in North America
13.1.3 DTP/DFP Are Setting up New Standards for upcoming Clinical Trials
13.2 North America Market Size Estimation and Forecast
13.2.1 Pre-COVID-19 Market Scenario
13.2.2 Post-COVID-19 Market Scenarios (V, W, U, L-Shaped Recovery Analysis)
13.3 Country Market Size Estimation and Forecast
13.3.1 Pre-COVID-19 Market Scenario
13.3.2 Post-COVID-19 Market Scenarios (V, W, U, L-Shaped Recovery Analysis)
13.4 North America Market Size Estimation and Forecast By Type
13.4.1 Pre-COVID-19 Market Scenario
13.4.2 Post-COVID-19 Market Scenarios (V, W, U, L-Shaped Recovery Analysis)
13.5 North America Market Size Estimation and Forecast By Manufacturing
13.5.1 Pre-COVID-19 Market Scenario
13.5.2 Post-COVID-19 Market Scenarios (V, W, U, L-Shaped Recovery Analysis)
13.6 North America Market Size Estimation and Forecast By Logistics & Distribution
13.6.1 Pre-COVID-19 Market Scenario
13.6.2 Post-COVID-19 Market Scenarios (V, W, U, L-Shaped Recovery Analysis)
13.7 North America Market Size Estimation and Forecast By CT Solutions
13.7.1 Pre-COVID-19 Market Scenario
13.7.2 Post-COVID-19 Market Scenarios (V, W, U, L-Shaped Recovery Analysis)
13.8 North America Market Size Estimation and Forecast By Packaging & Storage
13.8.1 Pre-COVID-19 Market Scenario
13.8.2 Post-COVID-19 Market Scenarios (V, W, U, L-Shaped Recovery Analysis)
13.9 North America Market Size Estimation and Forecast By Phase
13.9.1 Pre-COVID-19 Market Scenario
13.9.2 Post-COVID-19 Market Scenarios (V, W, U, L-Shaped Recovery Analysis)
13.10 North America Market Size Estimation and Forecast by DTP Model
13.10.1 Pre-COVID-19 Marke Scenario
13.10.2 Post-COVID-19 Market Scenarios (V, W, U, L-Shaped Recovery Analysis)
13.11 US Clinical Trials Supply and Logistics Market Analysis
13.11.1 Demand For Biological Drugs In US:
13.11.2 Innovation In Clinical Trials:
13.11.3 US Clinical Trials Supply and Logistics Pre-COVID-19 Market Scenario
13.11.4 US Clinical Trials Supply and Logistics Post-COVID-19 Market Scenarios (V, W, U, L-Shaped Recovery Analysis)
13.12 Canada Clinical Trials Supply and Logistics Market Analysis
13.12.1 Canada Investment In Infrastructure and Education Leading to Market Growth:
13.12.2 Large Investment In Clinical Trials:
13.12.3 Canada Clinical Trials Supply and Logistics Pre-COVID-19 Market Scenario
13.12.4 Canada Clinical Trials Supply and Logistics Post-COVID-19 Market Scenarios (V, W, U, L-Shaped Recovery Analysis)
13.13 Mexico Clinical Trials Supply and Logistics Market Analysis
13.13.1 Expansion and Innovation in pharmaceutical Industry:
13.13.2 Building the regulatory framework
13.13.3 Mexico Clinical Trials Supply and Logistics Pre-COVID-19 Market Scenario
13.13.4 Mexico Clinical Trials Supply and Logistics Post-COVID-19 Market Scenarios (V, W, U, L-Shaped Recovery Analysis)
14 Europe Clinical Trials Supply and Logistics Market Analysis
14.1 Europe Market Outlook
14.1.1 Large Investment in Infrastructure for Clinical Research:
14.1.2 Innovation in Clinical Trials
14.1.3 The Use Of Wearable Technology Is Also Gaining Traction Within Clinical Trials
14.2 Europe Market Size Estimation and Forecast
14.2.1 Pre-COVID-19 Market Scenario
14.2.2 Post-COVID-19 Market Scenarios (V, W, U, L-Shaped Recovery Analysis)
14.3 Country Market Size Estimation and Forecast
14.3.1 Pre-COVID-19 Market Scenario
14.3.2 Post-COVID-19 Market Scenarios (V, W, U, L-Shaped Recovery Analysis)
14.4 Europe Market Size Estimation and Forecast By Type
14.4.1 Pre-COVID-19 Market Scenario
14.4.2 Post-COVID-19 Market Scenarios (V, W, U, L-Shaped Recovery Analysis)
14.5 Europe Market Size Estimation and Forecast By Manufacturing
14.5.1 Pre-COVID-19 Market Scenario
14.5.2 Post-COVID-19 Market Scenarios (V, W, U, L-Shaped Recovery Analysis)
14.6 Europe Market Size Estimation and Forecast By Logistics & Distribution
14.6.1 Pre-COVID-19 Market Scenario
14.6.2 Post-COVID-19 Market Scenarios (V, W, U, L-Shaped Recovery Analysis)
14.7 Europe Market Size Estimation and Forecast By CT Solutions
14.7.1 Pre-COVID-19 Market Scenario
14.7.2 Post-COVID-19 Market Scenarios (V, W, U, L-Shaped Recovery Analysis)
14.8 Europe Market Size Estimation and Forecast By Packaging & Storage
14.8.1 Pre-COVID-19 Market Scenario
14.8.2 Post-COVID-19 Market Scenarios (V, W, U, L-Shaped Recovery Analysis)
14.9 Europe Market Size Estimation and Forecast By Phase
14.9.1 Pre-COVID-19 Market Scenario
14.9.2 Post-COVID-19 Market Scenarios (V, W, U, L-Shaped Recovery Analysis)
14.10 Europe Market Size Estimation and Forecast by DTP Model
14.10.1 Pre-COVID-19 Market Scenario
14.10.2 Post-COVID-19 Market Scenarios (V, W, U, L-Shaped Recovery Analysis)
14.11 Germany Clinical Trials Supply and Logistics Market Analysis
14.11.1 Globalization of Clinical Trials:
14.11.2 R&D Excellence and Innovation
14.11.3 Germany Clinical Trials and Logistics Pre-COVID-19 Market Scenario
14.11.4 Germany Clinical Trials and Logistics Post-COVID-19 Market Scenarios (V, W, U, L-Shaped Recovery Analysis)
14.12 UK Clinical Trials Supply and Logistics Market Analysis
14.12.1 UK is Making Large Investments in Pharmaceutical Market:
14.12.2 Commercial Clinical Research Is Important For The UK, But The Country Is Falling Behind In Large Late-Stage Trials
14.12.3 UK Clinical Trials and Logistics Pre-COVID-19 Market Scenario
14.12.4 UK Clinical Trials and Logistics Post-COVID-19 Market Scenarios (V, W, U, L-Shaped Recovery Analysis)
14.13 France Clinical Trials Supply and Logistics Market Analysis
14.13.1 France Demand for Biological and Orphan Drugs:
14.13.2 France Clinical Trials and Logistics Pre-COVID-19 Market Scenario
14.13.3 France Clinical Trials and Logistics Post-COVID-19 Market Scenarios (V, W, U, L-Shaped Recovery Analysis)
14.14 Italy Clinical Trials Supply and Logistics Market Analysis
14.14.1 Italy Innovation in Clinical Trials:
14.14.2 Italy Clinical Trials and Logistics Pre-COVID-19 Market Scenario
14.14.3 Italy Clinical Trials and Logistics Post-COVID-19 Market Scenarios (V, W, U, L-Shaped Recovery Analysis)
14.15 Spain Clinical Trials Supply and Logistics Market Analysis
14.15.1 Boost in Research and Development:
14.15.2 Spain Clinical Trials and Logistics Pre-COVID-19 Market Scenario
14.15.3 Spain Clinical Trials and Logistics Post-COVID-19 Market Scenarios (V, W, U, L-Shaped Recovery Analysis)
14.16 Rest of Europe Clinical Trials Supply and Logistics Market Analysis
14.16.1 Rest of Europe Clinical Trials and Logistics Pre-COVID-19 Market Scenario
14.16.2 Rest of Europe Clinical Trials and Logistics Post-COVID-19 Market Scenarios (V, W, U, L-Shaped Recovery Analysis)
15 Asia-Pacific Clinical Trials Supply and Logistics Market Analysis
15.1 Asia-Pacific Market Outlook
15.1.1 Biomedical Research Leading to Economic growth:
15.1.2 Ease in Government Regulation
15.1.3 DTP/DFP Fulfils The Need For Minimal Disruption To The Patient's Lifestyle While Increasing Their Willingness To Participate In A Clinical Trial
15.2 Asia-Pacific Market Size Estimation and Forecast
15.2.1 Pre-COVID-19 Market Scenario
15.2.2 Post-COVID-19 Market Scenarios (V, W, U, L-Shaped Recovery Analysis)
15.3 Country Market Size Estimation and Forecast
15.3.1 Pre-COVID-19 Market Scenario
15.3.2 Post-COVID-19 Market Scenarios (V, W, U, L-Shaped Recovery Analysis)
15.4 Asia-Pacific Market Size Estimation and Forecast By Type
15.4.1 Pre-COVID-19 Market Scenario
15.4.2 Post-COVID-19 Market Scenarios (V, W, U, L-Shaped Recovery Analysis)
15.5 Asia-Pacific Market Size Estimation and Forecast By Manufacturing
15.5.1 Pre-COVID-19 Market Scenario
15.5.2 Post-COVID-19 Market Scenarios (V, W, U, L-Shaped Recovery Analysis)
15.6 Asia-Pacific Market Size Estimation and Forecast By Logistics & Distribution
15.6.1 Pre-COVID-19 Market Scenario
15.6.2 Post-COVID-19 Market Scenarios (V, W, U, L-Shaped Recovery Analysis)
15.7 Asia-Pacific Market Size Estimation and Forecast By CT Solutions
15.7.1 Pre-COVID-19 Market Scenario
15.7.2 Post-COVID-19 Market Scenarios (V, W, U, L-Shaped Recovery Analysis)
15.8 Asia-Pacific Market Size Estimation and Forecast By Packaging & Storage
15.8.1 Pre-COVID-19 Market Scenario
15.8.2 Post-COVID-19 Market Scenarios (V, W, U, L-Shaped Recovery Analysis)
15.9 Asia-Pacific Market Size Estimation and Forecast By Phase
15.9.1 Pre-COVID-19 Market Scenario
15.9.2 Post-COVID-19 Market Scenarios (V, W, U, L-Shaped Recovery Analysis)
15.10 Asia-Pacific Market Size Estimation and Forecast by DTP Model
15.10.1 Pre-COVID-19 Market Scenario
15.10.2 Post-COVID-19 Market Scenarios (V, W, U, L-Shaped Recovery Analysis)
15.11 China Clinical Trials Supply and Logistics Market Analysis
15.11.1 The advantages of being in China for an international CRO
15.11.2 The Chinese regulatory environment
15.11.3 Challenges in clinical development
15.11.4 Short- and long-term goals
15.11.5 China Clinical Trials Supply and Logistics Pre-COVID-19 Market Scenario
15.11.6 China Clinical Trials Supply and Logistics Post-COVID-19 Market Scenarios (V, W, U, L-Shaped Recovery Analysis)
15.12 India Clinical Trials Supply and Logistics Market Analysis
15.12.1 India to Become key Location of Clinical Trials:
15.12.2 Advantages of Conducting Clinical Research Studies in India
15.12.3 India Clinical Trials Supply and Logistics Pre-COVID-19 Market Scenario
15.12.4 India Clinical Trials Supply and Logistics Post-COVID-19 Market Scenarios (V, W, U, L-Shaped Recovery Analysis)
15.13 Japan Clinical Trials Supply and Logistics Market Analysis
15.13.1 Collaboration with Neighbouring Countries:
15.13.2 More international clinical trials:
15.13.3 The obstacles to simultaneous drug development:
15.13.4 Japan Clinical Trials Supply and Logistics Pre-COVID-19 Market Scenario
15.13.5 Japan Clinical Trials Supply and Logistics Post-COVID-19 Market Scenarios (V, W, U, L-Shaped Recovery Analysis)
15.14 South Korea Clinical Trials Supply and Logistics Market Analysis
15.14.1 Why South Korea Is The Hottest Growth Spot For Clinical Trials
15.14.2 Simplifying The Regulatory Process
15.14.3 South Korea Clinical Trials Supply and Logistics Pre-COVID-19 Market Scenario
15.14.4 South Korea Clinical Trials Supply and Logistics Post-COVID-19 Market Scenarios (V, W, U, L-Shaped Recovery Analysis)
15.15 Australia Clinical Trials Supply and Logistics Market Analysis
15.15.1 Australia’s clinical trials industry is experiencing ‘unprecedented support’
15.15.2 Australia Clinical Trials Supply and Logistics Pre-COVID-19 Market Scenario
15.15.3 Australia Clinical Trials Supply and Logistics Post-COVID-19 Market Scenarios (V, W, U, L-Shaped Recovery Analysis)
15.16 Rest of Asia-Pacific Clinical Trials Supply and Logistics Market Analysis
15.16.1 Rest of Asia-Pacific Clinical Trials Supply and Logistics Pre-COVID-19 Market Scenario
15.16.2 Rest of Asia-Pacific Clinical Trials Supply and Logistics Post-COVID-19 Market Scenarios (V, W, U, L-Shaped Recovery Analysis)
16 LAMEA Clinical Trials Supply and Logistics Market Analysis
16.1 LAMEA Market Outlook
16.1.1 Innovation of Clinical Trials in LAMEA Market:
16.1.2 Opportunities for clinical research in Latin America
16.1.3 There Is A Large Opportunity For DTP Companies To Connect The Various Stakeholders Involved In Trials
16.1.4 The organization and logistics of shipping is one of the key DtP Model Success
16.2 LAMEA Market Size Estimation and Forecast
16.2.1 Pre-COVID-19 Market Scenario
16.2.2 Post-COVID-19 Market Scenarios (V, W, U, L-Shaped Recovery Analysis)
16.3 Country Market Size Estimation and Forecast
16.3.1 Pre-COVID-19 Market Scenario
16.3.2 Post-COVID-19 Market Scenarios (V, W, U, L-Shaped Recovery Analysis)
16.4 LAMEA Market Size Estimation and Forecast By Type
16.4.1 Pre-COVID-19 Market Scenario
16.4.2 Post-COVID-19 Market Scenarios (V, W, U, L-Shaped Recovery Analysis)
16.5 LAMEA Market Size Estimation and Forecast By Manufacturing
16.5.1 Pre-COVID-19 Market Scenario
16.5.2 Post-COVID-19 Market Scenarios (V, W, U, L-Shaped Recovery Analysis)
16.6 LAMEA Market Size Estimation and Forecast By Logistics & Distribution
16.6.1 Pre-COVID-19 Market Scenario
16.6.2 Post-COVID-19 Market Scenarios (V, W, U, L-Shaped Recovery Analysis)
16.7 LAMEA Market Size Estimation and Forecast By CT Solutions
16.7.1 Pre-COVID-19 Market Scenario
16.7.2 Post-COVID-19 Market Scenarios (V, W, U, L-Shaped Recovery Analysis)
16.8 LAMEA Market Size Estimation and Forecast By Packaging & Storage
16.8.1 Pre-COVID-19 Market Scenario
16.8.2 Post-COVID-19 Market Scenarios (V, W, U, L-Shaped Recovery Analysis)
16.9 LAMEA Market Size Estimation and Forecast By Phase
16.9.1 Pre-COVID-19 Market Scenario
16.9.2 Post-COVID-19 Market Scenarios (V, W, U, L-Shaped Recovery Analysis)
16.10 LAMEA Market Size Estimation and Forecast by DTP Model
16.10.1 Pre-COVID-19 Market Scenario
16.10.2 Post-COVID-19 Market Scenarios (V, W, U, L-Shaped Recovery Analysis)
16.11 Brazil Clinical Trials Supply and Logistics Market Analysis
16.11.1 Brazil Population Driving the Attention Of Pharmaceutical And Biotechnology Companies
16.11.2 Brazil Clinical Trial Supply and Logistics Pre-COVID-19 Market Scenario
16.11.3 Brazil Clinical Trial Supply and Logistics Post-COVID-19 Market Scenarios (V, W, U, L-Shaped Recovery Analysis)
16.12 South Africa Clinical Trials Supply and Logistics Market Analysis
16.12.1 Rising Demand In Clinical Trials Around The World
16.12.2 Rising Population And Increased Frequency Of Diseases
16.12.3 South Africa Clinical Trial Supply and Logistics Pre-COVID-19 Market Scenario
16.12.4 South Africa Clinical Trial Supply and Logistics Post-COVID-19 Market Scenarios (V, W, U, L-Shaped Recovery Analysis)
16.13 Saudi Arabia Clinical Trials Supply and Logistics Market Analysis
16.13.1 Impact on local investment and the development of healthcare capabilities in Saudi Arabia:
16.13.2 Saudi Arabia Clinical Trial Supply and Logistics Pre-COVID-19 Market Scenario
16.13.3 Saudi Arabia Clinical Trial Supply and Logistics Post-COVID-19 Market Scenarios (V, W, U, L-Shaped Recovery Analysis)
16.14 Turkey Clinical Trials Supply and Logistics Market Analysis
16.14.1 Large pharmaceutical business in Turkey:
16.14.2 R&D investment in the Turkish pharmaceutical Market:
16.14.3 Turkey Clinical Trial Supply and Logistics Pre-COVID-19 Market Scenario
16.14.4 Turkey Clinical Trial Supply and Logistics Post-COVID-19 Market Scenarios (V, W, U, L-Shaped Recovery Analysis)
16.15 UAE Clinical Trials Supply and Logistics Market Analysis
16.15.1 Clinical Research Organisation is Growing due to Cost Effectiveness and Presence of Big Pharma Companies in UAE Market:
16.15.2 UAE Clinical Trial Supply and Logistics Pre-COVID-19 Market Scenario
16.15.3 UAE Clinical Trial Supply and Logistics Post-COVID-19 Market Scenarios (V, W, U, L-Shaped Recovery Analysis)
16.16 Rest of LAMEA Clinical Trials Supply and Logistics Market Analysis
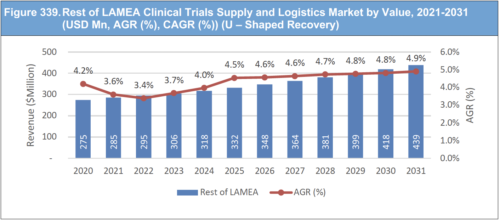
16.16.1 Rest of LAMEA Clinical Trial Supply and Logistics Pre-COVID-19 Market Scenario
16.16.2 Rest of LAMEA Clinical Trial Supply and Logistics Post-COVID-19 Market Scenarios (V, W, U, L-Shaped Recovery Analysis)
17 Competitive Landscape
17.1 Company Market Share Analysis
17.2 Key Business Strategy Analysis
17.3 New Product/Service Launch as the Key Business Strategy In the Global Market
17.4 Acquisition as the Key Business Strategy In the Global Market
17.5 Partnership as the Key Business Strategy In the Global Market
17.6 Collaboration as the Key Business Strategy In the Global Market
17.7 Expansion as the Key Business Strategy In the Global Market
17.8 Joint Venture as the Key Business Strategy In the Global Market
18 Leading Company Profiles
18.1 Catalent Inc
18.1.1 Company Snapshot
18.1.2 Company Overview
18.1.3 Financial Analysis
18.1.4 Product Benchmarking
18.1.5 Recent Developments
18.2 Thermo Fisher Scientific Inc.
18.2.1 Company Snapshot
18.2.2 Company Overview
18.2.3 Financial Analysis
18.2.4 Product Benchmarking
18.2.5 Recent Developments
18.3 UDG Healthcare Plc
18.3.1 Company Snapshot
18.3.2 Company Overview
18.3.3 Financial Analysis
18.3.4 Product Benchmarking
18.3.5 Recent Developments
18.4 Infosys
18.4.1 Company Snapshot
18.4.2 Company Overview
18.4.3 Financial Analysis
18.4.4 Product Benchmarking
18.4.5 Recent Developments
18.5 PRA Health Sciences
18.5.1 Company Snapshot
18.5.2 Company Overview
18.5.3 Financial Analysis
18.5.4 Product Benchmarking
18.5.5 Recent Developments
18.6 Eurofins Scientific
18.6.1 Company Snapshot
18.6.2 Company Overview
18.6.3 Financial Analysis
18.6.4 Product Benchmarking
18.6.5 Recent Developments
18.7 FedEx
18.7.1 Company Snapshot
18.7.2 Company Overview
18.7.3 Financial Analysis
18.7.4 Product Benchmarking
18.8 United Parcel Services
18.8.1 Company Snapshot
18.8.2 Company Overview
18.8.3 Financial Analysis
18.8.4 Product Benchmarking
18.8.5 Recent Developments
18.9 Kerry Logistics
18.9.1 Company Snapshot
18.9.2 Company Overview
18.9.3 Financial Analysis
18.9.4 Product Benchmarking
18.10 Kuehne + Nagel
18.10.1 Company Snapshot
18.10.2 Company Overview
18.10.3 Financial Analysis
18.10.4 Product Benchmarking
18.10.5 Recent Developments
18.11 Bilcare Limited
18.11.1 Company Snapshot
18.11.2 Company Overview
18.11.3 Financial Analysis
18.11.4 Product Benchmarking
18.12 Mayne Pharma Group Ltd
18.12.1 Company Snapshot
18.12.2 Company Overview
18.12.3 Financial Analysis
18.12.4 Product Benchmarking
18.12.5 Recent Developments
18.13 Intertek Group PLC
18.13.1 Company Snapshot
18.13.2 Company Overview
18.13.3 Financial Analysis
18.13.4 Product Benchmarking
18.13.5 Recent Developments
18.14 Almac Group
18.14.1 Company Snapshot
18.14.2 Company Overview
18.14.3 Product Benchmarking
18.14.4 Recent Developments
18.15 Parexel
18.15.1 Company Snapshot
18.15.2 Company Overview
18.15.3 Product Benchmarking
18.15.4 Recent Developments
18.16 Biocair
18.16.1 Company Snapshot
18.16.2 Company Overview
18.16.3 Product Benchmarking
18.16.4 Recent Developments
18.17 Marken
18.17.1 Company Snapshot
18.17.2 Company Overview
18.17.3 Product Benchmarking
18.17.4 Recent Developments
18.18 PCI Services
18.18.1 Company Snapshot
18.18.2 Company Overview
18.18.3 Product Benchmarking
18.18.4 Recent Developments
18.19 Capsugel
18.19.1 Company Snapshot
18.19.2 Company Overview
18.19.3 Product Benchmarking
18.19.4 Recent Developments
18.20 Movianto
18.20.1 Company Snapshot
18.20.2 Company Overview
18.20.3 Product Benchmarking
19 Conclusion & Recommendations
19.1 Concluding Remarks
19.1.1 Right Logistics Partner Is A Must For Success Of DTP Model
19.2 Recommendations for Market Players
List of Tables
Table 1. Global Clinical Trial Supply and Logistics Market Snapshot, 2021 & 2031 (US$million, CAGR %)
Table 2. Global Clinical Trials Supply and Logistics Market SWOT Analysis 2021-2031
Table 3. Global Clinical Trial Supply & Logistics Market Forecast, 2021-2031 (USD Mn, AGR (%), CAGR(%))
Table 4. Global Clinical Trial Supply & Logistics Market Forecast, 2021-2031 (USD Mn, AGR (%), CAGR(%)) (V – Shaped Recovery)
Table 5. Global Clinical Trial Supply & Logistics Market Forecast, 2021-2031 (USD Mn, AGR (%), CAGR(%)) (W – Shaped Recovery)
Table 6. Global Clinical Trial Supply & Logistics Market Forecast, 2021-2031 (USD Mn, AGR (%), CAGR(%)) (U – Shaped Recovery)
Table 7. Global Clinical Trial Supply & Logistics Market Forecast, 2021-2031 (USD Mn, AGR (%), CAGR(%)) (L – Shaped Recovery)
Table 8. Global Clinical Trial Supply & Logistics Market by Region, 2021-2031 (USD Mn, AGR (%), CAGR(%))
Table 9. Global Clinical Trial Supply & Logistics Market by Region, 2021-2031 (USD Mn, AGR (%), CAGR(%)) (V – Shaped Recovery)
Table 10. Global Clinical Trial Supply & Logistics Market by Region, 2021-2031 (USD Mn, AGR (%), CAGR(%)) (W – Shaped Recovery)
Table 11. Global Clinical Trial Supply & Logistics Market by Region, 2021-2031 (USD Mn, AGR (%), CAGR(%)) (U – Shaped Recovery)
Table 12. Global Clinical Trial Supply & Logistics Market by Region, 2021-2031 (USD Mn, AGR (%), CAGR(%)) (L – Shaped Recovery)
Table 13. Global Clinical Trial Supply & Logistics Market by Type, 2021-2031 (USD Mn, AGR (%), CAGR(%))
Table 14. Global Clinical Trial Supply & Logistics Market by Type, 2021-2031 (USD Mn, AGR (%), CAGR(%)) (V – Shaped Recovery)
Table 15. Global Clinical Trial Supply & Logistics Market by Type, 2021-2031 (USD Mn, AGR (%), CAGR(%)) (W – Shaped Recovery)
Table 16. Global Clinical Trial Supply & Logistics Market by Type, 2021-2031 (USD Mn, AGR (%), CAGR(%)) (U – Shaped Recovery)
Table 17. Global Clinical Trial Supply & Logistics Market by Type, 2021-2031 (USD Mn, AGR (%), CAGR(%)) (L – Shaped Recovery)
Table 18. Global Clinical Trial Supply Market by Manufacturing, 2021-2031 (USD Mn, AGR (%), CAGR(%))
Table 19. Global Clinical Trial Supply Market by Manufacturing, 2021-2031 (USD Mn, AGR (%), CAGR(%)) (V – Shaped Recovery)
Table 20. Global Clinical Trial Supply Market by Manufacturing, 2021-2031 (USD Mn, AGR (%), CAGR(%)) (W – Shaped Recovery)
Table 21. Global Clinical Trial Supply Market by Manufacturing, 2021-2031 (USD Mn, AGR (%), CAGR(%)) (U – Shaped Recovery)
Table 22. Global Clinical Trial Supply Market by Manufacturing, 2021-2031 (USD Mn, AGR (%), CAGR(%)) (L – Shaped Recovery)
Table 23. Global Clinical Trial Supply Market by Logistics & Distribution, 2021-2031 (USD Mn, AGR (%), CAGR(%))
Table 24. Global Clinical Trial Supply Market by Logistics & Distribution, 2021-2031 (USD Mn, AGR (%), CAGR(%)) (V – Shaped Recovery)
Table 25. Global Clinical Trial Supply Market by Logistics & Distribution, 2021-2031 (USD Mn, AGR (%), CAGR(%)) (W – Shaped Recovery)
Table 26. Global Clinical Trial Supply Market by Logistics & Distribution, 2021-2031 (USD Mn, AGR (%), CAGR(%)) (U – Shaped Recovery)
Table 27. Global Clinical Trial Supply Market by Logistics & Distribution, 2021-2031 (USD Mn, AGR (%), CAGR(%)) (L – Shaped Recovery)
Table 28. Global Clinical Trial Supply & Logistics Market by CT Solutions, 2021-2031 (USD Mn, AGR (%), CAGR(%))
Table 29. Global Clinical Trial Supply & Logistics Market by CT Solutions, 2021-2031 (USD Mn, AGR (%), CAGR(%)) (V – Shaped Recovery)
Table 30. Global Clinical Trial Supply & Logistics Market by CT Solutions, 2021-2031 (USD Mn, AGR (%), CAGR(%)) (W – Shaped Recovery)
Table 31. Global Clinical Trial Supply & Logistics Market by CT Solutions, 2021-2031 (USD Mn, AGR (%), CAGR(%)) (U – Shaped Recovery)
Table 32. Global Clinical Trial Supply & Logistics Market by CT Solutions, 2021-2031 (USD Mn, AGR (%), CAGR(%)) (L – Shaped Recovery)
Table 33. Global Clinical Trial Supply & Logistics Market by Packaging & Storage, 2021-2031 (USD Mn, AGR (%), CAGR(%))
Table 34. Global Clinical Trial Supply & Logistics Market by Packaging & Storage, 2021-2031 (USD Mn, AGR (%), CAGR(%)) (V – Shaped Recovery)
Table 35. Global Clinical Trial Supply & Logistics Market by Packaging & Storage, 2021-2031 (USD Mn, AGR (%), CAGR(%)) (W – Shaped Recovery)
Table 36. Global Clinical Trial Supply & Logistics Market by Packaging & Storage, 2021-2031 (USD Mn, AGR (%), CAGR(%)) (U – Shaped Recovery)
Table 37. Global Clinical Trial Supply & Logistics Market by Packaging & Storage, 2021-2031 (USD Mn, AGR (%), CAGR(%)) (L – Shaped Recovery)
Table 38. Global Clinical Trial Supply & Logistics Market by Phase, 2021-2031 (USD Mn, AGR (%), CAGR(%))
Table 39. Global Clinical Trial Supply & Logistics Market by Phase, 2021-2031 (USD Mn, AGR (%), CAGR(%)) (V – Shaped Recovery)
Table 40. Global Clinical Trial Supply & Logistics Market by Phase, 2021-2031 (USD Mn, AGR (%), CAGR(%)) (W – Shaped Recovery)
Table 41. Global Clinical Trial Supply & Logistics Market by Phase, 2021-2031 (USD Mn, AGR (%), CAGR(%)) (U – Shaped Recovery)
Table 42. Global Clinical Trial Supply & Logistics Market by Phase, 2021-2031 (USD Mn, AGR (%), CAGR(%)) (L – Shaped Recovery)
Table 43. CRO Tools to Partner with Sponsors in Hybrid/Virtual Trials
Table 44. Global Clinical Trial Supply & Logistics Market by DTP Model, 2021-2031 (USD Mn, AGR (%), CAGR(%))
Table 45. Global Clinical Trial Supply & Logistics Market by DTP Model, 2021-2031 (USD Mn, AGR (%), CAGR(%)) (V-Shaped Recovery)
Table 46. Global Clinical Trial Supply & Logistics Market by DTP Model, 2021-2031 (USD Mn, AGR (%), CAGR(%)) (W-Shaped Recovery)
Table 47. Global Clinical Trial Supply & Logistics Market by DTP Model, 2021-2031 (USD Mn, AGR (%), CAGR(%)) (U-Shaped Recovery)
Table 48. Global Clinical Trial Supply & Logistics Market by DTP Model, 2021-2031 (USD Mn, AGR (%), CAGR(%)) (L-Shaped Recovery)
Table 49. North America Clinical Trial Supply & Logistics Market by Value, 2021-2031 (USD Mn, AGR (%), CAGR(%))
Table 50. North America Clinical Trial Supply & Logistics Market by Value, 2021-2031 (USD Mn, AGR (%), CAGR(%)) (V – Shaped Recovery)
Table 51. North America Clinical Trial Supply & Logistics Market by Value, 2021-2031 (USD Mn, AGR (%), CAGR(%)) (W – Shaped Recovery)
Table 52. North America Clinical Trial Supply & Logistics Market by Value, 2021-2031 (USD Mn, AGR (%), CAGR(%)) (U – Shaped Recovery)
Table 53. North America Clinical Trial Supply & Logistics Market by Value, 2021-2031 (USD Mn, AGR (%), CAGR(%)) (L – Shaped Recovery)
Table 54. North America Clinical Trial Supply & Logistics Market by Country, 2021-2031 (USD Mn, AGR (%), CAGR(%))
Table 55. North America Clinical Trial Supply & Logistics Market by Country, 2021-2031 (USD Mn, AGR (%), CAGR(%)) (V – Shaped Recovery)
Table 56. North America Clinical Trial Supply & Logistics Market by Country, 2021-2031 (USD Mn, AGR (%), CAGR(%)) (W – Shaped Recovery)
Table 57. North America Clinical Trial Supply & Logistics Market by Country, 2021-2031 (USD Mn, AGR (%), CAGR(%)) (U – Shaped Recovery)
Table 58. North America Clinical Trial Supply & Logistics Market by Country, 2021-2031 (USD Mn, AGR (%), CAGR(%)) (L – Shaped Recovery)
Table 59. North America Clinical Trial Supply & Logistics Market by Type, 2021-2031 (USD Mn, AGR (%), CAGR(%))
Table 60. North America Clinical Trial Supply & Logistics Market by Type, 2021-2031 (USD Mn, AGR (%), CAGR(%)) (V – Shaped Recovery)
Table 61. North America Clinical Trial Supply & Logistics Market by Type, 2021-2031 (USD Mn, AGR (%), CAGR(%)) (W – Shaped Recovery)
Table 62. North America Clinical Trial Supply & Logistics Market by Type, 2021-2031 (USD Mn, AGR (%), CAGR(%)) (U – Shaped Recovery)
Table 63. North America Clinical Trial Supply & Logistics Market by Type, 2021-2031 (USD Mn, AGR (%), CAGR(%)) (L – Shaped Recovery)
Table 64. North America Clinical Trial Supply Market by Manufacturing, 2021-2031 (USD Mn, AGR (%), CAGR(%))
Table 65. North America Clinical Trial Supply Market by Manufacturing, 2021-2031 (USD Mn, AGR (%), CAGR(%)) (V – Shaped Recovery)
Table 66. North America Clinical Trial Supply Market by Manufacturing, 2021-2031 (USD Mn, AGR (%), CAGR(%)) (W – Shaped Recovery)
Table 67. North America Clinical Trial Supply Market by Manufacturing, 2021-2031 (USD Mn, AGR (%), CAGR(%)) (U – Shaped Recovery)
Table 68. North America Clinical Trial Supply Market by Manufacturing, 2021-2031 (USD Mn, AGR (%), CAGR(%)) (L – Shaped Recovery)
Table 69. North America Clinical Trial Supply Market by Logistics & Distribution, 2021-2031 (USD Mn, AGR (%), CAGR(%))
Table 70. North America Clinical Trial Supply Market by Logistics & Distribution, 2021-2031 (USD Mn, AGR (%), CAGR(%)) (V – Shaped Recovery)
Table 71. North America Clinical Trial Supply Market by Logistics & Distribution, 2021-2031 (USD Mn, AGR (%), CAGR(%)) (W – Shaped Recovery)
Table 72. North America Clinical Trial Supply Market by Logistics & Distribution, 2021-2031 (USD Mn, AGR (%), CAGR(%)) (U – Shaped Recovery)
Table 73. North America Clinical Trial Supply Market by Logistics & Distribution, 2021-2031 (USD Mn, AGR (%), CAGR(%)) (L – Shaped Recovery)
Table 74. North America Clinical Trial Supply & Logistics Market by CT Solutions, 2021-2031 (USD Mn, AGR (%), CAGR(%))
Table 75. North America Clinical Trial Supply & Logistics Market by CT Solutions, 2021-2031 (USD Mn, AGR (%), CAGR(%)) (V – Shaped Recovery)
Table 76. North America Clinical Trial Supply & Logistics Market by CT Solutions, 2021-2031 (USD Mn, AGR (%), CAGR(%)) (W – Shaped Recovery)
Table 77. North America Clinical Trial Supply & Logistics Market by CT Solutions, 2021-2031 (USD Mn, AGR (%), CAGR(%)) (U – Shaped Recovery)
Table 78. North America Clinical Trial Supply & Logistics Market by CT Solutions, 2021-2031 (USD Mn, AGR (%), CAGR(%)) (L – Shaped Recovery)
Table 79. North America Clinical Trial Supply & Logistics Market by Packaging & Storage, 2021-2031 (USD Mn, AGR (%), CAGR(%))
Table 80. North America Clinical Trial Supply & Logistics Market by Packaging & Storage, 2021-2031 (USD Mn, AGR (%), CAGR(%)) (V – Shaped Recovery)
Table 81. North America Clinical Trial Supply & Logistics Market by Packaging & Storage, 2021-2031 (USD Mn, AGR (%), CAGR(%)) (W – Shaped Recovery)
Table 82. North America Clinical Trial Supply & Logistics Market by Packaging & Storage, 2021-2031 (USD Mn, AGR (%), CAGR(%)) (U – Shaped Recovery)
Table 83. North America Clinical Trial Supply & Logistics Market by Packaging & Storage, 2021-2031 (USD Mn, AGR (%), CAGR(%)) (L – Shaped Recovery)
Table 84. North America Clinical Trial Supply & Logistics Market by Phase, 2021-2031 (USD Mn, AGR (%), CAGR(%))
Table 85. North America Clinical Trial Supply & Logistics Market by Phase, 2021-2031 (USD Mn, AGR (%), CAGR(%)) (V – Shaped Recovery)
Table 86. North America Clinical Trial Supply & Logistics Market by Phase, 2021-2031 (USD Mn, AGR (%), CAGR(%)) (W – Shaped Recovery)
Table 87. North America Clinical Trial Supply & Logistics Market by Phase, 2021-2031 (USD Mn, AGR (%), CAGR(%)) (U – Shaped Recovery)
Table 88. North America Clinical Trial Supply & Logistics Market by Phase, 2021-2031 (USD Mn, AGR (%), CAGR(%)) (L – Shaped Recovery)
Table 89. North America Clinical Trial Supply & Logistics Market by DTP Model, 2021-2031 (USD Mn, AGR (%), CAGR(%))
Table 90. North America Clinical Trial Supply & Logistics Market by DTP Model, 2021-2031 (USD Mn, AGR (%), CAGR(%)) (V-Shaped Recovery)
Table 91. North America Clinical Trial Supply & Logistics Market by DTP Model, 2021-2031 (USD Mn, AGR (%), CAGR(%)) (W-Shaped Recovery)
Table 92. North America Clinical Trial Supply & Logistics Market by DTP Model, 2021-2031 (USD Mn, AGR (%), CAGR(%)) (U-Shaped Recovery)
Table 93. North America Clinical Trial Supply & Logistics Market by DTP Model, 2021-2031 (USD Mn, AGR (%), CAGR(%)) (L-Shaped Recovery)
Table 94. US Clinical Trial Supply & Logistics Market by Value, 2021-2031 (USD Mn, AGR (%), CAGR(%))
Table 95. US Clinical Trial Supply & Logistics Market by Value, 2021-2031 (USD Mn, AGR (%), CAGR(%)) (V – Shaped Recovery)
Table 96. US Clinical Trial Supply & Logistics Market by Value, 2021-2031 (USD Mn, AGR (%), CAGR(%)) (W – Shaped Recovery)
Table 97. US Clinical Trial Supply & Logistics Market by Value, 2021-2031 (USD Mn, AGR (%), CAGR(%)) (U – Shaped Recovery)
Table 98. US Clinical Trial Supply & Logistics Market by Value, 2021-2031 (USD Mn, AGR (%), CAGR(%)) (L – Shaped Recovery)
Table 99. Canada Clinical Trial Supply & Logistics Market by Value, 2021-2031 (USD Mn, AGR (%), CAGR(%))
Table 100. Canada Clinical Trial Supply & Logistics Market by Value, 2021-2031 (USD Mn, AGR (%), CAGR(%)) (V – Shaped Recovery)
Table 101. Canada Clinical Trial Supply & Logistics Market by Value, 2021-2031 (USD Mn, AGR (%), CAGR(%)) (W – Shaped Recovery)
Table 102. Canada Clinical Trial Supply & Logistics Market by Value, 2021-2031 (USD Mn, AGR (%), CAGR(%)) (U – Shaped Recovery)
Table 103. Canada Clinical Trial Supply & Logistics Market by Value, 2021-2031 (USD Mn, AGR (%), CAGR(%)) (L – Shaped Recovery)
Table 104. Mexico Clinical Trial Supply & Logistics Market by Value, 2021-2031 (USD Mn, AGR (%), CAGR(%))
Table 105. Mexico Clinical Trial Supply & Logistics Market by Value, 2021-2031 (USD Mn, AGR (%), CAGR(%)) (V – Shaped Recovery)
Table 106. Mexico Clinical Trial Supply & Logistics Market by Value, 2021-2031 (USD Mn, AGR (%), CAGR(%)) (W – Shaped Recovery)
Table 107. Mexico Clinical Trial Supply & Logistics Market by Value, 2021-2031 (USD Mn, AGR (%), CAGR(%)) (U – Shaped Recovery)
Table 108. Mexico Clinical Trial Supply & Logistics Market by Value, 2021-2031 (USD Mn, AGR (%), CAGR(%)) (L – Shaped Recovery)
Table 109. Europe Clinical Trial Supply & Logistics Market by Value, 2021-2031 (USD Mn, AGR (%), CAGR(%))
Table 110. Europe Clinical Trial Supply & Logistics Market by Value, 2021-2031 (USD Mn, AGR (%), CAGR(%)) (V – Shaped Recovery)
Table 111. Europe Clinical Trial Supply & Logistics Market by Value, 2021-2031 (USD Mn, AGR (%), CAGR(%)) (W – Shaped Recovery)
Table 112. Europe Clinical Trial Supply & Logistics Market by Value, 2021-2031 (USD Mn, AGR (%), CAGR(%)) (U – Shaped Recovery)
Table 113. Europe Clinical Trial Supply & Logistics Market by Value, 2021-2031 (USD Mn, AGR (%), CAGR(%)) (L – Shaped Recovery)
Table 114. Europe Clinical Trial Supply & Logistics Market by Country, 2021-2031 (USD Mn, AGR (%), CAGR(%))
Table 115. Europe Clinical Trial Supply & Logistics Market by Country, 2021-2031 (USD Mn, AGR (%), CAGR(%)) (V – Shaped Recovery)
Table 116. Europe Clinical Trial Supply & Logistics Market by Country, 2021-2031 (USD Mn, AGR (%), CAGR(%)) (W – Shaped Recovery)
Table 117. Europe Clinical Trial Supply & Logistics Market by Country, 2021-2031 (USD Mn, AGR (%), CAGR(%)) (U – Shaped Recovery)
Table 118. Europe Clinical Trial Supply & Logistics Market by Country, 2021-2031 (USD Mn, AGR (%), CAGR(%)) (L – Shaped Recovery)
Table 119. Europe Clinical Trial Supply & Logistics Market by Type, 2021-2031 (USD Mn, AGR (%), CAGR(%))
Table 120. Europe Clinical Trial Supply & Logistics Market by Type, 2021-2031 (USD Mn, AGR (%), CAGR(%)) (V – Shaped Recovery)
Table 121. Europe Clinical Trial Supply & Logistics Market by Type, 2021-2031 (USD Mn, AGR (%), CAGR(%)) (W – Shaped Recovery)
Table 122. Europe Clinical Trial Supply & Logistics Market by Type, 2021-2031 (USD Mn, AGR (%), CAGR(%)) (U – Shaped Recovery)
Table 123. Europe Clinical Trial Supply & Logistics Market by Type, 2021-2031 (USD Mn, AGR (%), CAGR(%)) (L – Shaped Recovery)
Table 124. Europe Clinical Trial Supply Market by Manufacturing, 2021-2031 (USD Mn, AGR (%), CAGR(%))
Table 125. Europe Clinical Trial Supply Market by Manufacturing, 2021-2031 (USD Mn, AGR (%), CAGR(%)) (V – Shaped Recovery)
Table 126. Europe Clinical Trial Supply Market by Manufacturing, 2021-2031 (USD Mn, AGR (%), CAGR(%)) (W – Shaped Recovery)
Table 127. Europe Clinical Trial Supply Market by Manufacturing, 2021-2031 (USD Mn, AGR (%), CAGR(%)) (U – Shaped Recovery)
Table 128. Europe Clinical Trial Supply Market by Manufacturing, 2021-2031 (USD Mn, AGR (%), CAGR(%)) (L – Shaped Recovery)
Table 129. Europe Clinical Trial Supply Market by Logistics & Distribution, 2021-2031 (USD Mn, AGR (%), CAGR(%))
Table 130. Europe Clinical Trial Supply Market by Logistics & Distribution, 2021-2031 (USD Mn, AGR (%), CAGR(%)) (V – Shaped Recovery)
Table 131. Europe Clinical Trial Supply Market by Logistics & Distribution, 2021-2031 (USD Mn, AGR (%), CAGR(%)) (W – Shaped Recovery)
Table 132. Europe Clinical Trial Supply Market by Logistics & Distribution, 2021-2031 (USD Mn, AGR (%), CAGR(%)) (U – Shaped Recovery)
Table 133. Europe Clinical Trial Supply Market by Logistics & Distribution, 2021-2031 (USD Mn, AGR (%), CAGR(%)) (L – Shaped Recovery)
Table 134. Europe Clinical Trial Supply & Logistics Market by CT Solutions, 2021-2031 (USD Mn, AGR (%), CAGR(%))
Table 135. Europe Clinical Trial Supply & Logistics Market by CT Solutions, 2021-2031 (USD Mn, AGR (%), CAGR(%)) (V – Shaped Recovery)
Table 136. Europe Clinical Trial Supply & Logistics Market by CT Solutions, 2021-2031 (USD Mn, AGR (%), CAGR(%)) (W – Shaped Recovery)
Table 137. Europe Clinical Trial Supply & Logistics Market by CT Solutions, 2021-2031 (USD Mn, AGR (%), CAGR(%)) (U – Shaped Recovery)
Table 138. Europe Clinical Trial Supply & Logistics Market by CT Solutions, 2021-2031 (USD Mn, AGR (%), CAGR(%)) (L – Shaped Recovery)
Table 139. Europe Clinical Trial Supply & Logistics Market by Packaging & Storage, 2021-2031 (USD Mn, AGR (%), CAGR(%))
Table 140. Europe Clinical Trial Supply & Logistics Market by Packaging & Storage, 2021-2031 (USD Mn, AGR (%), CAGR(%)) (V – Shaped Recovery)
Table 141. Europe Clinical Trial Supply & Logistics Market by Packaging & Storage, 2021-2031 (USD Mn, AGR (%), CAGR(%)) (W – Shaped Recovery)
Table 142. Europe Clinical Trial Supply & Logistics Market by Packaging & Storage, 2021-2031 (USD Mn, AGR (%), CAGR(%)) (U – Shaped Recovery)
Table 143. Europe Clinical Trial Supply & Logistics Market by Packaging & Storage, 2021-2031 (USD Mn, AGR (%), CAGR(%)) (L – Shaped Recovery)
Table 144. Europe Clinical Trial Supply & Logistics Market by Phase, 2021-2031 (USD Mn, AGR (%), CAGR(%))
Table 145. Europe Clinical Trial Supply & Logistics Market by Phase, 2021-2031 (USD Mn, AGR (%), CAGR(%)) (V – Shaped Recovery)
Table 146. Europe Clinical Trial Supply & Logistics Market by Phase, 2021-2031 (USD Mn, AGR (%), CAGR(%)) (W – Shaped Recovery)
Table 147. Europe Clinical Trial Supply & Logistics Market by Phase, 2021-2031 (USD Mn, AGR (%), CAGR(%)) (U – Shaped Recovery)
Table 148. Europe Clinical Trial Supply & Logistics Market by Phase, 2021-2031 (USD Mn, AGR (%), CAGR(%)) (L – Shaped Recovery)
Table 149. Europe Clinical Trial Supply & Logistics Market by DTP Model, 2021-2031 (USD Mn, AGR (%), CAGR(%))
Table 150. Europe Clinical Trial Supply & Logistics Market by DTP Model, 2021-2031 (USD Mn, AGR (%), CAGR(%)) (V-Shaped Recovery)
Table 151. Europe Clinical Trial Supply & Logistics Market by DTP Model, 2021-2031 (USD Mn, AGR (%), CAGR(%)) (W-Shaped Recovery)
Table 152. Europe Clinical Trial Supply & Logistics Market by DTP Model, 2021-2031 (USD Mn, AGR (%), CAGR(%)) (U-Shaped Recovery)
Table 153. Europe Clinical Trial Supply & Logistics Market by DTP Model, 2021-2031 (USD Mn, AGR (%), CAGR(%)) (L-Shaped Recovery)
Table 154. Germany Clinical Trial Supply & Logistics Market by Value, 2021-2031 (USD Mn, AGR (%), CAGR(%))
Table 155. Germany Clinical Trial Supply & Logistics Market by Value, 2021-2031 (USD Mn, AGR (%), CAGR(%)) (V – Shaped Recovery)
Table 156. Germany Clinical Trial Supply & Logistics Market by Value, 2021-2031 (USD Mn, AGR (%), CAGR(%)) (W – Shaped Recovery)
Table 157. Germany Clinical Trial Supply & Logistics Market by Value, 2021-2031 (USD Mn, AGR (%), CAGR(%)) (U – Shaped Recovery)
Table 158. Germany Clinical Trial Supply & Logistics Market by Value, 2021-2031 (USD Mn, AGR (%), CAGR(%)) (L – Shaped Recovery)
Table 159. UK Clinical Trial Supply & Logistics Market by Value, 2021-2031 (USD Mn, AGR (%), CAGR(%))
Table 160. UK Clinical Trial Supply & Logistics Market by Value, 2021-2031 (USD Mn, AGR (%), CAGR(%)) (V – Shaped Recovery)
Table 161. UK Clinical Trial Supply & Logistics Market by Value, 2021-2031 (USD Mn, AGR (%), CAGR(%)) (W – Shaped Recovery)
Table 162. UK Clinical Trial Supply & Logistics Market by Value, 2021-2031 (USD Mn, AGR (%), CAGR(%)) (U – Shaped Recovery)
Table 163. UK Clinical Trial Supply & Logistics Market by Value, 2021-2031 (USD Mn, AGR (%), CAGR(%)) (L – Shaped Recovery)
Table 164. France Clinical Trial Supply & Logistics Market by Value, 2021-2031 (USD Mn, AGR (%), CAGR(%))
Table 165. France Clinical Trial Supply & Logistics Market by Value, 2021-2031 (USD Mn, AGR (%), CAGR(%)) (V – Shaped Recovery)
Table 166. France Clinical Trial Supply & Logistics Market by Value, 2021-2031 (USD Mn, AGR (%), CAGR(%)) (W – Shaped Recovery)
Table 167. France Clinical Trial Supply & Logistics Market by Value, 2021-2031 (USD Mn, AGR (%), CAGR(%)) (U – Shaped Recovery)
Table 168. France Clinical Trial Supply & Logistics Market by Value, 2021-2031 (USD Mn, AGR (%), CAGR(%)) (L – Shaped Recovery)
Table 169. Italy Clinical Trial Supply & Logistics Market by Value, 2021-2031 (USD Mn, AGR (%), CAGR(%))
Table 170. Italy Clinical Trial Supply & Logistics Market by Value, 2021-2031 (USD Mn, AGR (%), CAGR(%)) (V – Shaped Recovery)
Table 171. Italy Clinical Trial Supply & Logistics Market by Value, 2021-2031 (USD Mn, AGR (%), CAGR(%)) (W – Shaped Recovery)
Table 172. Italy Clinical Trial Supply & Logistics Market by Value, 2021-2031 (USD Mn, AGR (%), CAGR(%)) (U – Shaped Recovery)
Table 173. Italy Clinical Trial Supply & Logistics Market by Value, 2021-2031 (USD Mn, AGR (%), CAGR(%)) (L – Shaped Recovery)
Table 174. Spain Clinical Trial Supply & Logistics Market by Value, 2021-2031 (USD Mn, AGR (%), CAGR(%))
Table 175. Spain Clinical Trial Supply & Logistics Market by Value, 2021-2031 (USD Mn, AGR (%), CAGR(%)) (V – Shaped Recovery)
Table 176. Spain Clinical Trial Supply & Logistics Market by Value, 2021-2031 (USD Mn, AGR (%), CAGR(%)) (W – Shaped Recovery)
Table 177. Spain Clinical Trial Supply & Logistics Market by Value, 2021-2031 (USD Mn, AGR (%), CAGR(%)) (U – Shaped Recovery)
Table 178. Spain Clinical Trial Supply & Logistics Market by Value, 2021-2031 (USD Mn, AGR (%), CAGR(%)) (L – Shaped Recovery)
Table 179. Rest of Europe Clinical Trial Supply & Logistics Market by Value, 2021-2031 (USD Mn, AGR (%), CAGR(%))
Table 180. Rest of Europe Clinical Trial Supply & Logistics Market by Value, 2021-2031 (USD Mn, AGR (%), CAGR(%)) (V – Shaped Recovery)
Table 181. Rest of Europe Clinical Trial Supply & Logistics Market by Value, 2021-2031 (USD Mn, AGR (%), CAGR(%)) (W – Shaped Recovery)
Table 182. Rest of Europe Clinical Trial Supply & Logistics Market by Value, 2021-2031 (USD Mn, AGR (%), CAGR(%)) (U – Shaped Recovery)
Table 183. Rest of Europe Clinical Trial Supply & Logistics Market by Value, 2021-2031 (USD Mn, AGR (%), CAGR(%)) (L – Shaped Recovery)
Table 184. Asia-Pacific Clinical Trial Supply & Logistics Market by Value, 2021-2031 (USD Mn, AGR (%), CAGR(%))
Table 185. Asia-Pacific Clinical Trial Supply & Logistics Market by Value, 2021-2031 (USD Mn, AGR (%), CAGR(%)) (V – Shaped Recovery)
Table 186. Asia-Pacific Clinical Trial Supply & Logistics Market by Value, 2021-2031 (USD Mn, AGR (%), CAGR(%)) (W – Shaped Recovery)
Table 187. Asia-Pacific Clinical Trial Supply & Logistics Market by Value, 2021-2031 (USD Mn, AGR (%), CAGR(%)) (U – Shaped Recovery)
Table 188. Asia-Pacific Clinical Trial Supply & Logistics Market by Value, 2021-2031 (USD Mn, AGR (%), CAGR(%)) (L – Shaped Recovery)
Table 189. Asia-Pacific Clinical Trial Supply & Logistics Market by Country, 2021-2031 (USD Mn, AGR (%), CAGR(%))
Table 190. Asia-Pacific Clinical Trial Supply & Logistics Market by Country, 2021-2031 (USD Mn, AGR (%), CAGR(%)) (V – Shaped Recovery)
Table 191. Asia-Pacific Clinical Trial Supply & Logistics Market by Country, 2021-2031 (USD Mn, AGR (%), CAGR(%)) (W – Shaped Recovery)
Table 192. Asia-Pacific Clinical Trial Supply & Logistics Market by Country, 2021-2031 (USD Mn, AGR (%), CAGR(%)) (U – Shaped Recovery)
Table 193. Asia-Pacific Clinical Trial Supply & Logistics Market by Country, 2021-2031 (USD Mn, AGR (%), CAGR(%)) (L – Shaped Recovery)
Table 194. Asia-Pacific Clinical Trial Supply & Logistics Market by Type, 2021-2031 (USD Mn, AGR (%), CAGR(%))
Table 195. Asia-Pacific Clinical Trial Supply & Logistics Market by Type, 2021-2031 (USD Mn, AGR (%), CAGR(%)) (V – Shaped Recovery)
Table 196. Asia-Pacific Clinical Trial Supply & Logistics Market by Type, 2021-2031 (USD Mn, AGR (%), CAGR(%)) (W – Shaped Recovery)
Table 197. Asia-Pacific Clinical Trial Supply & Logistics Market by Type, 2021-2031 (USD Mn, AGR (%), CAGR(%)) (U – Shaped Recovery)
Table 198. Asia-Pacific Clinical Trial Supply & Logistics Market by Type, 2021-2031 (USD Mn, AGR (%), CAGR(%)) (L – Shaped Recovery)
Table 199. Asia-Pacific Clinical Trial Supply Market by Manufacturing, 2021-2031 (USD Mn, AGR (%), CAGR(%))
Table 200. Asia-Pacific Clinical Trial Supply Market by Manufacturing, 2021-2031 (USD Mn, AGR (%), CAGR(%)) (V – Shaped Recovery)
Table 201. Asia-Pacific Clinical Trial Supply Market by Manufacturing, 2021-2031 (USD Mn, AGR (%), CAGR(%)) (W – Shaped Recovery)
Table 202. Asia-Pacific Clinical Trial Supply Market by Manufacturing, 2021-2031 (USD Mn, AGR (%), CAGR(%)) (U – Shaped Recovery)
Table 203. Asia-Pacific Clinical Trial Supply Market by Manufacturing, 2021-2031 (USD Mn, AGR (%), CAGR(%)) (L – Shaped Recovery)
Table 204. Asia-Pacific Clinical Trial Supply Market by Logistics & Distribution, 2021-2031 (USD Mn, AGR (%), CAGR(%))
Table 205. Asia-Pacific Clinical Trial Supply Market by Logistics & Distribution, 2021-2031 (USD Mn, AGR (%), CAGR(%)) (V – Shaped Recovery)
Table 206. Asia-Pacific Clinical Trial Supply Market by Logistics & Distribution, 2021-2031 (USD Mn, AGR (%), CAGR(%)) (W – Shaped Recovery)
Table 207. Asia-Pacific Clinical Trial Supply Market by Logistics & Distribution, 2021-2031 (USD Mn, AGR (%), CAGR(%)) (U – Shaped Recovery)
Table 208. Asia-Pacific Clinical Trial Supply Market by Logistics & Distribution, 2021-2031 (USD Mn, AGR (%), CAGR(%)) (L – Shaped Recovery)
Table 209. Asia-Pacific Clinical Trial Supply & Logistics Market by CT Solutions, 2021-2031 (USD Mn, AGR (%), CAGR(%))
Table 210. Asia-Pacific Clinical Trial Supply & Logistics Market by CT Solutions, 2021-2031 (USD Mn, AGR (%), CAGR(%)) (V – Shaped Recovery)
Table 211. Asia-Pacific Clinical Trial Supply & Logistics Market by CT Solutions, 2021-2031 (USD Mn, AGR (%), CAGR(%)) (W – Shaped Recovery)
Table 212. Asia-Pacific Clinical Trial Supply & Logistics Market by CT Solutions, 2021-2031 (USD Mn, AGR (%), CAGR(%)) (U – Shaped Recovery)
Table 213. Asia-Pacific Clinical Trial Supply & Logistics Market by CT Solutions, 2021-2031 (USD Mn, AGR (%), CAGR(%)) (L – Shaped Recovery)
Table 214. Asia-Pacific Clinical Trial Supply & Logistics Market by Packaging & Storage, 2021-2031 (USD Mn, AGR (%), CAGR(%))
Table 215. Asia-Pacific Clinical Trial Supply & Logistics Market by Packaging & Storage, 2021-2031 (USD Mn, AGR (%), CAGR(%)) (V – Shaped Recovery)
Table 216. Asia-Pacific Clinical Trial Supply & Logistics Market by Packaging & Storage, 2021-2031 (USD Mn, AGR (%), CAGR(%)) (W – Shaped Recovery)
Table 217. Asia-Pacific Clinical Trial Supply & Logistics Market by Packaging & Storage, 2021-2031 (USD Mn, AGR (%), CAGR(%)) (U – Shaped Recovery)
Table 218. Asia-Pacific Clinical Trial Supply & Logistics Market by Packaging & Storage, 2021-2031 (USD Mn, AGR (%), CAGR(%)) (L – Shaped Recovery)
Table 219. Asia-Pacific Clinical Trial Supply & Logistics Market by Phase, 2021-2031 (USD Mn, AGR (%), CAGR(%))
Table 220. Asia-Pacific Clinical Trial Supply & Logistics Market by Phase, 2021-2031 (USD Mn, AGR (%), CAGR(%)) (V – Shaped Recovery)
Table 221. Asia-Pacific Clinical Trial Supply & Logistics Market by Phase, 2021-2031 (USD Mn, AGR (%), CAGR(%)) (W – Shaped Recovery)
Table 222. Asia-Pacific Clinical Trial Supply & Logistics Market by Phase, 2021-2031 (USD Mn, AGR (%), CAGR(%)) (U – Shaped Recovery)
Table 223. Asia-Pacific Clinical Trial Supply & Logistics Market by Phase, 2021-2031 (USD Mn, AGR (%), CAGR(%)) (L – Shaped Recovery)
Table 224. Asia-Pacific Clinical Trial Supply & Logistics Market by DTP Model, 2021-2031 (USD Mn, AGR (%), CAGR(%))
Table 225. Asia-Pacific Clinical Trial Supply & Logistics Market by DTP Model, 2021-2031 (USD Mn, AGR (%), CAGR(%)) (V-Shaped Recovery)
Table 226. Asia-Pacific Clinical Trial Supply & Logistics Market by DTP Model, 2021-2031 (USD Mn, AGR (%), CAGR(%)) (W-Shaped Recovery)
Table 227. Asia-Pacific Clinical Trial Supply & Logistics Market by DTP Model, 2021-2031 (USD Mn, AGR (%), CAGR(%)) (U-Shaped Recovery)
Table 228. Asia-Pacific Clinical Trial Supply & Logistics Market by DTP Model, 2021-2031 (USD Mn, AGR (%), CAGR(%)) (L-Shaped Recovery)
Table 229. China Clinical Trial Supply & Logistics Market by Value, 2021-2031 (USD Mn, AGR (%), CAGR(%))
Table 230. China Clinical Trial Supply & Logistics Market by Value, 2021-2031 (USD Mn, AGR (%), CAGR(%)) (V – Shaped Recovery)
Table 231. China Clinical Trial Supply & Logistics Market by Value, 2021-2031 (USD Mn, AGR (%), CAGR(%)) (W – Shaped Recovery)
Table 232. China Clinical Trial Supply & Logistics Market by Value, 2021-2031 (USD Mn, AGR (%), CAGR(%)) (U – Shaped Recovery)
Table 233. China Clinical Trial Supply & Logistics Market by Value, 2021-2031 (USD Mn, AGR (%), CAGR(%)) (L – Shaped Recovery)
Table 234. India Clinical Trial Supply & Logistics Market by Value, 2021-2031 (USD Mn, AGR (%), CAGR(%))
Table 235. India Clinical Trial Supply & Logistics Market by Value, 2021-2031 (USD Mn, AGR (%), CAGR(%)) (V – Shaped Recovery)
Table 236. India Clinical Trial Supply & Logistics Market by Value, 2021-2031 (USD Mn, AGR (%), CAGR(%)) (W – Shaped Recovery)
Table 237. India Clinical Trial Supply & Logistics Market by Value, 2021-2031 (USD Mn, AGR (%), CAGR(%)) (U – Shaped Recovery)
Table 238. India Clinical Trial Supply & Logistics Market by Value, 2021-2031 (USD Mn, AGR (%), CAGR(%)) (L – Shaped Recovery)
Table 239. Japan Clinical Trial Supply & Logistics Market by Value, 2021-2031 (USD Mn, AGR (%), CAGR(%))
Table 240. Japan Clinical Trial Supply & Logistics Market by Value, 2021-2031 (USD Mn, AGR (%), CAGR(%)) (V – Shaped Recovery)
Table 241. Japan Clinical Trial Supply & Logistics Market by Value, 2021-2031 (USD Mn, AGR (%), CAGR(%)) (W – Shaped Recovery)
Table 242. Japan Clinical Trial Supply & Logistics Market by Value, 2021-2031 (USD Mn, AGR (%), CAGR(%)) (U – Shaped Recovery)
Table 243. Japan Clinical Trial Supply & Logistics Market by Value, 2021-2031 (USD Mn, AGR (%), CAGR(%)) (L – Shaped Recovery)
Table 244. South Korea Clinical Trial Supply & Logistics Market by Value, 2021-2031 (USD Mn, AGR (%), CAGR(%))
Table 245. South Korea Clinical Trial Supply & Logistics Market by Value, 2021-2031 (USD Mn, AGR (%), CAGR(%)) (V – Shaped Recovery)
Table 246. South Korea Clinical Trial Supply & Logistics Market by Value, 2021-2031 (USD Mn, AGR (%), CAGR(%)) (W – Shaped Recovery)
Table 247. South Korea Clinical Trial Supply & Logistics Market by Value, 2021-2031 (USD Mn, AGR (%), CAGR(%)) (U – Shaped Recovery)
Table 248. South Korea Clinical Trial Supply & Logistics Market by Value, 2021-2031 (USD Mn, AGR (%), CAGR(%)) (L – Shaped Recovery)
Table 249. Australia Clinical Trial Supply & Logistics Market by Value, 2021-2031 (USD Mn, AGR (%), CAGR(%))
Table 250. Australia Clinical Trial Supply & Logistics Market by Value, 2021-2031 (USD Mn, AGR (%), CAGR(%)) (V – Shaped Recovery)
Table 251. Australia Clinical Trial Supply & Logistics Market by Value, 2021-2031 (USD Mn, AGR (%), CAGR(%)) (W – Shaped Recovery)
Table 252. Australia Clinical Trial Supply & Logistics Market by Value, 2021-2031 (USD Mn, AGR (%), CAGR(%)) (U – Shaped Recovery)
Table 253. Australia Clinical Trial Supply & Logistics Market by Value, 2021-2031 (USD Mn, AGR (%), CAGR(%)) (L – Shaped Recovery)
Table 254. Rest of Asia-Pacific Clinical Trial Supply & Logistics Market by Value, 2021-2031 (USD Mn, AGR (%), CAGR(%))
Table 255. Rest of Asia-Pacific Clinical Trial Supply & Logistics Market by Value, 2021-2031 (USD Mn, AGR (%), CAGR(%)) (V – Shaped Recovery)
Table 256. Rest of Asia-Pacific Clinical Trial Supply & Logistics Market by Value, 2021-2031 (USD Mn, AGR (%), CAGR(%)) (W – Shaped Recovery)
Table 257. Rest of Asia-Pacific Clinical Trial Supply & Logistics Market by Value, 2021-2031 (USD Mn, AGR (%), CAGR(%)) (U – Shaped Recovery)
Table 258. Rest of Asia-Pacific Clinical Trial Supply & Logistics Market by Value, 2021-2031 (USD Mn, AGR (%), CAGR(%)) (L – Shaped Recovery)
Table 259. LAMEA Clinical Trial Supply & Logistics Market by Value, 2021-2031 (USD Mn, AGR (%), CAGR(%))
Table 260. LAMEA Clinical Trial Supply & Logistics Market by Value, 2021-2031 (USD Mn, AGR (%), CAGR(%)) (V – Shaped Recovery)
Table 261. LAMEA Clinical Trial Supply & Logistics Market by Value, 2021-2031 (USD Mn, AGR (%), CAGR(%)) (W – Shaped Recovery)
Table 262. LAMEA Clinical Trial Supply & Logistics Market by Value, 2021-2031 (USD Mn, AGR (%), CAGR(%)) (U – Shaped Recovery)
Table 263. LAMEA Clinical Trial Supply & Logistics Market by Value, 2021-2031 (USD Mn, AGR (%), CAGR(%)) (L – Shaped Recovery)
Table 264. LAMEA Clinical Trial Supply & Logistics Market by Country, 2021-2031 (USD Mn, AGR (%), CAGR(%))
Table 265. LAMEA Clinical Trial Supply & Logistics Market by Country, 2021-2031 (USD Mn, AGR (%), CAGR(%)) (V – Shaped Recovery)
Table 266. LAMEA Clinical Trial Supply & Logistics Market by Country, 2021-2031 (USD Mn, AGR (%), CAGR(%)) (W – Shaped Recovery)
Table 267. LAMEA Clinical Trial Supply & Logistics Market by Country, 2021-2031 (USD Mn, AGR (%), CAGR(%)) (U – Shaped Recovery)
Table 268. LAMEA Clinical Trial Supply & Logistics Market by Country, 2021-2031 (USD Mn, AGR (%), CAGR(%)) (L – Shaped Recovery)
Table 269. LAMEA Clinical Trial Supply & Logistics Market by Type, 2021-2031 (USD Mn, AGR (%), CAGR(%))
Table 270. LAMEA Clinical Trial Supply & Logistics Market by Type, 2021-2031 (USD Mn, AGR (%), CAGR(%)) (V – Shaped Recovery)
Table 271. LAMEA Clinical Trial Supply & Logistics Market by Type, 2021-2031 (USD Mn, AGR (%), CAGR(%)) (W – Shaped Recovery)
Table 272. LAMEA Clinical Trial Supply & Logistics Market by Type, 2021-2031 (USD Mn, AGR (%), CAGR(%)) (U – Shaped Recovery)
Table 273. LAMEA Clinical Trial Supply & Logistics Market by Type, 2021-2031 (USD Mn, AGR (%), CAGR(%)) (L – Shaped Recovery)
Table 274. LAMEA Clinical Trial Supply Market by Manufacturing, 2021-2031 (USD Mn, AGR (%), CAGR(%))
Table 275. LAMEA Clinical Trial Supply Market by Manufacturing, 2021-2031 (USD Mn, AGR (%), CAGR(%)) (V – Shaped Recovery)
Table 276. LAMEA Clinical Trial Supply Market by Manufacturing, 2021-2031 (USD Mn, AGR (%), CAGR(%)) (W – Shaped Recovery)
Table 277. LAMEA Clinical Trial Supply Market by Manufacturing, 2021-2031 (USD Mn, AGR (%), CAGR(%)) (U – Shaped Recovery)
Table 278. LAMEA Clinical Trial Supply Market by Manufacturing, 2021-2031 (USD Mn, AGR (%), CAGR(%)) (L – Shaped Recovery)
Table 279. LAMEA Clinical Trial Supply Market by Logistics & Distribution, 2021-2031 (USD Mn, AGR (%), CAGR(%))
Table 280. LAMEA Clinical Trial Supply Market by Logistics & Distribution, 2021-2031 (USD Mn, AGR (%), CAGR(%)) (V – Shaped Recovery)
Table 281. LAMEA Clinical Trial Supply Market by Logistics & Distribution, 2021-2031 (USD Mn, AGR (%), CAGR(%)) (W – Shaped Recovery)
Table 282. LAMEA Clinical Trial Supply Market by Logistics & Distribution, 2021-2031 (USD Mn, AGR (%), CAGR(%)) (U – Shaped Recovery)
Table 283. LAMEA Clinical Trial Supply Market by Logistics & Distribution, 2021-2031 (USD Mn, AGR (%), CAGR(%)) (L – Shaped Recovery)
Table 284. LAMEA Clinical Trial Supply & Logistics Market by CT Solutions, 2021-2031 (USD Mn, AGR (%), CAGR(%))
Table 285. LAMEA Clinical Trial Supply & Logistics Market by CT Solutions, 2021-2031 (USD Mn, AGR (%), CAGR(%)) (V – Shaped Recovery)
Table 286. LAMEA Clinical Trial Supply & Logistics Market by CT Solutions, 2021-2031 (USD Mn, AGR (%), CAGR(%)) (W – Shaped Recovery)
Table 287. LAMEA Clinical Trial Supply & Logistics Market by CT Solutions, 2021-2031 (USD Mn, AGR (%), CAGR(%)) (U – Shaped Recovery)
Table 288. LAMEA Clinical Trial Supply & Logistics Market by CT Solutions, 2021-2031 (USD Mn, AGR (%), CAGR(%)) (L – Shaped Recovery)
Table 289. LAMEA Clinical Trial Supply & Logistics Market by Packaging & Storage, 2021-2031 (USD Mn, AGR (%), CAGR(%))
Table 290. LAMEA Clinical Trial Supply & Logistics Market by Packaging & Storage, 2021-2031 (USD Mn, AGR (%), CAGR(%)) (V – Shaped Recovery)
Table 291. LAMEA Clinical Trial Supply & Logistics Market by Packaging & Storage, 2021-2031 (USD Mn, AGR (%), CAGR(%)) (W – Shaped Recovery)
Table 292. LAMEA Clinical Trial Supply & Logistics Market by Packaging & Storage, 2021-2031 (USD Mn, AGR (%), CAGR(%)) (U – Shaped Recovery)
Table 293. LAMEA Clinical Trial Supply & Logistics Market by Packaging & Storage, 2021-2031 (USD Mn, AGR (%), CAGR(%)) (L – Shaped Recovery)
Table 294. LAMEA Clinical Trial Supply & Logistics Market by Phase, 2021-2031 (USD Mn, AGR (%), CAGR(%))
Table 295. LAMEA Clinical Trial Supply & Logistics Market by Phase, 2021-2031 (USD Mn, AGR (%), CAGR(%)) (V – Shaped Recovery)
Table 296. LAMEA Clinical Trial Supply & Logistics Market by Phase, 2021-2031 (USD Mn, AGR (%), CAGR(%)) (W – Shaped Recovery)
Table 297. LAMEA Clinical Trial Supply & Logistics Market by Phase, 2021-2031 (USD Mn, AGR (%), CAGR(%)) (U – Shaped Recovery)
Table 298. LAMEA Clinical Trial Supply & Logistics Market by Phase, 2021-2031 (USD Mn, AGR (%), CAGR(%)) (L – Shaped Recovery)
Table 299. LAMEA Clinical Trial Supply & Logistics Market by DTP Model, 2021-2031 (USD Mn, AGR (%), CAGR(%))
Table 300. LAMEA Clinical Trial Supply & Logistics Market by DTP Model, 2021-2031 (USD Mn, AGR (%), CAGR(%)) (V-Shaped Recovery)
Table 301. LAMEA Clinical Trial Supply & Logistics Market by DTP Model, 2021-2031 (USD Mn, AGR (%), CAGR(%)) (W-Shaped Recovery)
Table 302. LAMEA Clinical Trial Supply & Logistics Market by DTP Model, 2021-2031 (USD Mn, AGR (%), CAGR(%)) (U-Shaped Recovery)
Table 303. LAMEA Clinical Trial Supply & Logistics Market by DTP Model, 2021-2031 (USD Mn, AGR (%), CAGR(%)) (L-Shaped Recovery)
Table 304. Brazil Clinical Trial Supply & Logistics Market by Value, 2021-2031 (USD Mn, AGR (%), CAGR(%))
Table 305. Brazil Clinical Trial Supply & Logistics Market by Value, 2021-2031 (USD Mn, AGR (%), CAGR(%)) (V – Shaped Recovery)
Table 306. Brazil Clinical Trial Supply & Logistics Market by Value, 2021-2031 (USD Mn, AGR (%), CAGR(%)) (W – Shaped Recovery)
Table 307. Brazil Clinical Trial Supply & Logistics Market by Value, 2021-2031 (USD Mn, AGR (%), CAGR(%)) (U – Shaped Recovery)
Table 308. Brazil Clinical Trial Supply & Logistics Market by Value, 2021-2031 (USD Mn, AGR (%), CAGR(%)) (L – Shaped Recovery)
Table 309. South Africa Clinical Trial Supply & Logistics Market by Value, 2021-2031 (USD Mn, AGR (%), CAGR(%))
Table 310. South Africa Clinical Trial Supply & Logistics Market by Value, 2021-2031 (USD Mn, AGR (%), CAGR(%)) (V – Shaped Recovery)
Table 311. South Africa Clinical Trial Supply & Logistics Market by Value, 2021-2031 (USD Mn, AGR (%), CAGR(%)) (W – Shaped Recovery)
Table 312. South Africa Clinical Trial Supply & Logistics Market by Value, 2021-2031 (USD Mn, AGR (%), CAGR(%)) (U – Shaped Recovery)
Table 313. South Africa Clinical Trial Supply & Logistics Market by Value, 2021-2031 (USD Mn, AGR (%), CAGR(%)) (L – Shaped Recovery)
Table 314. Saudi Arabia Clinical Trial Supply & Logistics Market by Value, 2021-2031 (USD Mn, AGR (%), CAGR(%))
Table 315. Saudi Arabia Clinical Trial Supply & Logistics Market by Value, 2021-2031 (USD Mn, AGR (%), CAGR(%)) (V – Shaped Recovery)
Table 316. Saudi Arabia Clinical Trial Supply & Logistics Market by Value, 2021-2031 (USD Mn, AGR (%), CAGR(%)) (W – Shaped Recovery)
Table 317. Saudi Arabia Clinical Trial Supply & Logistics Market by Value, 2021-2031 (USD Mn, AGR (%), CAGR(%)) (U – Shaped Recovery)
Table 318. Saudi Arabia Clinical Trial Supply & Logistics Market by Value, 2021-2031 (USD Mn, AGR (%), CAGR(%)) (L – Shaped Recovery)
Table 319. Turkey Clinical Trial Supply & Logistics Market by Value, 2021-2031 (USD Mn, AGR (%), CAGR(%))
Table 320. Turkey Clinical Trial Supply & Logistics Market by Value, 2021-2031 (USD Mn, AGR (%), CAGR(%)) (V – Shaped Recovery)
Table 321. Turkey Clinical Trial Supply & Logistics Market by Value, 2021-2031 (USD Mn, AGR (%), CAGR(%)) (W – Shaped Recovery)
Table 322. Turkey Clinical Trial Supply & Logistics Market by Value, 2021-2031 (USD Mn, AGR (%), CAGR(%)) (U – Shaped Recovery)
Table 323. Turkey Clinical Trial Supply & Logistics Market by Value, 2021-2031 (USD Mn, AGR (%), CAGR(%)) (L – Shaped Recovery)
Table 324. UAE Clinical Trial Supply & Logistics Market by Value, 2021-2031 (USD Mn, AGR (%), CAGR(%))
Table 325. UAE Clinical Trial Supply & Logistics Market by Value, 2021-2031 (USD Mn, AGR (%), CAGR(%)) (V – Shaped Recovery)
Table 326. UAE Clinical Trial Supply & Logistics Market by Value, 2021-2031 (USD Mn, AGR (%), CAGR(%)) (W – Shaped Recovery)
Table 327. UAE Clinical Trial Supply & Logistics Market by Value, 2021-2031 (USD Mn, AGR (%), CAGR(%)) (U – Shaped Recovery)
Table 328. UAE Clinical Trial Supply & Logistics Market by Value, 2021-2031 (USD Mn, AGR (%), CAGR(%)) (L – Shaped Recovery)
Table 329. Rest of LAMEA Clinical Trial Supply & Logistics Market by Value, 2021-2031 (USD Mn, AGR (%), CAGR(%))
Table 330. Rest of LAMEA Clinical Trial Supply & Logistics Market by Value, 2021-2031 (USD Mn, AGR (%), CAGR(%)) (V – Shaped Recovery)
Table 331. Rest of LAMEA Clinical Trial Supply & Logistics Market by Value, 2021-2031 (USD Mn, AGR (%), CAGR(%)) (W – Shaped Recovery)
Table 332. Rest of LAMEA Clinical Trial Supply & Logistics Market by Value, 2021-2031 (USD Mn, AGR (%), CAGR(%)) (U – Shaped Recovery)
Table 333. Rest of LAMEA Clinical Trial Supply & Logistics Market by Value, 2021-2031 (USD Mn, AGR (%), CAGR(%)) (L – Shaped Recovery)
Table 334. New Product/Service Launch Strategy Adopted by Key Players in Global Clinical Trials Supply and Logistics Market, 2018-2021
Table 335. Acquisition Strategy Adopted by Key Players in Global Clinical Trials Supply and Logistics Market, 2018-2021
Table 336. Partnership Strategy Adopted by Key Players in Global Clinical Trials Supply and Logistics Market, 2018-2021
Table 337. Collaboration Strategy Adopted by Key Players in Global Clinical Trials Supply and Logistics Market, 2018-2021
Table 338. Expansion Strategy Adopted by Key Players in Global Clinical Trials Supply and Logistics Market, 2018-2021
Table 339. Joint Venture Strategy Adopted by Key Players in Global Clinical Trials Supply and Logistics Market, 2018-2021
Table 340. Catalent Inc: Key Details, (CEO, HQ, Revenue, Founded, No. of Employees, Company Type, Website, Business Segment)
Table 341. Catalent Inc: Product Benchmarking
Table 342. Catalent Inc: Recent Developments
Table 343. Thermo Fisher Scientific Inc. : Key Details, (CEO, HQ, Revenue, Founded, No. of Employees, Company Type, Website, Business Segment)
Table 344. Thermo Fisher Scientific Inc. : Product Benchmarking
Table 345. Thermo Fisher Scientific Inc. : Recent Developments
Table 346. UDG Healthcare Plc: Key Details, (CEO, HQ, Revenue, Founded, No. of Employees, Company Type, Website, Business Segment)
Table 347. UDG Healthcare Plc: Product Benchmarking
Table 348. UDG Healthcare Plc: Recent Developments
Table 349. Infosys: Key Details, (CEO, HQ, Revenue, Founded, No. of Employees, Company Type, Website, Business Segment)
Table 350. Infosys: Product Benchmarking
Table 351. Infosys: Recent Developments
Table 352. PRA Health Sciences: Key Details, (CEO, HQ, Revenue, Founded, No. of Employees, Company Type, Website, Business Segment)
Table 353. PRA Health Sciences: Product Benchmarking
Table 354. PRA Health Sciences: Recent Developments
Table 355. Eurofins Scientific: Key Details, (CEO, HQ, Revenue, Founded, No. of Employees, Company Type, Website, Business Segment)
Table 356. Eurofins Scientific: Product Benchmarking
Table 357. Eurofins Scientific: Recent Developments
Table 358. FedEx: Key Details, (CEO, HQ, Revenue, Founded, No. of Employees, Company Type, Website, Business Segment)
Table 359. FedEx: Product Benchmarking
Table 360. United Parcel Services: Key Details, (CEO, HQ, Revenue, Founded, No. of Employees, Company Type, Website, Business Segment)
Table 361. United Parcel Services: Recent Developments
Table 362. Kerry Logistics: Key Details, (CEO, HQ, Revenue, Founded, No. of Employees, Company Type, Website, Business Segment)
Table 363. Kerry Logistics: Product Benchmarking
Table 364. Kuehne + Nagel: Key Details, (CEO, HQ, Revenue, Founded, No. of Employees, Company Type, Website, Business Segment)
Table 365. Kuehne + Nagel: Product Benchmarking
Table 366. Kuehne + Nagel: Recent Developments
Table 367. Bilcare Limited: Key Details, (CEO, HQ, Revenue, Founded, No. of Employees, Company Type, Website, Business Segment)
Table 368. Bilcare Limited: Product Benchmarking
Table 369. Mayne Pharma Group Ltd: Key Details, (CEO, HQ, Revenue, Founded, No. of Employees, Company Type, Website, Business Segment)
Table 370. Mayne Pharma Group Ltd: Product Benchmarking
Table 371. Mayne Pharma Group Ltd: Recent Developments
Table 372. Intertek Group PLC: Key Details, (CEO, HQ, Revenue, Founded, No. of Employees, Company Type, Website, Business Segment)
Table 373. Intertek Group PLC: Product Benchmarking
Table 374. Intertek Group PLC: Recent Developments
Table 375. Almac Group: Key Details, (CEO, HQ, Revenue, Founded, No. of Employees, Company Type, Website, Business Segment)
Table 376. Almac Group: Product Benchmarking
Table 377. Almac Group: Recent Developments
Table 378. Parexel: Key Details, (CEO, HQ, Revenue, Founded, No. of Employees, Company Type, Website, Business Segment)
Table 379. Parexel: Recent Developments
Table 380. Biocair: Key Details, (CEO, HQ, Revenue, Founded, No. of Employees, Company Type, Website, Business Segment)
Table 381. Biocair: Product Benchmarking
Table 382. Biocair: Recent Developments
Table 383. Marken: Key Details, (CEO, HQ, Revenue, Founded, No. of Employees, Company Type, Website, Business Segment)
Table 384. Marken: Product Benchmarking
Table 385. Marken: Recent Developments
Table 386. PCI Services: Key Details, (CEO, HQ, Revenue, Founded, No. of Employees, Company Type, Website, Business Segment)
Table 387. PCI Services: Product Benchmarking
Table 388. PCI Services: Recent Developments
Table 389. Capsugel: Key Details, (CEO, HQ, Revenue, Founded, No. of Employees, Company Type, Website, Business Segment)
Table 390. Capsugel: Product Benchmarking
Table 391. Capsugel: Recent Developments
Table 392. Movianto: Key Details, (CEO, HQ, Revenue, Founded, No. of Employees, Company Type, Website, Business Segment)
Table 393. Movianto: Product Benchmarking
List of Figures
Figure 1. Global Clinical Trial Supply and Logistics Market Segmentation
Figure 2. Global Clinical Trial Supply & Logistics Market by Value, 2021-2031 (USD Mn, AGR (%), CAGR (%))
Figure 3. Global Clinical Trial Supply & Logistics Market by Value, 2021-2031 (USD Mn, AGR (%), CAGR (%)) (V – Shaped Recovery)
Figure 4. Global Clinical Trial Supply & Logistics Market by Value, 2021-2031 (USD Mn, AGR (%), CAGR (%)) (W – Shaped Recovery)
Figure 5. Global Clinical Trial Supply & Logistics Market by Value, 2021-2031 (USD Mn, AGR (%), CAGR (%)) (U – Shaped Recovery)
Figure 6. Global Clinical Trial Supply & Logistics Market by Value, 2021-2031 (USD Mn, AGR (%), CAGR (%)) (L – Shaped Recovery)
Figure 7. Global Clinical Trials Supply and Logistics Market Share Forecast by Region 2021, 2026, 2031 (%)
Figure 8. Global Clinical Trial Supply & Logistics Market by Region, 2021-2031 (USD Mn, AGR (%), CAGR (%))
Figure 9. Global Clinical Trial Supply & Logistics Market by Region, 2021-2031 (USD Mn, AGR (%), CAGR(%)) (V – Shaped Recovery)
Figure 10. Global Clinical Trial Supply & Logistics Market by Region, 2021-2031 (USD Mn, AGR (%), CAGR(%)) (W – Shaped Recovery)
Figure 11. Global Clinical Trial Supply & Logistics Market by Region, 2021-2031 (USD Mn, AGR (%), CAGR(%)) (U – Shaped Recovery)
Figure 12. Global Clinical Trial Supply & Logistics Market by Region, 2021-2031 (USD Mn, AGR (%), CAGR(%)) (L – Shaped Recovery)
Figure 13. Global Clinical Trials Supply and Logistics Market Share Forecast by Type 2021, 2026, 2031 (%)
Figure 14. Global Clinical Trial Supply & Logistics Market by Type, 2021-2031 (USD Mn, AGR (%), CAGR (%))
Figure 15. Global Clinical Trial Supply & Logistics Market by Type, 2021-2031 (USD Mn, AGR (%), CAGR (%)) (V – Shaped Recovery)
Figure 16. Global Clinical Trial Supply & Logistics Market by Type, 2021-2031 (USD Mn, AGR (%), CAGR (%)) (W – Shaped Recovery)
Figure 17. Global Clinical Trial Supply & Logistics Market by Type, 2021-2031 (USD Mn, AGR (%), CAGR (%)) (U – Shaped Recovery)
Figure 18. Global Clinical Trial Supply & Logistics Market by Type, 2021-2031 (USD Mn, AGR (%), CAGR (%)) (L – Shaped Recovery)
Figure 19. Global Clinical Trials Supply and Logistics Market Share Forecast by Manufacturing 2021, 2026, 2031 (%)
Figure 20. Global Clinical Trial Supply & Logistics Market By Manufacturing, 2021-2031 (USD Mn, AGR (%), CAGR (%)) (L – Shaped Recovery)
Figure 21. Global Clinical Trial Supply & Logistics Market By Manufacturing, 2021-2031 (USD Mn, AGR (%), CAGR (%)) (V – Shaped Recovery)
Figure 22. Global Clinical Trial Supply & Logistics Market By Manufacturing, 2021-2031 (USD Mn, AGR (%), CAGR (%)) (W – Shaped Recovery)
Figure 23. Global Clinical Trial Supply & Logistics Market By Manufacturing, 2021-2031 (USD Mn, AGR (%), CAGR (%)) (U – Shaped Recovery)
Figure 24. Global Clinical Trial Supply & Logistics Market By Manufacturing, 2021-2031 (USD Mn, AGR (%), CAGR (%)) (L – Shaped Recovery)
Figure 25. Global Clinical Trials Supply and Logistics Market Share Forecast by Logistics & Distribution 2021, 2026, 2031 (%)
Figure 26. Global Clinical Trial Supply & Logistics Market By Logistics & Distribution, 2021-2031 (USD Mn, AGR (%), CAGR (%))
Figure 27. Global Clinical Trial Supply & Logistics Market By Logistics & Distribution, 2021-2031 (USD Mn, AGR (%), CAGR (%)) (V – Shaped Recovery)
Figure 28. Global Clinical Trial Supply & Logistics Market By Logistics & Distribution, 2021-2031 (USD Mn, AGR (%), CAGR (%)) (W – Shaped Recovery)
Figure 29. Global Clinical Trial Supply & Logistics Market By Logistics & Distribution, 2021-2031 (USD Mn, AGR (%), CAGR (%)) (U – Shaped Recovery)
Figure 30. Global Clinical Trial Supply & Logistics Market By Logistics & Distribution, 2021-2031 (USD Mn, AGR (%), CAGR (%)) (L – Shaped Recovery)
Figure 31. Global Clinical Trials Supply and Logistics Market Share Forecast by CT Solutions 2021, 2026, 2031 (%)
Figure 32. Global Clinical Trial Supply & Logistics Market By CT Solutions, 2021-2031 (USD Mn, AGR (%), CAGR (%))
Figure 33. Global Clinical Trial Supply & Logistics Market By CT Solutions, 2021-2031 (USD Mn, AGR (%), CAGR (%)) (V – Shaped Recovery)
Figure 34. Global Clinical Trial Supply & Logistics Market By CT Solutions, 2021-2031 (USD Mn, AGR (%), CAGR (%)) (W – Shaped Recovery)
Figure 35. Global Clinical Trial Supply & Logistics Market By CT Solutions, 2021-2031 (USD Mn, AGR (%), CAGR (%)) (U – Shaped Recovery)
Figure 36. Global Clinical Trial Supply & Logistics Market By CT Solutions, 2021-2031 (USD Mn, AGR (%), CAGR (%)) (L – Shaped Recovery)
Figure 37. Global Clinical Trials Supply and Logistics Market Share Forecast by Packaging & Storage 2021, 2026, 2031 (%)
Figure 38. Global Clinical Trial Supply & Logistics Market By Packaging & Storage, 2021-2031 (USD Mn, AGR (%), CAGR (%))
Figure 39. Global Clinical Trial Supply & Logistics Market By Packaging & Storage, 2021-2031 (USD Mn, AGR (%), CAGR (%)) (V – Shaped Recovery)
Figure 40. Global Clinical Trial Supply & Logistics Market By Packaging & Storage, 2021-2031 (USD Mn, AGR (%), CAGR (%)) (W – Shaped Recovery)
Figure 41. Global Clinical Trial Supply & Logistics Market By Packaging & Storage, 2021-2031 (USD Mn, AGR (%), CAGR (%)) (U – Shaped Recovery)
Figure 42. Global Clinical Trial Supply & Logistics Market By Packaging & Storage, 2021-2031 (USD Mn, AGR (%), CAGR (%)) (L – Shaped Recovery)
Figure 43. Global Clinical Trials Supply and Logistics Market Share Forecast by Phase 2021, 2026, 2031 (%)
Figure 44. Global Clinical Trial Supply & Logistics Market By Phase, 2021-2031 (USD Mn, AGR (%), CAGR (%))
Figure 45. Global Clinical Trial Supply & Logistics Market By Phase, 2021-2031 (USD Mn, AGR (%), CAGR (%)) (V – Shaped Recovery)
Figure 46. Global Clinical Trial Supply & Logistics Market By Phase, 2021-2031 (USD Mn, AGR (%), CAGR (%)) (W – Shaped Recovery)
Figure 47. Global Clinical Trial Supply & Logistics Market By Phase, 2021-2031 (USD Mn, AGR (%), CAGR (%)) (U – Shaped Recovery)
Figure 48. Global Clinical Trial Supply & Logistics Market By Phase, 2021-2031 (USD Mn, AGR (%), CAGR (%)) (L – Shaped Recovery)
Figure 49. How COVID-19 is Impacting Clinical Trial Around the World
Figure 50. Process of RTSM in DTP Clinical Trial Models
Figure 51. Global Clinical Trial Supply & Logistics Market by DTP Model, 2021-2031 (USD Mn, AGR (%), CAGR (%))
Figure 52. Global Clinical Trial Supply & Logistics Market by DTP Model, 2021-2031 (USD Mn, AGR (%), CAGR (%)) (V-Shaped Recovery)
Figure 53. Global Clinical Trial Supply & Logistics Market by DTP Model, 2021-2031 (USD Mn, AGR (%), CAGR (%)) (W-Shaped Recovery)
Figure 54. Global Clinical Trial Supply & Logistics Market by DTP Model, 2021-2031 (USD Mn, AGR (%), CAGR (%)) (U-Shaped Recovery)
Figure 55. Global Clinical Trial Supply & Logistics Market by DTP Model, 2021-2031 (USD Mn, AGR (%), CAGR (%)) (L-Shaped Recovery)
Figure 56. North America Clinical Trials Supply and Logistics Market by Value, 2021-2031 (USD Mn, AGR (%), CAGR (%))
Figure 57. North America Clinical Trials Supply and Logistics Market by Value, 2021-2031 (USD Mn, AGR (%), CAGR (%)) (V – Shaped Recovery)
Figure 58. North America Clinical Trials Supply and Logistics Market by Value, 2021-2031 (USD Mn, AGR (%), CAGR (%)) (W – Shaped Recovery)
Figure 59. North America Clinical Trials Supply and Logistics Market by Value, 2021-2031 (USD Mn, AGR (%), CAGR (%)) (U – Shaped Recovery)
Figure 60. North America Clinical Trials Supply and Logistics Market by Value, 2021-2031 (USD Mn, AGR (%), CAGR (%)) (L – Shaped Recovery)
Figure 61. North America Clinical Trials Supply and Logistics Market by Country, 2021-2031 (USD Mn, AGR (%), CAGR (%))
Figure 62. North America Clinical Trials Supply and Logistics Market by Country, 2021-2031 (USD Mn, AGR (%), CAGR(%)) (V – Shaped Recovery)
Figure 63. North America Clinical Trials Supply and Logistics Market by Country, 2021-2031 (USD Mn, AGR (%), CAGR(%)) (W – Shaped Recovery)
Figure 64. North America Clinical Trials Supply and Logistics Market by Country, 2021-2031 (USD Mn, AGR (%), CAGR(%)) (U – Shaped Recovery)
Figure 65. North America Clinical Trials Supply and Logistics Market by Country, 2021-2031 (USD Mn, AGR (%), CAGR(%)) (L – Shaped Recovery)
Figure 66. North America Clinical Trials Supply and Logistics Market by Type, 2021-2031 (USD Mn, AGR (%), CAGR (%))
Figure 67. North America Clinical Trials Supply and Logistics Market by Type, 2021-2031 (USD Mn, AGR (%), CAGR (%)) (V – Shaped Recovery)
Figure 68. North America Clinical Trials Supply and Logistics Market by Type, 2021-2031 (USD Mn, AGR (%), CAGR (%)) (W – Shaped Recovery)
Figure 69. North America Clinical Trials Supply and Logistics Market by Type, 2021-2031 (USD Mn, AGR (%), CAGR (%)) (U – Shaped Recovery)
Figure 70. North America Clinical Trials Supply and Logistics Market by Type, 2021-2031 (USD Mn, AGR (%), CAGR (%)) (L – Shaped Recovery)
Figure 71. North America Clinical Trials Supply and Logistics Market By Manufacturing, 2021-2031 (USD Mn, AGR (%), CAGR (%))
Figure 72. North America Clinical Trials Supply and Logistics Market By Manufacturing, 2021-2031 (USD Mn, AGR (%), CAGR (%)) (V – Shaped Recovery)
Figure 73. North America Clinical Trials Supply and Logistics Market By Manufacturing, 2021-2031 (USD Mn, AGR (%), CAGR (%)) (W – Shaped Recovery)
Figure 74. North America Clinical Trials Supply and Logistics Market By Manufacturing, 2021-2031 (USD Mn, AGR (%), CAGR (%)) (U – Shaped Recovery)
Figure 75. North America Clinical Trials Supply and Logistics Market By Manufacturing, 2021-2031 (USD Mn, AGR (%), CAGR (%)) (L – Shaped Recovery)
Figure 76. North America Clinical Trials Supply and Logistics Market By Logistics & Distribution, 2021-2031 (USD Mn, AGR (%), CAGR (%))
Figure 77. North America Clinical Trials Supply and Logistics Market By Logistics & Distribution, 2021-2031 (USD Mn, AGR (%), CAGR (%)) (V – Shaped Recovery)
Figure 78. North America Clinical Trials Supply and Logistics Market By Logistics & Distribution, 2021-2031 (USD Mn, AGR (%), CAGR (%)) (W – Shaped Recovery)
Figure 79. North America Clinical Trials Supply and Logistics Market By Logistics & Distribution, 2021-2031 (USD Mn, AGR (%), CAGR (%)) (U – Shaped Recovery)
Figure 80. North America Clinical Trials Supply and Logistics Market By Logistics & Distribution, 2021-2031 (USD Mn, AGR (%), CAGR (%)) (L – Shaped Recovery)
Figure 81. North America Clinical Trials Supply and Logistics Market By CT Solutions, 2021-2031 (USD Mn, AGR (%), CAGR (%))
Figure 82. North America Clinical Trials Supply and Logistics Market By CT Solutions, 2021-2031 (USD Mn, AGR (%), CAGR (%)) (V – Shaped Recovery)
Figure 83. North America Clinical Trials Supply and Logistics Market By CT Solutions, 2021-2031 (USD Mn, AGR (%), CAGR (%)) (W – Shaped Recovery)
Figure 84. North America Clinical Trials Supply and Logistics Market By CT Solutions, 2021-2031 (USD Mn, AGR (%), CAGR (%)) (U – Shaped Recovery)
Figure 85. North America Clinical Trials Supply and Logistics Market By CT Solutions, 2021-2031 (USD Mn, AGR (%), CAGR (%)) (L – Shaped Recovery)
Figure 86. North America Clinical Trials Supply and Logistics Market By Packaging & Storage, 2021-2031 (USD Mn, AGR (%), CAGR (%))
Figure 87. North America Clinical Trials Supply and Logistics Market By Packaging & Storage, 2021-2031 (USD Mn, AGR (%), CAGR (%)) (V – Shaped Recovery)
Figure 88. North America Clinical Trials Supply and Logistics Market By Packaging & Storage, 2021-2031 (USD Mn, AGR (%), CAGR (%)) (W – Shaped Recovery)
Figure 89. North America Clinical Trials Supply and Logistics Market By Packaging & Storage, 2021-2031 (USD Mn, AGR (%), CAGR (%)) (U – Shaped Recovery)
Figure 90. North America Clinical Trials Supply and Logistics Market By Packaging & Storage, 2021-2031 (USD Mn, AGR (%), CAGR (%)) (L – Shaped Recovery)
Figure 91. North America Clinical Trials Supply and Logistics Market By Phase, 2021-2031 (USD Mn, AGR (%), CAGR (%))
Figure 92. North America Clinical Trials Supply and Logistics Market By Phase, 2021-2031 (USD Mn, AGR (%), CAGR (%)) (V – Shaped Recovery)
Figure 93. North America Clinical Trials Supply and Logistics Market By Phase, 2021-2031 (USD Mn, AGR (%), CAGR (%)) (W – Shaped Recovery)
Figure 94. North America Clinical Trials Supply and Logistics Market By Phase, 2021-2031 (USD Mn, AGR (%), CAGR (%)) (U – Shaped Recovery)
Figure 95. North America Clinical Trials Supply and Logistics Market By Phase, 2021-2031 (USD Mn, AGR (%), CAGR (%)) (L – Shaped Recovery)
Figure 96. North America Clinical Trial Supply & Logistics Market by DTP Model, 2021-2031 (USD Mn, AGR (%), CAGR (%))
Figure 97. North America Clinical Trial Supply & Logistics Market by DTP Model, 2021-2031 (USD Mn, AGR (%), CAGR (%)) (V-Shaped Recovery)
Figure 98. North America Clinical Trial Supply & Logistics Market by DTP Model, 2021-2031 (USD Mn, AGR (%), CAGR (%)) (W-Shaped Recovery)
Figure 99. North America Clinical Trial Supply & Logistics Market by DTP Model, 2021-2031 (USD Mn, AGR (%), CAGR (%)) (U-Shaped Recovery)
Figure 100. North America Clinical Trial Supply & Logistics Market by DTP Model, 2021-2031 (USD Mn, AGR (%), CAGR (%)) (L-Shaped Recovery)
Figure 101. North America Clinical Trials Supply and Logistics Market by Value, 2021-2031 (USD Mn, AGR (%), CAGR (%))
Figure 102. US Clinical Trials Supply and Logistics Market by Value, 2021-2031 (USD Mn, AGR (%), CAGR (%)) (V – Shaped Recovery)
Figure 103. US Clinical Trials Supply and Logistics Market by Value, 2021-2031 (USD Mn, AGR (%), CAGR (%)) (W – Shaped Recovery)
Figure 104. US Clinical Trials Supply and Logistics Market by Value, 2021-2031 (USD Mn, AGR (%), CAGR (%)) (U – Shaped Recovery)
Figure 105. US Clinical Trials Supply and Logistics Market by Value, 2021-2031 (USD Mn, AGR (%), CAGR (%)) (L – Shaped Recovery)
Figure 106. Canada Clinical Trials Supply and Logistics Market by Value, 2021-2031 (USD Mn, AGR (%), CAGR (%))
Figure 107. Canada Clinical Trials Supply and Logistics Market by Value, 2021-2031 (USD Mn, AGR (%), CAGR (%)) (V – Shaped Recovery)
Figure 108. Canada Clinical Trials Supply and Logistics Market by Value, 2021-2031 (USD Mn, AGR (%), CAGR (%)) (W – Shaped Recovery)
Figure 109. Canada Clinical Trials Supply and Logistics Market by Value, 2021-2031 (USD Mn, AGR (%), CAGR (%)) (U – Shaped Recovery)
Figure 110. Canada Clinical Trials Supply and Logistics Market by Value, 2021-2031 (USD Mn, AGR (%), CAGR (%)) (L – Shaped Recovery)
Figure 111. Mexico Clinical Trials Supply and Logistics Market by Value, 2021-2031 (USD Mn, AGR (%), CAGR (%))
Figure 112. Mexico Clinical Trials Supply and Logistics Market by Value, 2021-2031 (USD Mn, AGR (%), CAGR (%)) (V – Shaped Recovery)
Figure 113. Mexico Clinical Trials Supply and Logistics Market by Value, 2021-2031 (USD Mn, AGR (%), CAGR (%)) (W – Shaped Recovery)
Figure 114. Mexico Clinical Trials Supply and Logistics Market by Value, 2021-2031 (USD Mn, AGR (%), CAGR (%)) (U – Shaped Recovery)
Figure 115. Mexico Clinical Trials Supply and Logistics Market by Value, 2021-2031 (USD Mn, AGR (%), CAGR (%)) (L – Shaped Recovery)
Figure 116. Europe Clinical Trials Supply and Logistics Market by Value, 2021-2031 (USD Mn, AGR (%), CAGR (%))
Figure 117. Europe Clinical Trials Supply and Logistics Market by Value, 2021-2031 (USD Mn, AGR (%), CAGR (%)) (V – Shaped Recovery)
Figure 118. Europe Clinical Trials Supply and Logistics Market by Value, 2021-2031 (USD Mn, AGR (%), CAGR (%)) (W – Shaped Recovery)
Figure 119. Europe Clinical Trials Supply and Logistics Market by Value, 2021-2031 (USD Mn, AGR (%), CAGR (%)) (U – Shaped Recovery)
Figure 120. Europe Clinical Trials Supply and Logistics Market by Value, 2021-2031 (USD Mn, AGR (%), CAGR (%)) (L – Shaped Recovery)
Figure 121. Europe Clinical Trials Supply and Logistics Market by Country, 2021-2031 (USD Mn, AGR (%), CAGR (%))
Figure 122. Europe Clinical Trials Supply and Logistics Market by Country, 2021-2031 (USD Mn, AGR (%), CAGR(%)) (V – Shaped Recovery)
Figure 123. Europe Clinical Trials Supply and Logistics Market by Country, 2021-2031 (USD Mn, AGR (%), CAGR(%)) (W – Shaped Recovery)
Figure 124. Europe Clinical Trials Supply and Logistics Market by Country, 2021-2031 (USD Mn, AGR (%), CAGR(%)) (U – Shaped Recovery)
Figure 125. Europe Clinical Trials Supply and Logistics Market by Country, 2021-2031 (USD Mn, AGR (%), CAGR(%)) (L – Shaped Recovery)
Figure 126. Europe Clinical Trials Supply and Logistics Market by Type, 2021-2031 (USD Mn, AGR (%), CAGR (%))
Figure 127. Europe Clinical Trials Supply and Logistics Market by Type, 2021-2031 (USD Mn, AGR (%), CAGR (%)) (V – Shaped Recovery)
Figure 128. Europe Clinical Trials Supply and Logistics Market by Type, 2021-2031 (USD Mn, AGR (%), CAGR (%)) (W – Shaped Recovery)
Figure 129. Europe Clinical Trials Supply and Logistics Market by Type, 2021-2031 (USD Mn, AGR (%), CAGR (%)) (U – Shaped Recovery)
Figure 130. Europe Clinical Trials Supply and Logistics Market by Type, 2021-2031 (USD Mn, AGR (%), CAGR (%)) (L – Shaped Recovery)
Figure 131. Europe Clinical Trials Supply and Logistics Market By Manufacturing, 2021-2031 (USD Mn, AGR (%), CAGR (%))
Figure 132. Europe Clinical Trials Supply and Logistics Market By Manufacturing, 2021-2031 (USD Mn, AGR (%), CAGR (%)) (V – Shaped Recovery)
Figure 133. Europe Clinical Trials Supply and Logistics Market By Manufacturing, 2021-2031 (USD Mn, AGR (%), CAGR (%)) (W – Shaped Recovery)
Figure 134. Europe Clinical Trials Supply and Logistics Market By Manufacturing, 2021-2031 (USD Mn, AGR (%), CAGR (%)) (U – Shaped Recovery)
Figure 135. Europe Clinical Trials Supply and Logistics Market By Manufacturing, 2021-2031 (USD Mn, AGR (%), CAGR (%)) (L – Shaped Recovery)
Figure 136. Europe Clinical Trials Supply and Logistics Market By Logistics & Distribution, 2021-2031 (USD Mn, AGR (%), CAGR (%))
Figure 137. Europe Clinical Trials Supply and Logistics Market By Logistics & Distribution, 2021-2031 (USD Mn, AGR (%), CAGR (%)) (V – Shaped Recovery)
Figure 138. Europe Clinical Trials Supply and Logistics Market By Logistics & Distribution, 2021-2031 (USD Mn, AGR (%), CAGR (%)) (W – Shaped Recovery)
Figure 139. Europe Clinical Trials Supply and Logistics Market By Logistics & Distribution, 2021-2031 (USD Mn, AGR (%), CAGR (%)) (U – Shaped Recovery)
Figure 140. Europe Clinical Trials Supply and Logistics Market By Logistics & Distribution, 2021-2031 (USD Mn, AGR (%), CAGR (%)) (L – Shaped Recovery)
Figure 141. Europe Clinical Trials Supply and Logistics Market By CT Solutions, 2021-2031 (USD Mn, AGR (%), CAGR (%))
Figure 142. Europe Clinical Trials Supply and Logistics Market By CT Solutions, 2021-2031 (USD Mn, AGR (%), CAGR (%)) (V – Shaped Recovery)
Figure 143. Europe Clinical Trials Supply and Logistics Market By CT Solutions, 2021-2031 (USD Mn, AGR (%), CAGR (%)) (W – Shaped Recovery)
Figure 144. Europe Clinical Trials Supply and Logistics Market By CT Solutions, 2021-2031 (USD Mn, AGR (%), CAGR (%)) (U – Shaped Recovery)
Figure 145. Europe Clinical Trials Supply and Logistics Market By CT Solutions, 2021-2031 (USD Mn, AGR (%), CAGR (%)) (L – Shaped Recovery)
Figure 146. Europe Clinical Trials Supply and Logistics Market By Packaging & Storage, 2021-2031 (USD Mn, AGR (%), CAGR (%))
Figure 147. Europe Clinical Trials Supply and Logistics Market By Packaging & Storage, 2021-2031 (USD Mn, AGR (%), CAGR (%)) (V – Shaped Recovery)
Figure 148. Europe Clinical Trials Supply and Logistics Market By Packaging & Storage, 2021-2031 (USD Mn, AGR (%), CAGR (%)) (W – Shaped Recovery)
Figure 149. Europe Clinical Trials Supply and Logistics Market By Packaging & Storage, 2021-2031 (USD Mn, AGR (%), CAGR (%)) (U – Shaped Recovery)
Figure 150. Europe Clinical Trials Supply and Logistics Market By Packaging & Storage, 2021-2031 (USD Mn, AGR (%), CAGR (%)) (L – Shaped Recovery)
Figure 151. Europe Clinical Trials Supply and Logistics Market By Phase, 2021-2031 (USD Mn, AGR (%), CAGR (%))
Figure 152. Europe Clinical Trials Supply and Logistics Market By Phase, 2021-2031 (USD Mn, AGR (%), CAGR (%)) (V – Shaped Recovery)
Figure 153. Europe Clinical Trials Supply and Logistics Market By Phase, 2021-2031 (USD Mn, AGR (%), CAGR (%)) (W – Shaped Recovery)
Figure 154. Europe Clinical Trials Supply and Logistics Market By Phase, 2021-2031 (USD Mn, AGR (%), CAGR (%)) (U – Shaped Recovery)
Figure 155. Europe Clinical Trials Supply and Logistics Market By Phase, 2021-2031 (USD Mn, AGR (%), CAGR (%)) (L – Shaped Recovery)
Figure 156. Europe Clinical Trial Supply & Logistics Market by DTP Model, 2021-2031 (USD Mn, AGR (%), CAGR (%))
Figure 157. Europe Clinical Trial Supply & Logistics Market by DTP Model, 2021-2031 (USD Mn, AGR (%), CAGR (%)) (V-Shaped Recovery)
Figure 158. Europe Clinical Trial Supply & Logistics Market by DTP Model, 2021-2031 (USD Mn, AGR (%), CAGR (%)) (W-Shaped Recovery)
Figure 159. Europe Clinical Trial Supply & Logistics Market by DTP Model, 2021-2031 (USD Mn, AGR (%), CAGR (%)) (U-Shaped Recovery)
Figure 160. Europe Clinical Trial Supply & Logistics Market by DTP Model, 2021-2031 (USD Mn, AGR (%), CAGR (%)) (L-Shaped Recovery)
Figure 161. Germany Clinical Trials Supply and Logistics Market by Value, 2021-2031 (USD Mn, AGR (%), CAGR (%))
Figure 162. Germany Clinical Trials Supply and Logistics Market by Value, 2021-2031 (USD Mn, AGR (%), CAGR (%)) (V – Shaped Recovery)
Figure 163. Germany Clinical Trials Supply and Logistics Market by Value, 2021-2031 (USD Mn, AGR (%), CAGR (%)) (W – Shaped Recovery)
Figure 164. Germany Clinical Trials Supply and Logistics Market by Value, 2021-2031 (USD Mn, AGR (%), CAGR (%)) (U – Shaped Recovery)
Figure 165. Germany Clinical Trials Supply and Logistics Market by Value, 2021-2031 (USD Mn, AGR (%), CAGR (%)) (L – Shaped Recovery)
Figure 166. UK Clinical Trials Supply and Logistics Market by Value, 2021-2031 (USD Mn, AGR (%), CAGR (%))
Figure 167. UK Clinical Trials Supply and Logistics Market by Value, 2021-2031 (USD Mn, AGR (%), CAGR (%)) (V – Shaped Recovery)
Figure 168. UK Clinical Trials Supply and Logistics Market by Value, 2021-2031 (USD Mn, AGR (%), CAGR (%)) (W – Shaped Recovery)
Figure 169. UK Clinical Trials Supply and Logistics Market by Value, 2021-2031 (USD Mn, AGR (%), CAGR (%)) (U – Shaped Recovery)
Figure 170. UK Clinical Trials Supply and Logistics Market by Value, 2021-2031 (USD Mn, AGR (%), CAGR (%)) (L – Shaped Recovery)
Figure 171. France Clinical Trials Supply and Logistics Market by Value, 2021-2031 (USD Mn, AGR (%), CAGR (%))
Figure 172. France Clinical Trials Supply and Logistics Market by Value, 2021-2031 (USD Mn, AGR (%), CAGR (%)) (V – Shaped Recovery)
Figure 173. France Clinical Trials Supply and Logistics Market by Value, 2021-2031 (USD Mn, AGR (%), CAGR (%)) (W – Shaped Recovery)
Figure 174. France Clinical Trials Supply and Logistics Market by Value, 2021-2031 (USD Mn, AGR (%), CAGR (%)) (U – Shaped Recovery)
Figure 175. France Clinical Trials Supply and Logistics Market by Value, 2021-2031 (USD Mn, AGR (%), CAGR (%)) (L – Shaped Recovery)
Figure 176. Italy Clinical Trials Supply and Logistics Market by Value, 2021-2031 (USD Mn, AGR (%), CAGR (%))
Figure 177. Italy Clinical Trials Supply and Logistics Market by Value, 2021-2031 (USD Mn, AGR (%), CAGR (%)) (V – Shaped Recovery)
Figure 178. Italy Clinical Trials Supply and Logistics Market by Value, 2021-2031 (USD Mn, AGR (%), CAGR (%)) (W – Shaped Recovery)
Figure 179. Italy Clinical Trials Supply and Logistics Market by Value, 2021-2031 (USD Mn, AGR (%), CAGR (%)) (U – Shaped Recovery)
Figure 180. Italy Clinical Trials Supply and Logistics Market by Value, 2021-2031 (USD Mn, AGR (%), CAGR (%)) (L – Shaped Recovery)
Figure 181. Spain Clinical Trials Supply and Logistics Market by Value, 2021-2031 (USD Mn, AGR (%), CAGR (%))
Figure 182. Spain Clinical Trials Supply and Logistics Market by Value, 2021-2031 (USD Mn, AGR (%), CAGR (%)) (V – Shaped Recovery)
Figure 183. Spain Clinical Trials Supply and Logistics Market by Value, 2021-2031 (USD Mn, AGR (%), CAGR (%)) (W – Shaped Recovery)
Figure 184. Spain Clinical Trials Supply and Logistics Market by Value, 2021-2031 (USD Mn, AGR (%), CAGR (%)) (U – Shaped Recovery)
Figure 185. Spain Clinical Trials Supply and Logistics Market by Value, 2021-2031 (USD Mn, AGR (%), CAGR (%)) (L – Shaped Recovery)
Figure 186. Rest of Europe Clinical Trials Supply and Logistics Market by Value, 2021-2031 (USD Mn, AGR (%), CAGR (%))
Figure 187. Rest of Europe Clinical Trials Supply and Logistics Market by Value, 2021-2031 (USD Mn, AGR (%), CAGR (%)) (V – Shaped Recovery)
Figure 188. Rest of Europe Clinical Trials Supply and Logistics Market by Value, 2021-2031 (USD Mn, AGR (%), CAGR (%)) (W – Shaped Recovery)
Figure 189. Rest of Europe Clinical Trials Supply and Logistics Market by Value, 2021-2031 (USD Mn, AGR (%), CAGR (%)) (U – Shaped Recovery)
Figure 190. Rest of Europe Clinical Trials Supply and Logistics Market by Value, 2021-2031 (USD Mn, AGR (%), CAGR (%)) (L – Shaped Recovery)
Figure 191. Asia-Pacific Clinical Trials Supply and Logistics Market by Value, 2021-2031 (USD Mn, AGR (%), CAGR (%))
Figure 192. Asia-Pacific Clinical Trials Supply and Logistics Market by Value, 2021-2031 (USD Mn, AGR (%), CAGR (%)) (V – Shaped Recovery)
Figure 193. Asia-Pacific Clinical Trials Supply and Logistics Market by Value, 2021-2031 (USD Mn, AGR (%), CAGR (%)) (W – Shaped Recovery)
Figure 194. Asia-Pacific Clinical Trials Supply and Logistics Market by Value, 2021-2031 (USD Mn, AGR (%), CAGR (%)) (U – Shaped Recovery)
Figure 195. Asia-Pacific Clinical Trials Supply and Logistics Market by Value, 2021-2031 (USD Mn, AGR (%), CAGR (%)) (L – Shaped Recovery)
Figure 196. Asia-Pacific Clinical Trials Supply and Logistics Market by Country, 2021-2031 (USD Mn, AGR (%), CAGR (%))
Figure 197. Asia-Pacific Clinical Trials Supply and Logistics Market by Country, 2021-2031 (USD Mn, AGR (%), CAGR(%)) (V – Shaped Recovery)
Figure 198. Asia-Pacific Clinical Trials Supply and Logistics Market by Country, 2021-2031 (USD Mn, AGR (%), CAGR(%)) (W – Shaped Recovery)
Figure 199. Asia-Pacific Clinical Trials Supply and Logistics Market by Country, 2021-2031 (USD Mn, AGR (%), CAGR(%)) (U – Shaped Recovery)
Figure 200. Asia-Pacific Clinical Trials Supply and Logistics Market by Country, 2021-2031 (USD Mn, AGR (%), CAGR(%)) (L – Shaped Recovery)
Figure 201. Asia-Pacific Clinical Trials Supply and Logistics Market by Type, 2021-2031 (USD Mn, AGR (%), CAGR (%))
Figure 202. Asia-Pacific Clinical Trials Supply and Logistics Market by Type, 2021-2031 (USD Mn, AGR (%), CAGR (%)) (V – Shaped Recovery)
Figure 203. Asia-Pacific Clinical Trials Supply and Logistics Market by Type, 2021-2031 (USD Mn, AGR (%), CAGR (%)) (W – Shaped Recovery)
Figure 204. Asia-Pacific Clinical Trials Supply and Logistics Market by Type, 2021-2031 (USD Mn, AGR (%), CAGR (%)) (U – Shaped Recovery)
Figure 205. Asia-Pacific Clinical Trials Supply and Logistics Market by Type, 2021-2031 (USD Mn, AGR (%), CAGR (%)) (L – Shaped Recovery)
Figure 206. Asia-Pacific Clinical Trials Supply and Logistics Market By Manufacturing, 2021-2031 (USD Mn, AGR (%), CAGR (%)) (L – Shaped Recovery)
Figure 207. Asia-Pacific Clinical Trials Supply and Logistics Market By Manufacturing, 2021-2031 (USD Mn, AGR (%), CAGR (%)) (V – Shaped Recovery)
Figure 208. Asia-Pacific Clinical Trials Supply and Logistics Market By Manufacturing, 2021-2031 (USD Mn, AGR (%), CAGR (%)) (W – Shaped Recovery)
Figure 209. Asia-Pacific Clinical Trials Supply and Logistics Market By Manufacturing, 2021-2031 (USD Mn, AGR (%), CAGR (%)) (U – Shaped Recovery)
Figure 210. Asia-Pacific Clinical Trials Supply and Logistics Market By Manufacturing, 2021-2031 (USD Mn, AGR (%), CAGR (%)) (L – Shaped Recovery)
Figure 211. Asia-Pacific Clinical Trials Supply and Logistics Market By Logistics & Distribution, 2021-2031 (USD Mn, AGR (%), CAGR (%))
Figure 212. Asia-Pacific Clinical Trials Supply and Logistics Market By Logistics & Distribution, 2021-2031 (USD Mn, AGR (%), CAGR (%)) (V – Shaped Recovery)
Figure 213. Asia-Pacific Clinical Trials Supply and Logistics Market By Logistics & Distribution, 2021-2031 (USD Mn, AGR (%), CAGR (%)) (W – Shaped Recovery)
Figure 214. Asia-Pacific Clinical Trials Supply and Logistics Market By Logistics & Distribution, 2021-2031 (USD Mn, AGR (%), CAGR (%)) (U – Shaped Recovery)
Figure 215. Asia-Pacific Clinical Trials Supply and Logistics Market By Logistics & Distribution, 2021-2031 (USD Mn, AGR (%), CAGR (%)) (L – Shaped Recovery)
Figure 216. Asia-Pacific Clinical Trials Supply and Logistics Market By CT Solutions, 2021-2031 (USD Mn, AGR (%), CAGR (%))
Figure 217. Asia-Pacific Clinical Trials Supply and Logistics Market By CT Solutions, 2021-2031 (USD Mn, AGR (%), CAGR (%)) (V – Shaped Recovery)
Figure 218. Asia-Pacific Clinical Trials Supply and Logistics Market By CT Solutions, 2021-2031 (USD Mn, AGR (%), CAGR (%)) (W – Shaped Recovery)
Figure 219. Asia-Pacific Clinical Trials Supply and Logistics Market By CT Solutions, 2021-2031 (USD Mn, AGR (%), CAGR (%)) (U – Shaped Recovery)
Figure 220. Asia-Pacific Clinical Trials Supply and Logistics Market By CT Solutions, 2021-2031 (USD Mn, AGR (%), CAGR (%)) (L – Shaped Recovery)
Figure 221. Asia-Pacific Clinical Trials Supply and Logistics Market By Packaging & Storage, 2021-2031 (USD Mn, AGR (%), CAGR (%))
Figure 222. Asia-Pacific Clinical Trials Supply and Logistics Market By Packaging & Storage, 2021-2031 (USD Mn, AGR (%), CAGR (%)) (V – Shaped Recovery)
Figure 223. Asia-Pacific Clinical Trials Supply and Logistics Market By Packaging & Storage, 2021-2031 (USD Mn, AGR (%), CAGR (%)) (W – Shaped Recovery)
Figure 224. Asia-Pacific Clinical Trials Supply and Logistics Market By Packaging & Storage, 2021-2031 (USD Mn, AGR (%), CAGR (%)) (U – Shaped Recovery)
Figure 225. Asia-Pacific Clinical Trials Supply and Logistics Market By Packaging & Storage, 2021-2031 (USD Mn, AGR (%), CAGR (%)) (L – Shaped Recovery)
Figure 226. Asia-Pacific Clinical Trials Supply and Logistics Market By Phase, 2021-2031 (USD Mn, AGR (%), CAGR (%))
Figure 227. Asia-Pacific Clinical Trials Supply and Logistics Market By Phase, 2021-2031 (USD Mn, AGR (%), CAGR (%)) (V – Shaped Recovery)
Figure 228. Asia-Pacific Clinical Trials Supply and Logistics Market By Phase, 2021-2031 (USD Mn, AGR (%), CAGR (%)) (W – Shaped Recovery)
Figure 229. Asia-Pacific Clinical Trials Supply and Logistics Market By Phase, 2021-2031 (USD Mn, AGR (%), CAGR (%)) (U – Shaped Recovery)
Figure 230. Asia-Pacific Clinical Trials Supply and Logistics Market By Phase, 2021-2031 (USD Mn, AGR (%), CAGR (%)) (L – Shaped Recovery)
Figure 231. Asia-Pacific Clinical Trial Supply & Logistics Market by DTP Model, 2021-2031 (USD Mn, AGR (%), CAGR (%))
Figure 232. Asia-Pacific Clinical Trial Supply & Logistics Market by DTP Model, 2021-2031 (USD Mn, AGR (%), CAGR (%)) (V-Shaped Recovery)
Figure 233. Asia-Pacific Clinical Trial Supply & Logistics Market by DTP Model, 2021-2031 (USD Mn, AGR (%), CAGR (%)) (W-Shaped Recovery)
Figure 234. Asia-Pacific Clinical Trial Supply & Logistics Market by DTP Model, 2021-2031 (USD Mn, AGR (%), CAGR (%)) (U-Shaped Recovery)
Figure 235. Asia-Pacific Clinical Trial Supply & Logistics Market by DTP Model, 2021-2031 (USD Mn, AGR (%), CAGR (%)) (L-Shaped Recovery)
Figure 236. China Asia-Pacific Clinical Trials Supply and Logistics Market by Value, 2021-2031 (USD Mn, AGR (%), CAGR (%))
Figure 237. China Clinical Trials Supply and Logistics Market by Value, 2021-2031 (USD Mn, AGR (%), CAGR (%)) (V – Shaped Recovery)
Figure 238. China Clinical Trials Supply and Logistics Market by Value, 2021-2031 (USD Mn, AGR (%), CAGR (%)) (W – Shaped Recovery)
Figure 239. China Clinical Trials Supply and Logistics Market by Value, 2021-2031 (USD Mn, AGR (%), CAGR (%)) (U – Shaped Recovery)
Figure 240. China Clinical Trials Supply and Logistics Market by Value, 2021-2031 (USD Mn, AGR (%), CAGR (%)) (L – Shaped Recovery)
Figure 241. India Asia-Pacific Clinical Trials Supply and Logistics Market by Value, 2021-2031 (USD Mn, AGR (%), CAGR (%))
Figure 242. India Clinical Trials Supply and Logistics Market by Value, 2021-2031 (USD Mn, AGR (%), CAGR (%)) (V – Shaped Recovery)
Figure 243. India Clinical Trials Supply and Logistics Market by Value, 2021-2031 (USD Mn, AGR (%), CAGR (%)) (W – Shaped Recovery)
Figure 244. India Clinical Trials Supply and Logistics Market by Value, 2021-2031 (USD Mn, AGR (%), CAGR (%)) (U – Shaped Recovery)
Figure 245. India Clinical Trials Supply and Logistics Market by Value, 2021-2031 (USD Mn, AGR (%), CAGR (%)) (L – Shaped Recovery)
Figure 246. Japan Clinical Trials Supply and Logistics Market by Value, 2021-2031 (USD Mn, AGR (%), CAGR (%))
Figure 247. Japan Clinical Trials Supply and Logistics Market by Value, 2021-2031 (USD Mn, AGR (%), CAGR (%)) (V – Shaped Recovery)
Figure 248. Japan Clinical Trials Supply and Logistics Market by Value, 2021-2031 (USD Mn, AGR (%), CAGR (%)) (W – Shaped Recovery)
Figure 249. Japan Clinical Trials Supply and Logistics Market by Value, 2021-2031 (USD Mn, AGR (%), CAGR (%)) (U – Shaped Recovery)
Figure 250. Japan Clinical Trials Supply and Logistics Market by Value, 2021-2031 (USD Mn, AGR (%), CAGR (%)) (L – Shaped Recovery)
Figure 251. South Korea Clinical Trials Supply and Logistics Market by Value, 2021-2031 (USD Mn, AGR (%), CAGR (%))
Figure 252. South Korea Clinical Trials Supply and Logistics Market by Value, 2021-2031 (USD Mn, AGR (%), CAGR (%)) (V – Shaped Recovery)
Figure 253. South Korea Clinical Trials Supply and Logistics Market by Value, 2021-2031 (USD Mn, AGR (%), CAGR (%)) (W – Shaped Recovery)
Figure 254. South Korea Clinical Trials Supply and Logistics Market by Value, 2021-2031 (USD Mn, AGR (%), CAGR (%)) (U – Shaped Recovery)
Figure 255. South Korea Clinical Trials Supply and Logistics Market by Value, 2021-2031 (USD Mn, AGR (%), CAGR (%)) (L – Shaped Recovery)
Figure 256. Australia Clinical Trials Supply and Logistics Market by Value, 2021-2031 (USD Mn, AGR (%), CAGR (%))
Figure 257. Australia Clinical Trials Supply and Logistics Market by Value, 2021-2031 (USD Mn, AGR (%), CAGR (%)) (V – Shaped Recovery)
Figure 258. Australia Clinical Trials Supply and Logistics Market by Value, 2021-2031 (USD Mn, AGR (%), CAGR (%)) (W – Shaped Recovery)
Figure 259. Australia Clinical Trials Supply and Logistics Market by Value, 2021-2031 (USD Mn, AGR (%), CAGR (%)) (U – Shaped Recovery)
Figure 260. Australia Clinical Trials Supply and Logistics Market by Value, 2021-2031 (USD Mn, AGR (%), CAGR (%)) (L – Shaped Recovery)
Figure 261. Rest of Asia-Pacific Clinical Trials Supply and Logistics Market by Value, 2021-2031 (USD Mn, AGR (%), CAGR (%))
Figure 262. Rest of Asia-Pacific Clinical Trials Supply and Logistics Market by Value, 2021-2031 (USD Mn, AGR (%), CAGR (%)) (V – Shaped Recovery)
Figure 263. Rest of Asia-Pacific Clinical Trials Supply and Logistics Market by Value, 2021-2031 (USD Mn, AGR (%), CAGR (%)) (W – Shaped Recovery)
Figure 264. Rest of Asia-Pacific Clinical Trials Supply and Logistics Market by Value, 2021-2031 (USD Mn, AGR (%), CAGR (%)) (U – Shaped Recovery)
Figure 265. Rest of Asia-Pacific Clinical Trials Supply and Logistics Market by Value, 2021-2031 (USD Mn, AGR (%), CAGR (%)) (L – Shaped Recovery)
Figure 266. LAMEA Clinical Trials Supply and Logistics Market by Value, 2021-2031 (USD Mn, AGR (%), CAGR (%))
Figure 267. LAMEA Clinical Trials Supply and Logistics Market by Value, 2021-2031 (USD Mn, AGR (%), CAGR (%)) (V – Shaped Recovery)
Figure 268. LAMEA Clinical Trials Supply and Logistics Market by Value, 2021-2031 (USD Mn, AGR (%), CAGR (%)) (W – Shaped Recovery)
Figure 269. LAMEA Clinical Trials Supply and Logistics Market by Value, 2021-2031 (USD Mn, AGR (%), CAGR (%)) (U – Shaped Recovery)
Figure 270. LAMEA Clinical Trials Supply and Logistics Market by Value, 2021-2031 (USD Mn, AGR (%), CAGR (%)) (L – Shaped Recovery)
Figure 271. LAMEA Clinical Trials Supply and Logistics Market by Country, 2021-2031 (USD Mn, AGR (%), CAGR (%))
Figure 272. LAMEA Clinical Trials Supply and Logistics Market by Country, 2021-2031 (USD Mn, AGR (%), CAGR(%)) (V – Shaped Recovery)
Figure 273. LAMEA Clinical Trials Supply and Logistics Market by Country, 2021-2031 (USD Mn, AGR (%), CAGR(%)) (W – Shaped Recovery)
Figure 274. LAMEA Clinical Trials Supply and Logistics Market by Country, 2021-2031 (USD Mn, AGR (%), CAGR(%)) (U – Shaped Recovery)
Figure 275. LAMEA Clinical Trials Supply and Logistics Market by Country, 2021-2031 (USD Mn, AGR (%), CAGR(%)) (L – Shaped Recovery)
Figure 276. LAMEA Clinical Trials Supply and Logistics Market by Type, 2021-2031 (USD Mn, AGR (%), CAGR (%))
Figure 277. LAMEA Clinical Trials Supply and Logistics Market by Type, 2021-2031 (USD Mn, AGR (%), CAGR (%)) (V – Shaped Recovery)
Figure 278. LAMEA Clinical Trials Supply and Logistics Market by Type, 2021-2031 (USD Mn, AGR (%), CAGR (%)) (W – Shaped Recovery)
Figure 279. LAMEA Clinical Trials Supply and Logistics Market by Type, 2021-2031 (USD Mn, AGR (%), CAGR (%)) (U – Shaped Recovery)
Figure 280. LAMEA Clinical Trials Supply and Logistics Market by Type, 2021-2031 (USD Mn, AGR (%), CAGR (%)) (L – Shaped Recovery)
Figure 281. LAMEA Clinical Trials Supply and Logistics Market By Manufacturing, 2021-2031 (USD Mn, AGR (%), CAGR (%))
Figure 282. LAMEA Clinical Trials Supply and Logistics Market By Manufacturing, 2021-2031 (USD Mn, AGR (%), CAGR (%)) (V – Shaped Recovery)
Figure 283. LAMEA Clinical Trials Supply and Logistics Market By Manufacturing, 2021-2031 (USD Mn, AGR (%), CAGR (%)) (W – Shaped Recovery)
Figure 284. LAMEA Clinical Trials Supply and Logistics Market By Manufacturing, 2021-2031 (USD Mn, AGR (%), CAGR (%)) (U – Shaped Recovery)
Figure 285. LAMEA Clinical Trials Supply and Logistics Market By Manufacturing, 2021-2031 (USD Mn, AGR (%), CAGR (%)) (L – Shaped Recovery)
Figure 286. LAMEA Clinical Trials Supply and Logistics Market By Logistics & Distribution, 2021-2031 (USD Mn, AGR (%), CAGR (%))
Figure 287. LAMEA Clinical Trials Supply and Logistics Market By Logistics & Distribution, 2021-2031 (USD Mn, AGR (%), CAGR (%)) (V – Shaped Recovery)
Figure 288. LAMEA Clinical Trials Supply and Logistics Market By Logistics & Distribution, 2021-2031 (USD Mn, AGR (%), CAGR (%)) (W – Shaped Recovery)
Figure 289. LAMEA Clinical Trials Supply and Logistics Market By Logistics & Distribution, 2021-2031 (USD Mn, AGR (%), CAGR (%)) (U – Shaped Recovery)
Figure 290. LAMEA Clinical Trials Supply and Logistics Market By Logistics & Distribution, 2021-2031 (USD Mn, AGR (%), CAGR (%)) (L – Shaped Recovery)
Figure 291. LAMEA Clinical Trials Supply and Logistics Market By CT Solutions, 2021-2031 (USD Mn, AGR (%), CAGR (%))
Figure 292. LAMEA Clinical Trials Supply and Logistics Market By CT Solutions, 2021-2031 (USD Mn, AGR (%), CAGR (%)) (V – Shaped Recovery)
Figure 293. LAMEA Clinical Trials Supply and Logistics Market By CT Solutions, 2021-2031 (USD Mn, AGR (%), CAGR (%)) (W – Shaped Recovery)
Figure 294. LAMEA Clinical Trials Supply and Logistics Market By CT Solutions, 2021-2031 (USD Mn, AGR (%), CAGR (%)) (U – Shaped Recovery)
Figure 295. LAMEA Clinical Trials Supply and Logistics Market By CT Solutions, 2021-2031 (USD Mn, AGR (%), CAGR (%)) (L – Shaped Recovery)
Figure 296. LAMEA Clinical Trials Supply and Logistics Market By Packaging & Storage, 2021-2031 (USD Mn, AGR (%), CAGR (%))
Figure 297. LAMEA Clinical Trials Supply and Logistics Market By Packaging & Storage, 2021-2031 (USD Mn, AGR (%), CAGR (%)) (V – Shaped Recovery)
Figure 298. LAMEA Clinical Trials Supply and Logistics Market By Packaging & Storage, 2021-2031 (USD Mn, AGR (%), CAGR (%)) (W – Shaped Recovery)
Figure 299. LAMEA Clinical Trials Supply and Logistics Market By Packaging & Storage, 2021-2031 (USD Mn, AGR (%), CAGR (%)) (U – Shaped Recovery)
Figure 300. LAMEA Clinical Trials Supply and Logistics Market By Packaging & Storage, 2021-2031 (USD Mn, AGR (%), CAGR (%)) (L – Shaped Recovery)
Figure 301. LAMEA Clinical Trials Supply and Logistics Market By Phase, 2021-2031 (USD Mn, AGR (%), CAGR (%))
Figure 302. LAMEA Clinical Trials Supply and Logistics Market By Phase, 2021-2031 (USD Mn, AGR (%), CAGR (%)) (V – Shaped Recovery)
Figure 303. LAMEA Clinical Trials Supply and Logistics Market By Phase, 2021-2031 (USD Mn, AGR (%), CAGR (%)) (W – Shaped Recovery)
Figure 304. LAMEA Clinical Trials Supply and Logistics Market By Phase, 2021-2031 (USD Mn, AGR (%), CAGR (%)) (U – Shaped Recovery)
Figure 305. LAMEA Clinical Trials Supply and Logistics Market By Phase, 2021-2031 (USD Mn, AGR (%), CAGR (%)) (L – Shaped Recovery)
Figure 306. LAMEA Clinical Trial Supply & Logistics Market by DTP Model, 2021-2031 (USD Mn, AGR (%), CAGR (%))
Figure 307. LAMEA Clinical Trial Supply & Logistics Market by DTP Model, 2021-2031 (USD Mn, AGR (%), CAGR (%)) (V-Shaped Recovery)
Figure 308. LAMEA Clinical Trial Supply & Logistics Market by DTP Model, 2021-2031 (USD Mn, AGR (%), CAGR (%)) (W-Shaped Recovery)
Figure 309. LAMEA Clinical Trial Supply & Logistics Market by DTP Model, 2021-2031 (USD Mn, AGR (%), CAGR (%)) (U-Shaped Recovery)
Figure 310. LAMEA Clinical Trial Supply & Logistics Market by DTP Model, 2021-2031 (USD Mn, AGR (%), CAGR (%)) (L-Shaped Recovery)
Figure 311. LAMEA Clinical Trials Supply and Logistics Market by Value, 2021-2031 (USD Mn, AGR (%), CAGR (%))
Figure 312. Brazil Clinical Trials Supply and Logistics Market by Value, 2021-2031 (USD Mn, AGR (%), CAGR (%)) (V – Shaped Recovery)
Figure 313. Brazil Clinical Trials Supply and Logistics Market by Value, 2021-2031 (USD Mn, AGR (%), CAGR (%)) (W – Shaped Recovery)
Figure 314. Brazil Clinical Trials Supply and Logistics Market by Value, 2021-2031 (USD Mn, AGR (%), CAGR (%)) (U – Shaped Recovery)
Figure 315. Brazil Clinical Trials Supply and Logistics Market by Value, 2021-2031 (USD Mn, AGR (%), CAGR (%)) (L – Shaped Recovery)
Figure 316. South Africa Clinical Trials Supply and Logistics Market by Value, 2021-2031 (USD Mn, AGR (%), CAGR (%))
Figure 317. South Africa Clinical Trials Supply and Logistics Market by Value, 2021-2031 (USD Mn, AGR (%), CAGR (%)) (V – Shaped Recovery)
Figure 318. South Africa Clinical Trials Supply and Logistics Market by Value, 2021-2031 (USD Mn, AGR (%), CAGR (%)) (W – Shaped Recovery)
Figure 319. South Africa Clinical Trials Supply and Logistics Market by Value, 2021-2031 (USD Mn, AGR (%), CAGR (%)) (U – Shaped Recovery)
Figure 320. South Africa Clinical Trials Supply and Logistics Market by Value, 2021-2031 (USD Mn, AGR (%), CAGR (%)) (L – Shaped Recovery)
Figure 321. Saudi Arabia Clinical Trials Supply and Logistics Market by Value, 2021-2031 (USD Mn, AGR (%), CAGR (%))
Figure 322. Saudi Arabia Clinical Trials Supply and Logistics Market by Value, 2021-2031 (USD Mn, AGR (%), CAGR (%)) (V – Shaped Recovery)
Figure 323. Saudi Arabia Clinical Trials Supply and Logistics Market by Value, 2021-2031 (USD Mn, AGR (%), CAGR (%)) (W – Shaped Recovery)
Figure 324. Saudi Arabia Clinical Trials Supply and Logistics Market by Value, 2021-2031 (USD Mn, AGR (%), CAGR (%)) (U – Shaped Recovery)
Figure 325. Saudi Arabia Clinical Trials Supply and Logistics Market by Value, 2021-2031 (USD Mn, AGR (%), CAGR (%)) (L – Shaped Recovery)
Figure 326. Turkey Clinical Trials Supply and Logistics Market by Value, 2021-2031 (USD Mn, AGR (%), CAGR (%))
Figure 327. Turkey Clinical Trials Supply and Logistics Market by Value, 2021-2031 (USD Mn, AGR (%), CAGR (%)) (V – Shaped Recovery)
Figure 328. Turkey Clinical Trials Supply and Logistics Market by Value, 2021-2031 (USD Mn, AGR (%), CAGR (%)) (W – Shaped Recovery)
Figure 329. Turkey Clinical Trials Supply and Logistics Market by Value, 2021-2031 (USD Mn, AGR (%), CAGR (%)) (U – Shaped Recovery)
Figure 330. Turkey Clinical Trials Supply and Logistics Market by Value, 2021-2031 (USD Mn, AGR (%), CAGR (%)) (L – Shaped Recovery)
Figure 331. UAE Clinical Trials Supply and Logistics Market by Value, 2021-2031 (USD Mn, AGR (%), CAGR (%))
Figure 332. UAE Clinical Trials Supply and Logistics Market by Value, 2021-2031 (USD Mn, AGR (%), CAGR (%)) (V – Shaped Recovery)
Figure 333. UAE Clinical Trials Supply and Logistics Market by Value, 2021-2031 (USD Mn, AGR (%), CAGR (%)) (W – Shaped Recovery)
Figure 334. UAE Clinical Trials Supply and Logistics Market by Value, 2021-2031 (USD Mn, AGR (%), CAGR (%)) (U – Shaped Recovery)
Figure 335. UAE Clinical Trials Supply and Logistics Market by Value, 2021-2031 (USD Mn, AGR (%), CAGR (%)) (L – Shaped Recovery)
Figure 336. Rest of LAMEA Clinical Trials Supply and Logistics Market by Value, 2021-2031 (USD Mn, AGR (%), CAGR (%))
Figure 337. Rest of LAMEA Clinical Trials Supply and Logistics Market by Value, 2021-2031 (USD Mn, AGR (%), CAGR (%)) (V – Shaped Recovery)
Figure 338. Rest of LAMEA Clinical Trials Supply and Logistics Market by Value, 2021-2031 (USD Mn, AGR (%), CAGR (%)) (W – Shaped Recovery)
Figure 339. Rest of LAMEA Clinical Trials Supply and Logistics Market by Value, 2021-2031 (USD Mn, AGR (%), CAGR (%)) (U – Shaped Recovery)
Figure 340. Rest of LAMEA Clinical Trials Supply and Logistics Market by Value, 2021-2031 (USD Mn, AGR (%), CAGR (%)) (L – Shaped Recovery)
Figure 341. Clinical Trials Supply and Logistics Market by Company Share, 2020 (%)
Figure 342. Clinical Trials Supply and Logistics Market by Key Business Strategy, 2018-2021 (%)
Figure 343. Catalent Inc: Net Revenue, 2016-2020 (US$million, AGR%)
Figure 344. Catalent Inc: Gross Profit, 2016-2020 (US$million, AGR%)
Figure 345. Catalent Inc: R&D, 2016-2020 (US$million, AGR%)
Figure 346. Catalent Inc: EBIDTA, 2016-2020 (US$million, AGR%)
Figure 347. Thermo Fisher Scientific Inc. : Net Revenue, 2016-2020 (US$million, AGR%)
Figure 348. Thermo Fisher Scientific Inc. : Gross Profit, 2016-2020 (US$million, AGR%)
Figure 349. Thermo Fisher Scientific Inc. : R&D, 2016-2020 (US$million, AGR%)
Figure 350. Thermo Fisher Scientific Inc. : EBIDTA, 2016-2020 (US$million, AGR%)
Figure 351. UDG Healthcare Plc: Net Revenue, 2016-2020 (US$million, AGR%)
Figure 352. UDG Healthcare Plc: Gross Profit, 2016-2020 (US$million, AGR%)
Figure 353. UDG Healthcare Plc: EBIDTA, 2016-2020 (US$million, AGR%)
Figure 354. Infosys: Net Revenue, 2017-2021 (US$million, AGR%)
Figure 355. Infosys: Gross Profit, 2017-2021 (US$million, AGR%)
Figure 356. Infosys: EBIDTA, 2017-2021 (US$million, AGR%)
Figure 357. PRA Health Sciences: Net Revenue, 2016-2020 (US$million, AGR%)
Figure 358. PRA Health Sciences: Gross Profit, 2016-2020 (US$million, AGR%)
Figure 359. PRA Health Sciences: EBIDTA, 2016-2020 (US$million, AGR%)
Figure 360. Eurofins Scientific: Net Revenue, 2016-2020 (US$million, AGR%)
Figure 361. Eurofins Scientific: Gross Profit, 2016-2020 (US$million, AGR%)
Figure 362. Eurofins Scientific: EBIDTA, 2016-2020 (US$million, AGR%)
Figure 363. FedEx: Net Revenue, 2016-2020 (US$million, AGR%)
Figure 364. FedEx: Gross Profit, 2016-2020 (US$million, AGR%)
Figure 365. FedEx: EBIDTA, 2016-2020 (US$million, AGR%)
Figure 366. United Parcel Services: Net Revenue, 2016-2020 (US$million, AGR%)
Figure 367. United Parcel Services: Gross Profit, 2016-2020 (US$million, AGR%)
Figure 368. United Parcel Services: EBIDTA, 2016-2020 (US$million, AGR%)
Figure 369. Kerry Logistics: Net Revenue, 2016-2020 (US$million, AGR%)
Figure 370. Kerry Logistics: Gross Profit, 2016-2020 (US$million, AGR%)
Figure 371. Kerry Logistics: EBIDTA, 2016-2020 (US$million, AGR%)
Figure 372. Kuehne + Nagel: Net Revenue, 2016-2020 (US$million, AGR%)
Figure 373. Kuehne + Nagel: Gross Profit, 2016-2020 (US$million, AGR%)
Figure 374. Kuehne + Nagel: EBIDTA, 2016-2020 (US$million, AGR%)
Figure 375. Bilcare Limited: Net Revenue, 2016-2020 (US$million, AGR%)
Figure 376. Bilcare Limited: Gross Profit, 2016-2020 (US$million, AGR%)
Figure 377. Bilcare Limited: EBIDTA, 2016-2020 (US$million, AGR%)
Figure 378. Mayne Pharma Group Ltd: Net Revenue, 2016-2020 (US$million, AGR%)
Figure 379. Mayne Pharma Group Ltd: Gross Profit, 2016-2020 (US$million, AGR%)
Figure 380. Mayne Pharma Group Ltd: R&D, 2016-2020 (US$million, AGR%)
Figure 381. Mayne Pharma Group Ltd: EBIDTA, 2016-2020 (US$million, AGR%)
Figure 382. Intertek Group PLC: Net Revenue, 2016-2020 (US$million, AGR%)
Figure 383. Intertek Group PLC: EBIDTA, 2016-2020 (US$million, AGR%)
Bilcare Limited
Biocair
Catalent, Inc.
Eurofins Scientific SE
FedEx Corporation (FedEx)
Infosys Limited
Intertek Group PLC
Kerry Logistics Network Limited
Kuehne und Nagel International AG
Lonza’s Capsules & Health Ingredients (CHI)
Mayne Pharma Group Ltd
Movianto (Walden)
Parexel International
PCI Services
PRA Health Sciences, Inc.
The Almac Group
Thermo Fisher Scientific Inc.
UDG Healthcare PLC
United Parcel Service, Inc. (UPS)
List of Other Companies Mentioned in the report
American Airlines Cargo
Americold
AmerisourceBergen
Apohem
Bayer Healthcare
CEVA
Continental Carriers
DB Schenker
DHL International GmbH
DSV Panalpina A/S
Emergent Cold
Eurodifarm
FC (Flying Cargo) Express Ltd.
FedEx Corporation
Fisher Clinical Services
Hitachi Transport Systems
Joebstl Group
KN-Sincero Logistics Co. Ltd.
Kuehna+Nagel
Lineage Logistics
Maersk
Marken
Novartis
Panalpina Group
Preferred Freezer Services
Ryder
TNT Express
United Parcel Service Inc.
UTi
World Courier
XPO Logistics
List of Associations Mentioned in the Report
Agência Nacional de Vigilância Sanitária (ANVISA)
Central Drugs Standard Control Organization (CDSCO)
China FDA (CFDA)
Chinese Ministry of Health
Comissão Nacional de Ética em Pesquisa (CONEP)
Consorcio de Apoyo a la Investigación Biomédica – Plataforma Española de Ensayos Clínicos (CAIBER)
Drug Controller General of India (DCGI)
European Commission
European Medicines Agency (EMA)
Food and Drug Administration (FDA)
Health Science Authority
International Air Transport Association (IATA)
International Conference on Harmonisation of Technical Requirements for Registration of Pharmaceuticals for Human Use (ICH)
International Pharmaceutical Federation
Japanese Ministry of Health, Labour and Welfare (MHLW)
Les Enterprises du Medicament (LEEM)
Medicines and Healthcare Products Regulatory Agency (MHRA)
National Institutes of Health (NIH)
Pharmaceuticals for Human Use (ICH)
Transportation Administration Security (TAS)
US Pharmacopeia (USP)
World Health Organization (WHO)
Download sample pages
Complete the form below to download your free sample pages for Clinical Trial Supply and Logistics Market for Pharma 2021-2031Related reports
-
Global Clinical Trial Management System Market Forecast 2020-2030
The global market for clinical trial management systems was valued to be $1,152m in 2019 and is valued to reach...
Full DetailsPublished: 17 March 2020 -
Global Osteoporosis Pharmaceutical and Nutraceutical Market Report 2020-2030
Our 338-page report that includes 160 tables and 134 figures throws light on the pharmaceutical and nutraceutical market, the current...
Full DetailsPublished: 01 May 2020 -
Digital Clinical Supply Chain Market Report 2020-2030
Our 430+ page report provides 500+ tables and charts/graphs. Read on to discover the most lucrative areas in the industry...
Full DetailsPublished: 04 April 2021 -

Pharma Clinical Trial Services Market and Industry Forecast 2020-2030
The pharma clinical trial services market is expected to grow at a CAGR of 10% in the first half of...
Full DetailsPublished: 20 March 2020 -

Big Data Analytics in Healthcare Market Report 2021-2031
Healthcare has never been more personalized and affordable to anyone. Digital consulting applications use artificial intelligence to provide medical advice...Full DetailsPublished: 11 May 2021 -
Clinical Workflow Solutions Market Report 2020-2030
Where is the Clinical Workflow Solutions market heading? If you are involved in this sector you must read this newly...
Full DetailsPublished: 01 January 1970 -
Clinical Trial Packaging and Labelling Market Forecast 2020-2030
The global market for Clinical Trial Packaging and labelling is anticipated to reach US$657.0 million in 2020 and is further...
Full DetailsPublished: 24 March 2020 -
Pharma Contract Sales Market Report 2021-2031
Pharma services companies are widening their service offerings (either organically or inorganically through M&A) to become full-service providers, simplifying their...Full DetailsPublished: 13 July 2021 -
Pharmaceutical Spray Drying Market Report 2021-2031
The rising prevalence of oncological disorders, lung infections, rising demand for customised drugs coupled with new orphan diseases discoveries, are...Full DetailsPublished: 25 October 2021 -
Stem Cell Technologies and Applications Market Report 2021-2031
Factors such as rising prevalence of chronic and genetic diseases, increasing application areas of stem cell technologies, technological advancements, and...Full DetailsPublished: 10 August 2021
Download sample pages
Complete the form below to download your free sample pages for Clinical Trial Supply and Logistics Market for Pharma 2021-2031Do you have any custom requirements we can help you with?
Any specific country, geo region, market segment or specific company information?
Email us today, we can discuss your needs and see how we can help: jamie.roberts@visiongain.com
Would you like a free report overview of the report of your choice?
If so, please drop an email to Jamie Roberts stating your chosen report title to jamie.roberts@visiongain.com
Visiongain’s reports are based on comprehensive primary and secondary research. Those studies provide global market forecasts (sales by drug and class, with sub-markets and leading nations covered) and analyses of market drivers and restraints (including SWOT analysis) and current pipeline developments. To find out more about our reports methodology, please email jamie.roberts@visiongain.com
“Thank you for this Gene Therapy R&D Market report and for how easy the process was. Your colleague was very helpful and the report is just right for my purpose. This is the 2nd good report from Visiongain and a good price.”
Dr Luz Chapa Azuella, Mexico
American Association of Colleges of Pharmacy
American College of Clinical Pharmacy
American Pharmacists Association
American Society for Pharmacy Law
American Society of Consultant Pharmacists
American Society of Health-System Pharmacists
Association of Special Pharmaceutical Manufacturers
Australian College of Pharmacy
Biotechnology Industry Organization
Canadian Pharmacists Association
Canadian Society of Hospital Pharmacists
Chinese Pharmaceutical Association
College of Psychiatric and Neurologic Pharmacists
Danish Association of Pharmaconomists
European Association of Employed Community Pharmacists in Europe
European Medicines Agency
Federal Drugs Agency
General Medical Council
Head of Medicines Agency
International Federation of Pharmaceutical Manufacturers & Associations
International Pharmaceutical Federation
International Pharmaceutical Students’ Federation
Medicines and Healthcare Products Regulatory Agency
National Pharmacy Association
Norwegian Pharmacy Association
Ontario Pharmacists Association
Pakistan Pharmacists Association
Pharmaceutical Association of Mauritius
Pharmaceutical Group of the European Union
Pharmaceutical Society of Australia
Pharmaceutical Society of Ireland
Pharmaceutical Society Of New Zealand
Pharmaceutical Society of Northern Ireland
Professional Compounding Centers of America
Royal Pharmaceutical Society
The American Association of Pharmaceutical Scientists
The BioIndustry Association
The Controlled Release Society
The European Federation of Pharmaceutical Industries and Associations
The European Personalised Medicine Association
The Institute of Clinical Research
The International Society for Pharmaceutical Engineering
The Pharmaceutical Association of Israel
The Pharmaceutical Research and Manufacturers of America
The Pharmacy Guild of Australia
The Society of Hospital Pharmacists of Australia
Latest Pharma news
Visiongain Publishes Cell Therapy Technologies Market Report 2024-2034
The cell therapy technologies market is estimated at US$7,041.3 million in 2024 and is projected to grow at a CAGR of 10.7% during the forecast period 2024-2034.
18 April 2024
Visiongain Publishes Automation in Biopharma Industry Market Report 2024-2034
The global Automation in Biopharma Industry market is estimated at US$1,954.3 million in 2024 and is projected to grow at a CAGR of 7% during the forecast period 2024-2034.
17 April 2024
Visiongain Publishes Anti-obesity Drugs Market Report 2024-2034
The global Anti-obesity Drugs market is estimated at US$11,540.2 million in 2024 and is expected to register a CAGR of 21.2% from 2024 to 2034.
12 April 2024
Visiongain Publishes Inflammatory Bowel Diseases (IBD) Drugs Market Report 2024-2034
The global Inflammatory Bowel Diseases (IBD) Drugs market was valued at US$27.53 billion in 2023 and is projected to grow at a CAGR of 6.2% during the forecast period 2024-2034.
11 April 2024


