Are you looking for a definitive report on the $970m counter-UAV sector?
You will receive a highly granular market analysis segmented by region, by subsector and by national market, providing you with that complete industry outlook, essential for your business strategy.
Key benefits
• Discover where the counter-UAV business opportunities are
• 304 tables, charts, and graphs reveal market data allowing you to target your strategy more effectively
• Understand how the counter-UAV market will develop
• Global, regional and national counter-UAV market forecasts and analysis from 2018-2028 illustrate the market progression
• Learn how the counter-UAV market will evolve
• Porter’s Five Forces analysis offers analysis of this market
• See which counter-UAV by Type submarkets will expand from 2018-2028: Individual forecasts demonstrate the prospects
• Detection forecast 2018-2028
• Countermeasure forecast 2018-2028
• Find which counter-UAV by Technology submarkets will thrive from 2018-2028: Separate technology projections explore the potential
• Electronic forecast 2018-2028
• Kinetic forecast 2018-2028
• Find which counter-UAV by Platform submarkets will thrive from 2018-2028: Separate technology projections explore the potential
• Defence forecast 2018-2028
• Commercial forecast 2018-2028
• Locate the regional counter-UAV market opportunities from 2018-2028: Focused regional forecasts explore the future opportunities
• North America forecast 2018-2028:
• US forecast 2018-2028
• Canada forecast 2018-2028
• Europe forecast 2018-2028:
• Germany forecast 2018-2028
• France forecast 2018-2028
• UK forecast 2018-2028
• Italy forecast 2018-2028
• Rest of Europe forecast 2018-2028
• Asia Pacific forecast 2018-2028:
• Japan forecast 2018-2028
• China forecast 2018-2028
• India forecast 2018-2028
• Rest of Asia Pacific forecast 2018-2028
• Rest of World forecast 2018-2028
• Evaluate the factors influencing counter-UAV market dynamics
• Drivers and restraints analysis of the market
• Porter’s Five Forces analysis
• Compare the forecast growth rates of the commercial and defence sectors of this market
• Compare the forecast growth rates of the different submarkets to reveal which technology types will lead the market
• Discover who the leading 13 counter-UAV companies are
• Examine competitive positioning, capabilities, product portfolios, R&D activity, services, focus, strategies, M&A activity, and future outlook.
• Boeing Company
• Airbus Group SE
• Saab AB
• Thales Group
• Lockheed Martin Corporation
• Israel Aerospace Industries Ltd.
• Blighter Surveillance Systems Ltd.
• DroneShield, LLC
• Raytheon Company
• Northrop Grumman Corporation
• Rafael Advanced Defense Systems Ltd
• Rheinmetall AG
• Hensoldt GmbH
This market will see confident forecast growth rates and represents a new area of developing technology.
Visiongain is a trading partner with the US Federal Government
CCR Ref number: KD4R6
1. Report Overview
1.1 Global Counter-UAV Market Overview
1.2 Why You Should Read This Report
1.3 How This Report Delivers
1.4 Key Questions Answered by this Analytical Report
1.5 Who is This Report For?
1.6 Methodology
1.6.1 Secondary Research
1.6.2 Market Evaluation & Forecasting Methodology
1.7 Frequently Asked Questions (FAQ)
1.8 Associated Visiongain Reports
1.9 About Visiongain
2. Introduction to the Counter-UAV Market
2.1 Counter-UAV Market Structure
2.2 Counter-UAV market Definition
2.3 Counter-UAV, by Type Submarkets Definitions
2.3.1 Detection
2.3.2 Countermeasure
2.4 Counter-UAV by Technology Submarkets Definitions
2.4.1 Electronic
2.4.2 Kinetic
2.5 Counter-UAV, by Platform Submarkets Definitions
2.5.1 Defence
2.5.2 Commercial
3. Counter-UAV market 2018-2028
3.1 Counter-UAV Market Forecast 2018-2028
3.2 Counter-UAV Market Drivers & Restraints
3.2.1 Counter-UAV market Drivers 2018
3.2.1.1 Rising Need for UAV Detection Solutions Due to Security Concerns
3.2.2 Counter-UAV Market Restraints 2018
3.2.2.1 High Initial Cost of Research and Development
3.2.2.2 Public Safety Concerns
3.2.2.3 Difficulty of Mitigating UAV-Based Threats
4. Counter-UAV submarket Forecasts 2018-2028
4.1 Counter-UAV market by Type Forecast 2018-2028
4.1.1 Detection Submarket Forecast by Region 2018-2028
4.1.2 Countermeasure Submarket Forecast by Region 2018-2028
4.2 Counter-UAV market by Technology Forecast 2018-2028
4.2.1 Electronic Forecast by Region 2018-2028
4.2.2 Kinetic Forecast by Region 2018-2028
4.3 Counter-UAV Market by Platform Forecast 2018-2028
4.3.1 Defence Forecast by Region 2018-2028
4.3.2 Commercial Forecast by Region 2018-2028
5. Leading Regional and National Counter-UAV Markets Forecast 2018-2028
5.1 Overview of Regional Counter-UAV Market Forecast 2018-2028
5.2 North America Counter-UAV Market Forecast 2018-2028
5.2.1 North America Counter-UAV Market by Type Forecast 2018-2028
5.2.2 North America Counter-UAV Market by Technology Forecast 2018-2028
5.2.3 North America Counter-UAV Market by Platform Forecast 2018-2028
5.2.4 North America Counter-UAV Market by Country Forecast 2018-2028
5.2.5.1 US Counter-UAV Market Forecast 2018-2028
5.2.5.1.1 US Counter-UAV Market by Type Forecast 2018-2028
5.2.5.2 Canada Counter-UAV Market Forecast 2018-2028
5.2.5.2.1 Canada Counter-UAV Market by Type Forecast 2018-2028
5.3 Europe Counter-UAV Market Forecast 2018-2028
5.3.1 Europe Counter-UAV Market by Type Forecast 2018-2028
5.3.2 Europe Counter-UAV Market by Technology Forecast 2018-2028
5.3.3 Europe Counter-UAV Market by Platform Forecast 2018-2028
5.3.4 Europe Counter-UAV Market by Country Forecast 2018-2028
5.3.5.1 Germany Counter-UAV Market Forecast 2018-2028
5.3.5.1.1 Germany Counter-UAV Market by Type Forecast 2018-2028
5.3.5.2 France Counter-UAV Market Forecast 2018-2028
5.3.5.2.1 France Counter-UAV Market by Type Forecast 2018-2028
5.3.5.3 UK Counter-UAV Market Forecast 2018-2028
5.3.5.3.1 UK Counter-UAV Market by Type Forecast 2018-2028
5.3.5.4 Italy Counter-UAV Market Forecast 2018-2028
5.3.5.4.1 Italy Counter-UAV Market by Type Forecast 2018-2028
5.3.5.5 RoE Counter-UAV Market Forecast 2018-2028
5.3.5.5.1 RoE Counter-UAV Market by Type Forecast 2018-2028
5.4 Asia-Pacific Counter-UAV Market Forecast 2018-2028
5.4.1 Asia-Pacific Counter-UAV Market by Type Forecast 2018-2028
5.4.2 Asia-Pacific Counter-UAV Market by Technology Forecast 2018-2028
5.4.3 Asia-Pacific Counter-UAV Market by Platform Forecast 2018-2028
5.4.4 Asia-Pacific Counter-UAV Market byCountry Forecast 2018-2028
5.4.5.1 Japan Counter-UAV Market Forecast 2018-2028
5.4.5.1.1 Japan Counter-UAV Market by Type Forecast 2018-2028
5.4.5.2 China Counter-UAV Market Forecast 2018-2028
5.4.5.2.1 China Counter-UAV Market by Type Forecast 2018-2028
5.4.5.3 India Counter-UAV Market Forecast 2018-2028
5.4.5.3.1 India Counter-UAV Market by Type Forecast 2018-2028
5.4.5.4 RoAPAC Counter-UAV Market Forecast 2018-2028
5.4.5.4.1 RoAPAC Counter-UAV Market by Type Forecast 2018-2028
5.5 RoW Counter-UAV Market Forecast 2018-2028
5.5.1 RoW Counter-UAV Market by Type Forecast 2018-2028
5.5.2 RoWCounter-UAV Market by Technology Forecast 2018-2028
5.5.3 RoW Counter-UAV Market by Platform Forecast 2018-2028
6. Porter’s Five Forces Analysis of the Counter-UAV Market 2018-2028
6.1 Introduction
6.2 Porter’s Five Forces Analysis of Counter-UAV Market
6.2.1 Threat of New Entrants
6.2.2 Threat of Substitutes
6.2.3 Bargaining Power of Buyers
6.2.4 Bargaining Power of Suppliers
6.2.5 Degree of Competition
7. Leading Counter-UAV Companies
7.1 Leading Counter-UAV Companies 2018
7.2 Boeing Company
7.2.1 Introduction
7.2.2Boeing Company Total Company Sales 2013-2017
7.2.3 Boeing Company Sales by Segment of Business 2013-2017
7.2.4 Boeing Company Net Income / Loss 2013-2017
7.2.5 Boeing Company Sales by Regional Segment of Business 2013-2017
7.2.6 Boeing Company Selected Recent Expansion, Contract, Strategy, Product Launch, and Investment 2018
7.2.7 Boeing Company Product Offering
7.2.8 Boeing Company Analysis
7.2.8.1 SWOT Analysis
7.2.8.2 Boeing Company Future Outlook
7.3 Airbus Group SE
7.3.1 Introduction
7.3.2Airbus Group SE Total Company Sales 2013-2017
7.3.3 Airbus Group SE Sales by Segment of Business 2013-2017
7.3.4 Airbus Group SE Net Income / Loss 2013-2017
7.3.5 Airbus Group SE Sales by Regional Segment of Business 2013-2017
7.3.6 Airbus Group SE Selected Recent Partnership, Product Launches, and Agreement, 2016-2018
7.3.7Airbus Group SE Product Offering
7.3.8 Airbus Group SE Analysis
7.3.8.1 SWOT Analysis
7.3.8.2 Airbus Group SE Future Outlook
7.4 Saab AB
7.4.1 Introduction
7.4.2 Saab AB Total Company Sales 2013-2017
7.4.3 Saab AB Sales by Segment of Business 2013-2017
7.4.4 Saab AB Net Income / Loss 2013-2017
7.4.5 Saab AB Sales by Regional Segment of Business 2013-2017
7.4.6Saab AB Selected Recent Contracts, 2018
7.4.7 Saab AB Product Offering
7.4.8 Saab AB Analysis
7.4.8.1 SWOT Analysis
7.4.8.2 Saab AB Future Outlook
7.5 Thales Group
7.5.1 Introduction
7.5.2 Thales Group Total Company Sales 2013-2017
7.5.3 Thales Group Sales by Segment of Business 2013-2017
7.5.4 Thales Group Net Income / Loss 2013-2017
7.5.5 Thales Group Sales by Regional Segment of Business 2013-2017
7.5.6 Thales Group Selected Recent Product Launch, Agreement, and Contracts 2017
7.5.7 Thales Group Product Offering
7.5.8 Thales Group Analysis
7.5.8.1 SWOT Analysis
7.5.8.2 Thales Group Future Outlook
7.6 Lockheed Martin Corporation
7.6.1 Introduction
7.6.2 Lockheed Martin Corporation Total Company Sales 2013-2017
7.6.3 Lockheed Martin Corporation Sales by Segment of Business 2013-2017
7.6.4 Lockheed Martin Corporation Net Income / Loss 2013-2017
7.6.5 Lockheed Martin Corporation Sales by Regional Segment of Business 2013-2017
7.6.6 Lockheed Martin Corporation Selected Recent Contracts, 2018
7.6.7 Lockheed Martin Product Offering
7.6.8 Lockheed Martin Corporation Analysis
7.6.8.1 SWOT Analysis
7.6.8.2 Lockheed Martin Corporation Future Outlook
7.7 Israel Aerospace Industries Ltd.
7.7.1 Introduction
7.7.4 Israel Aerospace Industries Ltd. Selected Product Launches 2014-2015
7.7.5 Israel Aerospace Industries Ltd. Product Offering
7.8 Blighter Surveillance Systems
7.8.1 Introduction
7.8.2 Blighter Surveillance Systems Selected Recent Product Enhancement, Contract, and Partnership, 2015-2017
7.8.3 Blighter Surveillance Systems Product Offering
7.9 DroneShield, LLC
7.9.1 Introduction
7.9.2 DroneShield Selected Recent Product Launch2016
7.9.3 DroneShield Product Offering
7.10 Raytheon Company
7.10.1 Introduction, Company History, and Presence
7.10.2 The Raytheon Company Total Company Sales 2013-2017
7.10.3 The Raytheon Company Sales by Segment of Business 2013-2017
7.10.4 The Raytheon Company Net Income / Loss 2013-2017
7.10.5 The Raytheon Company Sales by Regional Segment of Business 2013-2017
7.10.6 Raytheon Company Selected Recent Agreement, Contract, and Product Launch, 2016-2018
7.10.7 Raytheon Company Product Offering
7.11 Northrop Grumman Corporation
7.11.1 Introduction
7.11.2 Northrop Grumman Corporation Total Company Sales 2012-2016
7.11.3 Northrop Grumman Corporation Sales by Segment of Business 2014-2017
7.11.4 Northrop Grumman Corporation Net Income / Loss 2013-2017
7.11.5 Northrop Grumman Corporation Sales by Regional Segment of Business 2013-2017
7.11.6 Northrop Grumman Corporation Selected Recent Collaboration, Contract, and MoU, 2017
7.11.7 Northrop Grumman Corporation Product Offering
7.12 Rafael Advanced Defense Systems Ltd
7.12.1 Introduction
7.12.2 Rafael Advanced Defense Systems Ltd Total Company Sales 2011-2016
7.12.3 Rafael Advanced Defense Systems Ltd Net Income / Loss 2011-2016
7.12.4 Rafael Advanced Defense Systems Ltd Selected Recent Product Launches, 2017
7.12.5 Rafael Advanced Defense Systems Ltd Product Offering
7.13 Rheinmetall AG
7.13.1 Introduction and Structure of Rheinmetall AG
7.13.2 Rheinmetall AG Total Company Sales 2013-2017
7.13.3 Rheinmetall AG Sales by Segment of Business 2013-2017
7.13.4 Rheinmetall AG Net Income / Loss 2013-2017
7.13.5 Rheinmetall AG Selected Recent Contracts 2017-2018
7.13.6 Rheinmetall AG Product Offering
7.14 Hensoldt GmbH
7.14.1 Introduction
7.14.2 Hensoldt GmbH performance in first year of operations
7.14.3 Hensoldt GmbH Counter-UAV Products
7.14.4 Hensoldt GmbH Global Footprint and Current Presence 2018
7.15 Other Companies Involved in the Counter UAV (C-UAV) Market 2018
8. Conclusions and Recommendations
9. Glossary
Associated Visiongain Reports
Visiongain Report Sales Order Form
Appendix A
About Visiongain
Appendix B
Visiongain report evaluation form
List of Tables
Table 3.1 Counter-UAV market Forecast 2018-2028 (US$m, AGR %, CAGR %, Cumulative)
Table 3.2 Counter-UAV Market Drivers & Restraints 2018
Table 4.1 Counter-UAV market by Type Submarket Forecast 2018-2028 (US$m, AGR %, Cumulative)
Table 4.2 Detection Submarket by Regional Market Forecast 2018-2028 (US$m, AGR %, CAGR %, Cumulative)
Table 4.3 Countermeasure Submarket by Regional Market Forecast 2018-2028 (US$m, AGR %, CAGR %, Cumulative)
Table 4.4 Counter-UAV Market by Technology Submarket Forecast 2018-2028 (US$m, AGR %, Cumulative)
Table 4.5 Electronic Submarket by Regional Market Forecast 2018-2028 (US$m, AGR %, CAGR %, Cumulative)
Table 4.6 Kinetic Submarket by Regional Market Forecast 2018-2028 (US$m, AGR %, CAGR %, Cumulative)
Table 4.7 Counter-UAV market by Platform Submarket Forecast 2018-2028 (US$m, AGR %, Cumulative)
Table 4.8 Defence Submarket by Regional Market Forecast 2018-2028 (US$m, AGR %, CAGR %, Cumulative)
Table 4.9 Commercial Submarket by Regional Market Forecast 2018-2028 (US$m, AGR %, CAGR %, Cumulative)
Table 5.1 Leading Regional Counter-UAV Markets Forecast 2018-2028 (US$m, AGR %, Cumulative)
Table 5.2 North America Counter-UAV Market by Type Forecast 2018-2028 (US$m, CAGR %)
Table 5.3 North America Counter-UAV Market Forecast by Technology 2018-2028 (US$m, CAGR %)
Table 5.4 North America Counter-UAV Market Forecast by Platform 2018-2028 (US$m, CAGR %)
Table 5.5 North America Counter-UAV Market Forecast by Country 2018-2028 (US$m, AGR %, Cumulative)
Table 5.6 US Counter-UAV Market Forecast2018-2028 (US$m, AGR %, CAGR %, Cumulative)
Table 5.7 US Counter-UAV Market Forecast by Type2018-2028 (US$m, CAGR %)
Table 5.8 Canada Counter-UAV Market Forecast 2018-2028 (US$m, AGR %, CAGR %, Cumulative)
Table 5.9 Canada Counter-UAV Market Forecast by Type2018-2028 (US$m, CAGR %)
Table 5.10 Europe Counter-UAV Market Forecast by Type 2018-2028 (US$m, CAGR %)
Table 5.11 Europe Counter-UAV Market Forecast by Technology 2018-2028 (US$m, CAGR %)
Table 5.12 Europe Counter-UAV Market Forecast by Platform 2018-2028 (US$m, CAGR %)
Table 5.13 Europe Counter-UAV Market Forecast by Country 2018-2028 (US$m, AGR %, Cumulative)
Table 5.14 Germany Counter-UAV Market Forecast 2018-2028 (US$m, AGR %, CAGR %, Cumulative)
Table 5.15 Germany Counter-UAV Market Forecast by Type2018-2028 (US$m, CAGR %)
Table 5.16 France Counter-UAV Market Forecast 2018-2028(US$m, AGR %, CAGR %, Cumulative)
Table 5.17 France Counter-UAV Market Forecast by Type 2018-2028 (US$m, CAGR %)
Table 5.18 UK Counter-UAV Market Forecast 2018-2028 (US$m, AGR %, CAGR %, Cumulative)
Table 5.19 UK Counter-UAV Market Forecast by Type2018-2028 (US$m, CAGR %)
Table 5.20 Italy Counter-UAV Market Forecast 2018-2028 (US$m, AGR %, CAGR %, Cumulative)
Table 5.21 Italy Counter-UAV Market Forecast by Type2018-2028 (US$m, CAGR %)
Table 5.22 RoE Counter-UAV Market Forecast 2018-2028(US$m, AGR %, CAGR %, Cumulative)
Table 5.23 RoE Counter-UAV Market Forecast by Type2018-2028 (US$m, CAGR %)
Table 5.24 Asia-Pacific Counter-UAV Market Forecast by Type 2018-2028 (US$m)
Table 5.25 Asia-Pacific Counter-UAV Market Forecast by Technology 2018-2028 (US$m)
Table 5.26 Asia-Pacific Counter-UAV Market Forecast by Platform 2018-2028 (US$m)
Table 5.27 Asia-Pacific Counter-UAV Market Forecast by Country 2018-2028 (US$m, AGR %, Cumulative)
Table 5.28 Japan Counter-UAV Market Forecast 2018-2028 (US$m, AGR %, CAGR %, Cumulative)
Table 5.29 Japan Counter-UAV Market Forecast by Type 2018-2028 (US$m, CAGR %)
Table 5.30China Counter-UAV Market Forecast 2018-2028 (US$m, AGR %, CAGR %, Cumulative)
Table 5.31 China Counter-UAV Market Forecast by Type2018-2028 (US$m, CAGR %)
Table 5.32 India Counter-UAV Market Forecast 2018-2028 (US$m, AGR %, CAGR %, Cumulative)
Table 5.33 India Counter-UAV Market Forecast by Type 2018-2028 (US$m, CAGR %)
Table 5.34 RoAPAC Counter-UAV Market Forecast 2018-2028(US$m, AGR %, CAGR %, Cumulative)
Table 5.35 RoAPAC Counter-UAV Market Forecast by Type2018-2028 (US$m, CAGR %)
Table 5.36 RoW Counter-UAV Market Forecast 2018-2028(US$m, AGR %, CAGR %, Cumulative)
Table 5.37 RoW Counter-UAV Market Forecast by Type 2018-2028 (US$m, CAGR %)
Table 5.38 RoW Counter-UAV Market Forecast by Technology 2018-2028 (US$m, CAGR %)
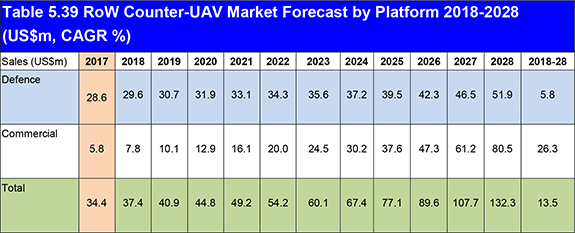
Table 5.39 RoW Counter-UAV Market Forecast by Platform 2018-2028 (US$m, CAGR %)
Table 7.1 Leading 13 Counter-UAV Companies(Company, Latest Total Company Sales US$m*, HQ)
Table 7.2 Boeing Company Profile 2017 (CEO, Total Company Sales US$m, Net Income US$m, HQ, Founded, No. of Employees, Ticker, Website)
Table 7.3 Boeing Company Total Company Sales 2013-2017 (US$m, AGR %)
Table 7.4 Boeing Company Sales by Segment of Business 2013-2017 (US$m, AGR %)
Table 7.5 Boeing Company Net Income / Loss 2013-2017 (US$m)
Table 7.6 Boeing Company Sales by Regional Segment of Business 2012-2017 (US$m, AGR %)
Table 7.7 Selected Recent Boeing Company Expansion, Product Launch, and Collaboration 2018 (Date, Type, Details)
Table 7.8 Boeing Company Product Offering (Category, Product)
Table 7.9 Boeing Company SWOT Analysis
Table 7.10 Airbus Group SE Profile 2017 (CEO, Total Company Sales US$m, Net Income US$m, HQ, Founded, No. of Employees, Ticker, Website)
Table 7.11 Airbus Group SE Total Company Sales 2012-2017 (US$m, AGR %)
Table 7.12 Airbus Group SE Sales by Segment of Business 2013-2017 (US$m, AGR %)
Table 7.13 Airbus Group SE Net Income / Loss 2012-2017 (US$m)
Table 7.14 Airbus Group SE Sales by Regional Segment of Business 2013-2017 (US$m, AGR %)
Table 7.15 Selected Recent Airbus Group SE Partnership, Product Launches, and Agreement, 2016-2017 (Date, Type, Details)
Table 7.16 Airbus Group SE Product Offering (Category, Product)
Table 7.17 Airbus Group SE SWOT Analysis
Table 7.18 SAAB AB Profile 2017 (CEO, Total Company Sales US$m, Net Income US$m, HQ, Founded, No. of Employees, Ticker, Website)
Table 7.19 Saab AB Total Company Sales 2013-2017 (US$m, AGR %)
Table 7.20 Saab AB Sales by Segment of Business 2013-2017 (US$m, AGR %)
Table 7.21Saab AB Net Income / Loss 2013-2017 (US$m)
Table 7.22 Saab AB Sales by Regional Segment of Business 2013-17 (US$m, AGR %)
Table 7.23 Selected Recent Saab AB Product Launch, Agreement, and Acquisition2013-2016 (Date, Type, Details)
Table 7.24 SAAB AB Product Offering (Category, Product)
Table 7.25 Saab AB SWOT Analysis
Table 7.26 Thales Group Profile 2017 (CEO, Total Company Sales US$m, Net Income US$m, HQ, Founded, No. of Employees, Ticker, Website)
Table 7.27 Thales Group Total Company Sales 2013-2017 (US$m, AGR %)
Table 7.28 Thales Group Sales by Segment of Business 2013-2017 (US$m, AGR %)
Table 7.29 Thales Group Net Income / Loss 2013-2017 (US$m)
Table 7.30 Thales Group Sales by Regional Segment of Business 2013-2017 (US$m, AGR %)
Table 7.31 Selected Recent Thales Group Product Launch, Agreement, and Contracts 2017 (Date, Type, Details)
Table 7.32 Thales Group Product Offering(Category, Product)
Table 7.33 Thales Group SWOT Analysis
Table 7.34Lockheed Martin Corporation Profile 2018 (CEO, Total Company Sales US$m, Net Income US$m, HQ, Founded, No. of Employees, Ticker, Website)
Table 7.35 Lockheed Martin Corporation Total Company Sales 2013-2017 (US$m, AGR %)
Table 7.36 Lockheed Martin Corporation Sales by Segment of Business 2013-2017 (US$m, AGR %)
Table 7.37 Lockheed Martin Corporation Net Income / Loss 2013-2017 (US$m)
Table 7.38 Lockheed Martin Corporation Sales by Regional Segment of Business 2013-2017 (US$m, AGR %)
Table 7.39 Selected Recent Lockheed Martin Corporation Contracts, 2018 (Date, Type, Details)
Table 7.40 Lockheed Martin Product Offering (Category, Product)
Table 7.41 Lockheed Martin Corporation SWOT Analysis
Table 7.42 Israel Aerospace Industries Ltd. Profile 2018 (CEO, Total Company Sales US$m, Net Income US$m, HQ, Founded, No. of Employees, Ticker, Website)
Table 7.43 Selected Recent Israel Aerospace Industries Ltd. Product Launches 2014-2015 (Date, Type, Details)
Table 7.44 Israel Aerospace Industries Ltd. Product Offering (Category, Products)
Table 7.45 Blighter Surveillance Systems (CEO, HQ, Founded, Website)
Table 7.46 Selected Recent Blighter Surveillance Systems Product Enhancement, Contract, and Partnership, 2015-2017 (Date, Type, Details)
Table 7.47 Blighter Surveillance Systems Product Offering (Category, Products)
Table 7.48 DroneShield, LLC(CEO, HQ, Founded, Website)
Table 7.49 Selected Recent DroneShield Product Launches and lines 2016-2018 (Date, Type, Details)
Table 7.50 DroneShield Product Offering (Category, Products)
Table 7.51 Raytheon Company Profile 2018 (CEO, Total Company Sales US$m, Net Income US$m, HQ, Founded, No. of Employees, Ticker, Website)
Table 7.52 The Raytheon Company Total Company Sales 2013-2017 (US$m, AGR %)
Table 7.53 The Raytheon Company Sales by Segment of Business 2013-2017 (US$m, AGR %)
Table 7.54 The Raytheon Company Net Income / Loss 2013-2017 (US$m)
Table 7.55 The Raytheon Company Sales by Regional Segment of Business 2013-2017 (US$m, AGR %)
Table 7.56 Selected Recent Raytheon Company Agreement, Contract, and Product Launch, 2016-2018 (Date, Type, Details)
Table 7.57 Raytheon Company Product Offering (Category, Products)
Table 7.58 Northrop Grumman Corporation Profile 2018 (CEO, Total Company Sales US$m, Net Income US$m, HQ, Founded, No. of Employees, Ticker, Website)
Table 7.59 Northrop Grumman Corporation Total Company Sales 2013-2017 (US$m, AGR %)
Table 7.60 Northrop Grumman Corporation by Segment of Business 2014-2017 (US$m, AGR %)
Table 7.61 Northrop Grumman Corporation Net Income / Loss 2013-2017 (US$m)
Table 7.62 Northrop Grumman Corporation Sales by Regional Segment of Business 2013-2017 (US$m, AGR %)
Table 7.63 Selected Recent Northrop Grumman Corporation Collaboration, Contract, and MoU, 2017 (Date, Type, Details)
Table 7.64 Northrop Grumman Corporation Product Offering (Category, Product)
Table 7.65 Rafael Advanced Defense Systems Ltd Profile 2016 (CEO, Total Company Sales US$m, Net Income US$m, HQ, Founded, No. of Employees, Ticker, Website)
Table 7.66 Rafael Advanced Defense Systems Ltd. Total Company Sales 2011-2016 (US$m, AGR %)
Table 7.67 Rafael Advanced Defense Systems Ltd. Net Income 2011-2016 (US$m, AGR %)
Table 7.68 Selected Recent Rafael Advanced Defense Systems Ltd Product Launches, 2017 (Date, Type, Details)
Table 7.69 Rafael Advanced Defense Systems Ltd Product Offering (Category, Product)
Table 7.70 Rheinmetall AG Profile 2017 (CEO, Total Company Sales US$m, Net Income US$m, HQ, Founded, No. of Employees, Ticker, Website)
Table 7.71 Rheinmetall AG Total Company Sales 2013-2017 (US$m, AGR %)
Table 7.72 Rheinmetall AG by Segment of Business 2013-2017 (US$m, AGR %)
Table 7.73 Rheinmetall AG Net Income / Loss 2013-2017 (US$m)
Table 7.74 Selected Recent Rheinmetall AG Contract 2017-2018 (Date, Type, Details)
Table 7.75 Rheinmetall AG Product Offering (Category, Product)
Table 7.76 Hensoldt global footprint and subsidiary locations 2018
Table 7.77 Other Companies Involved in the Counter UAV (C-UAV)Market 2018 (Company, Location)
List of Figures
Figure 2.1 Global Counter-UAV Market Segmentation Overview
Figure 4.1 Counter-UAV Market by Type Submarket AGR Forecast 2018-2028 (AGR %)
Figure 4.2 Counter-UAV Market by Type Submarket Forecast 2018-2028 (US$m, Global AGR %)
Figure 4.3 Counter-UAV Market by Type Submarket Market Share 2018 (% Share)
Figure 4.4 Counter-UAV Market by Type Submarket Market Share 2023 (% Share)
Figure 4.5 Counter-UAV Market by Type Submarket Market Shares2028 (% Share)
Figure 4.6 Detection Submarket Forecast by Regional Market 2018-2028 (US$m)
Figure 4.7 Detection Submarket Market Share by Region2018 (% Share)
Figure 4.8 Detection Submarket Market Share by Region 2023 (% Share)
Figure 4.9 Detection Submarket Market Share by Region 2028 (% Share)
Figure 4.10 Countermeasure Submarket Forecast by Regional Market 2018-2028 (US$m)
Figure 4.11 Countermeasure Submarket Market Share by Region 2018 (% Share)
Figure 4.12 Countermeasure Submarket Market Share by Region 2023 (% Share)
Figure 4.13 Countermeasure Submarket Market Share by Region 2028 (% Share)
Figure 4.14 Counter-UAV Market by Technology Submarket AGR Forecast 2018-2028 (AGR %)
Figure 4.15 Counter-UAV Market by Technology Submarket Forecast 2018-2028 (US$m, Global AGR %)
Figure 4.16 Counter-UAV Market by Technology Submarket Market Shares 2018 (% Share)
Figure 4.17Counter-UAV Market by Technology Submarket Market Shares 2023 (% Share)
Figure 4.18 Counter-UAV Market by Technology Submarket Market Shares 2028 (% Share)
Figure 4.19 Electronic Submarket Forecast by Regional Market 2018-2028 (US$m)
Figure 4.20 Electronic Submarket Market Share by Region 2018 (% Share)
Figure 4.21Electronic Submarket Market Share by Region 2023 (% Share)
Figure 4.22Electronic Submarket Market Share by Region 2028 (% Share)
Figure 4.23 Kinetic Submarket Forecast by Regional Market 2018-2028 (US$m)
Figure 4.24 Kinetic Submarket Market Share by Region 2018 (% Share)
Figure 4.25 Kinetic Submarket Market Share by Region 2023 (% Share)
Figure 4.26 Kinetic Submarket Market Share by Region 2028 (% Share)
Figure 4.27 Counter-UAV Market by Platform Submarket AGR Forecast 2018-2028 (AGR %)
Figure 4.28 Counter-UAV Market by Platform Submarket Forecast 2018-2028 (US$m, AGR %)
Figure 4.29 Counter-UAV Market by Platform Submarket Market Shares 2018 (% Share)
Figure 4.30 Counter-UAV Market by Platform Submarket Market Shares 2023 (% Share)
Figure 4.31 Counter-UAV Market by Platform Submarket Market Shares 2028 (% Share)
Figure 4.32 Defence Submarket Forecast by Regional Market 2018-2028 (US$m)
Figure 4.33 Defence Submarket Market Share by Region2018 (% Share)
Figure 4.34Defence Submarket Market Share by Region 2023 (% Share)
Figure 4.35Defence Submarket Market Share by Region 2028 (% Share)
Figure 4.36 Commercial Submarket Forecast by Regional Market 2018-2028 (US$m)
Figure 4.37 Commercial Submarket Market Share by Region 2018 (% Share)
Figure 4.38 Commercial Submarket Market Share by Region 2023 (% Share)
Figure 4.39 Commercial Submarket Market Share by Region 2028 (% Share)
Figure 5.1 Leading Regional Counter-UAV Markets AGR Forecast 2018-2028 (AGR %)
Figure 5.2 Leading Regional Counter-UAV Markets Forecast2018-2028(Sales US$m, Global AGR %)
Figure 5.3 Leading Regional Counter-UAV Market Shares by Region 2018 (% Share)
Figure 5.4 Leading Regional Counter-UAV Market Shares by Region 2023 (% Share)
Figure 5.5 Leading Regional Counter-UAV Market Shares by Region 2028 (% Share)
Figure 5.6 North America Counter-UAV Market by Type Forecast 2018-2028 (US$m)
Figure 5.7 North America Counter-UAV Market Forecast by Technology 2018-2028 (US$m)
Figure 5.8 North America Counter-UAV Market Forecast by Platform 2018-2028 (US$m)
Figure 5.9 North America Counter-UAV Market Forecast by Country2018-2028 (US$m, AGR %)
Figure 5.10 North America Counter-UAV Market Forecast Market Share by Country2018 (% Share)
Figure 5.11 North America Counter-UAV Market Forecast Market Share by Country 2023 (% Share)
Figure 5.12 North America Counter-UAV Market Forecast Market Share by Country 2028 (% Share)
Figure 5.13 US Counter-UAV Market Forecast 2018-2028 (US$m, AGR %)
Figure 5.14 US Counter-UAV Market Forecast Regional Market Share by Country2018 (% Share)
Figure 5.15 US Counter-UAV Market Forecast Regional Market Share by Country2023 (% Share)
Figure 5.16 US Counter-UAV Market Forecast Regional Market Share by Country2028 (% Share)
Figure 5.17 US Counter-UAV Market Forecast by Type 2018-2028 (US$m)
Figure 5.18 Canada Counter-UAV Market Forecast 2018-2028 (US$m, AGR %)
Figure 5.19 Canada Counter-UAV Market Forecast Regional Market Share by Country 2018 (% Share)
Figure 5.20 Canada Counter-UAV Market Forecast Regional Market Share by Country 2023 (% Share)
Figure 5.21 Canada Counter-UAV Market Forecast Regional Market Share by Country 2028 (% Share)
Figure 5.22 Canada Counter-UAV Market Forecast by Type 2018-2028 (US$m)
Figure 5.23 Europe Counter-UAV Market Forecast by Type 2018-2028 (US$m)
Figure 5.24 Europe Counter-UAV Market Forecast by Technology2018-2028 (US$m)
Figure 5.25 Europe Counter-UAV Market Forecast by Platform 2018-2028 (US$m)
Figure 5.26 Europe Counter-UAV Market Forecast by Country 2018-2028 (US$m, Global AGR %)
Figure 5.27 Europe Counter-UAV Market Forecast Market Share by Country 2018 (% Share)
Figure 5.28 Europe Counter-UAV Market Forecast Market Share by Country 2023 (% Share)
Figure 5.29 Europe Counter-UAV Market Forecast Market Share by Country 2028 (% Share)
Figure 5.30 Germany Counter-UAV Market Forecast 2018-2028 (US$m, AGR %)
Figure 5.31 Germany Counter-UAV Market Forecast Regional Market Share by Country 2018 (% Share)
Figure 5.32 Germany Counter-UAV Market Forecast Regional Market Share by Country 2023 (% Share)
Figure 5.33 Germany Counter-UAV Market Forecast Regional Market Share by Country 2028 (% Share)
Figure 5.34 Germany Counter-UAV Market Forecast by Type 2018-2028 (US$m)
Figure 5.35 France Counter-UAV Market Forecast 2018-2028 (US$m, AGR %)
Figure 5.36 France Counter-UAV Market Forecast Regional Market Share by Country 2018 (% Share)
Figure 5.37 France Counter-UAV Market Forecast Regional Market Share by Country 2023 (% Share)
Figure 5.38 France Counter-UAV Market Forecast Regional Market Share by Country 2028 (% Share)
Figure 5.39 France Counter-UAV Market Forecast by Type 2018-2028 (US$m)
Figure 5.40 UK Counter-UAV Market Forecast 2018-2028 (US$m, AGR %)
Figure 5.41UK Counter-UAV Market Forecast Regional Market Share by Country 2017 (% Share)
Figure 5.42 UK Counter-UAV Market Forecast Regional Market Share by Country 2023 (% Share)
Figure 5.43UK Counter-UAV Market Forecast Regional Market Share by Country 2028 (% Share)
Figure 5.44 UK Counter-UAV Market Forecast by Type 2018-2028 (US$m)
Figure 5.45 Italy Counter-UAV Market Forecast 2018-2028 (US$m, AGR %)
Figure 5.46 Italy Counter-UAV Market Forecast Regional Market Share by Country 2018 (% Share)
Figure 5.47 Italy Counter-UAV Market Forecast Regional Market Share by Country 2023 (% Share)
Figure 5.48 Italy Counter-UAV Market Forecast Regional Market Share by Country 2028 (% Share)
Figure 5.49 Italy Counter-UAV Market Forecast by Type 2018-2028 (US$m)
Figure 5.50 RoE Counter-UAV Market Forecast 2018-2028 (US$m, AGR %)
Figure 5.51 RoE Counter-UAV Market Forecast Regional Market Share by Country 2018 (% Share)
Figure 5.52 RoE Counter-UAV Market Forecast Regional Market Share by Country 2023 (% Share)
Figure 5.53 RoE Counter-UAV Market Forecast Regional Market Share by Country 2028 (% Share)
Figure 5.54 RoE Counter-UAV Market Forecast by Type 2018-2028 (US$m)
Figure 5.55 Asia-Pacific Counter-UAV Market Forecast by Type 2018-2028 (US$m)
Figure 5.56 Asia-Pacific Counter-UAV Market Forecast by Technology 2018-2028 (US$m)
Figure 5.57 Asia-Pacific Counter-UAV Market Forecast by Platform 2018-2028 (US$m)
Figure 5.58 Asia-Pacific Counter-UAV Market Forecast by Country 2018-2028 (US$m, Global AGR %)
Figure 5.59 Asia-Pacific Counter-UAV Market Forecast Market Share by Country 2018 (% Share)
Figure 5.60 Asia-Pacific Counter-UAV Market Forecast Market Share by Country 2023 (% Share)
Figure 5.61Asia-Pacific Counter-UAV Market Forecast Market Share by Country 2028 (% Share)
Figure 5.62 Japan Counter-UAV Market Forecast 2018-2028 (US$m, AGR %)
Figure 5.63 Japan Counter-UAV Market Forecast Regional Market Share by Country 2018 (% Share)
Figure 5.64 Japan Counter-UAV Market Forecast Regional Market Share by Country 2023 (% Share)
Figure 5.65 Japan Counter-UAV Market Forecast Regional Market Share by Country 2028 (% Share)
Figure 5.66 Japan Counter-UAV Market Forecast by Type 2018-2028 (US$m)
Figure 5.67 China Counter-UAV Market Forecast 2018-2028 (US$m, AGR %)
Figure 5.68 China Counter-UAV Market Forecast Regional Market Share by Country 2018 (% Share)
Figure 5.69 China Counter-UAV Market Forecast Regional Market Share by Country 2023 (% Share)
Figure 5.70 China Counter-UAV Market Forecast Regional Market Share by Country 2028 (% Share)
Figure 5.71 China Counter-UAV Market Forecast by Type 2018-2028 (US$m)
Figure 5.72 India Counter-UAV Market Forecast 2018-2028 (US$m, AGR %)
Figure 5.73 India Counter-UAV Market Forecast Regional Market Share by Country 2018 (% Share)
Figure 5.74 India Counter-UAV Market Forecast Regional Market Share by Country 2023 (% Share)
Figure 5.75 India Counter-UAV Market Forecast Regional Market Share by Country 2028 (% Share)
Figure 5.76 India Counter-UAV Market Forecast by Type 2018-2028 (US$m)
Figure 5.77 RoAPAC Counter-UAV Market Forecast 2018-2028 (US$m, AGR %)
Figure 5.78 RoAPAC Counter-UAV Market Forecast Regional Market Share by Country 2018 (% Share)
Figure 5.79 RoAPAC Counter-UAV Market Forecast Regional Market Share by Country 2023 (% Share)
Figure 5.80 RoAPAC Counter-UAV Market Forecast Regional Market Share by Country 2028 (% Share)
Figure 5.81 RoAPAC Counter-UAV Market Forecast by Type 2018-2028 (US$m)
Figure 5.82 RoW Counter-UAV Market Forecast 2018-2028 (US$m, AGR %)
Figure 5.83 RoW Counter-UAV Market Forecast Market Share by Region2018 (% Share)
Figure 5.84 RoW Counter-UAV Market Forecast Market Share by Region 2023 (% Share)
Figure 5.85 RoW Counter-UAV Market Forecast Market Share by Region 2028 (% Share)
Figure 5.86 RoW Counter-UAV Market Forecast by Type2018-2028 (US$m)
Figure 5.87 RoW Counter-UAV Market Forecast by Technology 2018-2028 (US$m)
Figure 5.88 RoW Counter-UAV Market Forecast by Platform 2018-2028 (US$m)
Figure 7.1 Boeing Company Total Company Sales 2013-2017 (US$m, AGR %)
Figure 7.2 Boeing Company Sales by Segment of Business 2013-2017 (US$m, Total Company Sales AGR %)
Figure 7.3 Boeing Company Sales AGR by Segment of Business 2014-2017 (AGR %)
Figure 7.4 Boeing Company Net Income / Loss 2013-2017 (US$m)
Figure 7.5 Boeing Company Sales by Regional Segment of Business 2013-2017 (US$m, Total Company Sales AGR %)
Figure 7.6 Boeing Company Sales AGR by Regional Segment of Business 2015-2017 (AGR %)
Figure 7.7Airbus Group SE Total Company Sales 2015-2017 (US$m, AGR %)
Figure 7.8 Airbus Group SE Sales by Segment of Business 2013-2017 (US$m, Total Company Sales AGR %)
Figure 7.9Airbus Group SE Sales AGR by Segment of Business 2014-2017 (AGR %)
Figure 7.10 Airbus Group SE Net Income / Loss 2013-2017 (US$m)
Figure 7.11 Airbus Group SE Sales by Regional Segment of Business 2013-2017 (US$m, Total Company Sales AGR %)
Figure 7.12 Airbus Group SE Sales AGR by Regional Segment of Business 2013-2017 (AGR %)
Figure 7.13 Saab ABTotal Company Sales 2013-2017 (US$m, AGR %)
Figure 7.14 Saab AB Sales by Segment of Business 2013-2017 (US$m, Total Company Sales AGR %)
Figure 7.15Saab AB Sales AGR by Segment of Business 2013-2017 (AGR %)
Figure 7.16 Saab AB Net Income / Loss 2013-2017 (US$m)
Figure 7.17 Saab AB Sales by Regional Segment of Business 2013-2017 (US$m, Total Company Sales AGR %)
Figure 7.18 Saab AB Sales AGR by Regional Segment of Business 2014-2017 (AGR %)
Figure 7.19 Thales Group Total Company Sales 2013-2017 (US$m, AGR %)
Figure 7.20 Thales Group Sales by Segment of Business 2013-2017 (US$m, Total Company Sales AGR %)
Figure 7.21Thales Group Sales AGR by Segment of Business 2014-2017 (AGR %)
Figure 7.22Thales Group Net Income / Loss 2013-2017 (US$m)
Figure 7.23 Thales Group Sales by Regional Segment of Business 2013-2017 (US$m, Total Company Sales AGR %)
Figure 7.24Thales Group Sales AGR by Regional Segment of Business 2014-2017 (AGR %)
Figure 7.25 Lockheed Martin Corporation Total Company Sales 2013-2017 (US$m, AGR %)
Figure 7.26 Lockheed Martin Corporation Sales by Segment of Business 2013-2017 (US$m, Total Company Sales AGR %)
Figure 7.27 Lockheed Martin Corporation Sales AGR by Segment of Business 2014-2017 (AGR %)
Figure 7.28 Lockheed Martin Corporation Net Income / Loss 2013-2017 (US$m)
Figure 7.29 Lockheed Martin Corporation Sales by Regional Segment of Business 2013-2017 (US$m, Total Company Sales AGR %)
Figure 7.30 Lockheed Martin Corporation Sales AGR by Regional Segment of Business 2014-2017 (AGR %)
Figure 7.31 The Raytheon Company Total Company Sales 2013-2017 (US$m, AGR %)
Figure 7.32 The Raytheon Company Sales by Segment of Business 2013-2017 (US$m, Total Company Sales AGR %)
Figure 7.33 The Raytheon Company Sales AGR by Segment of Business 2014-2017 (AGR %)
Figure 7.34 The Raytheon Company Net Income / Loss 2013-2017 (US$m)
Figure 7.35 The Raytheon Company Sales by Regional Segment of Business 2013-2017 (US$m, Total Company Sales AGR %)
Figure 7.36 The Raytheon Company Sales AGR by Regional Segment of Business 2014-2017 (AGR %)
Figure 7.37 Northrop Grumman Corporation Total Company Sales 2013-2017 (US$m, AGR %)
Figure 7.38 Northrop Grumman Corporation Sales by Segment of Business 2014-2017 (US$m, Total Company Sales AGR %)
Figure 7.39 Northrop Grumman Corporation Sales AGR by Segment of Business 2014-2017 (AGR %)
Figure 7.40 Northrop Grumman Corporation Net Income / Loss 2013-2017 (US$m)
Figure 7.41 Northrop Grumman Corporation Sales by Regional Segment of Business 2013-2017 (US$m, Total Company Sales AGR %)
Figure 7.42 Northrop Grumman Corporation Sales AGR by Regional Segment of Business 2014-2017 (AGR %)
Figure 7.43 Rafael Advanced Defense Systems Ltd Total Company Sales 2011-2016 (US$m, AGR %)
Figure 7.44 Rafael Advanced Defense Systems Ltd Net Income / Loss 2010-2015 (US$m)
Figure 7.45 Rheinmetall AG Total Company Sales 2013-2017 (US$m, AGR %)
Figure 7.46 Rheinmetall AG Sales by Segment of Business 2013-2017 (US$m, Total Company Sales AGR %)
Figure 7.49 Rheinmetall AG Sales AGR by Segment of Business 2014-2017 (AGR %)
Figure 7.50 Rheinmetall AG Net Income / Loss 2013-2017 (US$m)