Industries > Energy > Bio-LPG Market Report 2021-2031

Bio-LPG Market Report 2021-2031
Forecasts by Raw Material (Bio-oil, Cellulosic Organic Waste, Others (Wet Waste, Sugar, etc.)), by End-user (Residential, Chemical & Petrochemical, Others) AND Regional and Leading National Market Analysis PLUS Analysis of Leading Bio-LPG Companies AND COVID-19 Recovery Scenarios
Bio LPG Market– our new study reveals trends, R&D progress, and predicted revenues
Where is the bio-LPG market heading? If you are involved in this sector, you must read this newly updated report. Visiongain’s report shows you the potential revenues streams to 2031, assessing data, trends, opportunities and business prospects there.
Discover how to stay ahead
Our 340+ page report provides 227 tables and 192 charts/graphs. Read on to discover the most lucrative areas in the industry and the future market prospects. Our new study lets you assess forecasted sales at the overall world market and regional level. See financial results, trends, opportunities, and revenue predictions. Much opportunity remains in this growing Bio LPG Market. See how to exploit the opportunities.
Forecasts to 2031 and other analyses reveal the commercial prospects
• In addition to revenue & volume forecasting to 2031, our new study provides you with recent results, growth rates, and market shares.
• You find original analyses, with business outlooks and developments.
• Discover qualitative analyses (including market dynamics, drivers, opportunities, restraints and challenges), product profiles and commercial developments.
Discover sales predictions for the world market and submarkets
Bio LPG Market: Raw Material
• Bio-oil
• Cellulosic Organic Waste
• Others
Bio LPG Market: End-user
• Residential
• Chemical & Petrochemical
• Others

In addition to the revenue predictions for the overall world market and segments, you will also find revenue forecasts for 4 regional and 18 leading national markets:
• North America
• U.S.
• Canada
• Europe
• Italy
• Denmark
• Ireland
• France
• Sweden
• U.K.
• Germany
• Rest of Europe
• Asia Pacific
• India
• Australia
• Rest of Asia Pacific
• Rest of the World
Need industry data? Please contact us today.
The report also includes profiles and for some of the leading companies in the Bio LPG Market, with a focus on this segment of these companies’ operations.
Leading companies and the potential for market growth
Overall world revenue for Bio LPG Market will surpass $xx million in 2021, our work calculates. We predict strong revenue growth through to 2031. Our work identifies which organizations hold the greatest potential. Discover their capabilities, progress, and commercial prospects, helping you stay ahead.
How the Bio LPG Market report helps you
In summary, our 340+ page report provides you with the following knowledge:
• Revenue forecasts to 2031 for Bio LPG Market, with forecasts for Raw Material, and End-user, each forecasted at a global and regional level– discover the industry’s prospects, finding the most lucrative places for investments and revenues
• Revenue forecasts to 2031 for 4 regional and 12 key national markets – See forecasts for the Bio LPG market in North America, Europe, Asia-Pacific, and the Rest of the World. Also forecasted is the market in the US, Canada, Italy, Denmark, Ireland, France, Sweden, U.K., Germany, India, Australia, and the Rest of the World among other prominent economies.
• Prospects for established firms and those seeking to enter the market– including company profiles for 17 of the major companies involved in the Bio LPG Market. Some of the companies profiled in this report include Neste Oil, SHV Energy, etc.
Find quantitative and qualitative analyses with independent predictions. Receive information that only our report contains, staying informed with this invaluable business intelligence.
Information found nowhere else
With our newly report title, you are less likely to fall behind in knowledge or miss out on opportunities. See how our work could benefit your research, analyses, and decisions. Visiongain’s study is for everybody needing commercial analyses for the Bio LPG Market and leading companies. You will find data, trends and predictions.
To access the data contained in this document please email contactus@visiongain.com
Buy our report today Bio-LPG Market Report 2021-2031: Forecasts by Raw Material (Bio-oil, Cellulosic Organic Waste, Others (Wet Waste, Sugar, etc.)), by End-user (Residential, Chemical & Petrochemical, Others) AND Regional and Leading National Market Analysis PLUS Analysis of Leading Bio-LPG Companies AND COVID-19 Recovery Scenarios. Avoid missing out by staying informed – order our report now.
Visiongain is a trading partner with the US Federal Government
CCR Ref number: KD4R6
Do you have any custom requirements we can help you with? Any need for a specific country, geo region, market segment or specific company information? Contact us today, we can discuss your needs and see how we can help: sara.peerun@visiongain.com
1.1. Introduction
1.2. Why You Should Read This Report
1.3. Key Questions Answered by This Analytical Report
1.4. Who is This Report For?
1.5. Methodology
1.6. Frequently Asked Questions (FAQ)
1.7. Associated Visiongain Reports
1.8. About Visiongain
2. Introduction to the Bio LPG Market
2.1. Bio LPG Market Definition
2.2. Raw Material Submarkets Definitions
2.3. Type Submarkets Definitions
3. Bio LPG Market Overview
3.1. Global Bio LPG Market Size and Forecast by Region
3.2. Global Bio LPG Market Share by Region
3.3. Market Dynamics
3.3.1. Market Drivers
3.3.1.1. Increasing Production of Biodiesel and Recovery of Bio LPG
3.3.1.2. Lower Carbon Footprint Compared to Traditional LPG
3.3.1.3. Ongoing R&D activities in advanced chemical processes to Fuel Growth
3.3.2. Market Restraints/Challenges
3.3.2.1. Inexpensive Natural Gas to Derail Growth
3.3.3. Opportunities
3.3.3.1. Future Opportunities as LPG Autogas for Transport Fuel
3.3.4. Global Bio LPG Market: Trends
3.3.4.1. Current Recovery from Bio-oil
3.3.4.2. Increasing Investment in Harnessing Alternate Energy
3.3.4.3. High Growth Prospects Through Recovery from Cellulosic Orgainc Waste
3.3.5. SWOT Analysis
3.3.5.1. Strengths
3.3.5.1.1. High Consumption of LPG across the Globe
3.3.5.1.2. Increasing Marketing Activities of Bio-LPG
3.3.5.1.3. Rising Investments in Advanced Processes
3.3.5.2. Weaknesses
3.3.5.2.1. Lower Recovery Through Current Technologies
3.3.5.2.2. Lower Yield through Bio-oil
3.3.5.2.3.
3.3.5.3. Opportunities
3.3.5.3.1. Favorable Government Policies & Framework
3.3.5.3.2. Replacement of Cooking Gas
3.3.5.3.3. High Potential as Autogas in European Market
3.3.5.4. Threats
3.3.5.4.1. Biogas and Biofuel
3.3.6. Porter’s Five Forces Analysis
3.3.6.1. Competitive Rivalry
3.3.6.2. Supplier Power
3.3.6.3. Buyer Power
3.3.6.4. Threat of Substitution
3.3.6.5. Threat of New Entry
4. Global Bio LPG Market Analysis and Forecast 2021-2031, by Raw Material (Pre COVID and V, U, W and L COVID Recovery Scenarios)
4.1. Market Overview
4.1.1. Bio-oil
4.1.1.1. Low CAPEX through Brine Recovery
4.1.2. Cellulosic Organic Waste
4.1.2.1. High CAPEX Involved
4.1.3. Others (Secondary Lithium, etc.)
4.1.3.1. Lower Rate of Extraction
5. Global Bio LPG Market Analysis and Forecast, 2021-2031 by End-user (Pre COVID and V, U, W and L COVID Recovery Scenarios)
5.1. Market Overview
5.1.1. Residential
5.1.1.1. High Extraction Rates
5.1.2. Chemical & Petrochemical
5.1.2.1. Most Promising for Lithium Battery Used in EV’s
5.1.3. Others
5.1.3.1. Most Promising for Lithium Battery Used in EV’s
6. North America Bio LPG Market Analysis and Forecast, 2021-2031 Pre COVID and V, U, W and L COVID Recovery Scenarios)
6.1. Market Overview
6.2. North America Bio LPG Market Size and Forecast by Raw Material
6.2.1. Cellulosic Organic Waste Submarket Expected to Attain Dominant Position by 2031
6.3. North America Bio LPG Market Size and Forecast by End-user
6.3.1. Residential Submarket to Lead by 2031
6.4. U.S. Bio LPG Market
6.4.1. Growing LPG Trade in the U.S. to Benefit Bio LPG Demand
6.4.2. New Projects Building-up
6.5. Canada Bio LPG Market
6.5.1. Rising Renewable Energy Investments in Canada
6.5.2. Growing LPG Consumption
7. Europe Bio LPG Market Analysis and Forecast, 2021-2031 (Pre COVID and V, U, W and L COVID Recovery Scenarios)
7.1. Market Overview
7.2. Europe Bio LPG Market Size and Forecast by Raw Material
7.2.1. Cellulosic Organic Waste Submarket Expected to Attain Dominant Position by 2031
7.3. Europe Bio LPG Market Size and Forecast by End-user
7.3.1. Residential Submarket to Lead by 2031
7.4. Italy Bio LPG Market
7.4.1. Second-largest Autogas market in the European Union
7.5. Denmark Bio LPG Market
7.5.1. Gas Production Cut Targets to Maximize Alternate Fuel Production
7.6. Ireland Bio LPG Market
7.6.1. Climate Control & Clean Energy Targets to Maximize Yield
7.7. France Bio LPG Market
7.7.1. Transition to Net-zero Economy by 2050
7.8. Sweden Bio LPG Market
7.8.1. Availability of Limited Natural Gas
7.9. U.K. Bio LPG Market
7.9.1. Transition to Bio LPG by 2040
7.10. Germany Bio LPG Market
7.10.1. Positive Policies & Framework to Create High Opportunities
7.11. Rest of Europe Bio LPG Market
7.11.1. Lower Production and Demand
8. Asia Pacific Bio LPG Market Analysis and Forecast, 2021-2031 (Pre COVID and V, U, W and L COVID Recovery Scenarios)
8.1. Market Overview
8.2. Asia Pacific Bio LPG Market Size and Forecast by Raw Material
8.2.1. Cellulosic Organic Waste Submarket Expected to Attain Dominant Position by 2031
8.3. Asia Pacific Bio LPG Market Size and Forecast by End-user
8.3.1. Residential Submarket to Lead by 2031
8.4. India Bio LPG Market
8.4.1. NOCs in India Plans to Introduce Bio LPG
8.5. Australia Bio LPG Market
8.5.1. New Bioenergy Roadmap to Provide Favourable Support
8.6. Rest of Asia Pacific Bio LPG Market
8.6.1. New Zealand has High Growth Opportunities
9. Rest of the World (RoW) Bio LPG Market Analysis and Forecast, 2021-2031 (Pre COVID and V, U, W and L COVID Recovery Scenarios)
9.1. Market Overview
9.2. Rest of the World (RoW) Bio LPG Market Size and Forecast by Raw Material
9.2.1. Cellulosic Organic Waste Submarket Expected to Attain Dominant Position by 2031
9.2.2. African Nations Remains the Hotspot for Future Growth
9.3. Rest of the World (RoW) Bio LPG Market Size and Forecast by End-user
9.3.1. Residential Submarket to Lead by 2031
9.3.2. Middle East has a High Biogas Potential
10. Companies in the Bio LPG Market
10.1. Neste Oil
10.1.1. Company Snapshot
10.1.2. Company Overview
10.1.3. Financial Performance (2015-2019)
10.1.3.1. Net Revenue
10.1.3.2. Geographical Revenue, 2019
10.1.3.3. Segmental Revenue, 2019
10.1.4. Mining Sites Benchmarking
10.1.5. Recent Initiatives (2017-2021)
10.2. SHV Energy
10.2.1. Company Snapshot
10.2.2. Company Overview
10.2.3. Financial Performance (2015-2019)
10.2.3.1. Net Revenue
10.2.3.2. Sales Volume, by Business Line, 2019
10.2.3.3. Gross Margin, by Business Line, 2019
10.2.4. Mining Sites Benchmarking
10.2.5. Recent Initiatives (2017-2021)
10.3. Preem AB
10.3.1. Company Snapshot
10.3.2. Company Overview
10.3.3. Financial Performance (2016-2019)
10.3.3.1. Net Revenue
10.3.3.2. Geographical Revenue, 2019
10.3.3.3. Segmental Production Capacity, 2019
10.3.4. Mining Sites Benchmarking
10.3.5. Recent Initiatives (2017-2021)
10.4. AvantiGas
10.4.1. Company Snapshot
10.4.2. Company Overview
10.4.3. Financial Performance (2015-2019)
10.4.3.1. Net Revenue
10.4.3.2. Production Capacity, by Product Type, 2019
10.4.3.3. Segmental Revenue, 2019
10.4.4. Mining Sites Benchmarking
10.4.5. Recent Initiatives (2017-2021)
10.5. Global Bioenergies
10.5.1. Company Snapshot
10.5.2. Company Overview
10.5.3. Financial Performance (2015-2020)
10.5.3.1. Net Revenue
10.5.3.2. Product Type Revenue, 2020
10.5.3.3. Segmental Revenue, 2020
10.5.4. Mining Sites Benchmarking
10.5.5. Recent Initiatives (2017-2021)
10.6. Irving Oil
10.6.1. Company Snapshot
10.6.2. Company Overview
10.6.3. Financial Performance (2015-2018)
10.6.3.1. Net Revenue
10.6.3.2. Geographical Sales Volume, 2020
10.6.4. Mining Sites Benchmarking
10.6.5. Recent Initiatives (2017-2021)
10.7. Diamond Green Diesel
10.7.1. Company Snapshot
10.7.2. Company Overview
10.7.3. Financial Performance (2016-2020)
10.7.3.1. Net Revenue
10.7.3.2. Geographical Revenue, 2020
10.7.3.3. Segmental Revenue, 2020
10.7.4. Mining Sites Benchmarking
10.7.5. Recent Initiatives (2017-2021)
10.8. Renewable Energy Group
10.8.1. Company Snapshot
10.8.2. Company Overview
10.8.3. Financial Performance (2016-2020)
10.8.3.1. Net Revenue
10.8.3.2. Geographical Revenue, 2020
10.8.3.3. Segmental Revenue, 2020
10.8.4. Mining Sites Benchmarking
10.8.5. Recent Initiatives (2017-2021)
10.9. Total SE
10.9.1. Company Snapshot
10.9.2. Company Overview
10.9.3. Financial Performance (2015-2019)
10.9.3.1. Net Revenue
10.9.3.2. Geographical Revenue, 2019
10.9.3.3. Segmental Revenue, 2019
10.9.4. Mining Sites Benchmarking
10.9.5. Recent Initiatives (2017-2021)
10.10. ENI
10.10.1. Company Snapshot
10.10.2. Company Overview
10.10.3. Financial Performance (2016-2020)
10.10.3.1. Net Revenue
10.10.3.2. Geographical Revenue, 2020
10.10.3.3. Segmental Revenue, 2020
10.10.4. Mining Sites Benchmarking
10.10.5. Recent Initiatives (2017-2021)
10.11. Cepsa
10.11.1. Company Snapshot
10.11.2. Company Overview
10.11.3. Mining Sites Benchmarking
10.11.4. Recent Initiatives (2017-2021)
10.12. Galp
10.12.1. Company Snapshot
10.12.2. Company Overview
10.12.3. Financial Performance (2016-2020)
10.12.3.1. Net Revenue
10.12.3.2. Segmental Revenue, 2020
10.12.4. Mining Sites Benchmarking
10.12.5. Recent Initiatives (2017-2021)
10.13. Repsol
10.13.1. Company Snapshot
10.13.2. Company Overview
10.13.3. Mining Sites Benchmarking
10.13.4. Recent Initiatives (2017-2021)
10.14. Calor Gas Ltd.
10.14.1. Company Snapshot
10.14.2. Company Overview
10.14.3. Financial Performance (2016-2020)
10.14.3.1. Net Revenue
10.14.3.2. Segmental Revenue, 2020
10.14.4. Mining Sites Benchmarking
10.14.5. Recent Initiatives (2017-2021)
10.15. Indian Oil Corporation
10.15.1. Company Snapshot
10.15.2. Company Overview
10.15.3. Financial Performance (2016-2020)
10.15.3.1. Net Revenue
10.15.3.2. Segmental Revenue, 2020
10.15.4. Mining Sites Benchmarking
10.15.5. Recent Initiatives (2017-2021)
10.16. Petrobras
10.16.1. Company Snapshot
10.16.2. Company Overview
10.16.3. Financial Performance (2016-2020)
10.16.3.1. Net Revenue
10.16.3.2. Segmental Revenue, 2020
10.16.4. Mining Sites Benchmarking
10.16.5. Recent Initiatives (2017-2021)
10.17. World Energy
10.17.1. Company Snapshot
10.17.2. Company Overview
10.17.3. Financial Performance (2016-2020)
10.17.3.1. Net Revenue
10.17.3.2. Segmental Revenue, 2020
10.17.4. Mining Sites Benchmarking
10.17.5. Recent Initiatives (2017-2021)
11. Conclusion
12. Glossary
LIST OF TABLES
Table 1 Global Bio LPG Market, 2020-2031 (US$ million, CAGR %)
Table 2 Global Bio LPG Market by Raw Material Forecast, 2021-2031 (US$ Mn, AGR%, CAGR%)
Table 3 Global Bio LPG Market by Raw Material Forecast, 2021-2031 (Kilo Tons, AGR%, CAGR%):
Table 4 Global Bio LPG Market for Bio-oil Segment, Value & Volume Forecast 2021-2031 (US$ million, Kilo Tons, AGR%, CAGR%)
Table 5 “V” Shaped Recovery: Global Bio LPG Market for Bio-oil Segment, Value & Volume Forecast 2021-2031 (US$ million, Kilo Tons, AGR%, CAGR%)
Table 6 “U” Shaped Recovery: Global Bio LPG Market for Bio-oil Segment, Value & Volume Forecast 2021-2031 (US$ million, Kilo Tons, AGR%, CAGR%)
Table 7 “W” Shaped Recovery: Global Bio LPG Market for Bio-oil Segment, Value & Volume Forecast 2021-2031 (US$ million, Kilo Tons, AGR%, CAGR%)
Table 8 “L” Shaped Recovery: Global Bio LPG Market for Bio-oil Segment, Value & Volume Forecast 2021-2031 (US$ million, Kilo Tons, AGR%, CAGR%)
Table 9 Bio LPG Market for Cellulosic Organic Waste Segment, Value & Volume Forecast 2021-2031 (US$ million, Kilo Tons, AGR%, CAGR%)
Table 10 “V” Shaped Recovery: Global Bio LPG Market for Cellulosic Organic Waste Segment, Value & Volume Forecast 2021-2031 (US$ million, Kilo Tons, AGR%, CAGR%)
Table 11 “U” Shaped Recovery: Global Bio LPG Market for Cellulosic Organic Waste Segment, Value & Volume Forecast 2021-2031 (US$ million, Kilo Tons, AGR%, CAGR%)
Table 12 “W” Shaped Recovery: Global Bio LPG Market for Cellulosic Organic Waste Segment, Value & Volume Forecast 2021-2031 (US$ million, Kilo Tons, AGR%, CAGR%)
Table 13 “L” Shaped Recovery: Global Bio LPG Market for Cellulosic Organic Waste Segment, Value & Volume Forecast 2021-2031 (US$ million, Kilo Tons, AGR%, CAGR%)
Table 14 Global Bio LPG Market for Others Segment, Value & Volume Forecast 2021-2031 (US$ million, Kilo Tons, AGR%, CAGR%)
Table 15 “V” Shaped Recovery: Global Bio LPG Market for Others Segment, Value & Volume Forecast 2021-2031 (US$ million, Kilo Tons, AGR%, CAGR%)
Table 16 “U” Shaped Recovery: Global Bio LPG Market for Others Segment, Value & Volume Forecast 2021-2031 (US$ million, Kilo Tons, AGR%, CAGR%)
Table 17 “W” Shaped Recovery: Global Bio LPG Market for Others Segment, Value & Volume Forecast 2021-2031 (US$ million, Kilo Tons, AGR%, CAGR%)
Table 18 “L” Shaped Recovery: Global Bio LPG Market for Others Segment, Value & Volume Forecast 2021-2031 (US$ million, Kilo Tons, AGR%, CAGR%)
Table 19 Global Bio LPG Market by End-user Forecast, 2021-2031 (US$ Mn, AGR%, CAGR%)
Table 20 Global Bio LPG Market by End-user Forecast, 2021-2031 (Kilo Tons, AGR%, CAGR%):
Table 21 Global Bio LPG Market for Residential Segment, Value & Volume Forecast 2021-2031 (US$ million, Kilo Tons, AGR%, CAGR%)
Table 22 “V” Shaped Recovery: Global Bio LPG Market for Residential Segment, Value & Volume Forecast 2021-2031 (US$ million, Kilo Tons, AGR%, CAGR%)
Table 23 “U” Shaped Recovery: Global Bio LPG Market for Residential Segment, Value & Volume Forecast 2021-2031 (US$ million, Kilo Tons, AGR%, CAGR%)
Table 24 “W” Shaped Recovery: Global Bio LPG Market for Residential Segment, Value & Volume Forecast 2021-2031 (US$ million, Kilo Tons, AGR%, CAGR%)
Table 25 “L” Shaped Recovery: Global Bio LPG Market for Residential Segment, Value & Volume Forecast 2021-2031 (US$ million, Kilo Tons, AGR%, CAGR%)
Table 26 Bio LPG Market for Chemical & Petrochemical Segment, Value & Volume Forecast 2021-2031 (US$ million, Kilo Tons, AGR%, CAGR%)
Table 27 “V” Shaped Recovery: Global Bio LPG Market for Chemical & Petrochemical Segment, Value & Volume Forecast 2021-2031 (US$ million, Kilo Tons, AGR%, CAGR%)
Table 28 “U” Shaped Recovery: Global Bio LPG Market for Chemical & Petrochemical Segment, Value & Volume Forecast 2021-2031 (US$ million, Kilo Tons, AGR%, CAGR%)
Table 29 “W” Shaped Recovery: Global Bio LPG Market for Chemical & Petrochemical Segment, Value & Volume Forecast 2021-2031 (US$ million, Kilo Tons, AGR%, CAGR%)
Table 30 “L” Shaped Recovery: Global Bio LPG Market for Chemical & Petrochemical Segment, Value & Volume Forecast 2021-2031 (US$ million, Kilo Tons, AGR%, CAGR%)
Table 31 Global Bio LPG Market for Others Segment, Value & Volume Forecast 2021-2031 (US$ million, Kilo Tons, AGR%, CAGR%)
Table 32 “V” Shaped Recovery: Global Bio LPG Market for Others Segment, Value & Volume Forecast 2021-2031 (US$ million, Kilo Tons, AGR%, CAGR%)
Table 33 “U” Shaped Recovery: Global Bio LPG Market for Others Segment, Value & Volume Forecast 2021-2031 (US$ million, Kilo Tons, AGR%, CAGR%)
Table 34 “W” Shaped Recovery: Global Bio LPG Market for Others Segment, Value & Volume Forecast 2021-2031 (US$ million, Kilo Tons, AGR%, CAGR%)
Table 35 “L” Shaped Recovery: Global Bio LPG Market for Others Segment, Value & Volume Forecast 2021-2031 (US$ million, Kilo Tons, AGR%, CAGR%)
Table 36 Global Bio LPG Market Value & Volume Forecast, 2021-2031 (US$ million, Kilo Tons, AGR %, CAGR %)
Table 37 Global Bio LPG Market by Region Forecast, 2021-2031 (US$ Mn, AGR%, CAGR%):
Table 38 Global Bio LPG Market by Region Forecast, 2021-2031 (Kilo Tons, AGR%, CAGR%):
Table 39 Global Bio LPG Market by Country Forecast, 2021-2031 (US$ Mn, AGR%, CAGR%): “V” Shaped Recovery
Table 40 Global Bio LPG Market by Country Forecast, 2021-2031 (Kilo Tons, AGR%, CAGR%): “V” Shaped Recovery
Table 41 Global Bio LPG Market by Region Forecast, 2021-2031 (US$ Mn, AGR%, CAGR%): “U” Shaped Recovery
Table 42 Global Bio LPG Market by Region Forecast, 2021-2031 (Kilo Tons, AGR%, CAGR%): “U” Shaped Recovery
Table 43 Global Bio LPG Market by Region Forecast, 2021-2031 (US$ Mn, AGR%, CAGR%): “W” Shaped Recovery
Table 44 Global Bio LPG Market by Region Forecast, 2021-2031 (Kilo Tons, AGR%, CAGR%): “W” Shaped Recovery
Table 45 Global Bio LPG Market by Region Forecast, 2021-2031 (US$ Mn, AGR%, CAGR%): “L” Shaped Recovery
Table 46 Global Bio LPG Market by Region Forecast, 2021-2031 (Kilo Tons, AGR%, CAGR%): “L” Shaped Recovery
Table 47 North America Bio LPG Market by Country Forecast, 2021-2031 (US$ Mn, AGR%, CAGR%)
Table 48 North America Bio LPG Market by Country Forecast, 2021-2031 (Kilo Tons, AGR%, CAGR%)
Table 49 North America Bio LPG Market by Raw Material Forecast, 2021-2031 (US$ Mn, AGR%, CAGR%)
Table 50 North America Bio LPG Market by Raw Material Forecast, 2021-2031 (Kilo Tons, AGR%, CAGR%)
Table 51 North America Bio LPG Market by Raw Material Forecast, 2021-2031 (US$ Mn, AGR%, CAGR%): “V” Shaped Recovery
Table 52 North America Bio LPG Market by Raw Material Forecast, 2021-2031 (Kilo Tons, AGR%, CAGR%): “V” Shaped Recovery
Table 53 North America Bio LPG Market by Raw Material Forecast, 2021-2031 (US$ Mn, AGR%, CAGR%): “U” Shaped Recovery
Table 54 North America Bio LPG Market by Raw Material Forecast, 2021-2031 (Kilo Tons, AGR%, CAGR%): “U” Shaped Recovery
Table 55 North America Bio LPG Market by Raw Material Forecast, 2021-2031 (US$ Mn, AGR%, CAGR%): “W” Shaped Recovery
Table 56 North America Bio LPG Market by Raw Material Forecast, 2021-2031 (Kilo Tons, AGR%, CAGR%): “W” Shaped Recovery
Table 57 North America Bio LPG Market by Raw Material Forecast, 2021-2031 (US$ Mn, AGR%, CAGR%): “L” Shaped Recovery
Table 58 North America Bio LPG Market by Raw Material Forecast, 2021-2031 (Kilo Tons, AGR%, CAGR%): “L” Shaped Recovery
Table 59 North America Bio LPG Market by End-user Forecast, 2021-2031 (US$ Mn, AGR%, CAGR%)
Table 60 North America Bio LPG Market by End-user Forecast, 2021-2031 (Kilo Tons, AGR%, CAGR%)
Table 61 North America Bio LPG Market by End-user Forecast, 2021-2031 (US$ Mn, AGR%, CAGR%): “V” Shaped Recovery
Table 62 North America Bio LPG Market by End-user Forecast, 2021-2031 (Kilo Tons, AGR%, CAGR%): “V” Shaped Recovery
Table 63 North America Bio LPG Market by End-user Forecast, 2021-2031 (US$ Mn, AGR%, CAGR%): “U” Shaped Recovery
Table 64 North America Bio LPG Market by End-user Forecast, 2021-2031 (Kilo Tons, AGR%, CAGR%): “U” Shaped Recovery
Table 65 North America Bio LPG Market by End-user Forecast, 2021-2031 (US$ Mn, AGR%, CAGR%): “W” Shaped Recovery
Table 66 North America Bio LPG Market by End-user Forecast, 2021-2031 (Kilo Tons, AGR%, CAGR%): “W” Shaped Recovery
Table 67 North America Bio LPG Market by End-user Forecast, 2021-2031 (US$ Mn, AGR%, CAGR%): “L” Shaped Recovery
Table 68 North America Bio LPG Market by End-user Forecast, 2021-2031 (Kilo Tons, AGR%, CAGR%): “L” Shaped Recovery
Table 69 U.S. Bio LPG Market Forecast, 2021-2031 (US$ Mn, Tons, AGR%, CAGR%)
Table 70 U.S. Bio LPG Market Forecast, 2021-2031 (US$ Mn, Tons, AGR%, CAGR%): "V" Shaped Recovery
Table 71 U.S. Bio LPG Market Forecast, 2021-2031 (US$ Mn, Tons, AGR%, CAGR%): "U" Shaped Recovery
Table 72 U.S. Bio LPG Market Forecast, 2021-2031 (US$ Mn, Tons, AGR%, CAGR%): "W" Shaped Recovery
Table 73 U.S. Bio LPG Market Forecast, 2021-2031 (US$ Mn, Tons, AGR%, CAGR%): "L" Shaped Recovery
Table 74 Canada Bio LPG Market Forecast, 2021-2031 (US$ Mn, Tons, AGR%, CAGR%)
Table 75 Canada Bio LPG Market Forecast, 2021-2031 (US$ Mn, Tons, AGR%, CAGR%): "V" Shaped Recovery
Table 76 Canada Bio LPG Market Forecast, 2021-2031 (US$ Mn, Tons, AGR%, CAGR%): "U" Shaped Recovery
Table 77 Canada Bio LPG Market Forecast, 2021-2031 (US$ Mn, Tons, AGR%, CAGR%): "W" Shaped Recovery
Table 78 Canada Bio LPG Market Forecast, 2021-2031 (US$ Mn, Tons, AGR%, CAGR%): "L" Shaped Recovery
Table 79 Europe Bio LPG Market by Country Forecast, 2021-2031 (US$ Mn, AGR%, CAGR%):
Table 80 Europe Bio LPG Market by Country Forecast, 2021-2031 (Kilo Tons, AGR%, CAGR%):
Table 81 Europe Bio LPG Market by Raw Material Forecast, 2021-2031 (US$ Mn, AGR%, CAGR%):
Table 82 Europe Bio LPG Market by Raw Material Forecast, 2021-2031 (Kilo Tons, AGR%, CAGR%):
Table 83 Europe Bio LPG Market by Raw Material Forecast, 2021-2031 (US$ Mn, AGR%, CAGR%): “V” Shaped Recovery
Table 84 Europe Bio LPG Market by Raw Material Forecast, 2021-2031 (Kilo Tons, AGR%, CAGR%): “V” Shaped Recovery
Table 85 Europe Bio LPG Market by Raw Material Forecast, 2021-2031 (US$ Mn, AGR%, CAGR%): “U” Shaped Recovery
Table 86 Europe Bio LPG Market by Raw Material Forecast, 2021-2031 (Kilo Tons, AGR%, CAGR%): “U” Shaped Recovery
Table 87 Europe Bio LPG Market by Raw Material Forecast, 2021-2031 (US$ Mn, AGR%, CAGR%): “W” Shaped Recovery
Table 88 Europe Bio LPG Market by Raw Material Forecast, 2021-2031 (Kilo Tons, AGR%, CAGR%): “W” Shaped Recovery
Table 89 Europe Bio LPG Market by Raw Material Forecast, 2021-2031 (US$ Mn, AGR%, CAGR%): “L” Shaped Recovery
Table 90 Europe Bio LPG Market by Raw Material Forecast, 2021-2031 (Kilo Tons, AGR%, CAGR%): “L” Shaped Recovery
Table 91 Europe Bio LPG Market by End-user Forecast, 2021-2031 (US$ Mn, AGR%, CAGR%):
Table 92 Europe Bio LPG Market by End-user Forecast, 2021-2031 (Kilo Tons, AGR%, CAGR%):
Table 93 Europe Bio LPG Market by End-user Forecast, 2021-2031 (US$ Mn, AGR%, CAGR%): “V” Shaped Recovery
Table 94 Europe Bio LPG Market by End-user Forecast, 2021-2031 (Kilo Tons, AGR%, CAGR%): “V” Shaped Recovery
Table 95 Europe Bio LPG Market by End-user Forecast, 2021-2031 (US$ Mn, AGR%, CAGR%): “U” Shaped Recovery
Table 96 Europe Bio LPG Market by End-user Forecast, 2021-2031 (Kilo Tons, AGR%, CAGR%): “U” Shaped Recovery
Table 97 Europe Bio LPG Market by End-user Forecast, 2021-2031 (US$ Mn, AGR%, CAGR%): “W” Shaped Recovery
Table 98 Europe Bio LPG Market by End-user Forecast, 2021-2031 (Kilo Tons, AGR%, CAGR%): “W” Shaped Recovery
Table 99 Europe Bio LPG Market by End-user Forecast, 2021-2031 (US$ Mn, AGR%, CAGR%): “L” Shaped Recovery
Table 100 Europe Bio LPG Market by End-user Forecast, 2021-2031 (Kilo Tons, AGR%, CAGR%): “L” Shaped Recovery
Table 101 Italy Bio LPG Market Forecast, 2021-2031 (US$ Mn, Kilo Tons, AGR%, CAGR%)
Table 102 Italy Bio LPG Market Forecast, 2021-2031 (US$ Mn, Kilo Tons, AGR%, CAGR%): "V" Shaped Recovery
Table 103 Italy Bio LPG Market Forecast, 2021-2031 (US$ Mn, Kilo Tons, AGR%, CAGR%): "U" Shaped Recovery
Table 104 Italy Bio LPG Market Forecast, 2021-2031 (US$ Mn, Kilo Tons, AGR%, CAGR%): "W" Shaped Recovery
Table 105 Italy Bio LPG Market Forecast, 2021-2031 (US$ Mn, Kilo Tons, AGR%, CAGR%): "L" Shaped Recovery
Table 106 Denmark Bio LPG Market Forecast, 2021-2031 (US$ Mn, Kilo Tons, AGR%, CAGR%)
Table 107 Denmark Bio LPG Market Forecast, 2021-2031 (US$ Mn, Kilo Tons, AGR%, CAGR%): "V" Shaped Recovery
Table 108 Denmark Bio LPG Market Forecast, 2021-2031 (US$ Mn, Kilo Tons, AGR%, CAGR%): "U" Shaped Recovery
Table 109 Denmark Bio LPG Market Forecast, 2021-2031 (US$ Mn, Kilo Tons, AGR%, CAGR%): "W" Shaped Recovery
Table 110 Denmark Bio LPG Market Forecast, 2021-2031 (US$ Mn, Kilo Tons, AGR%, CAGR%): "L" Shaped Recovery
Table 111 Ireland Bio LPG Market Forecast, 2021-2031 (US$ Mn, Tons, AGR%, CAGR%)
Table 112 Ireland Bio LPG Market Forecast, 2021-2031 (US$ Mn, Tons, AGR%, CAGR%): "V" Shaped Recovery
Table 113 Ireland Bio LPG Market Forecast, 2021-2031 (US$ Mn, Tons, AGR%, CAGR%): "U" Shaped Recovery
Table 114 Ireland Bio LPG Market Forecast, 2021-2031 (US$ Mn, Tons, AGR%, CAGR%): "W" Shaped Recovery
Table 115 Ireland Bio LPG Market Forecast, 2021-2031 (US$ Mn, Tons, AGR%, CAGR%): "L" Shaped Recovery
Table 116 France Bio LPG Market Forecast, 2021-2031 (US$ Mn, Kilo Tons, AGR%, CAGR%)
Table 117 France Bio LPG Market Forecast, 2021-2031 (US$ Mn, Kilo Tons, AGR%, CAGR%): "V" Shaped Recovery
Table 118 France Bio LPG Market Forecast, 2021-2031 (US$ Mn, Kilo Tons, AGR%, CAGR%): "U" Shaped Recovery
Table 119 France Bio LPG Market Forecast, 2021-2031 (US$ Mn, Kilo Tons, AGR%, CAGR%): "W" Shaped Recovery
Table 120 France Bio LPG Market Forecast, 2021-2031 (US$ Mn, Kilo Tons, AGR%, CAGR%): "L" Shaped Recovery
Table 121 Sweden Bio LPG Market Forecast, 2021-2031 (US$ Mn, Kilo Tons, AGR%, CAGR%)
Table 122 Sweden Bio LPG Market Forecast, 2021-2031 (US$ Mn, Kilo Tons, AGR%, CAGR%): "V" Shaped Recovery
Table 123 Sweden Bio LPG Market Forecast, 2021-2031 (US$ Mn, Kilo Tons, AGR%, CAGR%): "U" Shaped Recovery
Table 124 Sweden Bio LPG Market Forecast, 2021-2031 (US$ Mn, Kilo Tons, AGR%, CAGR%): "W" Shaped Recovery
Table 125 Sweden Bio LPG Market Forecast, 2021-2031 (US$ Mn, Kilo Tons, AGR%, CAGR%): "L" Shaped Recovery
Table 126 U.K. Bio LPG Market Forecast, 2021-2031 (US$ Mn, Tons, AGR%, CAGR%)
Table 127 U.K. Bio LPG Market Forecast, 2021-2031 (US$ Mn, Tons, AGR%, CAGR%): "V" Shaped Recovery
Table 128 U.K. Bio LPG Market Forecast, 2021-2031 (US$ Mn, Tons, AGR%, CAGR%): "U" Shaped Recovery
Table 129 U.K. Bio LPG Market Forecast, 2021-2031 (US$ Mn, Tons, AGR%, CAGR%): "W" Shaped Recovery
Table 130 U.K. Bio LPG Market Forecast, 2021-2031 (US$ Mn, Tons, AGR%, CAGR%): "L" Shaped Recovery
Table 131 Germany Bio LPG Market Forecast, 2021-2031 (US$ Mn, Kilo Tons, AGR%, CAGR%)
Table 132 Germany Bio LPG Market Forecast, 2021-2031 (US$ Mn, Kilo Tons, AGR%, CAGR%): "V" Shaped Recovery
Table 133 Germany Bio LPG Market Forecast, 2021-2031 (US$ Mn, Kilo Tons, AGR%, CAGR%): "U" Shaped Recovery
Table 134 Germany Bio LPG Market Forecast, 2021-2031 (US$ Mn, Kilo Tons, AGR%, CAGR%): "W" Shaped Recovery
Table 135 Germany Bio LPG Market Forecast, 2021-2031 (US$ Mn, Kilo Tons, AGR%, CAGR%): "L" Shaped Recovery
Table 136 Rest of Europe Bio LPG Market Forecast, 2021-2031 (US$ Mn, Kilo Tons, AGR%, CAGR%)
Table 137 Rest of Europe Bio LPG Market Forecast, 2021-2031 (US$ Mn, Kilo Tons, AGR%, CAGR%): "V" Shaped Recovery
Table 138 Rest of Europe Bio LPG Market Forecast, 2021-2031 (US$ Mn, Kilo Tons, AGR%, CAGR%): "U" Shaped Recovery
Table 139 Rest of Europe Bio LPG Market Forecast, 2021-2031 (US$ Mn, Kilo Tons, AGR%, CAGR%): "W" Shaped Recovery
Table 140 Rest of Europe Bio LPG Market Forecast, 2021-2031 (US$ Mn, Kilo Tons, AGR%, CAGR%): "L" Shaped Recovery
Table 141 Asia Pacific Bio LPG Market by Country Forecast, 2021-2031 (US$ Mn, AGR%, CAGR%):
Table 142 Asia Pacific Bio LPG Market by Country Forecast, 2021-2031 (Kilo Tons, AGR%, CAGR%):
Table 143 Asia Pacific Bio LPG Market by Raw Material Forecast, 2021-2031 (US$ Mn, AGR%, CAGR%):
Table 144 Asia Pacific Bio LPG Market by Raw Material Forecast, 2021-2031 (Kilo Tons, AGR%, CAGR%):
Table 145 Asia Pacific Bio LPG Market by Raw Material Forecast, 2021-2031 (US$ Mn, AGR%, CAGR%): “V” Shaped Recovery
Table 146 Asia Pacific Bio LPG Market by Raw Material Forecast, 2021-2031 (Kilo Tons, AGR%, CAGR%): “V” Shaped Recovery
Table 147 Asia Pacific Bio LPG Market by Raw Material Forecast, 2021-2031 (US$ Mn, AGR%, CAGR%): “U” Shaped Recovery
Table 148 Asia Pacific Bio LPG Market by Raw Material Forecast, 2021-2031 (Kilo Tons, AGR%, CAGR%): “U” Shaped Recovery
Table 149 Asia Pacific Bio LPG Market by Raw Material Forecast, 2021-2031 (US$ Mn, AGR%, CAGR%): “W” Shaped Recovery
Table 150 Asia Pacific Bio LPG Market by Raw Material Forecast, 2021-2031 (Kilo Tons, AGR%, CAGR%): “W” Shaped Recovery
Table 151 Asia Pacific Bio LPG Market by Raw Material Forecast, 2021-2031 (US$ Mn, AGR%, CAGR%): “L” Shaped Recovery
Table 152 Asia Pacific Bio LPG Market by Raw Material Forecast, 2021-2031 (Kilo Tons, AGR%, CAGR%): “L” Shaped Recovery
Table 153 Asia Pacific Bio LPG Market by End-user Forecast, 2021-2031 (US$ Mn, AGR%, CAGR%):
Table 154 Asia Pacific Bio LPG Market by End-user Forecast, 2021-2031 (Kilo Tons, AGR%, CAGR%):
Table 155 Asia Pacific Bio LPG Market by End-user Forecast, 2021-2031 (US$ Mn, AGR%, CAGR%): “V” Shaped Recovery
Table 156 Asia Pacific Bio LPG Market by End-user Forecast, 2021-2031 (Kilo Tons, AGR%, CAGR%): “V” Shaped Recovery
Table 157 Asia Pacific Bio LPG Market by End-user Forecast, 2021-2031 (US$ Mn, AGR%, CAGR%): “U” Shaped Recovery
Table 158 Asia Pacific Bio LPG Market by End-user Forecast, 2021-2031 (Kilo Tons, AGR%, CAGR%): “U” Shaped Recovery
Table 159 Asia Pacific Bio LPG Market by End-user Forecast, 2021-2031 (US$ Mn, AGR%, CAGR%): “W” Shaped Recovery
Table 160 Asia Pacific Bio LPG Market by End-user Forecast, 2021-2031 (Kilo Tons, AGR%, CAGR%): “W” Shaped Recovery
Table 161 Asia Pacific Bio LPG Market by End-user Forecast, 2021-2031 (US$ Mn, AGR%, CAGR%): “L” Shaped Recovery
Table 162 Asia Pacific Bio LPG Market by End-user Forecast, 2021-2031 (Kilo Tons, AGR%, CAGR%): “L” Shaped Recovery
Table 163 India Bio LPG Market Forecast, 2021-2031 (US$ Mn, Kilo Tons, AGR%, CAGR%)
Table 164 India Bio LPG Market Forecast, 2021-2031 (US$ Mn, Kilo Tons, AGR%, CAGR%): "V" Shaped Recovery
Table 165 India Bio LPG Market Forecast, 2021-2031 (US$ Mn, Kilo Tons, AGR%, CAGR%): "U" Shaped Recovery
Table 166 India Bio LPG Market Forecast, 2021-2031 (US$ Mn, Kilo Tons, AGR%, CAGR%): "W" Shaped Recovery
Table 167 India Bio LPG Market Forecast, 2021-2031 (US$ Mn, Kilo Tons, AGR%, CAGR%): "L" Shaped Recovery
Table 168 Australia Bio LPG Market Forecast, 2021-2031 (US$ Mn, Kilo Tons, AGR%, CAGR%)
Table 169 Australia Bio LPG Market Forecast, 2021-2031 (US$ Mn, Kilo Tons, AGR%, CAGR%): "V" Shaped Recovery
Table 170 Australia Bio LPG Market Forecast, 2021-2031 (US$ Mn, Kilo Tons, AGR%, CAGR%): "U" Shaped Recovery
Table 171 Australia Bio LPG Market Forecast, 2021-2031 (US$ Mn, Kilo Tons, AGR%, CAGR%): "W" Shaped Recovery
Table 172 Australia Bio LPG Market Forecast, 2021-2031 (US$ Mn, Kilo Tons, AGR%, CAGR%): "L" Shaped Recovery
Table 173 Rest of Asia Pacific Bio LPG Market Forecast, 2021-2031 (US$ Mn, Tons, AGR%, CAGR%)
Table 174 Rest of Asia Pacific Bio LPG Market Forecast, 2021-2031 (US$ Mn, Tons, AGR%, CAGR%): "V" Shaped Recovery
Table 175 Rest of Asia Pacific Bio LPG Market Forecast, 2021-2031 (US$ Mn, Tons, AGR%, CAGR%): "U" Shaped Recovery
Table 176 Rest of Asia Pacific Bio LPG Market Forecast, 2021-2031 (US$ Mn, Tons, AGR%, CAGR%): "W" Shaped Recovery
Table 177 Rest of Asia Pacific Bio LPG Market Forecast, 2021-2031 (US$ Mn, Tons, AGR%, CAGR%): "L" Shaped Recovery
Table 178 Rest of the World Bio LPG Market by Raw Material Forecast, 2021-2031 (US$ Mn, AGR%, CAGR%):
Table 179 Rest of the World Bio LPG Market by Raw Material Forecast, 2021-2031 (Kilo Tons, AGR%, CAGR%):
Table 180 Rest of the World Bio LPG Market by Raw Material Forecast, 2021-2031 (US$ Mn, AGR%, CAGR%): “V” Shaped Recovery
Table 181 Rest of the World Bio LPG Market by Raw Material Forecast, 2021-2031 (Kilo Tons, AGR%, CAGR%): “V” Shaped Recovery
Table 182 Rest of the World Bio LPG Market by Raw Material Forecast, 2021-2031 (US$ Mn, AGR%, CAGR%): “U” Shaped Recovery
Table 183 Rest of the World Bio LPG Market by Raw Material Forecast, 2021-2031 (Kilo Tons, AGR%, CAGR%): “U” Shaped Recovery
Table 184 Rest of the World Bio LPG Market by Raw Material Forecast, 2021-2031 (US$ Mn, AGR%, CAGR%): “W” Shaped Recovery
Table 185 Rest of the World Bio LPG Market by Raw Material Forecast, 2021-2031 (Kilo Tons, AGR%, CAGR%): “W” Shaped Recovery
Table 186 Rest of the World Bio LPG Market by Raw Material Forecast, 2021-2031 (US$ Mn, AGR%, CAGR%): “L” Shaped Recovery
Table 187 Rest of the World Bio LPG Market by Raw Material Forecast, 2021-2031 (Kilo Tons, AGR%, CAGR%): “L” Shaped Recovery
Table 188 Rest of the World Bio LPG Market by End-user Forecast, 2021-2031 (US$ Mn, AGR%, CAGR%):
Table 189 Rest of the World Bio LPG Market by End-user Forecast, 2021-2031 (Kilo Tons, AGR%, CAGR%):
Table 190 Rest of the World Bio LPG Market by End-user Forecast, 2021-2031 (US$ Mn, AGR%, CAGR%): “V” Shaped Recovery
Table 191 Rest of the World Bio LPG Market by End-user Forecast, 2021-2031 (Kilo Tons, AGR%, CAGR%): “V” Shaped Recovery
Table 192 Rest of the World Bio LPG Market by End-user Forecast, 2021-2031 (US$ Mn, AGR%, CAGR%): “U” Shaped Recovery
Table 193 Rest of the World Bio LPG Market by End-user Forecast, 2021-2031 (Kilo Tons, AGR%, CAGR%): “U” Shaped Recovery
Table 194 Rest of the World Bio LPG Market by End-user Forecast, 2021-2031 (US$ Mn, AGR%, CAGR%): “W” Shaped Recovery
Table 195 Rest of the World Bio LPG Market by End-user Forecast, 2021-2031 (Kilo Tons, AGR%, CAGR%): “W” Shaped Recovery
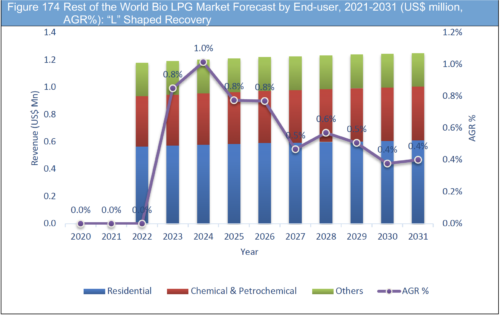
Table 196 Rest of the World Bio LPG Market by End-user Forecast, 2021-2031 (US$ Mn, AGR%, CAGR%): “L” Shaped Recovery
Table 197 Rest of the World Bio LPG Market by End-user Forecast, 2021-2031 (Kilo Tons, AGR%, CAGR%): “L” Shaped Recovery
Table 198 Neste Oil: Key Details, (CEO, HQ, Revenue, Founded, No. of Employees, Company Type, Website, Business Segment)
Table 199 Neste Oil: Product Benchmarking
Table 200 Neste Oil: Recent Developments, 2017-2020
Table 201 SQM S.A.: Key Details, (CEO, HQ, Revenue, Founded, No. of Employees, Company Type, Website, Business Segment)
Table 202 Preem AB: Product Benchmarking
Table 203 SQM S.A.: Recent Developments, 2017-2020
Table 204 Renewable Energy Group: Key Details, (CEO, HQ, Revenue, Founded, No. of Employees, Company Type, Website, Business Segment)
Table 205 Renewable Energy Group: Product Benchmarking
Table 206 Renewable Energy Group: Recent Developments, 2017-2020
Table 207 AvantiGas: Key Details, (CEO, HQ, Revenue, Founded, No. of Employees, Company Type, Website, Business Segment)
Table 208 AvantiGas: Recent Developments, 2017-2020
Table 209 Irving Oil: Key Details, (CEO, HQ, Revenue, Founded, No. of Employees, Company Type, Website, Business Segment)
Table 210 Irving Oil: Recent Developments, 2017-2020
Table 211 Global Bioenergies: Key Details, (CEO, HQ, Revenue, Founded, No. of Employees, Company Type, Website, Business Segment)
Table 212 Global Bioenergies: Recent Developments, 2017-2020
Table 213 Diamond Green Diesel: Key Details, (CEO, HQ, Revenue, Founded, No. of Employees, Company Type, Website, Business Segment)
Table 214 SHV Energy: Key Details, (CEO, HQ, Revenue, Founded, No. of Employees, Company Type, Website, Business Segment)
Table 215 SHV Energy: Product Benchmarking
Table 216 SHV Energy: Recent Developments, 2017-2020
Table 217 Total SE: Key Details, (CEO, HQ, Revenue, Founded, No. of Employees, Company Type, Website, Business Segment)
Table 218 Total SE: Recent Developments, 2017-2020
Table 219 ENI: Key Details, (CEO, HQ, Revenue, Founded, No. of Employees, Company Type, Website, Business Segment)
Table 220 ENI: Product Benchmarking
Table 221 ENI: Recent Developments, 2017-2020
Table 222 Cepsa: Key Details, (CEO, HQ, Revenue, Founded, No. of Employees, Company Type, Website, Business Segment)
Table 223 Cepsa: Product Benchmarking
Table 224 Cepsa: Recent Developments, 2017-2020
Table 225 Repsol: Key Details, (CEO, HQ, Revenue, Founded, No. of Employees, Company Type, Website, Business Segment)
Table 226 Repsol: Product Benchmarking
Table 227 Repsol: Recent Developments, 2017-2020
LIST OF FIGURES
Figure 1 Global Bio-LPG Market Segmentation
Figure 2 Global Bio-LPG Market-Research Methodology- Bottom-up Approach
Figure 3 Global Bio-LPG Market Overview
Figure 4 Global Biodiesel Production and Consumption Outlook, 2000-2019
Figure 5 Global Biodiesel Production, % Share, by Feedstock Used, 2020
Figure 6 Global Conventional LPG Consumption Statistics, 2018-2020
Figure 7 Carbon Footprints: Bio LPG VS Competitors
Figure 8 Natural Gas Price Trend, 2000-2019
Figure 9 Key Exchanges to Trade Carbon Credit Certificates
Figure 10 Global LPG Consumption, % Share, by Sector, 2019
Figure 11 Global Ethylene Production, by Feed Type
Figure 12 Porter’s Five Forces Analysis
Figure 13 Bio-LPG-Value Chain Analysis
Figure 14 SWOT Analysis
Figure 15 PEST Analysis
Figure 16 Regional Carbon Emission Trend, 2018-2019
Figure 17 Global Carbon Emission % Share, By Region, 2019
Figure 18 Natural Gas Production- Consumption, 2000-2019
Figure 19 Global Crude Oil Production-Consumption Outlook, 2000-2019
Figure 20 Bio-LPG Share in Global Conventional LPG Production, 2019 & 2030F
Figure 21 Global Bio LPG Market Forecast, by Raw Material 2021-2031 (US$ million, AGR %)
Figure 22 Global Bio LPG Market Share Forecast by Raw Material 2021, 2026, 2031 (%)
Figure 23 “V” Shaped Recovery: Global Bio LPG Market for Bio-oil Segment, Value Forecast 2021-2031 (US$ million, AGR%)
Figure 24 “U” Shaped Recovery: Global Bio LPG Market for Bio-oil Segment, Value Forecast 2021-2031 (US$ million, AGR%)
Figure 25 “W” Shaped Recovery: Global Bio LPG Market for Bio-oil Segment, Value Forecast 2021-2031 (US$ million, AGR%)
Figure 26 “L” Shaped Recovery: Global Bio LPG Market for Bio-oil Segment, Value Forecast 2021-2031 (US$ million, AGR%)
Figure 27 “V” Shaped Recovery: Global Bio LPG Market for Cellulosic Organic Waste Segment, Value Forecast 2021-2031 (US$ million, AGR%)
Figure 28 “U” Shaped Recovery: Global Bio LPG Market for Cellulosic Organic Waste Segment, Value Forecast 2021-2031 (US$ million, AGR%)
Figure 29 “W” Shaped Recovery: Global Bio LPG Market for Cellulosic Organic Waste Segment, Value Forecast 2021-2031 (US$ million, AGR%)
Figure 30 “L” Shaped Recovery: Global Bio LPG Market for Cellulosic Organic Waste Segment, Value Forecast 2021-2031 (US$ million, AGR%)
Figure 31 “V” Shaped Recovery: Global Bio LPG Market for Others Segment, Value Forecast 2021-2031 (US$ million, AGR%)
Figure 32 “U” Shaped Recovery: Global Bio LPG Market for Others Segment, Value Forecast 2021-2031 (US$ million, AGR%)
Figure 33 “W” Shaped Recovery: Global Bio LPG Market for Others Segment, Value Forecast 2021-2031 (US$ million, AGR%)
Figure 34 “L” Shaped Recovery: Global Bio LPG Market for Others Segment, Value Forecast 2021-2031 (US$ million, AGR%)
Figure 35 Global Bio LPG Market Forecast, by End-user 2021-2031 (US$ million, AGR %)
Figure 36 Global Bio LPG Market Share Forecast by End-user 2021, 2026, 2031 (%)
Figure 37 “V” Shaped Recovery: Global Bio LPG Market for Residential Segment, Value Forecast 2021-2031 (US$ million, AGR%)
Figure 38 “U” Shaped Recovery: Global Bio LPG Market for Residential Segment, Value Forecast 2021-2031 (US$ million, AGR%)
Figure 39 “W” Shaped Recovery: Global Bio LPG Market for Residential Segment, Value Forecast 2021-2031 (US$ million, AGR%)
Figure 40 “L” Shaped Recovery: Global Bio LPG Market for Residential Segment, Value Forecast 2021-2031 (US$ million, AGR%)
Figure 41 “V” Shaped Recovery: Global Bio LPG Market for Chemical & Petrochemical Segment, Value Forecast 2021-2031 (US$ million, AGR%)
Figure 42 “U” Shaped Recovery: Global Bio LPG Market for Chemical & Petrochemical Segment, Value Forecast 2021-2031 (US$ million, AGR%)
Figure 43 “W” Shaped Recovery: Global Bio LPG Market for Chemical & Petrochemical Segment, Value Forecast 2021-2031 (US$ million, AGR%)
Figure 44 “L” Shaped Recovery: Global Bio LPG Market for Chemical & Petrochemical Segment, Value Forecast 2021-2031 (US$ million, AGR%)
Figure 45 “V” Shaped Recovery: Global Bio LPG Market for Others Segment, Value Forecast 2021-2031 (US$ million, AGR%)
Figure 46 “U” Shaped Recovery: Global Bio LPG Market for Others Segment, Value Forecast 2021-2031 (US$ million, AGR%)
Figure 47 “W” Shaped Recovery: Global Bio LPG Market for Others Segment, Value Forecast 2021-2031 (US$ million, AGR%)
Figure 48 “L” Shaped Recovery: Global Bio LPG Market for Others Segment, Value Forecast 2021-2031 (US$ million, AGR%)
Figure 49 Global Bio LPG Market Forecast 2021-2031 (US$ million, AGR %)
Figure 50 Global Bio LPG Market Forecast 2021-2031 (Kilo Tons, AGR %)
Figure 51 Global Bio LPG Market Forecast by Region 2021-2031 (U$ Mn, AGR %)
Figure 52 Global Bio LPG Market Share Forecast, by region 2021, 2026, 2031 (%)
Figure 53 Global Bio LPG Market Forecast by Region 2021-2031 (U$ Mn, AGR %): “V” Shaped Recovery
Figure 54 Global Bio LPG Market Forecast by Region 2021-2031 (U$ Mn, AGR %): “U” Shaped Recovery
Figure 55 Global Bio LPG Market Forecast by Region 2021-2031 (U$ Mn, AGR %): “W” Shaped Recovery
Figure 56 Global Bio LPG Market Forecast by Region 2021-2031 (U$ Mn, AGR %): “L” Shaped Recovery
Figure 57 North America Bio LPG Market Forecast by Country 2021-2031 (US$ million)
Figure 58 North America Bio LPG Market Share Forecast by Country 2021, 2026, 2031 (%)
Figure 59 North America Bio LPG Market Forecast by Raw Material, 2021-2031 (US$ million, AGR%)
Figure 60 North America Bio LPG Market Forecast by Raw Material, 2021-2031 (US$ million, AGR%): “V” Shaped Recovery
Figure 61 North America Bio LPG Market Forecast by Raw Material, 2021-2031 (US$ million, AGR%): “U” Shaped Recovery
Figure 62 North America Bio LPG Market Forecast by Raw Material, 2021-2031 (US$ million, AGR%): “W” Shaped Recovery
Figure 63 North America Bio LPG Market Forecast by Raw Material, 2021-2031 (US$ million, AGR%): “L” Shaped Recovery
Figure 64 North America Bio LPG Market Forecast by End-user, 2021-2031 (US$ million, AGR%)
Figure 65 North America Bio LPG Market Forecast by End-user, 2021-2031 (US$ million, AGR%): “V” Shaped Recovery
Figure 66 North America Bio LPG Market Forecast by End-user, 2021-2031 (US$ million, AGR%): “U” Shaped Recovery
Figure 67 North America Bio LPG Market Forecast by End-user, 2021-2031 (US$ million, AGR%): “W” Shaped Recovery
Figure 68 North America Bio LPG Market Forecast by End-user, 2021-2031 (US$ million, AGR%): “L” Shaped Recovery
Figure 69 U.S. Bio LPG Market Forecast, 2021-2031 (US$ million, AGR %)
Figure 70 U.S. Bio LPG Market Forecast, 2021-2031 (US$ million, AGR%): “V” Shaped Recovery
Figure 71 U.S. Bio LPG Market Forecast, 2021-2031 (US$ million, AGR%): “U” Shaped Recovery
Figure 72 U.S. Bio LPG Market Forecast, 2021-2031 (US$ million, AGR%): “W” Shaped Recovery
Figure 73 U.S. Bio LPG Market Forecast, 2021-2031 (US$ million, AGR%): “L” Shaped Recovery
Figure 74 Canada Bio LPG Market Forecast, 2021-2031 (US$ million, AGR %)
Figure 75 Canada Bio LPG Market Forecast, 2021-2031 (US$ million, AGR%): “V” Shaped Recovery
Figure 76 Canada Bio LPG Market Forecast, 2021-2031 (US$ million, AGR%): “U” Shaped Recovery
Figure 77 Canada Bio LPG Market Forecast, 2021-2031 (US$ million, AGR%): “W” Shaped Recovery
Figure 78 Canada Bio LPG Market Forecast, 2021-2031 (US$ million, AGR%): “L” Shaped Recovery
Figure 79 Europe Bio LPG Market Forecast by Country 2021-2031 (US$ million)
Figure 80 Europe Bio LPG Market Share Forecast by Country 2021, 2026, 2031 (%)
Figure 81 Europe Bio LPG Market Forecast by Raw Material, 2021-2031 (US$ million, AGR%)
Figure 82 Europe Bio LPG Market Forecast by Raw Material, 2021-2031 (US$ million, AGR%): “V” Shaped Recovery
Figure 83 Europe Bio LPG Market Forecast by Raw Material, 2021-2031 (US$ million, AGR%): “U” Shaped Recovery
Figure 84 Europe Bio LPG Market Forecast by Raw Material, 2021-2031 (US$ million, AGR%): “W” Shaped Recovery
Figure 85 Europe Bio LPG Market Forecast by Raw Material, 2021-2031 (US$ million, AGR%): “L” Shaped Recovery
Figure 86 Europe Bio LPG Market Forecast by End-user, 2021-2031 (US$ million, AGR%)
Figure 87 Europe Bio LPG Market Forecast by End-user, 2021-2031 (US$ million, AGR%): “V” Shaped Recovery
Figure 88 Europe Bio LPG Market Forecast by End-user, 2021-2031 (US$ million, AGR%): “U” Shaped Recovery
Figure 89 Europe Bio LPG Market Forecast by End-user, 2021-2031 (US$ million, AGR%): “W” Shaped Recovery
Figure 90 Europe Bio LPG Market Forecast by End-user, 2021-2031 (US$ million, AGR%): “L” Shaped Recovery
Figure 91 Italy Bio LPG Market Forecast, 2021-2031 (US$ million, AGR %)
Figure 92 Italy Bio LPG Market Forecast, 2021-2031 (US$ million, AGR%): “V” Shaped Recovery
Figure 93 Italy Bio LPG Market Forecast, 2021-2031 (US$ million, AGR%): “U” Shaped Recovery
Figure 94 Italy Bio LPG Market Forecast, 2021-2031 (US$ million, AGR%): “W” Shaped Recovery
Figure 95 Italy Bio LPG Market Forecast, 2021-2031 (US$ million, AGR%): “L” Shaped Recovery
Figure 96 Denmark Bio LPG Market Forecast, 2021-2031 (US$ million, AGR %)
Figure 97 Denmark Bio LPG Market Forecast, 2021-2031 (US$ million, AGR%): “V” Shaped Recovery
Figure 98 Denmark Bio LPG Market Forecast, 2021-2031 (US$ million, AGR%): “U” Shaped Recovery
Figure 99 Denmark Bio LPG Market Forecast, 2021-2031 (US$ million, AGR%): “W” Shaped Recovery
Figure 100 Denmark Bio LPG Market Forecast, 2021-2031 (US$ million, AGR%): “L” Shaped Recovery
Figure 101 Ireland Bio LPG Market Forecast, 2021-2031 (US$ million, AGR %)
Figure 102 Ireland Bio LPG Market Forecast, 2021-2031 (US$ million, AGR%): “V” Shaped Recovery
Figure 103 Ireland Bio LPG Market Forecast, 2021-2031 (US$ million, AGR%): “U” Shaped Recovery
Figure 104 Ireland Bio LPG Market Forecast, 2021-2031 (US$ million, AGR%): “W” Shaped Recovery
Figure 105 Ireland Bio LPG Market Forecast, 2021-2031 (US$ million, AGR%): “L” Shaped Recovery
Figure 106 France Bio LPG Market Forecast, 2021-2031 (US$ million, AGR %)
Figure 107 France Bio LPG Market Forecast, 2021-2031 (US$ million, AGR%): “V” Shaped Recovery
Figure 108 France Bio LPG Market Forecast, 2021-2031 (US$ million, AGR%): “U” Shaped Recovery
Figure 109 France Bio LPG Market Forecast, 2021-2031 (US$ million, AGR%): “W” Shaped Recovery
Figure 110 France Bio LPG Market Forecast, 2021-2031 (US$ million, AGR%): “L” Shaped Recovery
Figure 111 Sweden Bio LPG Market Forecast, 2021-2031 (US$ million, AGR %)
Figure 112 Sweden Bio LPG Market Forecast, 2021-2031 (US$ million, AGR%): “V” Shaped Recovery
Figure 113 Sweden Bio LPG Market Forecast, 2021-2031 (US$ million, AGR%): “U” Shaped Recovery
Figure 114 Sweden Bio LPG Market Forecast, 2021-2031 (US$ million, AGR%): “W” Shaped Recovery
Figure 115 Sweden Bio LPG Market Forecast, 2021-2031 (US$ million, AGR%): “L” Shaped Recovery
Figure 116 U.K. Bio LPG Market Forecast, 2021-2031 (US$ million, AGR %)
Figure 117 U.K. Bio LPG Market Forecast, 2021-2031 (US$ million, AGR%): “V” Shaped Recovery
Figure 118 U.K. Bio LPG Market Forecast, 2021-2031 (US$ million, AGR%): “U” Shaped Recovery
Figure 119 U.K. Bio LPG Market Forecast, 2021-2031 (US$ million, AGR%): “W” Shaped Recovery
Figure 120 U.K. Bio LPG Market Forecast, 2021-2031 (US$ million, AGR%): “L” Shaped Recovery
Figure 121 Germany Bio LPG Market Forecast, 2021-2031 (US$ million, AGR %)
Figure 122 Germany Bio LPG Market Forecast, 2021-2031 (US$ million, AGR%): “V” Shaped Recovery
Figure 123 Germany Bio LPG Market Forecast, 2021-2031 (US$ million, AGR%): “U” Shaped Recovery
Figure 124 Germany Bio LPG Market Forecast, 2021-2031 (US$ million, AGR%): “W” Shaped Recovery
Figure 125 Germany Bio LPG Market Forecast, 2021-2031 (US$ million, AGR%): “L” Shaped Recovery
Figure 126 Rest of Europe Bio LPG Market Forecast, 2021-2031 (US$ million, AGR %)
Figure 127 Rest of Europe Bio LPG Market Forecast, 2021-2031 (US$ million, AGR%): “V” Shaped Recovery
Figure 128 Rest of Europe Bio LPG Market Forecast, 2021-2031 (US$ million, AGR%): “U” Shaped Recovery
Figure 129 Rest of Europe Bio LPG Market Forecast, 2021-2031 (US$ million, AGR%): “W” Shaped Recovery
Figure 130 Rest of Europe Bio LPG Market Forecast, 2021-2031 (US$ million, AGR%): “L” Shaped Recovery
Figure 131 Asia Pacific Bio LPG Market Forecast by Country 2021-2031 (US$ million)
Figure 132 Asia Pacific Bio LPG Market Share Forecast by Country 2021, 2026, 2031 (%)
Figure 133 Asia Pacific Bio LPG Market Forecast by Raw Material, 2021-2031 (US$ million, AGR%)
Figure 134 Asia Pacific Bio LPG Market Forecast by Raw Material, 2021-2031 (US$ million, AGR%): “V” Shaped Recovery
Figure 135 Asia Pacific Bio LPG Market Forecast by Raw Material, 2021-2031 (US$ million, AGR%): “U” Shaped Recovery
Figure 136 Asia Pacific Bio LPG Market Forecast by Raw Material, 2021-2031 (US$ million, AGR%): “W” Shaped Recovery
Figure 137 Asia Pacific Bio LPG Market Forecast by Raw Material, 2021-2031 (US$ million, AGR%): “L” Shaped Recovery
Figure 138 Asia Pacific Bio LPG Market Forecast by End-user, 2021-2031 (US$ million, AGR%)
Figure 139 Asia Pacific Bio LPG Market Forecast by End-user, 2021-2031 (US$ million, AGR%): “V” Shaped Recovery
Figure 140 Asia Pacific Bio LPG Market Forecast by End-user, 2021-2031 (US$ million, AGR%): “U” Shaped Recovery
Figure 141 Asia Pacific Bio LPG Market Forecast by End-user, 2021-2031 (US$ million, AGR%): “W” Shaped Recovery
Figure 142 Asia Pacific Bio LPG Market Forecast by End-user, 2021-2031 (US$ million, AGR%): “L” Shaped Recovery
Figure 143 India Bio LPG Market Forecast, 2021-2031 (US$ million, AGR %)
Figure 144 India Bio LPG Market Forecast, 2021-2031 (US$ million, AGR%): “V” Shaped Recovery
Figure 145 India Bio LPG Market Forecast, 2021-2031 (US$ million, AGR%): “U” Shaped Recovery
Figure 146 India Bio LPG Market Forecast, 2021-2031 (US$ million, AGR%): “W” Shaped Recovery
Figure 147 India Bio LPG Market Forecast, 2021-2031 (US$ million, AGR%): “L” Shaped Recovery
Figure 148 Australia Bio LPG Market Forecast, 2021-2031 (US$ million, AGR %)
Figure 149 Australia Bio LPG Market Forecast, 2021-2031 (US$ million, AGR%): “V” Shaped Recovery
Figure 150 Australia Bio LPG Market Forecast, 2021-2031 (US$ million, AGR%): “U” Shaped Recovery
Figure 151 Australia Bio LPG Market Forecast, 2021-2031 (US$ million, AGR%): “W” Shaped Recovery
Figure 152 Australia Bio LPG Market Forecast, 2021-2031 (US$ million, AGR%): “L” Shaped Recovery
Figure 153 Rest of Asia Pacific Bio LPG Market Forecast, 2021-2031 (US$ million, AGR %)
Figure 154 Rest of Asia Pacific Bio LPG Market Forecast, 2021-2031 (US$ million, AGR%): “V” Shaped Recovery
Figure 155 Rest of Asia Pacific Bio LPG Market Forecast, 2021-2031 (US$ million, AGR%): “U” Shaped Recovery
Figure 156 Rest of Asia Pacific Bio LPG Market Forecast, 2021-2031 (US$ million, AGR%): “W” Shaped Recovery
Figure 157 Rest of Asia Pacific Bio LPG Market Forecast, 2021-2031 (US$ million, AGR%): “L” Shaped Recovery
Figure 158 Rest of the World Bio LPG Market Forecast by Raw Material, 2021-2031 (US$ million, AGR%)
Figure 159 Rest of the World Bio LPG Market Forecast by Raw Material, 2021-2031 (US$ million, AGR%): “V” Shaped Recovery
Figure 160 Rest of the World Bio LPG Market Forecast by Raw Material, 2021-2031 (US$ million, AGR%): “U” Shaped Recovery
Figure 161 Rest of the World Bio LPG Market Forecast by Raw Material, 2021-2031 (US$ million, AGR%): “W” Shaped Recovery
Figure 162 Rest of the World Bio LPG Market Forecast by Raw Material, 2021-2031 (US$ million, AGR%): “L” Shaped Recovery
Figure 163 Rest of the World Bio LPG Market Forecast by End-user, 2021-2031 (US$ million, AGR%)
Figure 164 Rest of the World Bio LPG Market Forecast by End-user, 2021-2031 (US$ million, AGR%): “V” Shaped Recovery
Figure 165 Rest of the World Bio LPG Market Forecast by End-user, 2021-2031 (US$ million, AGR%): “U” Shaped Recovery
Figure 166 Rest of the World Bio LPG Market Forecast by End-user, 2021-2031 (US$ million, AGR%): “W” Shaped Recovery
Figure 167 Rest of the World Bio LPG Market Forecast by End-user, 2021-2031 (US$ million, AGR%): “L” Shaped Recovery
Figure 168 Global Bio LPG Market, Company Market Share % Analysis, 2020
Figure 169 Neste Oil: Net Revenue, 2016-2020 (US$ billion, AGR%)
Figure 170 Neste Oil: Regional Revenue Shares, 2020
Figure 171 Neste Oil: Segmental Revenue Shares, 2020
Figure 172 Preem AB: Net Revenue, 2016-2019 (US$ Billion, AGR%)
Figure 173 Preem AB: Sales Volume, by Region, 2019
Figure 174 Preem AB: Renewable Fuel Production, 2017-2019
Figure 175 Preem AB: Segmental Revenue/Market Share, 2020
Figure 176 Renewable Energy Group: Net Revenue, 2015-2019 (US$ billion, AGR%)
Figure 177 Renewable Energy Group.: Regional Revenue Shares, 2019
Figure 178 Renewable Energy Group: Segmental Revenue Share, 2019
Figure 179 SHV Energy: Net Revenue, 2016-2020 (US$ billion, AGR%)
Figure 180 Total SE: Net Revenue, 2016-2020 (US$ million, AGR%)
Figure 181 Total SE: Regional Revenue Shares, 2020
Figure 182 Total SE: Segmental Revenue Shares, 2020
Figure 183 ENI: Net Revenue, 2016-2020 (US$ Billion, AGR%)
Figure 184 ENI: Regional Revenue Shares, 2020
Figure 185 ENI: Segmental Revenue Shares, 2020
Figure 186 Cepsa: Net Revenue, 2016-2020 (US$ billion, AGR%)
Figure 187 Cepsa: Regional Revenue Shares, 2020
Figure 188 Cepsa: Segmental Revenue Shares, 2020
Figure 189 Repsol: Net Revenue, 2016-2020 (US$ billion, AGR%)
Figure 190 Repsol: Regional Revenue Shares, 2020
Figure 191 Repsol: Segmental Revenue Shares, 2020
Figure 192 Global Lithium Mining Market Forecast, by region, 2021-2031 (US$ Mn, AGR%)
AvantiGas
Calor Gas Ltd.
Cepsa
Diamond Green Diesel
ENI
Galp
Global Bioenergies
Indian Oil Corporation
Irving Oil
Neste Oil
Petrobras
Preem AB
Renewable Energy Group
Repsol
SHV Energy
Total SE
World Energy
List of Companies Mentioned in the Report:
AGA
AltAir Fuels
AvantiGas
BP
BSBios
Butagaz
CEPSA
ConocoPhillips
Diamond Green Diesel
Dynamic Fuels
Emerald Biofuels
Endicott Biofuels.
ENI
GALP
Global Bioenergies
Hitachi Zosen
Irving Oil
Kosangas
Neste Oil
Pertamina
Petrixo
Petrobras
Preem AB
Renewable Energy Group
REPSOL
SHV Energy
Sinopec
Total SE
UPM
Valero
List of Organizations Mentioned in the Report:
Argus Media
Biolpg — Liquid Gas UK
Gas Association of New Zealand
Gas Technology Institute, India
Iberoamerican Association of Liquefied Petroleum (AIGLP)
Indian Auto LPG Coalition (IAC)
Japan LP Gas Association
La Laguna University
Liquid Gas Ireland
Maharashtra LPG Distributors Association
Minnesota Propane Education Promotion and Safety Council
Mississippi University
National Propane Gas Association (NPGA)
Nigeria LPGAS Association
NIS, Serbia
Philippine Liquefied Petroleum Gas Association (PLPGA)
Sun Carbon
The Czech LPG Association (ČALPG)
The European LPG Association
The Global LPG Partnership
The Minnesota Propane Association (MPA)
U.S. Department of Energy (DOE)
U.S. Environmental Protection Agency (EPA)
World Liquefied Petroleum Gas Association (WLPGA)
World LPG Forum 2020
Download sample pages
Complete the form below to download your free sample pages for Bio-LPG Market Report 2021-2031Related reports
-
Waste to Energy (WtE) Market Report 2021-2031
The unpredictability and fluctuations of crude oil price in past two years and turmoil in energy markets has led countries...Full DetailsPublished: 28 April 2021 -
Anaerobic Digestion (AD) Market Report 2021-2031
The global anaerobic digestion (AD) market is being driven within the projected period, increased demand for renewable energy resources, rising...Full DetailsPublished: 09 July 2021
Download sample pages
Complete the form below to download your free sample pages for Bio-LPG Market Report 2021-2031Do you have any custom requirements we can help you with?
Any specific country, geo region, market segment or specific company information?
Email us today, we can discuss your needs and see how we can help: jamie.roberts@visiongain.com
Would you like a free report overview of the report of your choice?
If so, please drop an email to Jamie Roberts stating your chosen report title to jamie.roberts@visiongain.com
Visiongain energy reports are compiled using a broad and rich mixture of both primary and secondary information to produce an overall industry outlook. In order to provide our clients with the best product possible product, we do not rely on any one single source of information. Visiongain analysts reach out to market-leading vendors and industry experts where possible but also review a wealth of financial data and product information from a vast range of sources. To find out more about our reports methodology, please email jamie.roberts@visiongain.com
Would you like to get the latest Visiongain energy reports catalogue?
What are the dynamic growth sectors? where are the regional business opportunities?
Which technologies will prevail and who are the leading companies succeeding in these sectors and why?
If you want definitive answers to business critical questions, discover Visiongain’s full range of business intelligence reports.
If so, please email Jamie Roberts on jamie.roberts@visiongain.com or call her today on +44 207 336 6100
“The Visiongain report was extremely insightful and helped us construct our basic go-to market strategy for our solution.”
H.
“F.B has used Visiongain to prepare two separate market studies on the ceramic proppants market over the last 12 months. These reports have been professionally researched and written and have assisted FBX greatly in developing its business strategy and investment plans.”
F.B
“We just received your very interesting report on the Energy Storage Technologies (EST) Market and this is a very impressive and useful document on that subject.”
I.E.N
“Visiongain does an outstanding job on putting the reports together and provides valuable insight at the right informative level for our needs. The EOR Visiongain report provided confirmation and market outlook data for EOR in MENA with the leading countries being Oman, Kuwait and eventually Saudi Arabia.”
E.S
“Visiongain produced a comprehensive, well-structured GTL Market report striking a good balance between scope and detail, global and local perspective, large and small industry segments. It is an informative forecast, useful for practitioners as a trusted and upto-date reference.”
Y.N Ltd
Association of Dutch Suppliers in the Oil & Gas Industry
Society of Naval Architects & Marine Engineers
Association of Diving Contractors
Association of Diving Contractors International
Associazione Imprese Subacquee Italiane
Australian Petroleum Production & Exploration Association
Brazilian Association of Offshore Support Companies
Brazilian Petroleum Institute
Canadian Energy Pipeline
Diving Medical Advisory Committee
European Diving Technology Committee
French Oil and Gas Industry Council
IMarEST – Institute of Marine Engineering, Science & Technology
International Association of Drilling Contractors
International Association of Geophysical Contractors
International Association of Oil & Gas Producers
International Chamber of Shipping
International Shipping Federation
International Marine Contractors Association
International Tanker Owners Pollution Federation
Leading Oil & Gas Industry Competitiveness
Maritime Energy Association
National Ocean Industries Association
Netherlands Oil and Gas Exploration and Production Association
NOF Energy
Norsk olje og gass Norwegian Oil and Gas Association
Offshore Contractors’ Association
Offshore Mechanical Handling Equipment Committee
Oil & Gas UK
Oil Companies International Marine Forum
Ontario Petroleum Institute
Organisation of the Petroleum Exporting Countries
Regional Association of Oil and Natural Gas Companies in Latin America and the Caribbean
Society for Underwater Technology
Society of Maritime Industries
Society of Petroleum Engineers
Society of Petroleum Enginners – Calgary
Step Change in Safety
Subsea UK
The East of England Energy Group
UK Petroleum Industry Association
All the events postponed due to COVID-19.
Latest Energy news
Visiongain Publishes Carbon Capture Utilisation and Storage (CCUS) Market Report 2024-2034
The global carbon capture utilisation and storage (CCUS) market was valued at US$3.75 billion in 2023 and is projected to grow at a CAGR of 20.6% during the forecast period 2024-2034.
19 April 2024
Visiongain Publishes Liquid Biofuels Market Report 2024-2034
The global Liquid Biofuels market was valued at US$90.7 billion in 2023 and is projected to grow at a CAGR of 6.7% during the forecast period 2024-2034.
03 April 2024
Visiongain Publishes Hydrogen Generation Market Report 2024-2034
The global Hydrogen Generation market was valued at US$162.3 billion in 2023 and is projected to grow at a CAGR of 3.7% during the forecast period 2024-2034.
28 March 2024
Visiongain Publishes Biofuel Industry Market Report 2024-2034
The global Biofuel Industry market was valued at US$123.2 billion in 2023 and is projected to grow at a CAGR of 7.6% during the forecast period 2024-2034.
27 March 2024


