This latest report by business intelligence provider Visiongain assesses that the global Automotive Usage Based Insurance market is expected to grow at a lucrative rate during the forecast period. Explosives are divided into two categories namely primary explosives and secondary explosives. Primary explosives have a high degree of sensitivity to initiation through shock, friction, electric spark, or high temperatures and explode whether they are confined or unconfined. While secondary explosives are generally more powerful than primary explosives and can not be detonated readily by heat or shock.
Telematics refers to the combined usage of telecommunications and information technology for automobiles. It includes everything from GPS systems to entertainment systems. Telematics can exactly locate the exact position of the car, its speed and the behaviour of the car internally. It is most widely used for providing services such as roadside assistance, real-time navigation, vehicle tracking, and increasingly, car insurance.
With the rapid change in the technology, automotive manufacturers are coming up with innovative ideas for the use of telematics in their vehicles, of which telematics insurance is one significant concept. Usage-based insurance, also known as telematics insurance, whereby, the premium cost is subjected to the use of a vehicle, measured against, distance travelled, time of usage, and in-vehicle behavioural pattern of the driver. It is a recent innovation by auto insurers that closely aligns driving behaviours with risk to calculate the premium rates for auto insurance. Odometer readings or in-vehicle telematics devices self-installed into a vehicle port or already integrated into original equipment installed by car manufacturers are used to track the mileage and driving behaviours. The basic idea of telematics auto insurance is that a driver’s behaviour is monitored directly while the person drives. These telematics devices measure several elements of interest: time of day; miles drove; place (GPS); acceleration; hard braking; hard cornering; and airbag deployment. The level of accuracy depends on the data collected, the telematics technology employed and the user’s willingness to share their private data. The insurance provider then evaluates the data and accordingly charges the insurance premiums.
• Automotive Usage Based Insurance encompasses three discrete sub segments
• Global Automotive Usage Based Insurance market is segmented by Pricing Model, Data Collection, and Technology Incorporated
• Based on the pricing model the global usage-based insurance market is segmented as pay-as-you-drive (PAYD), pay-how-you-drive (PHYD), and manage-how-you-drive (MHYD)
• Based on the data collection technique the global usage-based insurance market is segmented as OBD-II, smartphone, hybrid, and black-box.
• Based on the technology incorporated the global usage-based insurance market is segmented as an application-based system and embedded based system.
• Based on the geographic penetration the global usage-based insurance market is segmented as North America, Europe, Asia-Pacific and Rest of World
The 204-page report provides clear, detailed insight into the global Automotive Usage Based Insurance market. Discover the key drivers and challenges affecting the market.
By ordering and reading our brand-new report today, you stay better informed and ready to act.
Report Scope
The report delivers considerable added value by revealing:
• 190 tables, charts and graphs are analysing and revealing the growth prospects and outlook for the Automotive Usage Based Insurance market.
• Global Automotive Usage Based Insurance market forecasts and analysis from 2020-2030.
• Automotive Usage Based Insurance market provides CAPEX forecasts and analysis from 2020-2030 for the Automotive Usage Based Insurance submarkets:
• Top 5 prominent Countries in the Automotive Usage Based Insurance market
• UK
• India
• Australia
• South Korea
• China
• Top 5 companies in the Automotive Usage Based Insurance market
• Allstate
• Progressive Corporation
• Generali S.A.
• Allainz SE
• Intelligent Mechatronic Systems Inc.
• Other companies of interest
Recent Companies Activity
• IMS was assigned patent title ‘space and time cognitive mobility system with distributed and cooperative intelligence capabilities’
• IMS was acquired by TRAK GLOBAL GROUP taking out IMS from receivership with aggressive plans to invest and add staff
• Octo Telematics partnered with RCI Bank and Services, Renault’s Global Finance Company to provide telematics services and advanced big data analytics to allow the Renault Group to enhance the driving experience of its customers worldwide
• Vodafone automotive announced partnership with electric vehicle start-up e.GO Mobile on an industry 4.0 factory
• Sierra Wireless announced partnership with MANN+HUMMEL, a leading global expert for filtration solutions. Under this partnership, Sierra Wireless will provide IOT connectivity services for its new predictive maintenance platform named Senzit.
• Axa Malaysia announced an average discount of 14% on their premiums for safe drivers on its usage based insurance product. The AXA FlexiDrive product helps motorists become more aware of their driving behavior by offering discounts of up to 20%, based on how safe they drive.
The report provides detailed profiles of key companies operating within the Automotive Usage Based Insurances market:
• Intelligent Mechatronic
• Octo Telematics
• Vodafone Automotive
• Wunelli
• Sierra Wireless
• Allstate
• AXA SA
• Progressive Corporation
• Generali S.P.A
• State Farm Mutual Automotive
• The Travelers Indemnity
• Allianz SE
• Nationwide
• Metromile Inc.
as well as key analysis and assessment of other important players
This independent, 200+ page report guarantees you will remain better informed than your competition. With more than 122 tables and figures examining the Automotive Usage Based Insurances market space, the report gives you a visual, one-stop breakdown of your market. PLUS capital expenditure forecasts, as well as analysis, from 2019 – 2029 keeps your knowledge that one step ahead that you require to succeed.
This report is essential reading for you or anyone in the Automotive sector with an interest in Automotive Usage Based Insurances. Purchasing this report today will help you to recognise those important market opportunities and understand the possibilities there. I look forward to receiving your order.
Visiongain is a trading partner with the US Federal Government
CCR Ref number: KD4R6
Do you have any custom requirements we can help you with? Any need for specific country, geo region, market segment or specific company information? Contact us today, we can discuss your needs and see how we can help: sara.peerun@visiongain.com
1. Report Overview
1.1 Overview of the Global Automotive Usage-Based Insurance Market 2020-2030
1.2 Why You Should Read This Report
1.3 How This Report Delivers
1.4 Key Questions Answered by This Analytical Report:
1.5 Who is This Report For?
1.6 Methodology
1.6.1 Primary Research
1.6.2 Secondary Research
1.6.3 Market Evaluation & Forecasting Methodology
1.7 Frequently Asked Questions (FAQ)
1.8 Associated Visiongain Reports
1.9 About Visiongain
2. Introduction to the Automotive Usage-Based Insurance (UBI) Market
2.1 Insurance Telematics Definition
2.2 History of the Global Automotive Usage-Based Insurance (UBI) Market
2.3 Benefits of Telematics Solutions
2.3.1 Discounts for Good Drivers
2.3.2 Reduced Downtime Due to Vehicle Breakdown
2.3.3 Encouraging Good Driving Habits
2.3.4 Accident Investigation Could Be Easier
2.3.5 Reducing the Frequency and Magnitude of Claims
2.4 The Target Audience for Usage-Based Insurance
2.4.1 Young Market
2.4.2 The Middle Market
2.4.3 The Senior Driver Segment
3. Global Automotive Usage-Based Insurance (UBI) Market
3.1 Global Usage-Based Insurance Segments Based on Pricing Model
3.1.1 Self-reporting Based Insurance
3.1.2 Telematics-Based Insurance
3.1.2.1 Pay-As-You-Drive (PAYD)
3.1.2.2 Pay-How-You-Drive (PHYD)
3.1.2.3 Manage-How-You-Drive (MHYD):
3.2 Global Usage-Based Insurance Segments Based on Data Collection Method
3.2.1 OBD II Based Telematics Insurance
3.2.2 Smartphone-Based Telematics Insurance
3.2.3 Hybrid Solution Based Telematics Insurance
3.2.4 Black-Box Insurance
3.3 Global Usage-Based Insurance Segments Based on Technology Incorporated
3.3.1 Application-based Telematics Insurance
3.3.2 Embedded System based Telematics Insurance
4. Global Automotive Usage-Based Insurance (UBI) Market 2020-2030
4.1 Global Automotive Usage-Based Insurance (UBI) Market (By Premium) Forecast 2020-2030
4.2 Global Automotive Usage-Based Insurance (UBI) Market (By Policyholders) Forecast 2020-2030
5. Global Automotive Usage-Based Insurance (UBI) by Policyholders Sub-Market Forecasts 2020-2030
5.1 Global Automotive Usage-Based Insurance (UBI) Sub-Market by Pricing Model 2020-2030
5.2 Global Automotive Usage-Based Insurance (UBI) Sub-Market by Data Collection Method 2020-2030
5.2.1 Global Automotive OBD-II Based UBI Solutions Submarket Forecast 2020-2030
5.2.2 Global Automotive Smartphone-Based UBI Solutions Submarket Forecast 2020-2030
5.2.3 Global Automotive Hybrid UBI Solutions Submarket Forecast 2020-2030
5.2.4 Global Automotive Black-Box Based UBI Solutions Submarket Forecast 2020-2030
5.3 Global Automotive Usage-Based Insurance (UBI) Sub-Market by Technology Incorporated 2020-2030
6. Regional Automotive Usage-Based Insurance (UBI) Market 2020-2030
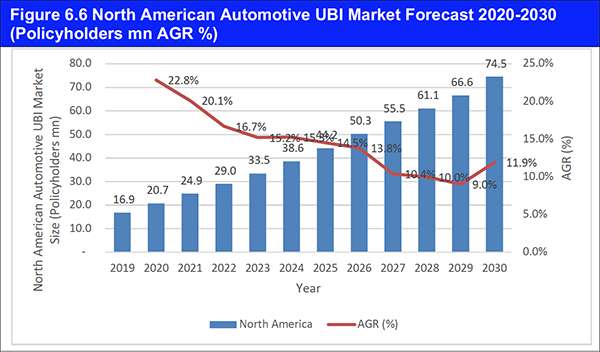
6.1 North American Automotive Usage-Based Insurance (UBI) Market Forecast 2020-2030
6.1.1 North America Automotive Usage-Based Insurance Market by Country 2020-2030
6.1.2 Drivers and Challenges of the North America Automotive Usage-Based Insurance Market 2020 - 2030
6.2 United States Automotive Usage-Based Insurance (UBI) Market Forecast 2020-2030
6.2.1 Drivers and Challenges of the United States Automotive Usage-Based Insurance Market 2020 - 2030
6.3 Canadian Automotive Usage-Based Insurance (UBI) Market Forecast 2020-2030
6.3.1 Drivers and Challenges of the Canadian Automotive Usage-Based Insurance Market 2020 - 2030
6.4 Rest of North America Automotive Usage-Based Insurance (UBI) Market Forecast 2020-2030
6.5 European Automotive Usage-Based Insurance (UBI) Market Forecast 2020-2030
6.5.1 European Automotive Usage-Based Insurance Market Forecast by Country 2020-2030
6.5.2 Drivers and Challenges of the European Automotive Usage-Based Insurance Market 2020-2030
6.6 United Kingdom Automotive Usage-Based Insurance (UBI) Market Forecast 2020-2030
6.6.1 Drivers and Challenges of the UK Automotive Usage-Based Insurance Market 2020-2030
6.7 Italian Automotive Usage-Based Insurance (UBI) Market Forecast 2020-2030
6.7.1 Drivers and Challenges of the Italian Automotive Usage-Based Insurance Market 2020-2030
6.8 French Automotive Usage-Based Insurance (UBI) Market Forecast 2020-2030
6.8.1 Drivers and Challenges of the French Automotive Usage-Based Insurance Market 2020-2030
6.9 German Automotive Usage-Based Insurance (UBI) Market Forecast 2020-2030
6.9.1 Drivers and Challenges of the German Automotive Usage-Based Insurance Market 2020-2030
6.10 Spanish Automotive Usage-Based Insurance (UBI) Market Forecast 2020-2030
6.10.1 Drivers and Challenges of the Spanish Automotive Usage-Based Insurance Market 2020-2030
6.11 Belgium Automotive Usage-Based Insurance (UBI) Market Forecast 2020-2030
6.12 Netherlands Automotive Usage-Based Insurance (UBI) Market Forecast 2020-2030
6.13 Rest of Europe Automotive Usage-Based Insurance (UBI) Market Forecast 2020-2030
6.14 APAC Automotive Usage-Based Insurance (UBI) Market Forecast 2020-2030
6.14.1 APAC Automotive Usage-Based Insurance Market by Country 2020-2030
6.14.2 Drivers and Challenges of the APAC Automotive Usage-Based Insurance Market 2020-2030
6.15 Chinese Automotive Usage-Based Insurance (UBI) Market Forecast 2020-2030
6.15.1 Drivers and Challenges of the Chinese Automotive Usage-Based Insurance Market 2020 - 2030
6.16 Japanese Automotive Usage-Based Insurance (UBI) Market Forecast 2020-2030
6.16.1 Drivers and Challenges of the Japanese Automotive Usage-Based Insurance Market 2020 - 2030
6.17 India Automotive Usage-Based Insurance (UBI) Market Forecast 2020-2030
6.17.1 Drivers and Challenges of the India Automotive Usage-Based Insurance Market 2019 – 2030
6.18 South Korea Automotive Usage-Based Insurance (UBI) Market Forecast 2020-2030
6.18.1 Drivers and Challenges of the South Korea Automotive Usage-Based Insurance Market 2019 – 2030
6.19 Australia Automotive Usage-Based Insurance (UBI) Market Forecast 2020-2030
6.19.1 Drivers and Challenges of the Australia Automotive Usage-Based Insurance Market 2019 – 2030
6.20 Rest of APAC Automotive Usage-Based Insurance (UBI) Market Forecast 2020-2030
6.21 Rest of World Automotive Usage-Based Insurance (UBI) Market Forecast 2020-2030
6.21.1 Drivers and Challenges of the Rest of World Automotive Usage-Based Insurance Sub-Market 2020-2030
6.22 Insurance Providers by Region
7. Market Drivers in the Automotive Usage-Based Insurance Market
7.1 UBI Program Are Cheaper to Offer
7.2 Government Encourages Telematics
7.3 Decreasing Claims Cost
7.4 Motor Insurance Regulations
7.5 Growing Smartphone Usage
7.6 Demand for Embedded Solution
7.7 The rise in Connected CaRS
7.8 Fleet Management Solutions Encourage UBI adoption
8. Market Challenges in the Automotive Usage-Based Insurance Market
8.1 Data Accuracy
8.2 Information Security Breach
8.3 Operational Issues
8.4 Standardisation Issue
9. SWOT Analysis of the Global Usage-Based Insurance Market 2020 - 2030
10. Five Forces Analysis of the Global Automotive Usage-Based Insurance Market 2020 - 2030
11. Value Chain Analysis for Usage Based Insurance Market
12. Trends in the UBI Automotive Market
12.1 Increasing Customer Retention
12.2 Reduced Dependence on smartphones
12.3 Shared Data Plans Increasing
12.4 Automakers Partnerships with Insurers
12.5 Use of Independent OBD Dongles
12.6 The Rise in Internet Speed
12.7 Growth of Big Data Platform
13. Opportunities for Service Providers in the Automotive Usage-Based Insurance Market
13.1 Application Development
13.2 Embedded Software
13.3 Infrastructure Development
13.4 Enterprise Application
13.5 Cybersecurity
13.6 Business Process Outsourcing (BPO)
13.7 Business Intelligence
13.8 System Integration
14. Leading Vendors in the Automotive Usage-Based Insurance (UBI) Market
14.1 Intelligent Mechatronic System Inc. (Part of Trak Global Group)
14.1.1 Overview
14.1.2 IMS’ Role in the Automotive UBI Market
14.1.3 IMS’ Recent Developments in the UBI Market
14.2 Octo Telematics S.p.A.
14.2.1 Overview
14.2.2 Octo Telematics’ Role in the Automotive UBI Market
14.2.3 Octo Telematics’ Recent Developments in the UBI Market
14.3 Vodafone Automotive
14.3.1 Overview
14.3.2 Vodafone Automotive’s Role in the Automotive UBI Market
14.3.3 Vodafone Automotive’s Key Developments in the UBI Market
14.4 Wunelli
14.4.1 Overview
14.4.2 Wunelli’s Role in the Automotive UBI Market
14.4.3 Wunelli’s Key Developments in the UBI Market
14.5 Sierra Wireless
14.5.1 Overview
14.5.2 Sierra Wireless’ Role in the Automotive UBI Market
14.5.3 Sierra Wireless Key Developments in the UBI Market
14.6 Other UBI Vendors
15. Leading Insurance Providers in the Automotive Usage-Based Insurance Market
15.1 Allstate
15.1.1 Overview
15.1.2 Allstate’s Financial Overview
15.1.3 Allstate’s Role in the Automotive UBI Market
15.1.4 Allstate’s Key Developments
15.2 AXA SA
15.2.1 Overview
15.2.2 AXA’s Financial Overview
15.2.3 AXA’s Role in the Automotive UBI Market
15.2.4 AXA’s Key Developments
15.3 Progressive Corporation
15.3.1 Overview
15.3.2 Progressive’s Financial Overview
15.3.3 Progressive’s Role in the Automotive UBI Market
15.3.4 Progressive’s Key Developments
15.4 Unipol Gruppo S.P.A
15.4.1 Overview
15.4.2 Unipol Gruppo’s Financial Overview
15.4.3 Unipol’s Role in the Automotive UBI Market
15.4.4 Unipol’s Key Developments
15.5 Generali S.P.A
15.5.1 Overview
15.5.2 Generali’s Financial Overview
15.5.3 Generali’s Role in the Automotive UBI Market
15.5.4 Generali’s Key Developments
15.6 State Farm Mutual Automobile Insurance Company
15.6.1 Overview
15.6.2 State Farm Mutual Automobile Insurance Company Financial Overview
15.6.3 State Farm Mutual Automobile Insurance Company Role in the Automotive UBI Market
15.6.4 State Farm Mutual Automobile Insurance Company Key Developments
15.7 The Travelers Indemnity Company
15.7.1 Overview
15.7.2 The Travelers Indemnity Company Financial Overview
15.7.3 The Travelers Indemnity Company Role in the Automotive UBI Market
15.7.4 The Travelers Companies, Inc. Key Developments
15.8 Allianz SE
15.8.1 Overview
15.8.2 Allianz SE Financial Overview
15.8.3 Allianz SE Role in the Automotive UBI Market
15.8.4 Allianz SE Key Developments
15.9 Nationwide
15.9.1 Overview
15.9.2 Nationwide Financial Overview
15.9.3 Nationwide Role in the Automotive UBI Market
15.9.4 Nationwide Key Developments
15.10 Metromile Inc.
15.10.1 Overview
15.10.2 Metromile Inc. Role in the Automotive UBI Market
15.10.3 Metromile Inc. Key Developments
15.11 Other Automotive UBI Insurance Companies
16. Conclusions and Recommendations
16.1 Key Findings
16.2 Key Highlights
17. Glossary
Appendix A
About Visiongain
Appendix B
Visiongain report evaluation form
Visiongain Report Sales Order Form
Associated Visiongain Reports
List of Figures
Fig.1 Global Explosives and Propellants Market Segmentation
Fig.2 Global Explosives and Propellants Market Definition
Fig.3 Global Explosives and Propellants Market Overview
Fig.4 Global Explosives and Propellants Market Value Chain Analysis
Fig.5 Global Explosives and Propellants Market Forecast 2020-2030 (US$Mn, AGR %)
Fig.6 Global Explosives and Propellants Market Share Forecast by Applications 2020, 2025, 2030 (% Share)
Fig.7 Global Explosives and Propellants Market Share Forecast by Propellant Type 2020, 2025, 2030 (% Share)
Fig.8 Regional Explosives and Propellants Market Forecast 2020-2030 (US$Mn, AGR%)
Fig.9 North America Explosives and Propellants Market Share Forecast by Applications 2020, 2025, 2030 (% Share)
Fig.10 North America Explosives and Propellants Market Forecast by Applications 2020-2030 (US$Mn, AGR%)
Fig.11 North America Explosives and Propellants Market Share Forecast by Propellant Type 2020, 2025, 2030 (% Share)
Fig.12 North America Explosives and Propellants Market Forecast by Propellant Type 2020-2030 (US$Mn, AGR%)
Fig.13 North America Explosives and Propellants Market Share Forecast by Country 2020, 2025, 2030 (% Share)
Fig.14 North America Explosives and Propellants Market Forecast by Country 2020-2030 (US$Mn, AGR%)
Fig.15 US Explosives and Propellants Market Forecast 2020-2030 (US$Mn, AGR%)
Fig.16 Canada Explosives and Propellants Market Forecast 2020-2030 (US$Mn, AGR%)
Fig.17 Europe Explosives and Propellants Market Share Forecast by Applications 2020, 2025, 2030 (% Share)
Fig.18 Europe Explosives and Propellants Market Forecast by Applications 2020-2030 (US$Mn, AGR%)
Fig.19 Europe Explosives and Propellants Market Share Forecast by Propellant Type 2020, 2025, 2030 (% Share)
Fig.20 Europe Explosives and Propellants Market Forecast by Propellant Type 2020-2030 (US$Mn, AGR%)
Fig.21 Europe Explosives and Propellants Market Share Forecast by Country 2020, 2025, 2030 (% Share)
Fig.22 Europe Explosives and Propellants Market Forecast by Country 2020-2030 (US$Mn, AGR%)
Fig.23 UK Explosives and Propellants Market Forecast 2020-2030 (US$Mn, AGR%)
Fig.24 Germany Explosives and Propellants Market Forecast 2020-2030 (US$Mn, AGR%)
Fig.25 Italy Explosives and Propellants Market Forecast 2020-2030 (US$Mn, AGR%)
Fig.26 France Explosives and Propellants Market Forecast 2020-2030 (US$Mn, AGR%)
Fig.27 Spain Explosives and Propellants Market Forecast 2020-2030 (US$Mn, AGR%)
Fig.28 Russia Explosives and Propellants Market Forecast 2020-2030 (US$Mn, AGR%)
Fig.29 Asia Pacific Explosives and Propellants Market Share Forecast by Applications 2020, 2025, 2030 (% Share)
Fig.30 Asia Pacific Explosives and Propellants Market Forecast by Applications 2020-2030 (US$Mn, AGR%)
Fig.31 Asia Pacific Explosives and Propellants Market Share Forecast by Propellant Type 2020, 2025, 2030 (% Share)
Fig.32 Asia Pacific Explosives and Propellants Market Forecast by Propellant Type 2020-2030 (US$Mn, AGR%)
Fig.33 Asia Pacific Explosives and Propellants Market Share Forecast by Country 2020, 2025, 2030 (% Share)
Fig.34 Asia Pacific Explosives and Propellants Market Forecast by Country 2020-2030 (US$Mn, AGR%)
Fig.35 Japan Explosives and Propellants Market Forecast 2020-2030 (US$Mn, AGR%)
Fig.36 China Explosives and Propellants Market Forecast 2020-2030 (US$Mn, AGR%)
Fig.37 India Explosives and Propellants Market Forecast 2020-2030 (US$Mn, AGR%)
Fig.38 South Korea Explosives and Propellants Market Forecast 2020-2030 (US$Mn, AGR%)
Fig.39 Singapore Explosives and Propellants Market Forecast 2020-2030 (US$Mn, AGR%)
Fig.40 Australia Explosives and Propellants Market Forecast 2020-2030 (US$Mn, AGR%)
Fig.41 Latin America Explosives and Propellants Market Share Forecast by Applications 2020, 2025, 2030 (% Share)
Fig.42 Latin America Explosives and Propellants Market Forecast by Applications 2020-2030 (US$Mn, AGR%)
Fig.43 Latin America Explosives and Propellants Market Share Forecast by Propellant Type 2020, 2025, 2030 (% Share)
Fig.44 Latin America Explosives and Propellants Market Forecast by Propellant Type 2020-2030 (US$Mn, AGR%)
Fig.45 Latin America Explosives and Propellants Market Share Forecast by Country 2020, 2025, 2030 (% Share)
Fig.46 Latin America Explosives and Propellants Market Forecast by Country 2020-2030 (US$Mn, AGR%)
Fig.47 Brazil Explosives and Propellants Market Forecast 2020-2030 (US$Mn, AGR%)
Fig.48 Mexico Explosives and Propellants Market Forecast 2020-2030 (US$Mn, AGR%)
Fig.49 Argentina Explosives and Propellants Market Forecast 2020-2030 (US$Mn, AGR%)
Fig.50 Rest of Latin America Explosives and Propellants Market Forecast 2020-2030 (US$Mn, AGR%)
Fig.51 MEA Explosives and Propellants Market Share Forecast by Applications 2020, 2025, 2030 (% Share)
Fig.52 MEA Explosives and Propellants Market Forecast by Applications 2020-2030 (US$Mn, AGR%)
Fig.53 MEA Explosives and Propellants Market Share Forecast by Propellant Type 2020, 2025, 2030 (% Share)
Fig.54 MEA Explosives and Propellants Market Forecast by Propellant Type 2020-2030 (US$Mn, AGR%)
Fig.55 MEA Explosives and Propellants Market Share Forecast by Country 2020, 2025, 2030 (% Share)
Fig.56 MEA Explosives and Propellants Market Forecast by Country 2020-2030 (US$Mn, AGR%)
Fig.57 Israel Explosives and Propellants Market Forecast 2020-2030 (US$Mn, AGR%)
Fig.58 South Africa Explosives and Propellants Market Forecast 2020-2030 (US$Mn, AGR%)
Fig.59 Saudi Arabia Explosives and Propellants Market Forecast 2020-2030 (US$Mn, AGR%)
Fig.60 UAE Explosives and Propellants Market Forecast 2020-2030 (US$Mn, AGR%)
Fig.61 Rest of MEA Explosives and Propellants Market Forecast 2020-2030 (US$Mn, AGR%)
Fig.62 Regional Explosives and Propellants Market Share Forecast 2020 (% Share)
Fig.63 Regional Explosives and Propellants Market Share Forecast 2025 (% Share)
Fig.64 Regional Explosives and Propellants Market Share Forecast 2030 (% Share)
Fig.65 Explosia Sales 2016-2018 (US$Mn, AGR %)
Fig.66 Explosia Net Income 2016-2018 (US$Mn, AGR %)
Fig.67 Explosia Company Structure 2019
Fig.68 Pakistan Ordnance Factories Sales 2016-2018 (US$Mn, AGR %)
Fig.69 Pakistan Ordnance Factories Net Income 2016-2018 (US$Mn, AGR %)
Fig.70 Pakistan Ordnance Factories Company Structure 2019
Fig.71 Australian Munitions Sales 2016-2018 (US$Mn, AGR %)
Fig.72 Australian Munitions Net Income 2016-2018 (US$Mn, AGR %)
Fig.73 Australian Munitions Company Structure 2019
Fig.74 Eurenco Sales 2016-2018 (US$Mn, AGR %)
Fig.75 Eurenco Net Income 2016-2018 (US$Mn, AGR %)
Fig.76 Eurenco Company Structure 2019
Fig.77 General Dynamics Sales 2016-2018 (US$Mn, AGR %)
Fig.78 General Dynamics Net Income 2016-2018 (US$Mn, AGR %)
Fig.79 General Dynamics Company Structure 2019
Fig.80 MAXAM Corp Sales 2016-2018 (US$Mn, AGR %)
Fig.81 MAXAM Corp Net Income 2016-2018 (US$Mn, AGR %)
Fig.82 MAXAM Corp Company Structure 2019
Fig.83 Rheinmetall Defence Sales 2016-2018 (US$Mn, AGR %)
Fig.84 Rheinmetall Defence Net Income 2016-2018 (US$Mn, AGR %)
Fig.85 Rheinmetall Defence Company Structure 2019
Fig.86 Olin Sales 2016-2018 (US$Mn, AGR %)
Fig.87 Olin Net Income 2016-2018 (US$Mn, AGR %)
Fig.88 Olin Company Structure 2019
Fig.89 Forcit Sales 2016-2018 (US$Mn, AGR %)
Fig.90 Forcit Net Income 2016-2018 (US$Mn, AGR %)
Fig.91 Forcit Company Structure 2019
Fig.92 Solar Group Sales 2016-2018 (US$Mn, AGR %)
Fig.93 Solar Group Net Income 2016-2018 (US$Mn, AGR %)
Fig.94 Solar Group Company Structure 2019
Fig.95 Serbian defence industrial facilities Sales 2016-2018 (US$Mn, AGR %)
Fig.96 Serbian defence industrial facilities Net Income 2016-2018 (US$Mn, AGR %)
Fig.97 Serbian defence industrial facilities Company Structure 2019
List of Tables
Table 1 Global Explosives and Propellants Market Forecast 2020-2030 (US$Mn, AGR%, CAGR %, Cumulative)
Table 2 Global Explosives and Propellants Market Forecast by Applications 2020-2030 (US$Mn, AGR%, CAGR %, Cumulative)
Table 3 Global Explosives and Propellants Market Forecast for the Commercial Sub-segment by Region 2020-2030 (US$Mn, AGR%, CAGR %, Cumulative)
Table 4 Global Explosives and Propellants Market Forecast for the Military Sub-segment by Region 2020-2030 (US$Mn, AGR%, CAGR %, Cumulative)
Table 5 Global Explosives and Propellants Market Forecast by Propellant Type 2020-2030 (US$Mn, AGR%, CAGR %, Cumulative)
Table 6 Global Explosives and Propellants Market Forecast for the Commercial Sub-segment by Region 2020-2030 (US$Mn, AGR%, CAGR %, Cumulative)
Table 7 Global Explosives and Propellants Market Forecast for the General & Business Aircrafts Sub-segment by Region 2020-2030 (US$Mn, AGR%, CAGR %, Cumulative)
Table 8 Global Explosives and Propellants Market Forecast for the Military Aircrafts Sub-segment by Region 2020-2030 (US$Mn, AGR%, CAGR %, Cumulative)
Table 9 Regional Explosives and Propellants Market Forecast 2020-2030 (US$Mn, AGR%, CAGR %, Cumulative)
Table 10 North America Explosives and Propellants Market Forecast by Applications 2020-2030 (US$Mn, AGR%, CAGR %, Cumulative)
Table 11 North America Explosives and Propellants Market Forecast by Propellant Type 2020-2030 (US$Mn, AGR%, CAGR %, Cumulative)
Table 12 North America Explosives and Propellants Market Forecast by Country 2020-2030 (US$Mn, AGR%, CAGR %, Cumulative)
Table 13 Europe Explosives and Propellants Market Forecast by Applications 2020-2030 (US$Mn, AGR%, CAGR %, Cumulative)
Table 14 Europe Explosives and Propellants Market Forecast by Propellant Type 2020-2030 (US$Mn, AGR%, CAGR %, Cumulative)
Table 15 Europe Explosives and Propellants Market Forecast by Country 2020-2030 (US$Mn, AGR%, CAGR %, Cumulative)
Table 16 Asia Pacific Explosives and Propellants Market Forecast by Applications 2020-2030 (US$Mn, AGR%, CAGR %, Cumulative)
Table 17 Asia Pacific Explosives and Propellants Market Forecast by Propellant Type 2020-2030 (US$Mn, AGR%, CAGR %, Cumulative)
Table 18 Asia Pacific Explosives and Propellants Market Forecast by Country 2020-2030 (US$Mn, AGR%, CAGR %, Cumulative)
Table 19 Latin America Explosives and Propellants Market Forecast by Applications 2020-2030 (US$Mn, AGR%, CAGR %, Cumulative)
Table 20 Latin America Explosives and Propellants Market Forecast by Propellant Type 2020-2030 (US$Mn, AGR%, CAGR %, Cumulative)
Table 21 Latin America Explosives and Propellants Market Forecast by Country 2020-2030 (US$Mn, AGR%, CAGR %, Cumulative)
Table 22 MEA Explosives and Propellants Market Forecast by Applications 2020-2030 (US$Mn, AGR%, CAGR %, Cumulative)
Table 23 MEA Explosives and Propellants Market Forecast by Propellant Type 2020-2030 (US$Mn, AGR%, CAGR %, Cumulative)
Table 24 MEA Explosives and Propellants Market Forecast by Country 2020-2030 (US$Mn, AGR%, CAGR %, Cumulative)
Table 25 Global Explosives and Propellants Market SWOT Analysis 2020-2030
Table 26 Leading Explosives and Propellants Companies 2019 (S.No., Company Name)
Table 27 Explosia Profile 2019 (CEO, Parent Company Sales US$Mn, Net Income, Business Segment in the Market, HQ, Founded, No. of Employees, Website)
Table 28 Explosia Key Developments 2014-2018 (Date, Strategy, Details)
Table 29 Explosia Sales 2016-2018 (US$Mn, AGR %)
Table 30 Explosia Net Income 2016-2018 (US$Mn, AGR %)
Table 31 Explosia Explosives and Propellants Market Products/Services (Segment of Business, Product, Specification / Features)
Table 32 Explosia SWOT Analysis 2018
Table 33 Pakistan Ordnance Factories Profile 2019 (CEO, Parent Company Sales US$Mn, Net Income, Business Segment in the Market, HQ, Founded, No. of Employees, Website)
Table 34 Pakistan Ordnance Factories Key Developments 2014-2018 (Date, Strategy, Details)
Table 35 Pakistan Ordnance Factories Sales 2016-2018 (US$Mn, AGR %)
Table 36 Pakistan Ordnance Factories Net Income 2016-2018 (US$Mn, AGR %)
Table 37 Pakistan Ordnance Factories Explosives and Propellants Market Products/Services (Segment of Business, Product, Specification / Features)
Table 38 Pakistan Ordnance Factories SWOT Analysis 2018
Table 39 Australian Munitions Profile 2019 (CEO, Parent Company Sales US$Mn, Net Income, Business Segment in the Market, HQ, Founded, No. of Employees, Website)
Table 40 Australian Munitions Key Developments 2014-2018 (Date, Strategy, Details)
Table 41 Australian Munitions Sales 2016-2018 (US$Mn, AGR %)
Table 42 Australian Munitions Net Income 2016-2018 (US$Mn, AGR %)
Table 43 Australian Munitions Explosives and Propellants Market Products/Services (Segment of Business, Product, Specification / Features)
Table 44 Australian Munitions SWOT Analysis 2018
Table 45 Eurenco Profile 2019 (CEO, Parent Company Sales US$Mn, Net Income, Business Segment in the Market, HQ, Founded, No. of Employees, Website)
Table 46 Eurenco Key Developments 2014-2018 (Date, Strategy, Details)
Table 47 Eurenco Sales 2016-2018 (US$Mn, AGR %)
Table 48 Eurenco Net Income 2016-2018 (US$Mn, AGR %)
Table 49 Eurenco Explosives and Propellants Market Products/Services (Segment of Business, Product, Specification / Features)
Table 50 Eurenco SWOT Analysis 2018
Table 51 General Dynamics Profile 2019 (CEO, Parent Company Sales US$Mn, Net Income, Business Segment in the Market, HQ, Founded, No. of Employees, Website)
Table 52 General Dynamics Key Developments 2014-2018 (Date, Strategy, Details)
Table 53 General Dynamics Sales 2016-2018 (US$Mn, AGR %)
Table 54 General Dynamics Net Income 2016-2018 (US$Mn, AGR %)
Table 55 General Dynamics Explosives and Propellants Market Products/Services (Segment of Business, Product, Specification / Features)
Table 56 General Dynamics SWOT Analysis 2018
Table 57 MAXAM Corp Profile 2019 (CEO, Parent Company Sales US$Mn, Net Income, Business Segment in the Market, HQ, Founded, No. of Employees, Website)
Table 58 MAXAM Corp Key Developments 2014-2018 (Date, Strategy, Details)
Table 59 MAXAM Corp Sales 2016-2018 (US$Mn, AGR %)
Table 60 MAXAM Corp Net Income 2016-2018 (US$Mn, AGR %)
Table 61 MAXAM Corp Explosives and Propellants Market Products/Services (Segment of Business, Product, Specification / Features)
Table 62 MAXAM Corp SWOT Analysis 2018
Table 63 Rheinmetall Defence Profile 2019 (CEO, Parent Company Sales US$Mn, Net Income, Business Segment in the Market, HQ, Founded, No. of Employees, Website)
Table 64 Rheinmetall Defence Key Developments 2014-2018 (Date, Strategy, Details)
Table 65 Rheinmetall Defence Sales 2016-2018 (US$Mn, AGR %)
Table 66 Rheinmetall Defence Net Income 2016-2018 (US$Mn, AGR %)
Table 67 Rheinmetall Defence Explosives and Propellants Market Products/Services (Segment of Business, Product, Specification / Features)
Table 68 Rheinmetall Defence SWOT Analysis 2018
Table 69 Olin Profile 2019 (CEO, Parent Company Sales US$Mn, Net Income, Business Segment in the Market, HQ, Founded, No. of Employees, Website)
Table 70 Olin Key Developments 2014-2018 (Date, Strategy, Details)
Table 71 Olin Sales 2016-2018 (US$Mn, AGR %)
Table 72 Olin Net Income 2016-2018 (US$Mn, AGR %)
Table 73 Olin Explosives and Propellants Market Products/Services (Segment of Business, Product, Specification / Features)
Table 74 Olin SWOT Analysis 2018
Table 75 Forcit Profile 2019 (CEO, Parent Company Sales US$Mn, Net Income, Business Segment in the Market, HQ, Founded, No. of Employees, Website)
Table 76 Forcit Key Developments 2014-2018 (Date, Strategy, Details)
Table 77 Forcit Sales 2016-2018 (US$Mn, AGR %)
Table 78 Forcit Net Income 2016-2018 (US$Mn, AGR %)
Table 79 Forcit Explosives and Propellants Market Products/Services (Segment of Business, Product, Specification / Features)
Table 80 Forcit SWOT Analysis 2018
Table 81 Solar Group Profile 2019 (CEO, Parent Company Sales US$Mn, Net Income, Business Segment in the Market, HQ, Founded, No. of Employees, Website)
Table 82 Solar Group Key Developments 2014-2018 (Date, Strategy, Details)
Table 83 Solar Group Sales 2016-2018 (US$Mn, AGR %)
Table 84 Solar Group Net Income 2016-2018 (US$Mn, AGR %)
Table 85 Solar Group Explosives and Propellants Market Products/Services (Segment of Business, Product, Specification / Features)
Table 86 Solar Group SWOT Analysis 2018
Table 87 Serbian defence industrial facilities Profile 2019 (CEO, Parent Company Sales US$Mn, Net Income, Business Segment in the Market, HQ, Founded, No. of Employees, Website)
Table 88 Serbian defence industrial facilities Key Developments 2014-2018 (Date, Strategy, Details)
Table 89 Serbian defence industrial facilities Sales 2016-2018 (US$Mn, AGR %)
Table 90 Serbian defence industrial facilities Net Income 2016-2018 (US$Mn, AGR %)
Table 91 Serbian defence industrial facilities Explosives and Propellants Market Products/Services (Segment of Business, Product, Specification / Features)
Table 92 Serbian defence industrial facilities SWOT Analysis 2018
AA Insurance
Admiral Group
Admiral Insurance
Agero
AIG Insurance
Aioi Nissay Dowa Insurance
Allianz
Allstate
Amaline Assurances
Amodo
AnyData
Apple
Arval
Assicurazioni Generali
Aston Martin
Atrack
Audi
Aviva
AXA Group
Baseline Telematics
Bentley
BMW
CalAmp
Capita
CCC (DriveFactor)
Censio
Chainway
CMT
Cobra Technologies
Corona Direct
Daimler
Danlaw
Desjardins
Detector
Direct Line
DirectChoice
Discovery Insurance
Driveway
Ducati
DXC Technology
Esurance
Ferrari
FMG Support
Generali
Gertab
GMAC (Ally Financial Inc.)
Grupo Nacional Provincial (GNP)
Gruppo Piaggio
Harman International
HastingDirect
Hubio
Hyundai
ICareU
ICICI Lombard
iGo4
iMetrix
Industrial Alliance
Infiniti
Infrasure
Insure the BoxIntact Financial Corporation
Intelligent Mechatronic Systems
Lamborghini
Launch
LexisNexis
LG
Liberty Mutual
MAAF
Macif
Maserati
McLaren
Mercedes Benz Trucks
MetaSystem
Metromile
Microsoft
MileMeter
Mitsubishi
MMA
Mobile Devices
Modus
MS&AD Insurance Group
MyDrive
Nationwide Insurance
Nissan
Novatel
Nvidia
Octo Telematics
Omoove
OnStar Corp
Orion
Pointer
Polis DirectPorsche
Progressive
Qualcomm
Quartix
Queclink
RAC
RCI Bank and Services
Redtail/Plextek
Reed Elsevier
Renault
Renesas
Rolls-Royce
RSA Insurance
SABRE
Safeco
Scope Technologies
Sierra Wireless
Singtel
Solly Azar
Sompo Japan
State Farm
Swinton
Tantalum
Telic
Tesla
The Co-operative Insurance
The Floow
TomTom
Toyota Motor Corporation
Tracl Global
Trak Global
Trakm8
UnipolSai
Uniqa
Verein öffentlicher Versicherer
Verizon Telematics
Verizon Wireless
Viasat
Vodafone Automotive
Volkswagen
Volvo
Wuerttembergische Versicherung
Wunelli
Xirgo Technologies
Yamaha
ZigBee
Organizations mentioned
China Communications Standards Association (CCSA)
China Insurance Regulatory Commission (CIRC)
European Telecommunications Standards Institute (ETSI)
National Association of Insurance Commissioners (NAIC)
Telecommunications Industry Association (TIA)

