Industries > Pharma > Antisense Oligonucleotide (ASO) Therapeutics Market Report 2021-2031
Antisense Oligonucleotide (ASO) Therapeutics Market Report 2021-2031
Forecasts by Therapeutic Area (Genetic Disorders, Neurological Disorders, Oncological Disorders, Metabolic Disorders, Ophthalmic Disorders, Other Therapeutic Areas), by Route of Administration (Pulmonary Delivery, Intravenous Injections, Intradermal Injections, Intraperitoneal Injections, Topical Delivery, Other Delivery Methods), by Type (Ribozyme, DNAzyme, Anti-Gene, Other Type) AND Regional and Leading National Market Analysis PLUS Analysis of Leading ASO Therapeutics Companies AND COVID-19 Recovery Scenarios
What is holding you back in the Antisense Oligonucleotide Therapeutics Business?
Antisense Oligonucleotide Therapeutics has great potential to target specific genes of interest in the context of precision medicine. Optimization of enhanced delivery, specificity, affinity, and nuclease resistance with reduced toxicity is underway in different disease context. This report gives a complete overview of antisense therapy and highlights its potential.
Our 360+ page report provides 275 tables, 191 charts, and graphs. Read on to discover the most lucrative areas in the industry and the future market prospects. Our new study lets you assess forecasted sales at overall world market and regional level. See financial results, trends, opportunities, and revenue predictions. Much opportunity remains in this growing antisense oligonucleotide therapeutics market. Buy our report to see how to exploit these opportunities in the global market.
Forecasts to 2031 and other analyses reveal the commercial prospects
• In addition to revenue forecasting to 2031, our new study provides you with recent results, growth rates, and market shares.
• You find original analyses, with business outlooks and developments.
• Discover qualitative analyses (including market dynamics, drivers, opportunities, restraints and challenges), Porter’s Five Forces Analysis, product profiles and commercial developments.
This report includes data analysis and invaluable insight into how COVID-19 will affect your industry. Access this report today.
To access the data contained in this document please email contactus@visiongain.com
Discover sales predictions for the global antisense oligonucleotide therapeutics market and submarkets
Over the last few years, the antisense oligonucleotide therapeutics has gained widespread attention due to the technological advancements and growth in understanding of the oligonucleotide therapeutics that inhabit the human body. Along with revenue prediction for the overall world market, there are 5 segmentations of the antisense oligonucleotide therapeutics market, with forecasts for 5 Therapeutic Area, 6 Route of Administration, 4 Types, each forecasted at a global, regional, and country level, along with COVID-19 impact recovery pattern analysis for all segments.
Leading companies and the potential for market growth
As per Visiongain analysis, global antisense oligonucleotide therapeutics market is estimated to be valued at US$xx billion in 2021 and is projected to reach at a market value of US$xx billion by 2031. We predict strong revenue growth through to 2031. Our work identifies which organizations hold the greatest potential. Discover their capabilities, progress, and commercial prospects, helping you stay ahead.
What Segments Are Covered in the Report?
Global Antisense Oligonucleotide Therapeutics Market by Therapeutic Area (COVID-19 Impact Recovery Analysis Covered)
• Genetic Disorders
• Neurological Disorders
• Oncological Disorders
• Metabolic Disorders
• Ophthalmic Disorders
• Other Therapeutic Areas
Global Antisense Oligonucleotide Therapeutics Market by Route of Administration (COVID-19 Impact Recovery Analysis Covered)
• Pulmonary Delivery
• Intravenous Injections
• Intradermal Injections
• Intraperitoneal Injections
• Topical Delivery
• Other Delivery Methods
Global Antisense Oligonucleotide Therapeutics Market by Type (COVID-19 Impact Recovery Analysis Covered)
• Ribozyme
• DNAzyme
• Anti-Gene
• Other Type
Global Antisense Oligonucleotide Therapeutics Market by Region (COVID-19 Impact Recovery Analysis Covered)
• North America
• Europe
• Asia-Pacific
• Latin America
• Middle East
• Africa
Need industry data? Please contact us today.
Which Key Players Are Leading the Global Market and how much Share do they Hold?
The global market for antisense oligonucleotide therapeutics is ascending and has made significant gains in treatments. The players in the antisense oligonucleotide therapeutics market are striving to tap the opportunities that this market offers. Companies are trying to explore the available prospects by adopting various strategies such as:
• Mergers and acquisitions.
• Product launches.
• Collaborations and partnerships.
Product approval is a major milestone facing all key competitors in the antisense oligonucleotide therapeutics market. Several strategies were implemented by key market players between 2015 and Jan 2021. There are over 50+ pharma companies involved in different aspects of antisense oligonucleotide therapeutics, including drugs, diagnostics, biomarkers, services, analyses and others.
How the Antisense Oligonucleotide Therapeutics Market report helps you? Buy this report to find answers for below questions and how can help you to stay updated
• What is the current size of the overall antisense oligonucleotide therapeutics market? How much will this market be worth from 2021 to 2031?
• How will market shares of the leading national markets change by 2031, and which geographical region will lead the market in 2031?
• Who are the leading companies and what are their activities, results, developments and prospects?
• What are some of the most prominent antisense oligonucleotide therapeutics currently in development?
• What are the main trends that will affect the world antisense oligonucleotide therapeutics market between 2021 and 2031?
• What are the main strengths, weaknesses, opportunities and threats for the market?
• What are the social, technological, economic and political influences that will shape that industry over the next ten years?
• How will the global antisense oligonucleotide therapeutics market evolve over the forecasted period, 2021 to 2031?
• Which therapies can succeed and what revenues could they generate to 2031?
• What will be the main commercial drivers for the antisense oligonucleotide therapeutics market from 2021 to 2031?
• How will market shares of prominent national markets change from 2021, and which countries will lead the market in 2031, achieving highest revenues and fastest growth?
• How will that industry evolve between 2021 and 2031, especially in R&D?
Top 10 Leading Players Profiled in the Report
• Ionis Pharmaceuticals, Inc.
• Sarepta Therapeutics, Inc.
• Biogen Inc.
• Alnylam Pharmaceuticals, Inc.
• Antisense Therapeutics Limited (ANP)
• Arrowhead Pharmaceuticals, Inc.,
• Enzon Pharmaceuticals, Inc.
• Bio-Path Holdings, Inc.
• GlaxoSmithKline PLC
• Geron Corporation (Geron)
Find quantitative and qualitative analyses with independent predictions. Receive information that only our report contains, staying informed with this invaluable business intelligence.
Information found nowhere else
With our newly report title, you are less likely to fall behind in knowledge or miss out on opportunities. See how our work could benefit your research, analyses, and decisions. Visiongain’s study is for everybody needing commercial analyses for the Antisense Oligonucleotide Therapeutics Market and leading companies. You will find data, trends and predictions.
To access the data contained in this document please email contactus@visiongain.com
Buy our report today Antisense Oligonucleotide (ASO) Therapeutics Market Report 2021-2031: Forecasts by Therapeutic Area (Genetic Disorders, Neurological Disorders, Oncological Disorders, Metabolic Disorders, Ophthalmic Disorders, Other Therapeutic Areas), by Route of Administration (Pulmonary Delivery, Intravenous Injections, Intradermal Injections, Intraperitoneal Injections, Topical Delivery, Other Delivery Methods), by Type (Ribozyme, DNAzyme, Anti-Gene, Other Type) AND Regional and Leading National Market Analysis PLUS Analysis of Leading ASO Therapeutics Companies AND COVID-19 Recovery Scenarios. Avoid missing out by staying informed – order our report now.
Visiongain is a trading partner with the US Federal Government
CCR Ref number: KD4R6
Do you have any custom requirements we can help you with? Any need for a specific country, geo region, market segment or specific company information? Contact us today, we can discuss your needs and see how we can help: sara.peerun@visiongain.com
1.1 Global Antisense Oligonucleotide Therapeutics Market Overview
1.2 Study Goals and Objectives
1.3 Why You Should Read This Report
1.4 How This Report Delivers
1.5 Key Questions Answered by This Analytical Report Include:
1.6 Who is This Report For?
1.7 Methodology
1.7.1 Primary Research
1.7.2 Secondary Research
1.7.3 Data Sources
1.8 Market Evaluation & Forecasting Methodology
1.9 COIVD-19 Impact Recovery Pattern Analysis
1.9.1 V-Shaped Recovery
1.9.2 U-Shaped Recovery
1.9.3 W-Shaped Recovery
1.9.4 L-Shaped Recovery
1.10 Frequently Asked Questions (FAQ)
1.11 Associated Visiongain Reports
1.12 About Visiongain
2 Executive Summary
2.1 Chemical modifications of antisense oligonucleotides (ASO)
3 Antisense Oligonucleotide Therapeutics Products and Technology Overview
3.1 Introduction to Nucleic Acid Technologies
3.2 Genetic Variation and Analysis
3.2.1 Sequencing Technologies
3.2.2 Sanger Sequencing
3.3 Next-generation Sequencing
3.3.1 DNA Write (Synthesis) Technologies
3.4 PCR-Based Approaches
3.5 Solid-Phase-Based Approaches
3.5.1 Microfluidic Technologies
3.5.2 DNA Microarrays
3.6 Gene Editing Technologies
3.7 CRISPR Enzyme Technologies
3.8 Gene Editing Delivery Technologies
3.9 Viral Delivery Technologies
4 DNA Read, Write and Edit Initiatives
4.1 Initiatives
4.2 American Gut Consortium
4.2.1 BabySeq
4.2.2 Blood Profiling Atlas
4.2.3 Cancer-ID
4.2.4 Cancer Moon Shots Program
4.2.5 China Precision Medicine Initiative
4.2.6 Clinical Genome Resource
4.2.7 Epigenetics for Females Personalized Cancer Care
4.2.8 France Genomic Medicine Plan
4.2.9 Friends of Cancer Research Project
4.3 Gene Therapy Initiative
4.3.1 Immunomonitor Consortium
4.3.2 Integration of Imaging and Fluid-based Tumor Monitoring in Cancer Therapy Program
4.3.3 Laboratory for Genomics Research
4.3.4 Lung Cancer Master Protocol Project
4.3.5 Matchmaker Exchange
4.3.6 Medical Genome Initiative
4.3.7 Million Veteran Program
4.3.8 Molecular Integration in Neurological Diagnosis
4.3.9 MedSeq
4.4 National Microbiome Initiative
4.4.1 Next-generation Single Cell Analysis Program
4.4.2 Precision Medicine Initiative
4.4.3 Prospective Registry of Multiple Testing
4.4.4 Quality Assurance Initiative Pathology Project
4.4.5 Somatic Cell Genome Editing Program
4.4.6 Trans Omics for Precision Medicine Initiative
4.4.7 Population Sequencing Programs
5 Market Dynamics
5.1 Overview
5.2 SWOT Analysis
5.3 Drivers of Antisense Oligonucleotide Therapeutics Market
5.3.1 High Unmet Medical Need
5.3.2 Positive Investment Environment
5.3.3 Strong Pipeline
5.3.4 Acceptance from Regulatory Authorities
5.4 Challenges for Antisense Oligonucleotide Therapeutics Market
5.4.1 Lack of Regulatory Guidance
5.4.2 Need for Skilled Labor
5.5 Opportunities for Antisense Oligonucleotide Therapeutics Market
5.5.1 Emerging Markets
5.5.2 Development of Better Diagnostic Methods
5.5.3 Acquisitions and Partnerships
5.6 Threats to the Antisense Oligonucleotide Therapeutics Market
5.6.1 New Government Regulations
5.6.2 Stiff Competition in the Global Market
5.7 Porter's Five Forces Analysis of the Antisense Oligonucleotide Therapeutics Market
5.7.1 Bargaining Power Of Suppliers-Low
5.7.2 Bargaining Power of Buyers-High
5.7.3 Intensity of Competition-High
5.7.4 Threat of Substitute Products-High
5.7.5 Threat of New Entrants-High
6 Global Antisense Oligonucleotide (ASO) Therapeutics Market Analysis
6.1 Global Market Outlook
6.1.1 FDA Approved Formulations
6.2 Global Market Size Estimation and Forecast
6.2.1 Pre-COVID-19 Market Analysis
6.2.2 Post COVID-19 Market Analysis (V, W, U, L Shaped Recovery Scenarios)
6.3 Global Market Breakdown by Region
6.3.1 Pre-COVID-19 Market Analysis
6.3.2 Post COVID-19 Market Analysis (V, W, U, L Shaped Recovery Scenarios)
6.4 Global Market Breakdown by Therapeutic Area
6.4.1 Antisense Oligonucleotide‑Based Therapy in Neuromuscular Disorders
6.4.2 Pre-COVID-19 Market Analysis
6.4.3 Post COVID-19 Market Analysis (V, W, U, L Shaped Recovery Scenarios)
6.5 Global Market Breakdown by Route of Administration
6.5.1 Enhanced Stabilization Chemistry-Based Delivery
6.5.2 Nanoformulation-Based Delivery
6.5.3 Lipid-Based Delivery Systems
6.5.4 Pre-COVID-19 Market Analysis
6.5.5 Post COVID-19 Market Analysis (V, W, U, L Shaped Recovery Scenarios)
6.6 Global Market Breakdown by Type
6.6.1 Antisense Therapy For Cancer
6.6.2 Antisense Therapy For Cardiovascular Diseases
6.6.3 Antisense Therapy For Inflammation And Autoimmune Diseases
6.6.4 Antisense Therapy In Neurological Disorders
6.6.5 Antisense Therapy For Infectious Diseases
6.6.6 Pre-COVID-19 Market Analysis
6.6.7 Post COVID-19 Market Analysis (V, W, U, L Shaped Recovery Scenarios)
7 North America Antisense Oligonucleotide Therapeutics Market Outlook
7.1 North America Market Overview
7.2 North America Market Size Estimation and Forecast
7.2.1 Pre-COVID-19 Market Analysis
7.2.2 Post COVID-19 Market Analysis (V, W, U, L Shaped Recovery Scenarios)
7.3 North America Market Breakdown by Country
7.3.1 Pre-COVID-19 Market Analysis
7.3.2 Post COVID-19 Market Analysis (V, W, U, L Shaped Recovery Scenarios)
7.4 North America Market Breakdown by Therapeutic Area
7.4.1 Pre-COVID-19 Market Analysis
7.4.2 Post COVID-19 Market Analysis (V, W, U, L Shaped Recovery Scenarios)
7.5 North America Market Breakdwon by Route of Administration
7.5.1 Pre-COVID-19 Market Analysis
7.5.2 Post COVID-19 Market Analysis (V, W, U, L Shaped Recovery Scenarios)
7.6 North America Market Breakdown by Type
7.6.1 Pre-COVID-19 Market Analysis
7.6.2 Post COVID-19 Market Analysis (V, W, U, L Shaped Recovery Scenarios)
7.7 US Antisense Oligonucleotide Therapeutics Market Outlook
7.7.1 Country Market Overview
7.7.2 Pre-COVID-19 Market Analysis
7.7.3 Post COVID-19 Market Analysis (V, W, U, L Shaped Recovery Scenarios)
7.8 Canada Antisense Oligonucleotide Therapeutics Market Outlook
7.8.1 Country Market Overivew
7.8.2 Pre-COVID-19 Market Analysis
7.8.3 Post COVID-19 Market Analysis (V, W, U, L Shaped Recovery Scenarios)
8 Europe Antisense Oligonucleotide Therapeutics Market Outlook
8.1 Europe Market Overview
8.2 Europe Market Size Estimation and Forecast
8.2.1 Pre-COVID-19 Market Analysis
8.2.2 Post COVID-19 Market Analysis (V, W, U, L Shaped Recovery Scenarios)
8.3 Europe Market Breakdown by Country
8.3.1 Pre-COVID-19 Market Analysis
8.3.2 Post COVID-19 Market Analysis (V, W, U, L Shaped Recovery Scenarios)
8.4 Europe Market Breakdown by Therapeutic Area
8.4.1 Pre-COVID-19 Market Analysis
8.4.2 Post COVID-19 Market Analysis (V, W, U, L Shaped Recovery Scenarios)
8.5 Europe Market Breakdwon by Route of Administration
8.5.1 Pre-COVID-19 Market Analysis
8.5.2 Post COVID-19 Market Analysis (V, W, U, L Shaped Recovery Scenarios)
8.6 Europe Market Breakdown by Type
8.6.1 Pre-COVID-19 Market Analysis
8.6.2 Post COVID-19 Market Analysis (V, W, U, L Shaped Recovery Scenarios)
8.7 Germany Antisense Oligonucleotide Therapeutics Market Outlook
8.7.1 Country Overview
8.7.2 Pre-COVID-19 Market Analysis
8.7.3 Post COVID-19 Market Analysis (V, W, U, L Shaped Recovery Scenarios)
8.8 UK Antisense Oligonucleotide Therapeutics Market Outlook
8.8.1 Country Market Overview
8.8.2 Pre-COVID-19 Market Analysis
8.8.3 Post COVID-19 Market Analysis (V, W, U, L Shaped Recovery Scenarios)
8.9 France Antisense Oligonucleotide Therapeutics Market Outlook
8.9.1 Country Market Overview
8.9.2 Pre-COVID-19 Market Analysis
8.9.3 Post COVID-19 Market Analysis (V, W, U, L Shaped Recovery Scenarios)
8.10 Italy Antisense Oligonucleotide Therapeutics Market Outlook
8.10.1 Country Market Overview
8.10.2 Pre-COVID-19 Market Analysis
8.10.3 Post COVID-19 Market Analysis (V, W, U, L Shaped Recovery Scenarios)
8.11 Spain Antisense Oligonucleotide Therapeutics Market Outlook
8.11.1 Country Market Overview
8.11.2 Pre-COVID-19 Market Analysis
8.11.3 Post COVID-19 Market Analysis (V, W, U, L Shaped Recovery Scenarios)
8.12 Rest of Europe Antisense Oligonucleotide Therapeutics Market Outlook
8.12.1 Pre-COVID-19 Market Analysis
8.12.2 Post COVID-19 Market Analysis (V, W, U, L Shaped Recovery Scenarios)
9 Asia-Pacific Antisense Oligonucleotide Therapeutics Market Outlook
9.1 Asia-Pacific Market Overview
9.2 Asia-Pacific Market Size Estimation and Forecast
9.2.1 Pre-COVID-19 Market Analysis
9.2.2 Post COVID-19 Market Analysis (V, W, U, L Shaped Recovery Scenarios)
9.3 Asia-Pacific Market Breakdown by Country
9.3.1 Pre-COVID-19 Market Analysis
9.3.2 Post COVID-19 Market Analysis (V, W, U, L Shaped Recovery Scenarios)
9.4 Asia-Pacific Market Breakdown by Therapeutic Area
9.4.1 Pre-COVID-19 Market Analysis
9.4.2 Post COVID-19 Market Analysis (V, W, U, L Shaped Recovery Scenarios)
9.5 Asia-Pacific Market Breakdwon by Route of Administration
9.5.1 Pre-COVID-19 Market Analysis
9.5.2 Post COVID-19 Market Analysis (V, W, U, L Shaped Recovery Scenarios)
9.6 Asia-Pacific Market Breakdown by Type
9.6.1 Pre-COVID-19 Market Analysis
9.6.2 Post COVID-19 Market Analysis (V, W, U, L Shaped Recovery Scenarios)
9.7 China Antisense Oligonucleotide Therapeutics Market Outlook
9.7.1 Country Market Overview
9.7.2 Pre-COVID-19 Market Analysis
9.7.3 Post COVID-19 Market Analysis (V, W, U, L Shaped Recovery Scenarios)
9.8 India Antisense Oligonucleotide Therapeutics Market Outlook
9.8.1 Country Market Overview
9.8.2 Pre-COVID-19 Market Analysis
9.8.3 Post COVID-19 Market Analysis (V, W, U, L Shaped Recovery Scenarios)
9.9 Japan Antisense Oligonucleotide Therapeutics Market Outlook
9.9.1 Country Market Overview
9.9.2 Pre-COVID-19 Market Analysis
9.9.3 Post COVID-19 Market Analysis (V, W, U, L Shaped Recovery Scenarios)
9.10 South Korea Antisense Oligonucleotide Therapeutics Market Outlook
9.10.1 Country Market Overview
9.10.2 Pre-COVID-19 Market Analysis
9.10.3 Post COVID-19 Market Analysis (V, W, U, L Shaped Recovery Scenarios)
9.11 Australia Antisense Oligonucleotide Therapeutics Market Outlook
9.11.1 Pre-COVID-19 Market Analysis
9.11.2 Post COVID-19 Market Analysis (V, W, U, L Shaped Recovery Scenarios)
9.12 Rest of Asia-Pacific Antisense Oligonucleotide Therapeutics Market Outlook
9.12.1 Pre-COVID-19 Market Analysis
9.12.2 Post COVID-19 Market Analysis (V, W, U, L Shaped Recovery Scenarios)
10 Latin America, Middle East & Africa Antisense Oligonucleotide Therapeutics Market Outlook
10.1 LAMEA Market Overview
10.2 LAMEA Market Size Estimation and Forecast
10.2.1 Pre-COVID-19 Market Analysis
10.2.2 Post COVID-19 Market Analysis (V, W, U, L Shaped Recovery Scenarios)
10.3 LAMEA Market Breakdown by Country
10.3.1 Pre-COVID-19 Market Analysis
10.3.2 Post COVID-19 Market Analysis (V, W, U, L Shaped Recovery Scenarios)
10.4 LAMEA Market Breakdown by Therapeutic Area
10.4.1 Pre-COVID-19 Market Analysis
10.4.2 Post COVID-19 Market Analysis (V, W, U, L Shaped Recovery Scenarios)
10.5 LAMEA Market Breakdwon by Route of Administration
10.5.1 Pre-COVID-19 Market Analysis
10.5.2 Post COVID-19 Market Analysis (V, W, U, L Shaped Recovery Scenarios)
10.6 LAMEA Market Breakdown by Type
10.6.1 Pre-COVID-19 Market Analysis
10.6.2 Post COVID-19 Market Analysis (V, W, U, L Shaped Recovery Scenarios)
10.7 Brazil Antisense Oligonucleotide Therapeutics Market Outlook
10.7.1 Country Market Overview
10.7.2 Pre-COVID-19 Market Analysis
10.7.3 Post COVID-19 Market Analysis (V, W, U, L Shaped Recovery Scenarios)
10.8 Saudi Arabia Antisense Oligonucleotide Therapeutics Market Outlook
10.8.1 Country Market Overview
10.8.2 Pre-COVID-19 Market Analysis
10.8.3 Post COVID-19 Market Analysis (V, W, U, L Shaped Recovery Scenarios)
10.9 South Africa Antisense Oligonucleotide Therapeutics Market Outlook
10.9.1 Country Market Overview
10.9.2 Pre-COVID-19 Market Analysis
10.9.3 Post COVID-19 Market Analysis (V, W, U, L Shaped Recovery Scenarios)
10.10 Mexico Antisense Oligonucleotide Therapeutics Market Outlook
10.10.1 Country Market Overview
10.10.2 Pre-COVID-19 Market Analysis
10.10.3 Post COVID-19 Market Analysis (V, W, U, L Shaped Recovery Scenarios)
10.11 UAE Antisense Oligonucleotide Therapeutics Market Outlook
10.11.1 Country Market Overview
10.11.2 Pre-COVID-19 Market Analysis
10.11.3 Post COVID-19 Market Analysis (V, W, U, L Shaped Recovery Scenarios)
10.12 Rest of LAMEA Antisense Oligonucleotide Therapeutics Market Outlook
10.12.1 Market Overview
10.12.2 Pre-COVID-19 Market Analysis
10.12.3 Post COVID-19 Market Analysis (V, W, U, L Shaped Recovery Scenarios)
11 Potential Drug Candidates in Clinical Trials
11.1 Tominersen
12 Leading Company Profiles
12.1 Ionis Pharmaceuticals, Inc
12.1.1 Company Snapshot
12.1.2 Company Overview
12.1.3 Company Financial Profile
12.1.4 Company Product Benchmarking
12.1.5 Company Recent Developments
12.2 Sarpeta Therapeutics Inc.
12.2.1 Company Snapshot
12.2.2 Company Overview
12.2.3 Company Financial Profile
12.2.4 Company Product Benchmarking
12.2.5 Company Recent Developments
12.3 Biogen Inc
12.3.1 Company Snapshot
12.3.2 Company Overview
12.3.3 Company Financial Profile
12.3.4 Company Product Benchmarking
12.3.5 Company Recent Developments
12.4 Alnylam Pharmaceuticals, Inc
12.4.1 Company Snapshot
12.4.2 Company Overview
12.4.3 Company Financial Profile
12.4.4 Company Product Benchmarking
12.4.5 Company Recent Developments
12.5 Antisense Therapeutics Limited
12.5.1 Company Snapshot
12.5.2 Company Overview
12.5.3 Company Financial Profile
12.5.4 Company Product Benchmarking
12.5.5 Company Recent Developments
12.6 Arrowhead Pharmaceuticals Inc.
12.6.1 Company Snapshot
12.6.2 Company Overview
12.6.3 Company Financial Profile
12.6.4 Company Product Benchmarking
12.6.5 Company Recent Developments
12.7 Enzon Pharmaceuticals, Inc.
12.7.1 Company Snapshot
12.7.2 Company Overview
12.7.3 Company Financial Profile
12.7.4 Company Product Benchmarking
12.7.5 Company Recent Developments
12.8 Bio-Path Holdings, Inc.
12.8.1 Company Snapshot
12.8.2 Company Overview
12.8.3 Company Financial Profile
12.8.4 Company Product Benchmarking
12.8.5 Company Recent Developments
12.9 GlaxoSmithKline PLC
12.9.1 Company Snapshot
12.9.2 Company Overview
12.9.3 Company Financial Profile
12.9.4 Company Product Benchmarking
12.9.5 Company Recent Developments
12.10 Geron Corporation (Geron)
12.10.1 Company Snapshot
12.10.2 Company Overview
12.10.3 Company Financial Profile
12.10.4 Company Product Benchmarking
12.10.5 Company Recent Developments
13 Conclusion & Recommendations
13.1 Recommendations
14 Glossary
List of Tables
Table 1. Global Antisense Oligonucleotide Therapeutics Market Forecast, 2021-2031 (USD Billion, AGR (%), CAGR (%))
Table 2. Global Antisense Oligonucleotide Therapeutics Market Summary Table
Table 3. Chemical Modifications of Antisense Oligonucleotides (ASO)
Table 4. Antisense Oligonucleotides (ASO) Structures
Table 5. Chemical Building Blocks of DNA
Table 6. DNA Translation and Transcription
Table 7. Long-range DNA Structure
Table 8. Genetic Variant Types
Table 9. DNA Read, Write and Edit Technology Overview
Table 10. Sequencing Technology Development, 1990-2020
Table 11. Cost to Sequence a Single Human Genome, 2001-2019($)
Table 12. Sequencing Technology Summary
Table 13. Sanger Sequencing Summary
Table 14. Sanger Sequencing Improvements
Table 15. Advanced Sequencing Technologies
Table 16. Roche Next-generation Sequencing Workflow
Table 17. Illumina Next-generation Sequencing Workflow
Table 18. Thermo Fisher Next-generation Sequencing Workflow
Table 19. Comparison of Gene Synthesis Technologies
Table 20. Importance of Microfluidics Technologies in Read and Write Applications
Table 21. Gene Editing Therapeutic Interventions
Table 22. Gene Editing Technology Approaches
Table 23. Major Gene Editing Technologies
Table 24. Comparison of CRISPR Enzyme Technologies
Table 25. Delivery Vector Technical Hurdles
Table 26. Comparison of Viral Vector Types
Table 27. Non-Viral Delivery Methods
Table 28. DNA Read, Write and Edit: R&D Programs
Table 29. Population Sequencing Projects
Table 30. FDA Approved Formulations
Table 31. Global Antisense Oligonucleotide Therapeutics Market Forecast, 2021-2031 (USD Billion, AGR (%), CAGR (%))
Table 32. Global Antisense Oligonucleotide Therapeutics Market Forecast, 2021-2031 (USD Billion, AGR (%), CAGR (%)) (V-Shaped Recovery)
Table 33. Global Antisense Oligonucleotide Therapeutics Market Forecast, 2021-2031 (USD Billion, AGR (%), CAGR (%)) (W-Shaped Recovery)
Table 34. Global Antisense Oligonucleotide Therapeutics Market Forecast, 2021-2031 (USD Billion, AGR (%), CAGR (%)) (U-Shaped Recovery)
Table 35. Global Antisense Oligonucleotide Therapeutics Market Forecast, 2021-2031 (USD Billion, AGR (%), CAGR (%)) (L-Shaped Recovery)
Table 36. Global Antisense Oligonucleotide Therapeutics Market by Region, 2021-2031 (USD Billion, AGR (%), CAGR (%))
Table 37. Global Antisense Oligonucleotide Therapeutics Market by Region, 2021-2031 (USD Billion, AGR (%), CAGR (%)) (V-Shaped Recovery)
Table 38. Global Antisense Oligonucleotide Therapeutics Market by Region, 2021-2031 (USD Billion, AGR (%), CAGR (%)) (W-Shaped Recovery)
Table 39. Global Antisense Oligonucleotide Therapeutics Market by Region, 2021-2031 (USD Billion, AGR (%), CAGR (%)) (U-Shaped Recovery)
Table 40. Global Antisense Oligonucleotide Therapeutics Market by Region, 2021-2031 (USD Billion, AGR (%), CAGR (%)) (L-Shaped Recovery)
Table 41. Global Antisense Oligonucleotide Therapeutics Market by Therapeutic Area, 2021-2031 (USD Billion, AGR (%), CAGR (%))
Table 42. Global Antisense Oligonucleotide Therapeutics Market by Therapeutic Area, 2021-2031 (USD Billion, AGR (%), CAGR (%)) (V-Shaped Recovery)
Table 43. Global Antisense Oligonucleotide Therapeutics Market by Therapeutic Area, 2021-2031 (USD Billion, AGR (%), CAGR (%)) (W-Shaped Recovery)
Table 44. Global Antisense Oligonucleotide Therapeutics Market by Therapeutic Area, 2021-2031 (USD Billion, AGR (%), CAGR (%)) (U-Shaped Recovery)
Table 45. Global Antisense Oligonucleotide Therapeutics Market by Therapeutic Area, 2021-2031 (USD Billion, AGR (%), CAGR (%)) (L-Shaped Recovery)
Table 46. Global Antisense Oligonucleotide Therapeutics Market by Route of Administration, 2021-2031 (USD Billion, AGR (%), CAGR (%))
Table 47. Global Antisense Oligonucleotide Therapeutics Market by Route of Administration, 2021-2031 (USD Billion, AGR (%), CAGR (%)) (V-Shaped Recovery)
Table 48. Global Antisense Oligonucleotide Therapeutics Market by Route of Administration, 2021-2031 (USD Billion, AGR (%), CAGR (%)) (W-Shaped Recovery)
Table 49. Global Antisense Oligonucleotide Therapeutics Market by Route of Administration, 2021-2031 (USD Billion, AGR (%), CAGR (%)) (U-Shaped Recovery)
Table 50. Global Antisense Oligonucleotide Therapeutics Market by Route of Administration, 2021-2031 (USD Billion, AGR (%), CAGR (%)) (L-Shaped Recovery)
Table 51. Global Antisense Oligonucleotide Therapeutics Market by Type, 2021-2031 (USD Billion, AGR (%), CAGR (%))
Table 52. Global Antisense Oligonucleotide Therapeutics Market by Type, 2021-2031 (USD Billion, AGR (%), CAGR (%)) (V-Shaped Recovery)
Table 53. Global Antisense Oligonucleotide Therapeutics Market by Type, 2021-2031 (USD Billion, AGR (%), CAGR (%)) (W-Shaped Recovery)
Table 54. Global Antisense Oligonucleotide Therapeutics Market by Type, 2021-2031 (USD Billion, AGR (%), CAGR (%)) (U-Shaped Recovery)
Table 55. Global Antisense Oligonucleotide Therapeutics Market by Type, 2021-2031 (USD Billion, AGR (%), CAGR (%)) (L-Shaped Recovery)
Table 56. North America Antisense Oligonucleotide Therapeutics Market by Value, 2021-2031 (USD Billion, AGR (%), CAGR (%))
Table 57. North America Antisense Oligonucleotide Therapeutics Market by Value, 2021-2031 (USD Billion, AGR (%), CAGR (%)) (V-Shaped Recovery)
Table 58. North America Antisense Oligonucleotide Therapeutics Market by Value, 2021-2031 (USD Billion, AGR (%), CAGR (%)) (W-Shaped Recovery)
Table 59. North America Antisense Oligonucleotide Therapeutics Market by Value, 2021-2031 (USD Billion, AGR (%), CAGR (%)) (U-Shaped Recovery)
Table 60. North America Antisense Oligonucleotide Therapeutics Market by Value, 2021-2031 (USD Billion, AGR (%), CAGR (%)) (L-Shaped Recovery)
Table 61. North America Antisense Oligonucleotide Therapeutics Market by Therapeutic Area, 2021-2031 (USD Billion, AGR (%), CAGR (%))
Table 62. North America Antisense Oligonucleotide Therapeutics Market by Therapeutic Area, 2021-2031 (USD Billion, AGR (%), CAGR (%)) (V-Shaped Recovery)
Table 63. North America Antisense Oligonucleotide Therapeutics Market by Therapeutic Area, 2021-2031 (USD Billion, AGR (%), CAGR (%)) (W-Shaped Recovery)
Table 64. North America Antisense Oligonucleotide Therapeutics Market by Therapeutic Area, 2021-2031 (USD Billion, AGR (%), CAGR (%)) (U-Shaped Recovery)
Table 65. North America Antisense Oligonucleotide Therapeutics Market by Therapeutic Area, 2021-2031 (USD Billion, AGR (%), CAGR (%)) (L-Shaped Recovery)
Table 66. North America Antisense Oligonucleotide Therapeutics Market by Route of Administration, 2021-2031 (USD Billion, AGR (%), CAGR (%))
Table 67. North America Antisense Oligonucleotide Therapeutics Market by Route of Administration, 2021-2031 (USD Billion, AGR (%), CAGR(%) (V-Shaped Recovery)
Table 68. North America Antisense Oligonucleotide Therapeutics Market by Route of Administration, 2021-2031 (USD Billion, AGR (%), CAGR (%)) (W-Shaped Recovery)
Table 69. North America Antisense Oligonucleotide Therapeutics Market by Route of Administration, 2021-2031 (USD Billion, AGR (%), CAGR (%)) (U-Shaped Recovery)
Table 70. North America Antisense Oligonucleotide Therapeutics Market by Route of Administration, 2021-2031 (USD Billion, AGR (%), CAGR (%)) (L-Shaped Recovery)
Table 71. North America Antisense Oligonucleotide Therapeutics Market by Type, 2021-2031 (USD Billion, AGR (%), CAGR (%))
Table 72. North America Antisense Oligonucleotide Therapeutics Market by Type, 2021-2031 (USD Billion, AGR (%), CAGR (%)) (V-Shaped Recovery)
Table 73. North America Antisense Oligonucleotide Therapeutics Market by Type, 2021-2031 (USD Billion, AGR (%), CAGR (%)) (W-Shaped Recovery)
Table 74. North America Antisense Oligonucleotide Therapeutics Market by Type, 2021-2031 (USD Billion, AGR (%), CAGR (%)) (U-Shaped Recovery)
Table 75. North America Antisense Oligonucleotide Therapeutics Market by Type, 2021-2031 (USD Billion, AGR (%), CAGR (%)) (L-Shaped Recovery)
Table 76. US Antisense Oligonucleotide Therapeutics Market by Country, 2021-2031 (USD Billion, AGR (%), CAGR (%))
Table 77. US Antisense Oligonucleotide Therapeutics Market by Country, 2021-2031 (USD Billion, AGR (%), CAGR (%)) (V-Shaped Recovery)
Table 78. US Antisense Oligonucleotide Therapeutics Market by Country, 2021-2031 (USD Billion, AGR (%), CAGR (%)) (W-Shaped Recovery)
Table 79. US Antisense Oligonucleotide Therapeutics Market by Country, 2021-2031 (USD Billion, AGR (%), CAGR (%)) (U-Shaped Recovery)
Table 80. US Antisense Oligonucleotide Therapeutics Market by Country, 2021-2031 (USD Billion, AGR (%), CAGR (%)) (L-Shaped Recovery)
Table 81. Canada Antisense Oligonucleotide Therapeutics Market by Country, 2021-2031 (USD Billion, AGR (%), CAGR (%))
Table 82. Canada Antisense Oligonucleotide Therapeutics Market by Country, 2021-2031 (USD Billion, AGR (%), CAGR (%)) (V-Shaped Recovery)
Table 83. Canada Antisense Oligonucleotide Therapeutics Market by Country, 2021-2031 (USD Billion, AGR (%), CAGR (%)) (W-Shaped Recovery)
Table 84. Canada Antisense Oligonucleotide Therapeutics Market by Country, 2021-2031 (USD Billion, AGR (%), CAGR (%)) (U-Shaped Recovery)
Table 85. Canada Antisense Oligonucleotide Therapeutics Market by Country, 2021-2031 (USD Billion, AGR (%), CAGR (%)) (L-Shaped Recovery)
Table 86. Europe Antisense Oligonucleotide Therapeutics Market by Value, 2021-2031 (USD Billion, AGR (%), CAGR (%))
Table 87. Europe Antisense Oligonucleotide Therapeutics Market by Value, 2021-2031 (USD Billion, AGR (%), CAGR (%)) (V-Shaped Recovery)
Table 88. Europe Antisense Oligonucleotide Therapeutics Market by Value, 2021-2031 (USD Billion, AGR (%), CAGR (%)) (W-Shaped Recovery)
Table 89. Europe Antisense Oligonucleotide Therapeutics Market by Value, 2021-2031 (USD Billion, AGR (%), CAGR (%)) (U-Shaped Recovery)
Table 90. Europe Antisense Oligonucleotide Therapeutics Market by Value, 2021-2031 (USD Billion, AGR (%), CAGR (%)) (L-Shaped Recovery)
Table 91. Europe Antisense Oligonucleotide Therapeutics Market by Therapeutic Area, 2021-2031 (USD Billion, AGR (%), CAGR (%))
Table 92. Europe Antisense Oligonucleotide Therapeutics Market by Therapeutic Area, 2021-2031 (USD Billion, AGR (%), CAGR (%)) (V-Shaped Recovery)
Table 93. Europe Antisense Oligonucleotide Therapeutics Market by Therapeutic Area, 2021-2031 (USD Billion, AGR (%), CAGR (%)) (W-Shaped Recovery)
Table 94. Europe Antisense Oligonucleotide Therapeutics Market by Therapeutic Area, 2021-2031 (USD Billion, AGR (%), CAGR (%)) (U-Shaped Recovery)
Table 95. Europe Antisense Oligonucleotide Therapeutics Market by Therapeutic Area, 2021-2031 (USD Billion, AGR (%), CAGR (%)) (L-Shaped Recovery)
Table 96. Europe Antisense Oligonucleotide Therapeutics Market by Route of Administration, 2021-2031 (USD Billion, AGR (%), CAGR (%))
Table 97. Europe Antisense Oligonucleotide Therapeutics Market by Route of Administration, 2021-2031 (USD Billion, AGR (%), CAGR (%)) (V-Shaped Recovery)
Table 98. Europe Antisense Oligonucleotide Therapeutics Market by Route of Administration, 2021-2031 (USD Billion, AGR (%), CAGR (%)) (W-Shaped Recovery)
Table 99. Europe Antisense Oligonucleotide Therapeutics Market by Route of Administration, 2021-2031 (USD Billion, AGR (%), CAGR (%)) (U-Shaped Recovery)
Table 100. Europe Antisense Oligonucleotide Therapeutics Market by Route of Administration, 2021-2031 (USD Billion, AGR (%), CAGR (%)) (L-Shaped Recovery)
Table 101. Europe Antisense Oligonucleotide Therapeutics Market by Type, 2021-2031 (USD Billion, AGR (%), CAGR (%))
Table 102. Europe Antisense Oligonucleotide Therapeutics Market by Type, 2021-2031 (USD Billion, AGR (%), CAGR (%)) (V-Shaped Recovery)
Table 103. Europe Antisense Oligonucleotide Therapeutics Market by Type, 2021-2031 (USD Billion, AGR (%), CAGR (%)) (W-Shaped Recovery)
Table 104. Europe Antisense Oligonucleotide Therapeutics Market by Type, 2021-2031 (USD Billion, AGR (%), CAGR (%)) (U-Shaped Recovery)
Table 105. Europe Antisense Oligonucleotide Therapeutics Market by Type, 2021-2031 (USD Billion, AGR (%), CAGR (%)) (L-Shaped Recovery)
Table 106. Germany Antisense Oligonucleotide Therapeutics Market by Country, 2021-2031 (USD Billion, AGR (%), CAGR (%))
Table 107. Germany Antisense Oligonucleotide Therapeutics Market by Country, 2021-2031 (USD Billion, AGR (%), CAGR (%)) (V-Shaped Recovery)
Table 108. Germany Antisense Oligonucleotide Therapeutics Market by Country, 2021-2031 (USD Billion, AGR (%), CAGR (%)) (W-Shaped Recovery)
Table 109. Germany Antisense Oligonucleotide Therapeutics Market by Country, 2021-2031 (USD Billion, AGR (%), CAGR (%)) (U-Shaped Recovery)
Table 110. Germany Antisense Oligonucleotide Therapeutics Market by Country, 2021-2031 (USD Billion, AGR (%), CAGR (%)) (L-Shaped Recovery)
Table 111. UK Antisense Oligonucleotide Therapeutics Market by Country, 2021-2031 (USD Billion, AGR (%), CAGR (%))
Table 112. UK Antisense Oligonucleotide Therapeutics Market by Country, 2021-2031 (USD Billion, AGR (%), CAGR (%)) (V-Shaped Recovery)
Table 113. UK Antisense Oligonucleotide Therapeutics Market by Country, 2021-2031 (USD Billion, AGR (%), CAGR (%)) (W-Shaped Recovery)
Table 114. UK Antisense Oligonucleotide Therapeutics Market by Country, 2021-2031 (USD Billion, AGR (%), CAGR (%)) (U-Shaped Recovery)
Table 115. UK Antisense Oligonucleotide Therapeutics Market by Country, 2021-2031 (USD Billion, AGR (%), CAGR (%)) (L-Shaped Recovery)
Table 116. France Antisense Oligonucleotide Therapeutics Market by Country, 2021-2031 (USD Billion, AGR (%), CAGR (%))
Table 117. France Antisense Oligonucleotide Therapeutics Market by Country, 2021-2031 (USD Billion, AGR (%), CAGR (%)) (V-Shaped Recovery)
Table 118. France Antisense Oligonucleotide Therapeutics Market by Country, 2021-2031 (USD Billion, AGR (%), CAGR (%)) (W-Shaped Recovery)
Table 119. France Antisense Oligonucleotide Therapeutics Market by Country, 2021-2031 (USD Billion, AGR (%), CAGR (%)) (U-Shaped Recovery)
Table 120. France Antisense Oligonucleotide Therapeutics Market by Country, 2021-2031 (USD Billion, AGR (%), CAGR (%)) (L-Shaped Recovery)
Table 121. Italy Antisense Oligonucleotide Therapeutics Market by Country, 2021-2031 (USD Billion, AGR (%), CAGR (%))
Table 122. Italy Antisense Oligonucleotide Therapeutics Market by Country, 2021-2031 (USD Billion, AGR (%), CAGR (%)) (V-Shaped Recovery)
Table 123. Italy Antisense Oligonucleotide Therapeutics Market by Country, 2021-2031 (USD Billion, AGR (%), CAGR (%)) (W-Shaped Recovery)
Table 124. Italy Antisense Oligonucleotide Therapeutics Market by Country, 2021-2031 (USD Billion, AGR (%), CAGR (%)) (U-Shaped Recovery)
Table 125. Italy Antisense Oligonucleotide Therapeutics Market by Country, 2021-2031 (USD Billion, AGR (%), CAGR (%)) (L-Shaped Recovery)
Table 126. Spain Antisense Oligonucleotide Therapeutics Market by Country, 2021-2031 (USD Billion, AGR (%), CAGR (%))
Table 127. Spain Antisense Oligonucleotide Therapeutics Market by Country, 2021-2031 (USD Billion, AGR (%), CAGR (%)) (V-Shaped Recovery)
Table 128. Spain Antisense Oligonucleotide Therapeutics Market by Country, 2021-2031 (USD Billion, AGR (%), CAGR (%)) (W-Shaped Recovery)
Table 129. Spain Antisense Oligonucleotide Therapeutics Market by Country, 2021-2031 (USD Billion, AGR (%), CAGR (%)) (U-Shaped Recovery)
Table 130. Spain Antisense Oligonucleotide Therapeutics Market by Country, 2021-2031 (USD Billion, AGR (%), CAGR (%)) (L-Shaped Recovery)
Table 131. Rest of Europe Antisense Oligonucleotide Therapeutics Market by Country, 2021-2031 (USD Billion, AGR (%), CAGR (%))
Table 132. Rest of Europe Antisense Oligonucleotide Therapeutics Market by Country, 2021-2031 (USD Billion, AGR (%), CAGR (%)) (V-Shaped Recovery)
Table 133. Rest of Europe Antisense Oligonucleotide Therapeutics Market by Country, 2021-2031 (USD Billion, AGR (%), CAGR (%)) (W-Shaped Recovery)
Table 134. Rest of Europe Antisense Oligonucleotide Therapeutics Market by Country, 2021-2031 (USD Billion, AGR (%), CAGR (%)) (U-Shaped Recovery)
Table 135. Rest of Europe Antisense Oligonucleotide Therapeutics Market by Country, 2021-2031 (USD Billion, AGR (%), CAGR (%)) (L-Shaped Recovery)
Table 136. Asia-Pacific Antisense Oligonucleotide Therapeutics Market by Value, 2021-2031 (USD Billion, AGR (%), CAGR (%))
Table 137. Asia-Pacific Antisense Oligonucleotide Therapeutics Market by Value, 2021-2031 (USD Billion, AGR (%), CAGR (%)) (V-Shaped Recovery)
Table 138. Asia-Pacific Antisense Oligonucleotide Therapeutics Market by Value, 2021-2031 (USD Billion, AGR (%), CAGR (%)) (W-Shaped Recovery)
Table 139. Asia-Pacific Antisense Oligonucleotide Therapeutics Market by Value, 2021-2031 (USD Billion, AGR (%), CAGR (%)) (U-Shaped Recovery)
Table 140. Asia-Pacific Antisense Oligonucleotide Therapeutics Market by Value, 2021-2031 (USD Billion, AGR (%), CAGR (%)) (L-Shaped Recovery)
Table 141. Asia-Pacific Antisense Oligonucleotide Therapeutics Market by Therapeutic Area, 2021-2031 (USD Billion, AGR (%), CAGR (%))
Table 142. Asia-Pacific Antisense Oligonucleotide Therapeutics Market by Therapeutic Area, 2021-2031 (USD Billion, AGR (%), CAGR (%)) (V-Shaped Recovery)
Table 143. Asia-Pacific Antisense Oligonucleotide Therapeutics Market by Therapeutic Area, 2021-2031 (USD Billion, AGR (%), CAGR (%)) (W-Shaped Recovery)
Table 144. Asia-Pacific Antisense Oligonucleotide Therapeutics Market by Therapeutic Area, 2021-2031 (USD Billion, AGR (%), CAGR (%)) (U-Shaped Recovery)
Table 145. Asia-Pacific Antisense Oligonucleotide Therapeutics Market by Therapeutic Area, 2021-2031 (USD Billion, AGR (%), CAGR (%)) (L-Shaped Recovery)
Table 146. Asia-Pacific Antisense Oligonucleotide Therapeutics Market by Route of Administration, 2021-2031 (USD Billion, AGR (%), CAGR (%))
Table 147. Asia-Pacific Antisense Oligonucleotide Therapeutics Market by Route of Administration, 2021-2031 (USD Billion, AGR (%), CAGR (%)) (V-Shaped Recovery)
Table 148. Asia-Pacific Antisense Oligonucleotide Therapeutics Market by Route of Administration, 2021-2031 (USD Billion, AGR (%), CAGR (%)) (W-Shaped Recovery)
Table 149. Asia-Pacific Antisense Oligonucleotide Therapeutics Market by Route of Administration, 2021-2031 (USD Billion, AGR (%), CAGR (%)) (U-Shaped Recovery)
Table 150. Asia-Pacific Antisense Oligonucleotide Therapeutics Market by Route of Administration, 2021-2031 (USD Billion, AGR (%), CAGR (%)) (L-Shaped Recovery)
Table 151. Asia-Pacific Antisense Oligonucleotide Therapeutics Market by Type, 2021-2031 (USD Billion, AGR (%), CAGR (%))
Table 152. Asia-Pacific Antisense Oligonucleotide Therapeutics Market by Type, 2021-2031 (USD Billion, AGR (%), CAGR (%)) (V-Shaped Recovery)
Table 153. Asia-Pacific Antisense Oligonucleotide Therapeutics Market by Type, 2021-2031 (USD Billion, AGR (%), CAGR (%)) (W-Shaped Recovery)
Table 154. Asia-Pacific Antisense Oligonucleotide Therapeutics Market by Type, 2021-2031 (USD Billion, AGR (%), CAGR (%)) (U-Shaped Recovery)
Table 155. Asia-Pacific Antisense Oligonucleotide Therapeutics Market by Type, 2021-2031 (USD Billion, AGR (%), CAGR (%)) (L-Shaped Recovery)
Table 156. China Antisense Oligonucleotide Therapeutics Market by Country, 2021-2031 (USD Billion, AGR (%), CAGR (%))
Table 157. China Antisense Oligonucleotide Therapeutics Market by Country, 2021-2031 (USD Billion, AGR (%), CAGR (%)) (V-Shaped Recovery)
Table 158. China Antisense Oligonucleotide Therapeutics Market by Country, 2021-2031 (USD Billion, AGR (%), CAGR (%)) (W-Shaped Recovery)
Table 159. China Antisense Oligonucleotide Therapeutics Market by Country, 2021-2031 (USD Billion, AGR (%), CAGR (%)) (U-Shaped Recovery)
Table 160. China Antisense Oligonucleotide Therapeutics Market by Country, 2021-2031 (USD Billion, AGR (%), CAGR (%)) (L-Shaped Recovery)
Table 161. India Antisense Oligonucleotide Therapeutics Market by Country, 2021-2031 (USD Billion, AGR (%), CAGR (%))
Table 162. India Antisense Oligonucleotide Therapeutics Market by Country, 2021-2031 (USD Billion, AGR (%), CAGR (%)) (V-Shaped Recovery)
Table 163. India Antisense Oligonucleotide Therapeutics Market by Country, 2021-2031 (USD Billion, AGR (%), CAGR (%)) (W-Shaped Recovery)
Table 164. India Antisense Oligonucleotide Therapeutics Market by Country, 2021-2031 (USD Billion, AGR (%), CAGR (%)) (U-Shaped Recovery)
Table 165. India Antisense Oligonucleotide Therapeutics Market by Country, 2021-2031 (USD Billion, AGR (%), CAGR (%)) (L-Shaped Recovery)
Table 166. Japan Antisense Oligonucleotide Therapeutics Market by Country, 2021-2031 (USD Billion, AGR (%), CAGR (%))
Table 167. Japan Antisense Oligonucleotide Therapeutics Market by Country, 2021-2031 (USD Billion, AGR (%), CAGR (%)) (V-Shaped Recovery)
Table 168. Japan Antisense Oligonucleotide Therapeutics Market by Country, 2021-2031 (USD Billion, AGR (%), CAGR (%)) (W-Shaped Recovery)
Table 169. Japan Antisense Oligonucleotide Therapeutics Market by Country, 2021-2031 (USD Billion, AGR (%), CAGR (%)) (U-Shaped Recovery)
Table 170. Japan Antisense Oligonucleotide Therapeutics Market by Country, 2021-2031 (USD Billion, AGR (%), CAGR (%)) (L-Shaped Recovery)
Table 171. South Korea Antisense Oligonucleotide Therapeutics Market by Country, 2021-2031 (USD Billion, AGR (%), CAGR (%))
Table 172. South Korea Antisense Oligonucleotide Therapeutics Market by Country, 2021-2031 (USD Billion, AGR (%), CAGR (%)) (V-Shaped Recovery)
Table 173. South Korea Antisense Oligonucleotide Therapeutics Market by Country, 2021-2031 (USD Billion, AGR (%), CAGR (%)) (W-Shaped Recovery)
Table 174. South Korea Antisense Oligonucleotide Therapeutics Market by Country, 2021-2031 (USD Billion, AGR (%), CAGR (%)) (U-Shaped Recovery)
Table 175. South Korea Antisense Oligonucleotide Therapeutics Market by Country, 2021-2031 (USD Billion, AGR (%), CAGR (%)) (L-Shaped Recovery)
Table 176. Australia Antisense Oligonucleotide Therapeutics Market by Country, 2021-2031 (USD Billion, AGR (%), CAGR (%))
Table 177. Australia Antisense Oligonucleotide Therapeutics Market by Country, 2021-2031 (USD Billion, AGR (%), CAGR (%)) (V-Shaped Recovery)
Table 178. Australia Antisense Oligonucleotide Therapeutics Market by Country, 2021-2031 (USD Billion, AGR (%), CAGR (%)) (W-Shaped Recovery)
Australia Antisense Oligonucleotide Therapeutics Market by Country, 2021-2031 (USD Billion, AGR (%), CAGR (%)) (U-Shaped Recovery)
Table 180. Australia Antisense Oligonucleotide Therapeutics Market by Country, 2021-2031 (USD Billion, AGR (%), CAGR (%)) (L-Shaped Recovery)
Table 181. Rest of Asia-Pacific Antisense Oligonucleotide Therapeutics Market by Country, 2021-2031 (USD Billion, AGR (%), CAGR (%))
Table 182. Rest of Asia-Pacific Antisense Oligonucleotide Therapeutics Market by Country, 2021-2031 (USD Billion, AGR (%), CAGR (%)) (V-Shaped Recovery)
Table 183. Rest of Asia-Pacific Antisense Oligonucleotide Therapeutics Market by Country, 2021-2031 (USD Billion, AGR (%), CAGR (%)) (W-Shaped Recovery)
Table 184. Rest of Asia-Pacific Antisense Oligonucleotide Therapeutics Market by Country, 2021-2031 (USD Billion, AGR (%), CAGR (%)) (U-Shaped Recovery)
Table 185. Rest of Asia-Pacific Antisense Oligonucleotide Therapeutics Market by Country, 2021-2031 (USD Billion, AGR (%), CAGR (%)) (L-Shaped Recovery)
Table 186. LAMEA Antisense Oligonucleotide Therapeutics Market by Value, 2021-2031 (USD Billion, AGR (%), CAGR (%))
Table 187. LAMEA Antisense Oligonucleotide Therapeutics Market by Value, 2021-2031 (USD Billion, AGR (%), CAGR (%)) (V-Shaped Recovery)
Table 188. LAMEA Antisense Oligonucleotide Therapeutics Market by Value, 2021-2031 (USD Billion, AGR (%), CAGR (%)) (W-Shaped Recovery)
Table 189. LAMEA Antisense Oligonucleotide Therapeutics Market by Value, 2021-2031 (USD Billion, AGR (%), CAGR (%)) (U-Shaped Recovery)
Table 190. LAMEA Antisense Oligonucleotide Therapeutics Market by Value, 2021-2031 (USD Billion, AGR (%), CAGR (%)) (L-Shaped Recovery)
Table 191. LAMEA Antisense Oligonucleotide Therapeutics Market by Therapeutic Area, 2021-2031 (USD Billion, AGR (%), CAGR (%))
Table 192. LAMEA Antisense Oligonucleotide Therapeutics Market by Therapeutic Area, 2021-2031 (USD Billion, AGR (%), CAGR (%)) (V-Shaped Recovery)
Table 193. LAMEA Antisense Oligonucleotide Therapeutics Market by Therapeutic Area, 2021-2031 (USD Billion, AGR (%), CAGR (%)) (W-Shaped Recovery)
Table 194. LAMEA Antisense Oligonucleotide Therapeutics Market by Therapeutic Area, 2021-2031 (USD Billion, AGR (%), CAGR (%)) (U-Shaped Recovery)
Table 195. LAMEA Antisense Oligonucleotide Therapeutics Market by Therapeutic Area, 2021-2031 (USD Billion, AGR (%), CAGR (%)) (L-Shaped Recovery)
Table 196. LAMEA Antisense Oligonucleotide Therapeutics Market by Route of Administration, 2021-2031 (USD Billion, AGR (%), CAGR (%))
Table 197. LAMEA Antisense Oligonucleotide Therapeutics Market by Route of Administration, 2021-2031 (USD Billion, AGR (%), CAGR (%)) (V-Shaped Recovery)
Table 198. LAMEA Antisense Oligonucleotide Therapeutics Market by Route of Administration, 2021-2031 (USD Billion, AGR (%), CAGR (%)) (W-Shaped Recovery)
Table 199. LAMEA Antisense Oligonucleotide Therapeutics Market by Route of Administration, 2021-2031 (USD Billion, AGR (%), CAGR (%)) (U-Shaped Recovery)
Table 200. LAMEA Antisense Oligonucleotide Therapeutics Market by Route of Administration, 2021-2031 (USD Billion, AGR (%), CAGR (%)) (L-Shaped Recovery)
Table 201. LAMEA Antisense Oligonucleotide Therapeutics Market by Type, 2021-2031 (USD Billion, AGR (%), CAGR (%))
Table 202. LAMEA Antisense Oligonucleotide Therapeutics Market by Type, 2021-2031 (USD Billion, AGR (%), CAGR (%)) (V-Shaped Recovery)
Table 203. LAMEA Antisense Oligonucleotide Therapeutics Market by Type, 2021-2031 (USD Billion, AGR (%), CAGR (%)) (W-Shaped Recovery)
Table 204. LAMEA Antisense Oligonucleotide Therapeutics Market by Type, 2021-2031 (USD Billion, AGR (%), CAGR (%)) (U-Shaped Recovery)
Table 205. LAMEA Antisense Oligonucleotide Therapeutics Market by Type, 2021-2031 (USD Billion, AGR (%), CAGR (%)) (L-Shaped Recovery)
Table 206. Brazil Antisense Oligonucleotide Therapeutics Market by Country, 2021-2031 (USD Billion, AGR (%), CAGR (%))
Table 207. Brazil Antisense Oligonucleotide Therapeutics Market by Country, 2021-2031 (USD Billion, AGR (%), CAGR (%)) (V-Shaped Recovery)
Table 208. Brazil Antisense Oligonucleotide Therapeutics Market by Country, 2021-2031 (USD Billion, AGR (%), CAGR (%)) (W-Shaped Recovery)
Table 209. Brazil Antisense Oligonucleotide Therapeutics Market by Country, 2021-2031 (USD Billion, AGR (%), CAGR (%)) (U-Shaped Recovery)
Table 210. Brazil Antisense Oligonucleotide Therapeutics Market by Country, 2021-2031 (USD Billion, AGR (%), CAGR (%)) (L-Shaped Recovery)
Table 211. Saudi Arabia Antisense Oligonucleotide Therapeutics Market by Country, 2021-2031 (USD Billion, AGR (%), CAGR (%))
Table 212. Saudi Arabia Antisense Oligonucleotide Therapeutics Market by Country, 2021-2031 (USD Billion, AGR (%), CAGR (%)) (V-Shaped Recovery)
Table 213. Saudi Arabia Antisense Oligonucleotide Therapeutics Market by Country, 2021-2031 (USD Billion, AGR (%), CAGR (%)) (W-Shaped Recovery)
Table 214. Saudi Arabia Antisense Oligonucleotide Therapeutics Market by Country, 2021-2031 (USD Billion, AGR (%), CAGR (%)) (U-Shaped Recovery)
Table 215. Saudi Arabia Antisense Oligonucleotide Therapeutics Market by Country, 2021-2031 (USD Billion, AGR (%), CAGR (%)) (L-Shaped Recovery)
Table 216. South Africa Antisense Oligonucleotide Therapeutics Market by Country, 2021-2031 (USD Billion, AGR (%), CAGR (%))
Table 217. South Africa Antisense Oligonucleotide Therapeutics Market by Country, 2021-2031 (USD Billion, AGR (%), CAGR (%)) (V-Shaped Recovery)
Table 218. South Africa Antisense Oligonucleotide Therapeutics Market by Country, 2021-2031 (USD Billion, AGR (%), CAGR (%)) (W-Shaped Recovery)
Table 219. South Africa Antisense Oligonucleotide Therapeutics Market by Country, 2021-2031 (USD Billion, AGR (%), CAGR (%)) (U-Shaped Recovery)
Table 220. South Africa Antisense Oligonucleotide Therapeutics Market by Country, 2021-2031 (USD Billion, AGR (%), CAGR (%)) (L-Shaped Recovery)
Table 221. Mexico Antisense Oligonucleotide Therapeutics Market by Country, 2021-2031 (USD Billion, AGR (%), CAGR (%))
Table 222. Mexico Antisense Oligonucleotide Therapeutics Market by Country, 2021-2031 (USD Billion, AGR (%), CAGR (%)) (V-Shaped Recovery)
Table 223. Mexico Antisense Oligonucleotide Therapeutics Market by Country, 2021-2031 (USD Billion, AGR (%), CAGR (%)) (W-Shaped Recovery)
Table 224. Mexico Antisense Oligonucleotide Therapeutics Market by Country, 2021-2031 (USD Billion, AGR (%), CAGR (%)) (U-Shaped Recovery)
Table 225. Mexico Antisense Oligonucleotide Therapeutics Market by Country, 2021-2031 (USD Billion, AGR (%), CAGR (%)) (L-Shaped Recovery)
Table 226. UAE Antisense Oligonucleotide Therapeutics Market by Country, 2021-2031 (USD Billion, AGR (%), CAGR (%))
Table 227. UAE Antisense Oligonucleotide Therapeutics Market by Country, 2021-2031 (USD Billion, AGR (%), CAGR (%)) (V-Shaped Recovery)
Table 228. UAE Antisense Oligonucleotide Therapeutics Market by Country, 2021-2031 (USD Billion, AGR (%), CAGR (%)) (W-Shaped Recovery)
Table 229. UAE Antisense Oligonucleotide Therapeutics Market by Country, 2021-2031 (USD Billion, AGR (%), CAGR (%)) (U-Shaped Recovery)
Table 230. UAE Antisense Oligonucleotide Therapeutics Market by Country, 2021-2031 (USD Billion, AGR (%), CAGR (%)) (L-Shaped Recovery)
Table 231. Rest of LAMEA Antisense Oligonucleotide Therapeutics Market by Country, 2021-2031 (USD Billion, AGR (%), CAGR (%))
Table 232. Rest of LAMEA Antisense Oligonucleotide Therapeutics Market by Country, 2021-2031 (USD Billion, AGR (%), CAGR (%)) (V-Shaped Recovery)
Table 233. Rest of LAMEA Antisense Oligonucleotide Therapeutics Market by Country, 2021-2031 (USD Billion, AGR (%), CAGR (%)) (W-Shaped Recovery)
Table 234. Rest of LAMEA Antisense Oligonucleotide Therapeutics Market by Country, 2021-2031 (USD Billion, AGR (%), CAGR (%)) (U-Shaped Recovery)
Table 235. Rest of LAMEA Antisense Oligonucleotide Therapeutics Market by Country, 2021-2031 (USD Billion, AGR (%), CAGR (%)) (L-Shaped Recovery)
Table 236. Ionic Pharmaceuticals, Inc,: Company Information
Table 237. Ionic Pharmaceuticals, Inc.: Company Revenue 2016-2020 (US$Mn, AGR %)
Table 238. Ionic Pharmaceuticals, Inc.: Company Product and Service Benchmarking
Table 239. Ionic Pharmaceuticals, Inc.: Company Product and Service Pipeline
Table 240. Ionic Pharmaceuticals, Inc.: Company Recent Developments till Feb,2021
Table 241. Sarpeta Therapeutics Inc.: Company Information
Table 242. Sarpeta Therapeutics Inc.: Company Revenue 2016-2020 (US$Mn, AGR %)
Table 243. Sarpeta Therapeutics Inc.: Company Product and Service Benchmarking
Table 244. Sarpeta Therapeutics Inc.: Company Product and Service Pipeline
Table 245. Sarpeta Therapeutics Inc.: Company Recent Developments till Feb,2021
Table 246. Biogen Inc.: Company Information
Table 247. Biogen Inc.: Company Revenue 2016-2020 (US$Mn, AGR %)
Table 248. Biogen Inc.: Company Product and Service Benchmarking
Table 249. Biogen Inc.: Company Product and Service Pipeline
Table 250. Biogen Inc.: Company Recent Developments till Feb,2021
Table 251. Alnylam Pharmaceuticals, Inc.: Company Information
Table 252. Alnylam Pharmaceuticals, Inc.: Company Revenue 2016-2020 (US$Mn, AGR %)
Table 253. Alnylam Pharmaceuticals, Inc.: Company Product and Service Benchmarking
Table 254. Alnylam Pharmaceuticals, Inc.: Company Product and Service Pipeline
Table 255. Alnylam Pharmaceuticals,Inc.: Company Recent Developments till Feb,2021
Table 256. Antisense Therapeutics Limited.: Company Information
Table 257. Antisense Therapeutics Limited.: Company Revenue 2016-2020 (US$Mn, AGR %)
Table 258. Antisense Therapeutics Limited.: Company Product and Service Benchmarking
Table 259. Antisense Therapeutics Limited.: Company Product and Service Pipeline
Table 260. Antisense Therapeutics Limited.: Company Recent Developments till Feb,2021
Table 261. Alnylam Pharmaceuticals, Inc.: Company Information
Table 262. Arrowhead Pharmaceuticals, Inc.: Company Revenue 2016-2020 (US$Mn, AGR %)
Table 263. Arrowhead Pharmaceuticals, Inc.: Company Product and Service Pipeline
Table 264. Arrowhead Pharmaceuticals, Inc.: Company Recent Developments till Feb,2021
Table 265. Enzon Pharmaceuticals, Inc.: Company Information
Table 266. Enzon Pharmaceuticals, Inc.: Company Revenue 2016-2020 (US$Mn, AGR %)
Table 267. Enzon Pharmaceuticals, Inc.: Company Product and Service Benchmarking
Table 268. Enzon Pharmaceuticals,Inc.: Company Recent Developments till Feb,2021
Table 269. Bio-Path Holdings, Inc.: Company Information
Table 270. Bio-Path Holdings, Inc.: Company Revenue 2015-2019 (US$Mn, AGR %)
Table 271. Bio-Path Holdings, Inc.: Company Product and Service Pipeline
Table 272. Bio-Path Holdings.: Company Recent Developments till Feb,2021
Table 273. GlaxoSmithKline Plc.: Company Information
Table 274. GlaxoSmithKline Plc.: Company Revenue 2016-2020 (US$Mn, AGR %)
Table 275. GlaxoSmithKline Plc.: Company Product and Service Benchmarking
Table 276. GlaxoSmithKline Plc.: Company Recent Developments till Feb,2021
Table 277. Geron Corporation,.: Company Information
Table 278. Geron Corporation.: Company Revenue 2015-2019 (US$Mn, AGR %)
Table 279. Geron Corporation.: Company Product and Service Pipeline
Table 280. Geron Corporation.: Company Recent Developments till Feb,2021
List of Figures
Figure 1. Overview of Antisense Oligonucleotide (ASO)-based Therapeutics
Figure 2. Global Antisense Oligonucleotide Therapeutics Market Forecast, 2021-2031 (USD Billion, AGR (%)
Figure 3. Central Dogma of Molecular Biology
Figure 4. Schematic of Conventional DNA Synthesis Technologies
Figure 5. Microarrays in DNA Synthesis
Figure 6. SWOT Analysis of Global Antisense Oligonucleotide Therapeutics Market
Figure 7. Porter's Five Force Model Of The Nucleic Acid Aptamer Technology Market
Figure 8. Global Antisense Oligonucleotide Therapeutics Market Forecast, 2021-2031 (USD Billion, AGR (%)
Figure 9. Global Antisense Oligonucleotide Therapeutics Market Forecast, 2021-2031 (USD Billion, AGR (%) (V-Shaped Recovery)
Figure 10. Global Antisense Oligonucleotide Therapeutics Market Forecast, 2021-2031 (USD Billion, AGR (%) (W-Shaped Recovery)
Figure 11. Global Antisense Oligonucleotide Therapeutics Market Forecast, 2021-2031 (USD Billion, AGR (%) (U-Shaped Recovery)
Figure 12. Global Antisense Oligonucleotide Therapeutics Market Forecast, 2021-2031 (USD Billion, AGR (%) (L-Shaped Recovery)
Figure 13. Global Antisense Oligonucleotide Therapeutics Market by Region, 2021-2031 (USD Billion, AGR (%)
Figure 14. Global Antisense Oligonucleotide Therapeutics Market by Region, 2021-2031 (USD Billion, AGR (%) (V-Shaped Recovery)
Figure 15. Global Antisense Oligonucleotide Therapeutics Market by Region, 2021-2031 (USD Billion, AGR (%) (W-Shaped Recovery)
Figure 16. Global Antisense Oligonucleotide Therapeutics Market by Region, 2021-2031 (USD Billion, AGR (%) (U-Shaped Recovery)
Figure 17. Global Antisense Oligonucleotide Therapeutics Market by Region, 2021-2031 (USD Billion, AGR (%) (L-Shaped Recovery)
Figure 18. Global Antisense Oligonucleotide Therapeutics Market by Therapeutic Area, 2021-2031 (USD Billion, AGR (%))
Figure 19. Global Antisense Oligonucleotide Therapeutics Market by Therapeutic Area, 2021-2031 (USD Billion, AGR (%)) (V-Shaped Recovery)
Figure 20. Global Antisense Oligonucleotide Therapeutics Market by Therapeutic Area, 2021-2031 (USD Billion, AGR (%)) (W-Shaped Recovery)
Figure 21. Global Antisense Oligonucleotide Therapeutics Market by Therapeutic Area, 2021-2031 (USD Billion, AGR (%)) (U-Shaped Recovery)
Figure 22. Global Antisense Oligonucleotide Therapeutics Market by Therapeutic Area, 2021-2031 (USD Billion, AGR (%)) (L-Shaped Recovery)
Figure 23. Global Antisense Oligonucleotide Therapeutics Market by Route of Administration, 2021-2031 (USD Billion, AGR (%))
Figure 24. Global Antisense Oligonucleotide Therapeutics Market by Route of Administration, 2021-2031 (USD Billion, AGR (%)) (V-Shaped Recovery)
Figure 25. Global Antisense Oligonucleotide Therapeutics Market by Route of Administration, 2021-2031 (USD Billion, AGR (%)) (W-Shaped Recovery)
Figure 26. Global Antisense Oligonucleotide Therapeutics Market by Route of Administration, 2021-2031 (USD Billion, AGR (%)) (U-Shaped Recovery)
Figure 27. Global Antisense Oligonucleotide Therapeutics Market by Route of Administration, 2021-2031 (USD Billion, AGR (%)) (L-Shaped Recovery)
Figure 28. Global Antisense Oligonucleotide Therapeutics Market by Type, 2021-2031 (USD Billion, AGR (%))
Figure 29. Global Antisense Oligonucleotide Therapeutics Market by Type, 2021-2031 (USD Billion, AGR (%)) (V-Shaped Recovery)
Figure 30. Global Antisense Oligonucleotide Therapeutics Market by Type, 2021-2031 (USD Billion, AGR (%)) (W-Shaped Recovery)
Figure 31. Global Antisense Oligonucleotide Therapeutics Market by Type, 2021-2031 (USD Billion, AGR (%)) (U-Shaped Recovery)
Figure 32. Global Antisense Oligonucleotide Therapeutics Market by Type, 2021-2031 (USD Billion, AGR (%)) (L-Shaped Recovery)
Figure 33. North America Antisense Oligonucleotide Therapeutics Market by Value, 2021-2031 (USD Billion, AGR (%))
Figure 34. North America Antisense Oligonucleotide Therapeutics Market by Value, 2021-2031 (USD Billion, AGR (%)) (V-Shaped Recovery)
Figure 35. North America Antisense Oligonucleotide Therapeutics Market by Value, 2021-2031 (USD Billion, AGR (%)) (W-Shaped Recovery)
Figure 36. North America Antisense Oligonucleotide Therapeutics Market by Value, 2021-2031 (USD Billion, AGR (%)) (U-Shaped Recovery)
Figure 37. North America Antisense Oligonucleotide Therapeutics Market by Value, 2021-2031 (USD Billion, AGR (%)) (L-Shaped Recovery)
Figure 38. North America Antisense Oligonucleotide Therapeutics Market by Country, 2021-2031 (USD Billion, AGR (%))
Figure 39. North America Antisense Oligonucleotide Therapeutics Market by Country, 2021-2031 (USD Billion, AGR (%)) (V-Shaped Recovery)
Figure 40. North America Antisense Oligonucleotide Therapeutics Market by Country, 2021-2031 (USD Billion, AGR (%)) (W-Shaped Recovery)
Figure 41. North America Antisense Oligonucleotide Therapeutics Market by Country, 2021-2031 (USD Billion, AGR (%)) (U-Shaped Recovery)
Figure 42. North America Antisense Oligonucleotide Therapeutics Market by Country, 2021-2031 (USD Billion, AGR (%)) (L-Shaped Recovery)
Figure 43. North America Antisense Oligonucleotide Therapeutics Market by Therapeutic Area, 2021-2031 (USD Billion, AGR (%))
Figure 44. North America Antisense Oligonucleotide Therapeutics Market by Therapeutic Area, 2021-2031 (USD Billion, AGR (%)) (V-Shaped Recovery)
Figure 45. North America Antisense Oligonucleotide Therapeutics Market by Therapeutic Area, 2021-2031 (USD Billion, AGR (%)) (W-Shaped Recovery)
Figure 46. North America Antisense Oligonucleotide Therapeutics Market by Therapeutic Area, 2021-2031 (USD Billion, AGR (%)) (U-Shaped Recovery)
Figure 47. North America Antisense Oligonucleotide Therapeutics Market by Therapeutic Area, 2021-2031 (USD Billion, AGR (%)) (L-Shaped Recovery)
Figure 48. North America Antisense Oligonucleotide Therapeutics Market by Route of Administration, 2021-2031 (USD Billion, AGR (%))
Figure 49. North America Antisense Oligonucleotide Therapeutics Market by Route of Administration, 2021-2031 (USD Billion, AGR (%)) (V-Shaped Recovery)
Figure 50. North America Antisense Oligonucleotide Therapeutics Market by Route of Administration, 2021-2031 (USD Billion, AGR (%)) (W-Shaped Recovery)
Figure 51. North America Antisense Oligonucleotide Therapeutics Market by Route of Administration, 2021-2031 (USD Billion, AGR (%)) (U-Shaped Recovery)
Figure 52. North America Antisense Oligonucleotide Therapeutics Market by Route of Administration, 2021-2031 (USD Billion, AGR (%)) (L-Shaped Recovery)
Figure 53. North America Antisense Oligonucleotide Therapeutics Market by Type, 2021-2031 (USD Billion, AGR (%))
Figure 54. North America Antisense Oligonucleotide Therapeutics Market by Type, 2021-2031 (USD Billion, AGR (%)) (V-Shaped Recovery)
Figure 55. North America Antisense Oligonucleotide Therapeutics Market by Type, 2021-2031 (USD Billion, AGR (%)) (W-Shaped Recovery)
Figure 56. North America Antisense Oligonucleotide Therapeutics Market by Type, 2021-2031 (USD Billion, AGR (%)) (U-Shaped Recovery)
Figure 57. North America Antisense Oligonucleotide Therapeutics Market by Type, 2021-2031 (USD Billion, AGR (%)) (L-Shaped Recovery)
Figure 58. Europe Antisense Oligonucleotide Therapeutics Market by Value, 2021-2031 (USD Billion, AGR (%))
Figure 59. Europe Antisense Oligonucleotide Therapeutics Market by Value, 2021-2031 (USD Billion, AGR (%)) (V-Shaped Recovery)
Figure 60. Europe Antisense Oligonucleotide Therapeutics Market by Value, 2021-2031 (USD Billion, AGR (%)) (W-Shaped Recovery)
Figure 61. Europe Antisense Oligonucleotide Therapeutics Market by Value, 2021-2031 (USD Billion, AGR (%)) (U-Shaped Recovery)
Figure 62. Europe Antisense Oligonucleotide Therapeutics Market by Value, 2021-2031 (USD Billion, AGR (%)) (L-Shaped Recovery)
Figure 63. Europe Antisense Oligonucleotide Therapeutics Market by Country, 2021-2031 (USD Billion, AGR (%))
Figure 64. Europe Antisense Oligonucleotide Therapeutics Market by Country, 2021-2031 (USD Billion, AGR (%)) (V-Shaped Recovery)
Figure 65. Europe Antisense Oligonucleotide Therapeutics Market by Country, 2021-2031 (USD Billion, AGR (%)) (W-Shaped Recovery)
Figure 66. Europe Antisense Oligonucleotide Therapeutics Market by Country, 2021-2031 (USD Billion, AGR (%)) (U-Shaped Recovery)
Figure 67. Europe Antisense Oligonucleotide Therapeutics Market by Country, 2021-2031 (USD Billion, AGR (%)) (L-Shaped Recovery)
Figure 68. Europe Antisense Oligonucleotide Therapeutics Market by Therapeutic Area, 2021-2031 (USD Billion, AGR (%))
Figure 69. Europe Antisense Oligonucleotide Therapeutics Market by Therapeutic Area, 2021-2031 (USD Billion, AGR (%)) (V-Shaped Recovery)
Figure 70. Europe Antisense Oligonucleotide Therapeutics Market by Therapeutic Area, 2021-2031 (USD Billion, AGR (%)) (W-Shaped Recovery)
Figure 71. Europe Antisense Oligonucleotide Therapeutics Market by Therapeutic Area, 2021-2031 (USD Billion, AGR (%)) (U-Shaped Recovery)
Figure 72. Europe Antisense Oligonucleotide Therapeutics Market by Therapeutic Area, 2021-2031 (USD Billion, AGR (%)) (L-Shaped Recovery)
Figure 73. Europe Antisense Oligonucleotide Therapeutics Market by Route of Administration, 2021-2031 (USD Billion, AGR (%))
Figure 74. Europe Antisense Oligonucleotide Therapeutics Market by Route of Administration, 2021-2031 (USD Billion, AGR (%)) (V-Shaped Recovery)
Figure 75. Europe Antisense Oligonucleotide Therapeutics Market by Route of Administration, 2021-2031 (USD Billion, AGR (%)) (W-Shaped Recovery)
Figure 76. Europe Antisense Oligonucleotide Therapeutics Market by Route of Administration, 2021-2031 (USD Billion, AGR (%)) (U-Shaped Recovery)
Figure 77. Europe Antisense Oligonucleotide Therapeutics Market by Route of Administration, 2021-2031 (USD Billion, AGR (%)) (L-Shaped Recovery)
Figure 78. Europe Antisense Oligonucleotide Therapeutics Market by Type, 2021-2031 (USD Billion, AGR (%))
Figure 79. Europe Antisense Oligonucleotide Therapeutics Market by Type, 2021-2031 (USD Billion, AGR (%)) (V-Shaped Recovery)
Figure 80. Europe Antisense Oligonucleotide Therapeutics Market by Type, 2021-2031 (USD Billion, AGR (%)) (W-Shaped Recovery)
Figure 81. Europe Antisense Oligonucleotide Therapeutics Market by Type, 2021-2031 (USD Billion, AGR (%)) (U-Shaped Recovery)
Figure 82. Europe Antisense Oligonucleotide Therapeutics Market by Type, 2021-2031 (USD Billion, AGR (%)) (L-Shaped Recovery)
Figure 83. Asia-Pacific Antisense Oligonucleotide Therapeutics Market by Value, 2021-2031 (USD Billion, AGR (%))
Figure 84. Asia-Pacific Antisense Oligonucleotide Therapeutics Market by Value, 2021-2031 (USD Billion, AGR (%)) (V-Shaped Recovery)
Figure 85. Asia-Pacific Antisense Oligonucleotide Therapeutics Market by Value, 2021-2031 (USD Billion, AGR (%)) (W-Shaped Recovery)
Figure 86. Asia-Pacific Antisense Oligonucleotide Therapeutics Market by Value, 2021-2031 (USD Billion, AGR (%)) (U-Shaped Recovery)
Figure 87. Asia-Pacific Antisense Oligonucleotide Therapeutics Market by Value, 2021-2031 (USD Billion, AGR (%)) (L-Shaped Recovery)
Figure 88. Asia-Pacific Antisense Oligonucleotide Therapeutics Market by Country, 2021-2031 (USD Billion, AGR (%))
Figure 89. Asia-Pacific Antisense Oligonucleotide Therapeutics Market by Country, 2021-2031 (USD Billion, AGR (%)) (V-Shaped Recovery)
Figure 90. Asia-Pacific Antisense Oligonucleotide Therapeutics Market by Country, 2021-2031 (USD Billion, AGR (%)) (W-Shaped Recovery)
Figure 91. Asia-Pacific Antisense Oligonucleotide Therapeutics Market by Country, 2021-2031 (USD Billion, AGR (%)) (U-Shaped Recovery)
Figure 92. Asia-Pacific Antisense Oligonucleotide Therapeutics Market by Country, 2021-2031 (USD Billion, AGR (%)) (L-Shaped Recovery)
Figure 93. Asia-Pacific Antisense Oligonucleotide Therapeutics Market by Therapeutic Area, 2021-2031 (USD Billion, AGR (%))
Figure 94. Asia-Pacific Antisense Oligonucleotide Therapeutics Market by Therapeutic Area, 2021-2031 (USD Billion, AGR (%)) (V-Shaped Recovery)
Figure 95. Asia-Pacific Antisense Oligonucleotide Therapeutics Market by Therapeutic Area, 2021-2031 (USD Billion, AGR (%)) (W-Shaped Recovery)
Figure 96. Asia-Pacific Antisense Oligonucleotide Therapeutics Market by Therapeutic Area, 2021-2031 (USD Billion, AGR (%)) (U-Shaped Recovery)
Figure 97. Asia-Pacific Antisense Oligonucleotide Therapeutics Market by Therapeutic Area, 2021-2031 (USD Billion, AGR (%)) (L-Shaped Recovery)
Figure 98. Asia-Pacific Antisense Oligonucleotide Therapeutics Market by Route of Administration, 2021-2031 (USD Billion, AGR (%))
Figure 99. Asia-Pacific Antisense Oligonucleotide Therapeutics Market by Route of Administration, 2021-2031 (USD Billion, AGR (%)) (V-Shaped Recovery)
Figure 100. Asia-Pacific Antisense Oligonucleotide Therapeutics Market by Route of Administration, 2021-2031 (USD Billion, AGR (%)) (W-Shaped Recovery)
Figure 101. Asia-Pacific Antisense Oligonucleotide Therapeutics Market by Route of Administration, 2021-2031 (USD Billion, AGR (%)) (U-Shaped Recovery)
Figure 102. Asia-Pacific Antisense Oligonucleotide Therapeutics Market by Route of Administration, 2021-2031 (USD Billion, AGR (%)) (L-Shaped Recovery)
Figure 103. Asia-Pacific Antisense Oligonucleotide Therapeutics Market by Type, 2021-2031 (USD Billion, AGR (%))
Figure 104. Asia-Pacific Antisense Oligonucleotide Therapeutics Market by Type, 2021-2031 (USD Billion, AGR (%)) (V-Shaped Recovery)
Figure 105. Asia-Pacific Antisense Oligonucleotide Therapeutics Market by Type, 2021-2031 (USD Billion, AGR (%)) (W-Shaped Recovery)
Figure 106. Asia-Pacific Antisense Oligonucleotide Therapeutics Market by Type, 2021-2031 (USD Billion, AGR (%)) (U-Shaped Recovery)
Figure 107. Asia-Pacific Antisense Oligonucleotide Therapeutics Market by Type, 2021-2031 (USD Billion, AGR (%)) (L-Shaped Recovery)
Figure 108. LAMEA Antisense Oligonucleotide Therapeutics Market by Value, 2021-2031 (USD Billion, AGR (%))
Figure 109. LAMEA Antisense Oligonucleotide Therapeutics Market by Value, 2021-2031 (USD Billion, AGR (%)) (V-Shaped Recovery)
Figure 110. LAMEA Antisense Oligonucleotide Therapeutics Market by Value, 2021-2031 (USD Billion, AGR (%)) (W-Shaped Recovery)
Figure 111. LAMEA Antisense Oligonucleotide Therapeutics Market by Value, 2021-2031 (USD Billion, AGR (%)) (U-Shaped Recovery)
Figure 112. LAMEA Antisense Oligonucleotide Therapeutics Market by Value, 2021-2031 (USD Billion, AGR (%)) (L-Shaped Recovery)
Figure 113. LAMEA Antisense Oligonucleotide Therapeutics Market by Country, 2021-2031 (USD Billion, AGR (%))
Figure 114. LAMEA Antisense Oligonucleotide Therapeutics Market by Country, 2021-2031 (USD Billion, AGR (%)) (V-Shaped Recovery)
Figure 115. LAMEA Antisense Oligonucleotide Therapeutics Market by Country, 2021-2031 (USD Billion, AGR (%)) (W-Shaped Recovery)
Figure 116. LAMEA Antisense Oligonucleotide Therapeutics Market by Country, 2021-2031 (USD Billion, AGR (%)) (U-Shaped Recovery)
Figure 117. LAMEA Antisense Oligonucleotide Therapeutics Market by Country, 2021-2031 (USD Billion, AGR (%)) (L-Shaped Recovery)
Figure 118. LAMEA Antisense Oligonucleotide Therapeutics Market by Therapeutic Area, 2021-2031 (USD Billion, AGR (%))
Figure 119. LAMEA Antisense Oligonucleotide Therapeutics Market by Therapeutic Area, 2021-2031 (USD Billion, AGR (%)) (V-Shaped Recovery)
Figure 120. LAMEA Antisense Oligonucleotide Therapeutics Market by Therapeutic Area, 2021-2031 (USD Billion, AGR (%)) (W-Shaped Recovery)
Figure 121. LAMEA Antisense Oligonucleotide Therapeutics Market by Therapeutic Area, 2021-2031 (USD Billion, AGR (%)) (U-Shaped Recovery)
Figure 122. LAMEA Antisense Oligonucleotide Therapeutics Market by Therapeutic Area, 2021-2031 (USD Billion, AGR (%)) (L-Shaped Recovery)
Figure 123. LAMEA Antisense Oligonucleotide Therapeutics Market by Route of Administration, 2021-2031 (USD Billion, AGR (%))
Figure 124. LAMEA Antisense Oligonucleotide Therapeutics Market by Route of Administration, 2021-2031 (USD Billion, AGR (%)) (V-Shaped Recovery)
Figure 125. LAMEA Antisense Oligonucleotide Therapeutics Market by Route of Administration, 2021-2031 (USD Billion, AGR (%)) (W-Shaped Recovery)
Figure 126. LAMEA Antisense Oligonucleotide Therapeutics Market by Route of Administration, 2021-2031 (USD Billion, AGR (%)) (U-Shaped Recovery)
Figure 127. LAMEA Antisense Oligonucleotide Therapeutics Market by Route of Administration, 2021-2031 (USD Billion, AGR (%)) (L-Shaped Recovery)
Figure 128. LAMEA Antisense Oligonucleotide Therapeutics Market by Type, 2021-2031 (USD Billion, AGR (%))
Figure 129. LAMEA Antisense Oligonucleotide Therapeutics Market by Type, 2021-2031 (USD Billion, AGR (%)) (V-Shaped Recovery)
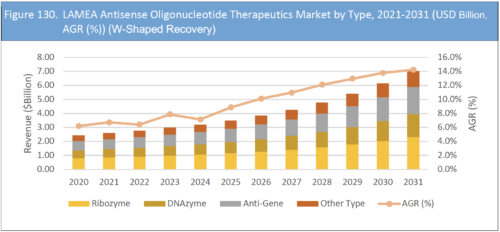
Figure 130. LAMEA Antisense Oligonucleotide Therapeutics Market by Type, 2021-2031 (USD Billion, AGR (%)) (W-Shaped Recovery)
Figure 131. LAMEA Antisense Oligonucleotide Therapeutics Market by Type, 2021-2031 (USD Billion, AGR (%)) (U-Shaped Recovery)
Figure 132. LAMEA Antisense Oligonucleotide Therapeutics Market by Type, 2021-2031 (USD Billion, AGR (%)) (L-Shaped Recovery)
Figure 133. Ionic Pharmaceuticals, Inc.: Company Revenue 2016-2020 (US$ Million, AGR %)
Figure 134. Ionic Pharmaceuticals, Inc.: Company Operating Income 2016-2020 (US$ Million, AGR %)
Figure 135. Ionic Pharmaceuticals, Inc.: Company Net Income 2016-2020 (US$ Million, AGR %)
Figure 136. Ionic Pharmaceuticals, Inc,: Company EBITDA 2016-2020 (US$ Million, AGR %)
Figure 137. Sarpeta Therapeutics Inc.: Company Revenue 2016-2020 (US$ Million, AGR %)
Figure 138. Sarpeta Therapeutics Inc.: Company Operating Income 2016-2020 (US$ Million, AGR %)
Figure 139. Sarpeta Therapeutics Inc.: Company Net Income 2016-2020 (US$ Million, AGR %)
Figure 140. Sarpeta Therapeutics Inc.: Company EBITDA 2015-2019 (US$ Million, AGR %)
Figure 141. Biogen Inc.: Company Revenue 2016-2020 (US$ Million, AGR %)
Figure 142. Biogen Inc.: Company Operating Income 2016-2020 (US$ Million, AGR %)
Figure 143. Biogen Inc.: Company Net Income 2016-2020 (US$ Million, AGR %)
Figure 144. Biogen Inc.: Company EBITDA 2016-2020 (US$ Million, AGR %)
Figure 145. Alnylam Pharmaceuticals, Inc.: Company Revenue 2016-2020 (US$ Million, AGR %)
Figure 146. Alnylam Pharmaceuticals, Inc.: Company Operating Income 2016-2020 (US$ Million, AGR %)
Figure 147. Alnylam Pharmaceuticals, Inc.: Company Net Income 2016-2020 (US$ Million, AGR %)
Figure 148. Alnylam Pharmaceuticals, Inc.: Company EBITDA 2016-2020 (US$ Million, AGR %)
Figure 149. Antisense Therapeutics Limited.: Company Revenue 2016-2020 (US$ Million, AGR %)
Figure 150. Antisense Therapeutics Limited.: Company Operating Income 2016-2020 (US$ Million, AGR %)
Figure 151. Antisense Therapeutics Limited.: Company Net Income 2016-2020 (US$ Million, AGR %)
Figure 152. Antisense Therapeutics Limited.: Company EBITDA 2016-2020 (US$ Million, AGR %)
Figure 153. Arrowhead Pharmaceuticals, Inc.: Company Revenue 2016-2020 (US$ Million, AGR %)
Figure 154. Arrowhead Pharmaceuticals, Inc.: Company Operating Income 2016-2020 (US$ Million, AGR %)
Figure 155. Arrowhead Pharmaceuticals, Inc.: Company Net Income 2016-2020 (US$ Million, AGR %)
Figure 156. Arrowhead Pharmaceuticals, Inc.: Company EBITDA 2016-2020 (US$ Million, AGR %)
Figure 157. Enzon Pharmaceuticals, Inc.: Company Revenue 2016-2020 (US$ Million, AGR %)
Figure 158. Enzon Pharmaceuticals, Inc.: Company Operating Income 2016-2020 (US$ Million, AGR %)
Figure 159. Enzon Pharmaceuticals, Inc.: Company Net Income 2016-2020 (US$ Million, AGR %)
Figure 160. Enzon Pharmaceuticals, Inc.: Company EBITDA 2016-2020 (US$ Million, AGR %)
Figure 161. Bio-Path Holdings, Inc.: Company Revenue 2015-2019 (US$ Million, AGR %)
Figure 162. Bio-Path Holdings, Inc.: Company Operating Income 2015-2019 (US$ Million, AGR %)
Figure 163. Bio-Path Holdings, Inc.: Company Net Income 2015-2019 (US$ Million, AGR %)
Figure 164. Bio-Path Holdings, Inc.: Company EBITDA 2015-2019 (US$ Million, AGR %)
Figure 165. GlaxoSmithKline Plc.: Company Revenue 2016-2020 (US$ Million, AGR %)
Figure 166. GlaxoSmithKline Plc.: Company Operating Income 2016-2020 (US$ Million, AGR %)
Figure 167. GlaxoSmithKline Plc.: Company Net Income 2016-2020 (US$ Million, AGR %)
Figure 168. GlaxoSmithKline Plc.: Company EBITDA 2016-2020 (US$ Million, AGR %)
Figure 169. Geron Corporation, .: Company Revenue 2015-2019 (US$ Million, AGR %)
Figure 170. Geron Corporation.: Company Operating Income 2015-2019 (US$ Million, AGR %)
Figure 171. Geron Corporation.: Company Net Income 2015-2019 (US$ Million, AGR %)
Figure 172. Geron Corporation.: Company EBITDA 2015-2019 (US$ Million, AGR %)
Alnylam Pharmaceuticals, Inc.
Antisense Therapeutics Limited (ANP)
Arrowhead Pharmaceuticals, Inc.,
Bio-Path Holdings, Inc.
Biogen Inc.
Enzon Pharmaceuticals, Inc.
Geron Corporation (Geron)
GlaxoSmithKline PLC
Ionis Pharmaceuticals, Inc.
Sarepta Therapeutics, Inc.
List of Other Notable Companies
Akcea Therapeutics
Alnylam Pharmaceuticals Inc.
Antisense Therapeutics
Arbutus Biopharma,
Arrowhead Pharmaceuticals
Astellas Pharma Inc
AstraZenca
Bayer AG
Benitec Biopharma Ltd.
Bio-Path Holdings Inc.
Biomarin/Prosensa
BioNTech
Creative Biolabs
CureVac AG
Dicerna Pharmaceuticals Inc.
Eli Lilly and Company
Evox Therapeutics Ltd
F. Hoffmann-La Roche Ltd
Gene Signal
Glaxo Smith Kline
Gradalis Inc.
iCo Therapeutics
Ionis Pharmaceuticals
miRagen Therapeutics Inc.
Moderna Inc.
Olix Pharmaceuticals
OncoGenex Pharmaceuticals Inc
Phio Pharmaceuticals
Quark Pharmaceuticals,
Regulus Therapeutics
Rexahn Pharmaceutical Inc.
Sanofi-Genzyme
Sarepta Therapeutics
Silence Therapeutics
Silenseed
Sirnaomics Inc.
Sylentis S.A.
Synlogic Inc.
Tekmira Pharmaceuticals
List of Organizations Mentioned in the Report
American College of Cardiology
American College of Clinical Pharmacology
American Heart Association
American Journal of Infection Control (AJIC)
Biomedical Advanced Research and Development Authority (BARDA).
Center for Disease Control and Prevention CDC
Center for Diseases Dynamics, Economics & Policy (CDDEP)
Department of Health
Infection Control & Hospital Epidemiology
National Association for Biomedical Research
National Center for Biotechnology Information,
National Institute of Allergy and Infectious Diseases (NIAID)
National Institutes of Health
Organic Process Research & Development
The European Medicines Agency (EMA)
The Global Health Security Agenda (GHSA)
U.S. Center for Disease Control and Prevention (CDC)
U.S. Department of Health & Human Services
U.S. Environmental Protection Agency
US Food & Drug Administration
US National Library of Medicine
World Health Organization
Download sample pages
Complete the form below to download your free sample pages for Antisense Oligonucleotide (ASO) Therapeutics Market Report 2021-2031
Related reports
-
Antibiotics Market Report 2023-2033
The global Antibiotics market is projected to grow at a CAGR of 4.15% by 2033...Full DetailsPublished: 31 January 2023 -
Cell Therapy Technologies Market Report 2021-2031
Cell therapy technology is one of the fastest growing markets and is an ever-changing landscape. It represents the umbrella of...Full DetailsPublished: 10 March 2021 -
HIV and HBV Therapies Market Report 2022-2032
The global HIV and HBV Therapies market is estimated to be valued at US$36.2 billion in 2022 and is projected...Full DetailsPublished: 11 November 2022 -
Cancer Biologics Therapies Market Report 2021-2031
The main drivers for the growth include technological advancements in the development of novel biomarkers, rising preference for minimally or...Full DetailsPublished: 01 April 2021 -
Antibiotics Market Report 2021-2031
The rising prevalence of tuberculosis, malaria, pneumonia, bacterial skin infections, HIV/AIDS, urinary tract infections (UTI), and other diseases will support...Full DetailsPublished: 15 April 2021 -
Global Alzheimer’s Disease Therapeutics and Diagnostics Market 2018-2028
The Alzheimer’s Disease Therapeutics and Diagnostics Market will reach $7.93bn in 2018. The Alzheimer’s Disease Therapeutics and Diagnostics Market is...
Full DetailsPublished: 18 June 2018 -

Vaccine Adjuvants Market Report 2021-2031
The opportunity for innovation within the vaccine adjuvants market remains strong. As time progresses, the technology used in the manufacturing...Full DetailsPublished: 02 February 2021 -
Antiviral Drugs Treatment Market Report 2021-2031
Rising incidences of viral infection; increasing geriatric population is projected to propel the demand for anti-viral drugs; advancement in anti-viral...Full DetailsPublished: 26 April 2021 -
Metabolic Disorder Therapeutics Report 2020-2030
Metabolic Disorder Therapeutics– our new study reveals trends, R&D progress, and predicted revenues
Where is the Metabolic Disorder Therapeutics market...Full DetailsPublished: 01 January 1970 -
Antisense & RNAi Therapeutics Market Forecast 2020-2030
The Antisense & RNAi Therapeutics market is projected at USD 1.32 billion in 2020 and is anticipated to see a...
Full DetailsPublished: 01 January 1970
Download sample pages
Complete the form below to download your free sample pages for Antisense Oligonucleotide (ASO) Therapeutics Market Report 2021-2031
Do you have any custom requirements we can help you with?
Any specific country, geo region, market segment or specific company information?
Email us today, we can discuss your needs and see how we can help: jamie.roberts@visiongain.com
Would you like a free report overview of the report of your choice?
If so, please drop an email to Jamie Roberts stating your chosen report title to jamie.roberts@visiongain.com
Visiongain’s reports are based on comprehensive primary and secondary research. Those studies provide global market forecasts (sales by drug and class, with sub-markets and leading nations covered) and analyses of market drivers and restraints (including SWOT analysis) and current pipeline developments. To find out more about our reports methodology, please email jamie.roberts@visiongain.com
“Thank you for this Gene Therapy R&D Market report and for how easy the process was. Your colleague was very helpful and the report is just right for my purpose. This is the 2nd good report from Visiongain and a good price.”
Dr Luz Chapa Azuella, Mexico
American Association of Colleges of Pharmacy
American College of Clinical Pharmacy
American Pharmacists Association
American Society for Pharmacy Law
American Society of Consultant Pharmacists
American Society of Health-System Pharmacists
Association of Special Pharmaceutical Manufacturers
Australian College of Pharmacy
Biotechnology Industry Organization
Canadian Pharmacists Association
Canadian Society of Hospital Pharmacists
Chinese Pharmaceutical Association
College of Psychiatric and Neurologic Pharmacists
Danish Association of Pharmaconomists
European Association of Employed Community Pharmacists in Europe
European Medicines Agency
Federal Drugs Agency
General Medical Council
Head of Medicines Agency
International Federation of Pharmaceutical Manufacturers & Associations
International Pharmaceutical Federation
International Pharmaceutical Students’ Federation
Medicines and Healthcare Products Regulatory Agency
National Pharmacy Association
Norwegian Pharmacy Association
Ontario Pharmacists Association
Pakistan Pharmacists Association
Pharmaceutical Association of Mauritius
Pharmaceutical Group of the European Union
Pharmaceutical Society of Australia
Pharmaceutical Society of Ireland
Pharmaceutical Society Of New Zealand
Pharmaceutical Society of Northern Ireland
Professional Compounding Centers of America
Royal Pharmaceutical Society
The American Association of Pharmaceutical Scientists
The BioIndustry Association
The Controlled Release Society
The European Federation of Pharmaceutical Industries and Associations
The European Personalised Medicine Association
The Institute of Clinical Research
The International Society for Pharmaceutical Engineering
The Pharmaceutical Association of Israel
The Pharmaceutical Research and Manufacturers of America
The Pharmacy Guild of Australia
The Society of Hospital Pharmacists of Australia
Don’t Miss Out!
Subscribe to receive the latest Industry news, trending insight and analysis straight to your inbox.Choose your preferences:
Latest Pharma news
Retinal Gene Therapy Market
The global Retinal Gene Therapy market is projected to grow at a CAGR of 9.6% by 2034
26 July 2024
HIV Drugs and Injectables Market
The global HIV Drugs & Injectables market is projected to grow at a CAGR of 4.6 % by 2034
24 July 2024
Digital Twin Technology in Pharmaceutical Manufacturing Market
The global Digital Twin Technology in Pharmaceutical Manufacturing market is projected to grow at a CAGR of 31.3% by 2034
23 July 2024
Specialty Pharma Market
The global Specialty Pharma market is projected to grow at a CAGR of 7.5% by 2034
22 July 2024
