Small Scale LNG is used to supply small or isolated demand centers not connected to pipeline infrastructure, small scale LNG infrastructure is now increasingly deployed to cater to the growing demand for LNG as a transport fuel.
Natural gas can be transported from gas production centers to consumption centers in the form of liquefied natural gas (LNG) through ships and pipelines. Natural gas can be transported in ships and trucks to locations that are not connected to pipelines. Transportation of LNG takes place between exporting terminal (liquefaction plant) to importing terminal (regasification plant).
Small scale liquefaction and regasification infrastructure are ideally placed to assist with the development of stranded assets, the supply of remote residential and commercial demand centers but also the provision of LNG as a fuel.
LNG adoption is rapidly increasing due to the fact that natural gas is a competitive and environment-friendly option when compared to other fossil fuel sources. Small-scale LNG import terminals are primarily designed to serve the fuel requirements of a particular industry such as power generation and/or functions as a hub for ship and truck fueling. The risks associated with the development of large LNG facilities are significantly high when compared to small-scale terminals.
Small-scale LNG import terminals are the most economic option for such nations which have just started adopting LNG as a fuel in their respective industries. Several small nations are importing or planning to import LNG in small quantities specifically to cater to the feeling requirements of the power generation industry.
Several nations such as the Dominican Republic have just started importing LNG in small quantities to fulfil some of their industrial requirements. Such countries do not prefer importing large shipments of LNG as the demand for natural gas is still in the nascent stages in these nations.
The global market for small scale LNG is driven by high levels of spending in established and emerging markets. An important share of future capital expenditure will be driven by the greater deployment of LNG as a fuel, and growing investment in small scale LNG carriers.
Visiongain’s forecasts indicate that the LATAM Small Scale Liquefied Natural Gas (LNG) Market will see a capital expenditure (CAPEX) of $1,002 mn in 2019. Through extensive research and discussions with experts in the industry, Visiongain has identified a series of market trends that will impact the Latin American Small Scale Liquefied Natural Gas (LNG) Market over the coming decade. Do not miss an opportunity to remain informed of key market dynamics and investment opportunities. Contact us to learn more about the report today.
The report will answer questions such as:
• How is the Small Scale Liquefied Natural Gas (LNG) market evolving?
• What is driving and restraining the Small Scale Liquefied Natural Gas (LNG) market dynamics?
• How will each technology in Small Scale Liquefied Natural Gas (LNG segment grow over the forecast period and how much sales will these submarkets account for in 2029?
• How will market shares of each the Small Scale Liquefied Natural Gas (LNG) submarket develop from 2019-2029?
• Which individual technologies will prevail and how will these shifts be responded to?
• Which Small Scale Liquefied Natural Gas (LNG) submarket will be the main driver of the overall market from 2019-2029?
• How will political and regulatory factors influence regional the Small Scale Liquefied Natural Gas (LNG) market and submarkets?
• Will leading national the Small Scale Liquefied Natural Gas (LNG) market broadly follow macroeconomic dynamics, or will individual country sectors outperform the rest of the economy?
• How will market shares of the national markets change by 2029 and which nation will lead the market in 2029?
• Who are the leading players and what are their prospects over the forecast period?
• How will the sector evolve as alliances form during the period between 2019 and 2029?
Four Reasons Why You Must Order and Read This Report Today:
1) The study analyses the LATAM Small Scale Liquefied Natural Gas (LNG) 2019-2029 Market in terms of:
– CAPEX ($ mn)
– Capacity (TTPA)
2) The report provides Forecasts for the LATAM Small Scale Liquefied Natural Gas (LNG) Market by Type, for the period 2019-2029
– Small Scale Regasification Forecast 2019-2029
– Small Scale Liquefaction Forecast 2019-2029
– LNG Satellite Stations Forecast 2019-2029
– LNG Bunkering Facilities for Vessels Forecast 2019-2029
– Fueling Forecast 2019-2029
3) The report also Forecasts and Analyses the LATAM Small Scale Liquefied Natural Gas (LNG) Market by Country from 2019-2029
– Panama
– Costa Rica
– El Salvador
– Guatemala
– Dominican Republic
– Puerto Rico
– Mexico
– Brazil
– Paraguay
– Uruguay
– Argentina
– Peru
– Ecuador
– Venezuela
– Colombia
– Rest of LATAM (Bahamas, Hailti, Bermuda, Barbados, Chile, Jamaica, etc)
4) The report provides Detailed Profiles of The Leading Companies Operating within the Small Scale Liquefied Natural Gas (LNG) Market:
– Gasnor Shell
– Gasum
– Gazprom
– Wartsila
– Prometheus Energy Company
– Petronas
– EcoElectrica Inc.
– Air Products and Chemicals, Inc.
– ENN Energy Holdings Limited
– Sinopec
– Petroperu
– AES Republica Dominicana
– ENARSA
This independent 165-page report guarantees you will remain better informed than your competitors. With 139 tables and figures examining the Small Scale Liquefied Natural Gas (LNG) market space, the report gives you a direct, detailed breakdown of the market. PLUS, Capital expenditure and Capacity by type and geography, as well as in-depth analysis of leading companies in the Small Scale Liquefied Natural Gas (LNG) market from 2019-2029 that will keep your knowledge that one step ahead of your rivals.
This report is essential reading for you or anyone in the Energy sector. Purchasing this report today will help you to recognise those important market opportunities and understand the possibilities there. I look forward to receiving your order.
Visiongain is a trading partner with the US Federal Government
CCR Ref number KD4R6
Do you have any custom requirements we can help you with? Any need for specific country, geo region, market segment or specific company information? Contact us today, we can discuss your needs and see how we can help sara.peerun@visiongain.com
1. Report Overview
1.1 LATAM Small Scale Liquefied Natural Gas (LNG) Market Overview
1.2 Market Structure Overview and Market Definition
1.3 Why You Should Read This Report
1.4 How This Report Delivers
1.5 Key Questions Answered by This Analytical Report Include:
1.6 Who is This Report For?
1.7 Methodology
1.7.1 Primary Research
1.7.2 Secondary Research
1.7.3 Market Evaluation & Forecasting Methodology
1.8 Frequently Asked Questions (FAQ)
1.9 Associated Visiongain Reports
1.10 About Visiongain
2. Introduction to The Small Scale Liquefied Natural Gas (LNG) Market
2.1 Latin America Small Scale LNG Market Structure
2.2 Market Definition
2.3 Small Scale LNG Industry Outlook
2.4 Small Scale LNG- Value Chain Analysis
3. Latin America Overview of Small Scale Liquefied Natural Gas (LNG) Market
3.1 Latin America Small Scale Liquefied Natural Gas (LNG) Market Drivers and Restraints
4. Small Scale Liquefied Natural Gas (LNG) Submarkets Forecasts 2019-2029
4.1 Latin America Small Scale Liquefied Natural Gas (LNG) Submarkets Forecasts, by Type 2019-2029
4.1.1 Latin America Small Scale Regasification Forecasts 2019-2029
4.1.1.1 Latin America Small Scale Regasification Drivers and Restraints
4.1.2 Latin America Small Scale Liquefaction Forecasts 2019-2029
4.1.2.1 Latin America Small Scale Liquefaction Drivers and Restraints
4.1.3 Latin America LNG Satellite Stations Forecasts 2019-2029
4.1.3.1 Latin America LNG Satellite Stations Drivers and Restraints
4.1.4 Latin America LNG Bunkering Facilities for Vessels Forecasts 2019-2029
4.1.4.1 Latin America LNG Bunkering Facilities for Vessels Drivers and Restraints
4.1.5 Latin America Fuelling Forecasts 2019-2029
4.1.5.1 Latin America Fuelling Drivers and Restraints
5. Leading National LATAM SSLNG Market Forecasts 2019-2029
5.1 Panama Small Scale Liquefied Natural Gas (SSLNG) Market
5.1.1 Panama Small Scale Liquefied Natural Gas (SSLNG) Submarket Forecast
5.1.2 Panama Small Scale Liquefied Natural Gas (SSLNG) Market Analysis
5.2 Costa Rica Small Scale Liquefied Natural Gas (SSLNG) Market
5.2.1 Costa Rica Small Scale Liquefied Natural Gas (SSLNG) Submarket Forecast
5.2.2 Costa Rica Small Scale Liquefied Natural Gas (SSLNG) Market Analysis
5.3 El Salvador Small Scale Liquefied Natural Gas (SSLNG) Market
5.3.1 El Salvador Small Scale Liquefied Natural Gas (SSLNG) Submarket Forecast
5.3.2 El Salvador Small Scale Liquefied Natural Gas (SSLNG) Market Analysis
5.4 Guatemala Small Scale Liquefied Natural Gas (SSLNG) Market
5.4.1 Guatemala Small Scale Liquefied Natural Gas (SSLNG) Market Analysis
5.5 Dominican Republic Small Scale Liquefied Natural Gas (SSLNG) Market
5.5.1 Dominican Republic Small Scale Liquefied Natural Gas (SSLNG) Submarket Forecast
5.5.2 Dominican Republic Small Scale Liquefied Natural Gas (SSLNG) Market Analysis
5.6 Puerto Rico Small Scale Liquefied Natural Gas (SSLNG) Market
5.6.1 Puerto Rico Small Scale Liquefied Natural Gas (SSLNG) Submarket Forecast
5.6.2 Puerto Rico Small Scale Liquefied Natural Gas (SSLNG) Market Analysis
5.7 Mexico Small Scale Liquefied Natural Gas (SSLNG) Market
5.7.1 Mexico Small Scale Liquefied Natural Gas (SSLNG) Submarket Forecast
5.7.2 Mexico Small Scale Liquefied Natural Gas (SSLNG) Market Analysis
5.8 Brazil Small Scale Liquefied Natural Gas (SSLNG) Market
5.8.1 Brazil Small Scale Liquefied Natural Gas (SSLNG) Submarket Forecast
5.8.2 Brazil Small Scale Liquefied Natural Gas (SSLNG) Market Analysis
5.9 Paraguay Small Scale Liquefied Natural Gas (SSLNG) Market
5.9.1 Paraguay Small Scale Liquefied Natural Gas (SSLNG) Market Analysis
5.10 Uruguay Small Scale Liquefied Natural Gas (SSLNG) Market
5.10.1 Uruguay Small Scale Liquefied Natural Gas (SSLNG) Submarket Forecast
5.10.2 Uruguay Small Scale Liquefied Natural Gas (SSLNG) Market Analysis
5.11 Argentina Small Scale Liquefied Natural Gas (SSLNG) Market
5.11.1 Argentina Small Scale Liquefied Natural Gas (SSLNG) Submarket Forecast
5.11.2 Argentina Small Scale Liquefied Natural Gas (SSLNG) Market Analysis
5.12 Peru Small Scale Liquefied Natural Gas (SSLNG) Market
5.12.1 Peru Small Scale Liquefied Natural Gas SSLNG) Submarket Forecast
5.12.2 Peru Small Scale Liquefied Natural Gas (SSLNG) Market Analysis
5.13 Ecuador Small Scale Liquefied Natural Gas (SSLNG) Market
5.13.1 Ecuador Small Scale Liquefied Natural Gas (SSLNG) Submarket Forecast
5.13.2 Ecuador Small Scale Liquefied Natural Gas (SSLNG) Market Analysis
5.14 Venezuela Small Scale Liquefied Natural Gas (SSLNG) Market
5.14.1 Venezuela Small Scale Liquefied Natural Gas (SSLNG) Submarket Forecast
5.14.2 Venezuela Small Scale Liquefied Natural Gas (SSLNG) Market Analysis
5.15 Colombia Small Scale Liquefied Natural Gas (SSLNG) Market
5.15.1 Colombia Small Scale Liquefied Natural Gas (SSLNG) Submarket Forecast
5.15.2 Colombia Small Scale Liquefied Natural Gas (SSLNG) Market Analysis
5.16 Rest of Latin America Small Scale Liquefied Natural Gas (SSLNG) Market
5.16.1 Rest of Latin America Small Scale Liquefied Natural Gas (SSLNG) Submarket Forecast
5.16.2 Rest of Latin America Small Scale Liquefied Natural Gas (SSLNG) Market Analysis
6. PEST Analysis of the Latin America Small Scale LNG Market
7. Expert Opinion
7.1 Primary Correspondents
7.2 Small Scale LNG Market Outlook
7.4 Drivers & Restraints
7.3 Dominant Region in the Small-Scale LNG Market
7.4 By type Market Scenario
7.5 Overall Growth Rate of LATAM SSLNG
8. Leading Companies in Small Scale Liquefied Natural Gas (LNG) Market
8.1 Gasnor Shell
8.1.1 Gasnor Shell Company Analysis
8.1.2 Gasnor Shell Company Outlook
8.2 Gasum
8.2.1 Gasum Company Analysis
8.2.2 Gasum Company Outlook
8.3 Gazprom
8.3.1 Gazprom Company Analysis
8.3.2 Gazprom Company Outlook
8.4 Wartsila
8.4.1 Wartsila Company Analysis
8.4.2 Wartsila Company Outlook
8.5 Prometheus Energy Company
8.5.1 Prometheus Energy Company Analysis
8.5.2 Prometheus Energy Company Outlook
8.6 PETRONAS
8.6.1 PETRONAS Company Analysis
8.6.2 PETRONAS Company Outlook
8.7 EcoElectrica Inc.
8.7.1 EcoElectrica Inc. Company Analysis
8.7.2 EcoElectrica Inc. Company Outlook
8.8 Air Products and Chemicals, Inc.
8.8.1 Air Products and Chemicals, Inc. Company Analysis
8.9 ENN Energy Holdings Limited
8.9.1 ENN Energy Holdings Limited Company Analysis
8.9.2 ENN Energy Holdings Limited Company Outlook
8.10 Sinopec Corp.
8.10.1 Sinopec Corp. Company Analysis
8.11 PETROPERÚ S.A.
8.11.1 PETROPERÚ S.A. Company Analysis
8.11.2 PETROPERÚ S.A. Recent Developments
8.12 AES República Dominicana
8.12.1 AES República Dominicana Company Analysis
8.12.2 AES República Dominicana Recent Developments
8.13 ENARSA
8.13.1 ENARSA Company Analysis
8.13.2 ENARSA Recent Developments
9. Conclusion & Recommendations
10. Glossary
Associated Visiongain Reports
Visiongain Report Sales Order Form
Appendix A
About Visiongain
Appendix B
Visiongain report evaluation form
List of Figures
Figure 1.1 LATAM Small Scale LNG Market by Country/Region Market Share Forecast 2019, 2024, 2029 (% Share)
Figure 2.1 Latin America Small Scale LNG Market Segmentation Overview
Figure 2.2 Small Scale LNG, Value Chain Analysis
Figure 3.1 Latin America Small Scale Liquefied Natural Gas (LNG) Forecast 2019-2029 ($mn, AGR %)
Figure 3.2 Latin America Small Scale Liquefied Natural Gas (SSLNG) Market Forecast 2019-2029 (TTPA, AGR %)
Figure 3.3 LATAM Natural Gas Production, 2010-2018, by Key Country
Figure 3.4 LATAM Natural Gas Consumption, 2010-2018, by Key Country
Figure 4.1 Latin America Small Scale Liquefied Natural Gas (LNG) Submarket Forecast, by Type 2019-2029 ($mn, AGR%)
Figure 4.2 Latin America Small Scale Liquefied Natural Gas (LNG) Market by Type Share Forecast 2019, 2024, 2029 (% Share)
Figure 4.3 Small Scale Liquefied Natural Gas (LNG) Market, By Small Scale Regasification Forecast 2019-2029 ($mn, AGR%)
Figure 4.4 Small Scale Liquefied Natural Gas (LNG) Market, By Small Scale Liquefaction Forecast 2019-2029 ($mn, AGR%)
Figure 4.5 Small Scale Liquefied Natural Gas (LNG) Market, By LNG Satellite Stations Forecast 2019-2029 ($mn, AGR%)
Figure 4.6 Small Scale Liquefied Natural Gas (LNG) Market, By LNG Bunkering Facilities for Vessels Forecast 2019-2029 ($mn, AGR%)
Figure 4.7 Small Scale Liquefied Natural Gas (LNG) Market, By Fuelling Forecast 2019-2029 ($mn, AGR%)
Figure 5.1 Global Large Scale VS Small Scale LNG, Global LNG Trade Share % 2018
Figure 5.2 Leading National Small Scale Liquefied Natural Gas (SSLNG) Market Forecast 2018-2028 (TTPA)
Figure 5.3 Leading LATAM National Players in Small Scale Liquefied Natural Gas (SSLNG) Market, % Share, 2019
Figure 5.4 Leading LATAM National Players in Small Scale Liquefied Natural Gas (SSLNG) Market, % Share, 2024
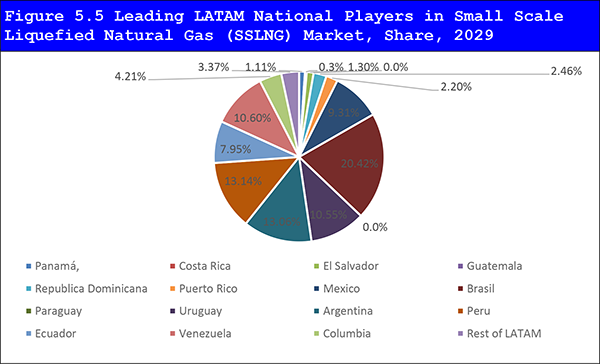
Figure 5.5 Leading LATAM National Players in Small Scale Liquefied Natural Gas (SSLNG) Market, Share, 2029
Figure 5.6 Panama Small Scale Liquefied Natural Gas (SSLNG) Market Forecast 2019-2029 ($mn, AGR %)
Figure 5.7 Panama Small Scale Liquefied Natural Gas (SSLNG) Market Forecast 2019-2029 (TTPA, AGR %)
Figure 5.8 Costa Rica Small Scale Liquefied Natural Gas (SSLNG) Market Forecast 2019-2029 ($mn, AGR %)
Figure 5.9 Costa Rica Small Scale Liquefied Natural Gas (SSLNG) Market Forecast 2019-2029 (TTPA, AGR %)
Figure 5.10 El Salvador Small Scale Liquefied Natural Gas (SSLNG) Market Forecast 2019-2029 ($mn, AGR %)
Figure 5.11 El Salvador Small Scale Liquefied Natural Gas (SSLNG) Market Forecast 2019-2029 (TTPA, AGR %)
Figure 5.12 Dominican Republic Small Scale Liquefied Natural Gas (SSLNG) Market Forecast 2019-2029 ($mn, AGR %)
Figure 5.13 Dominican Republic Small Scale Liquefied Natural Gas (SSLNG) Market Forecast 2019-2029 (TTPA, AGR %)
Figure 5.14 Puerto Rico Small Scale Liquefied Natural Gas (SSLNG) Market Forecast 2019-2029 ($mn, AGR %)
Figure 5.15 Puerto Rico Small Scale Liquefied Natural Gas (SSLNG) Market Forecast 2019-2029 (TTPA, AGR %)
Figure 5.16 Mexico Small Scale Liquefied Natural Gas (SSLNG) Market Forecast 2019-2029 ($mn, AGR %)
Figure 5.17 Mexico Small Scale Liquefied Natural Gas (SSLNG) Market Forecast 2019-2029 (TTPA, AGR %)
Figure 5.18 Brazil Small Scale Liquefied Natural Gas (SSLNG) Market Forecast 2019-2029 ($mn, AGR %)
Figure 5.19 Brazil Small Scale Liquefied Natural Gas (SSLNG) Market Forecast 2019-2029 (TTPA, AGR %)
Figure 5.20 Uruguay Small Scale Liquefied Natural Gas (SSLNG) Market Forecast 2019-2029 ($mn, AGR %)
Figure 5.21 Uruguay Small Scale Liquefied Natural Gas (SSLNG) Market Forecast 2019-2029 (TTPA, AGR %)
Figure 5.22 Argentina Small Scale Liquefied Natural Gas (SSLNG) Market Forecast 2019-2029 ($mn, AGR %)
Figure 5.23 Argentina Small Scale Liquefied Natural Gas (SSLNG) Market Forecast 2019-2029 (TTPA, AGR %)
Figure 5.24 Peru Small Scale Liquefied Natural Gas (SSLNG) Market Forecast 2019-2029 ($mn, AGR %)
Figure 5.25 Peru Small Scale Liquefied Natural Gas (SSLNG) Market Forecast 2019-2029 (TTPA, AGR %)
Figure 5.26 Ecuador Small Scale Liquefied Natural Gas (SSLNG) Market Forecast 2019-2029 ($mn, AGR %)
Figure 5.27 Ecuador Small Scale Liquefied Natural Gas (SSLNG) Market Forecast 2019-2029 (TTPA, AGR %)
Figure 5.28 Venezuela Small Scale Liquefied Natural Gas (SSLNG) Market Forecast 2019-2029 ($mn, AGR %)
Figure 5.29 Venezuela Small Scale Liquefied Natural Gas (SSLNG) Market Forecast 2019-2029 (TTPA, AGR %)
Figure 5.30 Colombia Small Scale Liquefied Natural Gas (SSLNG) Market Forecast 2019-2029 ($mn, AGR %)
Figure 5.31 Colombia Small Scale Liquefied Natural Gas (SSLNG) Market Forecast 2019-2029 (TTPA, AGR %)
Figure 5.32 Rest of Latin America Small Scale Liquefied Natural Gas (SSLNG) Market Forecast 2019-2029 ($mn, AGR %)
Figure 5.33 Rest of Latin America Small Scale Liquefied Natural Gas (SSLNG) Market Forecast 2019-2029 (TTPA, AGR %)
Figure 8.2 Wartsila, Revenue ($bn& AGR %), 2014-2018
Figure 8.3 Wartsila Revenue %Share, by Business Segment, 2018
Figure 8.4 Wartsila Revenue %Share, by Regional Segment, 2018
Figure 8.5 PETRONAS Total Company Revenue ($bn & AGR %), 2013-2017
Figure 8.6 Petronas Revenue % Share, by Product Segment, 2017
Figure 8.7 Petronas Revenue % Share, by Geographical Trade, 2017
Figure 8.8 Petronas Revenue % Share, by Business Segment, 2017
Figure 8.9 Petronas Revenue % Share, by Geographic Segment, 2017
Figure 8.10 Air Products and Chemicals, Inc Total Company Revenue($bn, AGR %), 2014-2018
Figure 8.11 Air Products and Chemicals, Inc Revenue % Share, by Regional Segment, 2018
Figure 8.12 Air Products and Chemicals, Inc Revenue % Share, by Business Segment, 2018
Figure 8.13 ENN Energy Holdings Limited Total Company Revenue($bn& AGR %), 2014-2018
Figure 8.14 Sinopec Corp., Revenue, ($bn& AGR %), 2013-2017
Figure 8.15 Sinopec Corp., Revenue %Share, by Regional Segment, 2017
Figure 8.16 Sinopec Corp., Sale of Chemical Products, By Product, 2017 (Thousand Tonnes)
Figure 8.17 PETROPERÚ S.A., Sales 2108
List of Tables
Table 3.1 Latin America Small Scale Liquefied Natural Gas (SSLNG) Market by Forecast 2019-2029 ($mn, TTPA, AGR %, CAGR %, Cumulative)
Table 3.2 Latin America Small Scale Liquefied Natural Gas (LNG) Market Drivers and Restraints
Table 3.3 LATAM SSLNG Projects: Existing and Planned
Table 4.1 Latin America Small Scale Liquefied Natural Gas (LNG) Market Forecast 2019-2029($mn, AGR %, Cumulative)
Table 4.2 Latin America Small Scale Regasification Forecast 2019-2029($mn, AGR %, CAGR %, Cumulative)
Table 4.3 Latin America Small Scale Regasification Drivers and Restraints
Table 4.4 Latin America Small Scale Liquefaction Forecast 2019-2029($mn, AGR %, CAGR %, Cumulative)
Table 4.5 Latin America Small Scale Liquefaction Drivers and Restraints
Table 4.6 Latin America LNG Satellite Stations Forecast 2019-2029 ($mn, AGR %, CAGR %, Cumulative)
Table 4.7 Latin America LNG Satellite Stations Drivers and Restraints
Table 4.8 Latin America LNG Bunkering Facilities for Vessels Forecast 2019-2029($mn, AGR %, CAGR %, Cumulative)
Table 4.9 Latin America LNG Bunkering Facilities for Vessels Drivers and Restraints
Table 4.10 Latin America Fuelling Forecast 2019-2029($mn, AGR %, CAGR %, Cumulative)
Table 4.11 Latin America Fuelling Drivers and Restraints
Table 5.1 Leading National LATAM Small Scale Liquefied Natural Gas (SSLNG) Market Forecast by Submarket 2019-2029 ($mn, AGR )
Table 5.2 Leading National LATAM Small Scale Liquefied Natural Gas (SSLNG) Market Forecast by Submarket 2019-2029 ($mn, AGR )
Table 5.3 Panama Small Scale Liquefied Natural Gas (SSLNG) Market by Forecast 2019-2029 ($mn, TTPA, AGR %, CAGR %, Cumulative)
Table 5.4 Panama Small Scale Liquefied Natural Gas (SSLNG) Market, by Type Forecast 2019-2029 ($mn, AGR %, CAGR %, Cumulative)
Table 5.5 Costa Rica Small Scale Liquefied Natural Gas (SSLNG) Market by Forecast 2019-2029 ($mn, TTPA, AGR %, CAGR %, Cumulative)
Table 5.6 Costa Rica Small Scale Liquefied Natural Gas (SSLNG) Market, by Type Forecast 2019-2029 ($mn, AGR %, CAGR %, Cumulative)
Table 5.7 El Salvador Small Scale Liquefied Natural Gas (SSLNG) Market by Forecast 2019-2029 ($mn, TTPA, AGR %, CAGR %, Cumulative)
Table 5.8 El Salvador Small Scale Liquefied Natural Gas (SSLNG) Market, by Type Forecast 2019-2029 ($mn, AGR %, CAGR %, Cumulative)
Table 5.9 Guatemala Small Scale Liquefied Natural Gas (SSLNG) Market by Forecast 2019-2029 ($mn, TTPA, AGR %, CAGR %, Cumulative)
Table 5.10 Dominican Republic Small Scale Liquefied Natural Gas (SSLNG) Market by Forecast 2019-2029 ($mn, TTPA, AGR %, CAGR %, Cumulative)
Table 5.11 Dominican Republic Small Scale Liquefied Natural Gas (SSLNG) Market, by Type Forecast 2019-2029 ($mn, AGR %, CAGR %, Cumulative)
Table 5.12 Puerto Rico Small Scale Liquefied Natural Gas (SSLNG) Market by Forecast 2019-2029 ($mn, TTPA, AGR %, CAGR %, Cumulative)
Table 5.13 Puerto Rico Small Scale Liquefied Natural Gas (SSLNG) Market, by Type Forecast 2019-2029 ($mn, AGR %, CAGR %, Cumulative)
Table 5.14 Mexico Small Scale Liquefied Natural Gas (SSLNG) Market by Forecast 2019-2029 ($mn, TTPA, AGR %, CAGR %, Cumulative)
Table 5.15 Mexico Small Scale Liquefied Natural Gas (SSLNG) Market, by Type Forecast 2019-2029 ($mn, AGR %, CAGR %, Cumulative)
Table 5.16 Brazil Small Scale Liquefied Natural Gas (SSLNG) Market by Forecast 2019-2029 ($mn, TTPA, AGR %, CAGR %, Cumulative)
Table 5.17 Brazil Small Scale Liquefied Natural Gas (SSLNG) Market, by Type Forecast 2019-2029 ($mn, AGR %, CAGR %, Cumulative)
Table 5.18 Paraguay Small Scale Liquefied Natural Gas (SSLNG) Market by Forecast 2019-2029 ($mn, TTPA, AGR %, CAGR %, Cumulative)
Table 5.19 Uruguay Small Scale Liquefied Natural Gas (SSLNG) Market by Forecast 2019-2029 ($mn, TTPA, AGR %, CAGR %, Cumulative)
Table 5.20 Uruguay Small Scale Liquefied Natural Gas (SSLNG) Market, by Type Forecast 2019-2029 ($mn, AGR %, CAGR %, Cumulative)
Table 5.21 Argentina Small Scale Liquefied Natural Gas (SSLNG) Market by Forecast 2019-2029 ($mn, TTPA, AGR %, CAGR %, Cumulative)
Table 5.22 Argentina Small Scale Liquefied Natural Gas (SSLNG) Market, by Type Forecast 2019-2029 ($mn, AGR %, CAGR %, Cumulative)
Table 5.23 Peru Small Scale Liquefied Natural Gas (SSLNG) Market by Forecast 2019-2029 ($mn, TTPA, AGR %, CAGR %, Cumulative)
Table 5.24 Peru Small Scale Liquefied Natural Gas (SSLNG) Market, by Type Forecast 2019-2029 ($mn, AGR %, CAGR %, Cumulative)
Table 5.25 Ecuador Small Scale Liquefied Natural Gas (SSLNG) Market by Forecast 2019-2029 ($mn, TTPA, AGR %, CAGR %, Cumulative)
Table 5.26 Ecuador Small Scale Liquefied Natural Gas (SSLNG) Market, by Type Forecast 2019-2029 ($mn, AGR %, CAGR %, Cumulative)
Table 5.27 Venezuela Small Scale Liquefied Natural Gas (SSLNG) Market by Forecast 2019-2029 ($mn, TTPA, AGR %, CAGR %, Cumulative)
Table 5.28 Venezuela Small Scale Liquefied Natural Gas (SSLNG) Market, by Type Forecast 2019-2029 ($mn, AGR %, CAGR %, Cumulative)
Table 5.29 Colombia Small Scale Liquefied Natural Gas (SSLNG) Market by Forecast 2019-2029 ($mn, TTPA, AGR %, CAGR %, Cumulative)
Table 5.30 Colombia Small Scale Liquefied Natural Gas (SSLNG) Market, by Type Forecast 2019-2029 ($mn, AGR %, CAGR %, Cumulative)
Table 5.31 Rest of Latin America Small Scale Liquefied Natural Gas (SSLNG) Market by Forecast 2019-2029 ($mn, TTPA, AGR %, CAGR %, Cumulative)
Table 5.32 Rest of Latin America Small Scale Liquefied Natural Gas (SSLNG) Market, by Type Forecast 2019-2029 ($mn, AGR %, CAGR %, Cumulative)
Table 6.1 PEST Analysis, Latin America Small Scale LNG Market
Table 8.1 Gasnor Shell Profile 2018 (Market Entry, Public/Private, Headquarters, Geography, Key Market, Products/Services)
Table 8.2 Gasum 2017 (Market Entry, Public/Private, Headquarters, No. of Employees, Revenue in $mn, Geography, Key Market, Products/Services)
Table 8.4 Gazprom 2018 (Market Entry, Public/Private, Headquarters, No. of Employees, Revenue 2018 ($bn), Change in Revenue, Geography, Key Market, Listed on, Products/Services)
Table 8.5 Gazprom, Total Company Sales 2013-2018 ($bn, AGR %)
Table 8.7 Wartsila Profile 2018 (Market Entry, Public/Private, Headquarters, No. of Employees, Revenue 2018 ($bn), Change in Revenue, Geography, Key Market, Listed on, Products/Services)
Table 8.8 Wartsila Total Company Sales 2014-2018 ($bn, AGR %)
Table 8.9 Prometheus Energy Company Profile 2018 (Market Entry, Public/Private, Headquarters, Geography, Key Market, Products/Services)
Table 8.10 PETRONAS Profile 2018 (Market Entry, Public/Private, Headquarters, No. of Employees, Revenue 2017 ($bn), Change in Revenue, Geography, Key Market, Listed on, Products/Services)
Table 8.11 PETRONAS Total Company Revenue 2013-2017 ($bn, AGR %)
Table 8.12 EcoElectrica Inc. 2018 (Market Entry, Public/Private, Headquarters, Geography, Key Market, Products/Services)
Table 8.13 Air Products and Chemicals, Inc. Profile 2018 (Market Entry, Public/Private, Headquarters, No. of Employees, Revenue 2018 ($bn), Change in Revenue, Geography, Key Market, Listed on, Products/Services)
Table 8.14 Air Products and Chemicals, Inc Total Company Revenue 2014-2018 ($bn, AGR %)
Table 8.15 ENN Energy Holdings Limited Profile 2018 (Market Entry, Public/Private, Headquarters, No. of Employees, Revenue 20178 ($bn), Change in Revenue, Geography, Key Market, Listed on, Products/Services)
Table 8.16 ENN Energy Holdings Limited Total Company Revenue 2014-2018 ($bn, AGR %)
Table 8.17 Sinopec Corp. Profile (Market Entry, Public/Private, Headquarter, No. of Employees, Revenue in $mn, 2017, Change in Revenue from 2016, Geography, Key Markets, Listed on, Products/Services)
Table 8.18 Sinopec Corp. Total Company Sales 2013-2017 ($bn, AGR %)
Table 8.19 PETROPERÚ S.A. Profile 2018 (Market Entry, Public/Private, Headquarters, Geography, Key Market, Products/Services)
Table 8.20 AES República Dominicana Profile 2018 (Market Entry, Public/Private, Headquarters, Geography, Key Market, Products/Services)
Table 8.21 ENARSA Profile 2018 (Market Entry, Public/Private, Headquarters, Geography, Key Market, Products/Services)