Visiongain has calculated that the global Offshore Patrol Vessel (OPV) market will see a market expenditure of $13.5 bn in 2018.Read on to discover the potential business opportunities available.
Offshore patrol vessels (OPVs) are highly versatile ships widely used by coast guards, naval and police forces for Economic Exclusion Zone (EEZ) management roles, including the provision of maritime security to coastal areas, anti-terrorist campaigns, protection of fisheries and humanitarian operations.
OPVs have become an increasingly popular addition to a country’s mix of maritime assets. Besides navies, agencies that also operate patrol vessels include marine police, customs services, ministries of interiors and coast guards.
In the naval vessel market, OPVs are the fastest growing segment and remain the heart of fleet modernization programs. Highly effective patrol vessels with anti-warfare and anti-surface capabilities are developed as weapon and combat systems continue to mature.
With squeezing defence budgets, OPVs are welcomed as a cost-effective solution instead of large and expensive warships for simple patrolling duties. Since, OPVs offer more warfare capabilities to include in a smaller hull, developing navies started relying on OPVs as the core of their maritime defence.
Visiongain’s global Offshore Patrol Vessel (OPV) market report can keep you informed and up to date with the developments in the market, across five different regions: North America, Europe, Asia Pacific. Latin America and Rest of the World.
With reference to this report, it details the key investments trend in the global market, subdivided by regions and capital expenditure by application and by type. Through extensive secondary research and interviews with industry experts, visiongain has identified a series of market trends that will impact the OPV market over the forecast timeframe.
The report will answer questions such as:
– How is the offshore patrol vessel market evolving?
– What is driving and restraining offshore patrol vessel market dynamics?
– How will each offshore patrol vessel submarket segment grow over the forecast period and how much Sales will these submarkets account for in 2028?
– How will market shares of each offshore patrol vessel submarket develop from 2018-2028?
– Which individual technologies will prevail and how will these shifts be responded to?
– Which offshore patrol vessel submarket will be the main driver of the overall market from 2018-2028?
– How will political and regulatory factors influence regional offshore patrol vessel markets and submarkets?
– Will leading national offshore patrol vessel markets broadly follow macroeconomic dynamics, or will individual country sectors outperform the rest of the economy?
– How will market shares of the national markets change by 2028 and which nation will lead the market in 2028?
– Who are the leading players and what are their prospects over the forecast period?
– How will the sector evolve as alliances form during the period between 2018 and 2028?
Five Reasons Why You Must Order and Read This Report Today:
1) The report provides forecasts for the global Offshore Patrol Vessel (OPV), by Application, for the period 2018-2028
– Military Expenditure 2018-2028
– EEZ Protection Expenditure 2018-2028
– Search & Rescue Expenditure 2018-2028
– Others Expenditure 2018-2028
2) The report also forecasts and analyses the Offshore Patrol Vessel (OPV) market by Type from 2018-2028
– Warfighting Expenditure 2018-2028
– Maritime Patrol Expenditure 2018-2028
3) The report reveals the drivers and restraints in the Offshore Patrol Vessel (OPV) market . We show you the prospects for the following regions, including individual breakdowns by Application and Type:
Asia-Pacific
– By Application Expenditure and Forecast 2018-2028
– Military, EEZ Protection, Search & Rescue, and “Others” Expenditure 2018-2028
– Total Asia-Pacific Market Expenditure 2018-2028
– By Type Market Expenditure and Forecast 2018-2028
– By Country Market Expenditure and Forecast 2018-2028
– China Market Expenditure 2018-2028
– Japan Market Expenditure 2018-2028
– India Market Expenditure 2018-2028
– Australia Market Expenditure 2018-2028
– Rest of Asia-Pacific Market Expenditure 2018-2028
North America
– By Application Expenditure and Forecast 2018-2028
– Military, EEZ Protection, Search & Rescue, and “Others” Expenditure 2018-2028
– Total North America Market Expenditure 2018-2028
– By Type Market Expenditure and Forecast 2018-2028
– By Country Market Expenditure and Forecast 2018-2028
Europe
– By Application Expenditure and Forecast 2018-2028
– Military, EEZ Protection, Search & Rescue, and “Others” Expenditure 2018-2028
– Total Europe Market Expenditure 2018-2028
– By Type Market Expenditure and Forecast 2018-2028
– By Country Market Expenditure and Forecast 2018-2028
– Russia Market Expenditure 2018-2028
– UK Market Expenditure 2018-2028
– France Market Expenditure 2018-2028
– Germany Market Expenditure 2018-2028
– Rest of Europe Market Expenditure 2018-2028
Latin America
– By Application Expenditure and Forecast 2018-2028
– Military, EEZ Protection, Search & Rescue, and “Others” Expenditure 2018-2028
– Total Latin America Market Expenditure 2018-2028
– By Type Market Expenditure and Forecast 2018-2028
– By Country Market Expenditure and Forecast 2018-2028
– Brazil Market Expenditure 2018-2028
– Argentina Market Expenditure 2018-2028
– Rest of Latin America Market Expenditure 2018-2028
Rest of the World
– Middle East MARKET EXPENDITURE 2018-2028
– Africa MARKET EXPENDITURE 2018-2028
– By Application Expenditure and Forecast 2018-2028
– By Type Market Expenditure and Forecast 2018-2028
– Rest of World Market Expenditure 2018-2028
– Military, EEZ Protection, Search & Rescue, and “Others” Expenditure 2018-2028
4) The report includes Details of Recent Contracts / Projects / Programmes for Leading Companies in the Offshore Patrol Vessel (OPV)
5) The report provides market share and detailed profiles of the leading companies operating within the Offshore Patrol Vessel (OPV) market:
– BAE,
– General Dynamics,
– Huntington Ingalls,
– Austal,
– Fassmer Gmbh & Co,
– Maritime Partner AS,
– Safe Boats International,
– China Shipbuilding Industry Corporation,
– Daewoo Shipbuilding & Marine Engineering Co., Ltd,
– Fincantieri–Cantieri Navali Italiani S.p.A,
– Garden Reach Shipbuilders & Engineers Ltd,
– Goa Shipyard Limited,
– Hyundai Heavy Industries Co., Ltd,
– The Bangkok Dock Company,
– Navantia SA,
– Fr LurssenWerft GmbH & Co.KG,
– Damen Shipyards Group,
– BMT Defence Services Ltd,
– LOMOcean Design,
– Asis Boats
This independent 210-page report guarantees you will remain better informed than your competitors. With 120 tables and 90 figures examining the OPV market space, the report gives you a direct, detailed breakdown of the market. PLUS, Capital expenditure BY Application AND Type, as well as in-depth analysis of Contracts, Projects and Programmes from 2018-2028 that will keep your knowledge that one step ahead of your rivals.
This report is essential reading for you or anyone in the Defence sector. Purchasing this report today will help you to recognise those important market opportunities and understand the possibilities there. I look forward to receiving your order.
Visiongain is a trading partner with the US Federal Government
CCR Ref number: KD4R6
1. Report Overview
1.1 Global Offshore Patrol Vessel Market Overview
1.2 Why You Should Read This Report
1.3 How This Report Delivers
1.4 Key Questions Answered by This Analytical Report Include:
1.5 Who is This Report For?
1.6 Methodology
1.6.1 Primary Research
1.6.2 Secondary Research
1.6.3 Market Evaluation & Forecasting Methodology
1.7 Frequently Asked Questions (FAQ)
1.8 Associated Visiongain Reports
1.9 About Visiongain
2. Introduction to the Offshore Patrol Vessel Market
2.1 Offshore Patrol Vessel Market Structure
2.2 Offshore Patrol Vessel Market Definition
2.3 Introduction to Offshore Patrol Vessel Technology
3. Global Offshore Patrol Vessel Market 2018-2028
3.1 Global Offshore Patrol Vessel Market Forecast 2018-2028
3.2 Global Offshore Patrol Vessel Drivers & Restraints 2018
3.2.1 Global Offshore Patrol Vessel Market Drivers
3.2.2 Global Offshore Patrol VesselMarket Restraints
4. Global Offshore Patrol VesselSubmarket Forecast 2018-2028
4.1 Global Offshore Patrol Vessel, By Military Forecast 2018-2028
4.1.1 Asia-Pacific Exhibits Strong Growth in MilitaryApplication
4.2 Global Offshore Patrol Vessel, By EEZ Protection Forecast 2018-2028
4.2.1 Militarisation of the East and South China Seas boosts EEZ Growth in the Asia-Pacific Region
4.3 Global Offshore Patrol Vessel, By Search & Rescue Forecast 2018-2028
4.3.1 Implementing Aerial Capability for Efficient Search and Rescue Operations
4.4 Global Offshore Patrol Vessel, By Others Forecast 2018-2028
4.4.1Flexibilityto Perform Multiple Tasks Drive OPV Sales Globally
5. Global Offshore Patrol Vessel, By Type Forecast 2018-2028
5.1 Global Offshore Patrol Vessel, By Warfighting Forecast 2018-2028
5.1.1The Middle East and APAC Region Drives the Warfighting OPV Sales
5.2 Global Offshore Patrol Vessel, By Maritime Patrol Forecast 2018-2028
5.2.1 Countries with Political Aspirations and Low-Intensity Missions Drives the Maritime Patrol Vessel Type
6. Leading Regional Offshore Patrol VesselMarketForecast2018-2028
6.1 Global Offshore Patrol VesselMarket by RegionalMarket Share Forecast 2018-2028
6.2 Asia-Pacific Offshore Patrol Vessel MarketForecast2018-2028
6.2.1 India is Expected to Witness theHighest Growth inAsia-Pacific Region
6.2.2 Asia-Pacific Offshore Patrol Vessel Market Drivers & Restraints 2018
6.3 Europe Offshore Patrol Vessel Market Forecast 2018-2028
6.3.1Growing Global Markets in Arctic Maritime Business
6.3.2Europe Offshore Patrol Vessel Market Drivers & Restraints
6.4North America Offshore Patrol Vessel Market Forecast 2018-2028
6.4.1 Arctic Patrol Drives Regional Demand for Offshore Patrol Vessels
6.4.2North America Offshore Patrol Vessel Market Drivers & Restraints
6.5Latin America Offshore Patrol Vessel Market Forecast 2018-2028
6.5.1The Escalating Need for OpvsinLatin America's Maritime Patrol Zone
6.5.2Latin America Offshore Patrol Vessel Market Drivers & Restraints
6.6Rest of the World Offshore Patrol Vessel Market Forecast 2018-2028
6.6.1African Demand for Opvs Intensifies with Enduring Maritime Security Threats
6.6.2Rest of the World Offshore Patrol Vessel Market Drivers & Restraints
7. SWOT Analysis of the Offshore Patrol Vessel Market 2018-2028
8. Leading Companies in the Offshore Patrol Vessel Market
8.1 Leading Offshore Patrol Vessel Companies 2018
8.2Recent Contracts of the Offshore Patrol Vessel Companies
8.3BAE Systems
8.3.1 BAE Systems Plc Offshore Patrol Vessel Selected Recent Contracts / Projects / Programmes
8.3.2BAE Systems Plc, Total Company Sales 2013-2017
8.3.3BAE Systems Plc, Sales by Segment of Business 2013-2017
8.3.4BAE Systems Plc Cost of Research & Development 2013-2017
8.3.5BAE Systems Plc Marine Products / Services
8.3.6 BAE Systems Plc Primary Market Competitors 2018
8.3.7BAE Systems Plc Analysis
8.3.8 BAE Systems PlcFuture Outlook
8.4General Dynamics Corporation
8.4.1 General Dynamics Corporation Total Company Sales 2013-2017
8.4.2 General Dynamics Corporation Sales by Segment of Business 2013-2017
8.4.3General Dynamics Corporation Marine Products / Services
8.4.4General Dynamics Corporation Primary Market Competitors2018
8.4.5General Dynamics Corporation Analysis
8.4.6General Dynamics Corporation Future Outlook
8.5Huntington Ingalls Industries, Inc.
8.5.1 Huntington Ingalls Industries, Inc. Offshore Patrol VesselSelectedRecent Contracts / Projects / Programmes 2015-2017
8.5.2 Huntington Ingalls Industries, Inc. Total Company Sales 2013-2017
8.5.3 Huntington Ingalls Industries, Inc Sales by Segment of Business 2013-2017
8.5.4 Huntington Ingalls Industries, Inc. Marine Products/ Services
8.5.5Huntington Ingalls Industries, Inc. Primary Market Competitors 2018
8.6Austal
8.6.1 Austal, Offshore Patrol Vessel Selected Recent Contracts / Projects / Programmes
8.6.2 Austal, Total Company Sales 2013-2017
8.6.3 Austal, Sales by Segment of Business 2013-2017
8.6.4Austal Marine Products / Services
8.6.5Austal Primary Market Competitors 2018
8.7 FassmerGmbh& Co.
8.7.1FassmerGmbh& Co. Offshore Patrol Vessel Selected Recent Contracts / Projects / Programmes
8.8 Maritime Partner AS
8.8.1 Maritime Partner AS, Sales by Segment of Business 2017
8.8.2 Maritime Partner AS Offshore Patrol Vessel Selected Recent Contracts / Projects / Programmes
8.9 SAFE Boats International, LLC
8.9.1 SAFE Boats International, LLC, Sales by Segment of Business 2017
8.9.2 SAFE Boats International, LLC Offshore Patrol Vessel Selected Recent Contracts / Projects / Programmes
8.10 China Shipbuilding Industry Corporation
8.10.1China Shipbuilding Industry Corporation Offshore Patrol Vessel Selected Recent Contracts / Projects / Programmes
8.11Daewoo Shipbuilding & Marine Engineering Co., Ltd
8.11.1 Daewoo Shipbuilding & Marine Engineering Co., Ltd Offshore Patrol Vessel Selected Recent Contracts / Projects / Programmes
8.11.2Daewoo Shipbuilding & Marine Engineering Co., Ltd, Total Company Sales 2013-2017
8.11.3Daewoo Shipbuilding & Marine Engineering Co., Ltd Marine Products / Services
8.11.4Daewoo Shipbuilding & Marine Engineering Co., Ltd Primary Market Competitors 2018
8.12 Fincantieri–Cantieri Navali Italiani S.p.A.
8.12.1Fincantieri –Cantieri Navali Italiani S.p.A., Total Company Sales 2013-2017
8.12.2Fincantieri - CantieriNavaliItaliani S.p.A., Sales by Segment of Business 2013-2017
8.12.3Fincantieri - CantieriNavaliItaliani S.p.A. Marine Products / Services
8.12.4Fincantieri – Cantieri Navali Italiani S.p.A. Primary Market Competitors 2018
8.13 Garden Reach Shipbuilders & Engineers Ltd
8.13.1 Garden Reach Shipbuilders & Engineers Ltd Offshore Patrol Vessel Selected Recent Contracts / Projects / Programmes
8.13.2Garden Reach Shipbuilders & Engineers Ltd Total Company Sales 2013-2017
8.13.3 Garden Reach Shipbuilders & Engineers Ltd Marine Products / Services
8.13.4 Garden Reach Shipbuilders & Engineers Ltd Primary Market Competitors 2018
8.14 Goa Shipyard Limited
8.14.1 Goa Shipyard Limited Offshore Patrol Vessel Selected Recent Contracts / Projects / Programmes
8.14.2Goa Shipyard Limited Total Company Sales 2013-2017
8.14.3Goa Shipyard Limited Marine Products / Services
8.14.4Goa Shipyard Limited Primary Market Competitors 2018
8.15 Hyundai Heavy Industries Co., Ltd.
8.15.1 Hyundai Heavy Industries Co., Ltd. Offshore Patrol Vessel Selected Recent Contracts / Projects / Programmes
8.15.2 Hyundai Heavy Industries Co., Ltd., Total Company Sales 2013-2017
8.15.3Hyundai Heavy Industries Co., Ltd. Marine Products / Services
8.15.4Hyundai Heavy Industries Co., Ltd. Primary Market Competitors 2018
8.16The Bangkok Dock Company
8.16.1 The Bangkok Dock Company. Offshore Patrol Vessel Selected Recent Contracts / Projects / Programmes
8.16.2 The Bangkok Dock Company., Total Company Sales 2012-2016
8.16.3The Bangkok Dock Company Marine Products / Services
8.16.4The Bangkok Dock Company Primary Market Competitors 2018
8.17 Navantia SA
8.17.1 Navantia SA. Offshore Patrol Vessel Selected Recent Contracts / Projects / Programmes
8.17.2 Navantia SA., Total Company Sales 2012-2016
8.17.3 Navantia SA Marine Products / Services
8.17.4 Navantia SA Primary Market Competitors 2018
8.18 Fr LurssenWerft GmbH & Co.KG
8.18.1 Fr LurssenWerft GmbH & Co.KG, Total Company Sales 2012-2016
8.18.2 Fr LurssenWerft GmbH & Co.KG Marine Products / Services
8.18.3 Fr LurssenWerft GmbH & Co.KG Primary Market Competitors 2018
8.19Damen Shipyards Group
8.19.1 Damen Shipyards Group. Offshore Patrol Vessel Selected Recent Contracts / Projects / Programmes
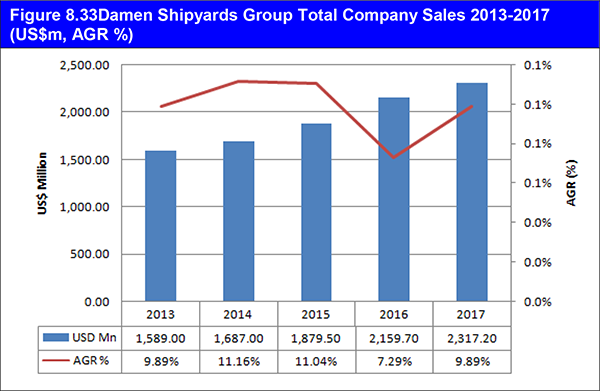
8.19.2 Damen Shipyards Group., Total Company Sales 2013-2017
8.19.3Damen Shipyards Group Marine Products / Services
8.19.4Damen Shipyards GroupPrimary Market Competitors 2018
8.20BMT Defence Services Ltd
8.20.1 BMT Defence Services LtdOffshore Patrol Vessel Selected Recent Contracts / Projects / Programmes
8.20.2 BMT Defence Services Ltd, Total Company Sales 2013-2017
8.20.3 BMT Defence Services Ltd, Sales by Segment of Business 2015-2017
8.20.4 BMT Defence Services Ltd Analysis
8.20.5 BMT Defence Services Ltd Future Outlook
8.21 LOMOcean Design
8.21.1 LOMOcean Design Offshore Patrol Vessel Selected Recent Contracts / Projects / Programmes
8.21.2LOMOcean Design Marine Products / Services
8.21.3 LOMOcean Design Future Outlook
8.22 Asis Boats
8.22.1 Asis Boats Marine Products / Services
9. Conclusions and Recommendations
10. Glossary
Associated Visiongain Reports
List of figures
Figure 1.1Example of Offshore Patrol Vessel Market by Regional Market Share Forecast 2018, 2023, 2028 (% Share)
Figure 2.1 Global Offshore Patrol Vessel Market Segmentation Overview
Figure 3.1 Global Offshore Patrol Vessel Market Forecast 2018-2028(US$mil, AGR %)
Figure 4.1 Global Offshore Patrol Vessel, By Application AGR Forecast 2018-2028 (AGR %)
Figure 4.2 Global Offshore Patrol Vessel, By Application Forecast 2018-2028 (US$mil, Global AGR %)
Figure 4.3 Global Offshore Patrol Vessel, By Application Share Forecast 2018 (% Share)
Figure 4.4 Global Offshore Patrol Vessel, By Application Share Forecast 2023 (% Share)
Figure 4.5 Global Offshore Patrol Vessel, By Application Share Forecast 2028(% Share)
Figure 4.6 Global Offshore Patrol Vessel, By Military by Regional Market AGR Forecast 2018-2028 (AGR %)
Figure 4.7Global Offshore Patrol Vessel, By Military Market Forecast by Regional Market 2017-2028 (US$mil, Global AGR %)
Figure 4.8 Global Offshore Patrol Vessel, By EEZ Protection by Regional Market AGR Forecast 2018-2028 (AGR %)
Figure 4.9 Global Offshore Patrol Vessel, By EEZ Protection Market Forecast by Regional Market 2017-2028 (US$mil, Global AGR %)
Figure 4.10 Global Offshore Patrol Vessel, By Search & Rescue by Regional Market AGR Forecast 2018-2028 (AGR %)
Figure 4.11 Global Offshore Patrol Vessel, By Search & Rescue Market Forecast by Regional Market 2017-2028 (US$mil, Global AGR %)
Figure 4.12 Global Offshore Patrol Vessel, By Others by Regional Market AGR Forecast 2018-2028 (AGR %)
Figure 4.13 Global Offshore Patrol Vessel, By Others Market Forecast by Regional Market 2018-2028 (US$mil, Global AGR %)
Figure 5.1 Global Offshore Patrol Vessel, By Type AGR Forecast 2018-2028 (AGR %)
Figure 5.2 Global Offshore Patrol Vessel, By Type Forecast 2018-2028 (US$mil, Global AGR %)
Figure 5.3 Global Offshore Patrol Vessel, By Type Share Forecast 2018 % Share)
Figure 5.4 Global Offshore Patrol Vessel, By Type Share Forecast 2023(% Share)
Figure 5.5 Global Offshore Patrol Vessel, By Type Share Forecast 2028 (% Share)
Figure 5.6 Global Offshore Patrol Vessel, By Warfighting by Regional Market AGR Forecast 2018-2028 (AGR %)
Figure 5.7 Global Offshore Patrol Vessel, By Warfighting Market Forecast by Regional Market 2018-2028 (US$mil, Global AGR %)
Figure 5.8 Global Offshore Patrol Vessel, By Maritime Patrol by Regional Market AGR Forecast 2018-2028 (AGR %)
Figure 5.9 Global Offshore Patrol Vessel, By Maritime Patrol Market Forecast by Regional Market 2018-2028 (US$mil, Global AGR %)
Figure 6.1Global Offshore Patrol Vessel Market, by RegionalMarketForecast2018-2028 (US$mil, Global AGR %)
Figure 6.2Global Offshore Patrol Vessel Market by Regional Market AGR Forecast2018-2028 (AGR %)
Figure 6.3 Global Offshore Patrol VesselMarket by Regional Market Share Forecast 2018 (% Share)
Figure 6.4 Global Offshore Patrol Vessel Market by Regional Market Share Forecast2023 (% Share)
Figure 6.5Global Offshore Patrol Vessel Market by Regional Market Share Forecast 2028 (% Share)
Figure 6.6 Asia-Pacific Offshore Patrol Vessel, By Application AGR Forecast 2018-2028 (AGR %)
Figure 6.7 Asia-Pacific Offshore Patrol VesselMarket, By Application Forecast 2018-2028 (US$mil, Asia-Pacific Total Market Sales AGR %)
Figure 6.8 Asia-Pacific Offshore Patrol Vessel, By Type AGR Forecast 2018-2028 (AGR %)
Figure 6.9 Asia-Pacific Offshore Patrol Vessel Market, By Type Forecast 2018-2028 (US$mil, Asia-Pacific Total Market Sale)
Figure 6.10 Asia-Pacific, By Nation Market Share Forecast 2018, 2023, 2028(% Share)
Figure 6.11Europe Offshore Patrol Vessel, By Application AGR Forecast 2018-2028 (AGR %)
Figure 6.12Europe Offshore Patrol Vessel Market, By Application Forecast 2018-2028 (US$mil, Europe Total Market Sales AGR %)
Figure 6.13 Europe Offshore Patrol Vessel, By Type AGR Forecast 2018-2028 (AGR %)
Figure 6.14 Europe Offshore Patrol Vessel Market, By Type Forecast 2018-2028 (US$mil, Europe Total Market Sales)
Figure 6.15 Europe, By Nation Market Share Forecast 2018, 2023, 2028(% Share)
Figure 6.16 North America Offshore Patrol Vessel, By Application AGR Forecast 2018-2028 (AGR %)
Figure 6.17 North America Offshore Patrol Vessel Market, By Application Forecast 2018-2028 (US$mil, North America Total Market Sales AGR %)
Figure 6.18 North America Offshore Patrol Vessel, By Type AGR Forecast 2018-2028 (AGR %)
Figure 6.19 North America Offshore Patrol Vessel Market, By Type Forecast 2018-2028 (US$mil, North America Total Market Sales)
Figure 6.20 North America, By Nation Market Share Forecast 2018, 2023,2028(% Share)
Figure 6.21 Latin America Offshore Patrol Vessel, By Application AGR Forecast 2018-2028 (AGR %)
Figure 6.22 Latin America Offshore Patrol Vessel Market, By Application Forecast 2018-2028 (US$mil, Latin America Total Market Sales AGR %)
Figure 6.23 Latin America Offshore Patrol Vessel, By Type AGR Forecast 2018-2028 (AGR %)
Figure 6.24 Latin America Offshore Patrol Vessel Market, By Type Forecast 2018-2028 (US$mil, Latin Total Market Sales)
Figure 6.25 Latin America, By Nation Market Share Forecast 2018, 2023, 2028(% Share)
Figure 6.26 Rest of the World Offshore Patrol Vessel, By Application AGR Forecast 2018-2028 (AGR %)
Figure 6.27 Rest of the World Offshore Patrol Vessel Market, By Application Forecast 2018-2028 (US$mil, Rest of the World Total Market Sales AGR %)
Figure 6.28 Rest of the World Offshore Patrol Vessel, By Type AGR Forecast 2018-2028 (AGR %)
Figure 6.29 Rest of the World Offshore Patrol Vessel Market, By Type Forecast 2018-2028 (US$mil, Rest of the World Total Market Sales)
Figure 6.30 Rest of the World, By Nation Market Share Forecast 2018, 2023, 2028 (% Share)
Figure 8.1 BAE Systems PlcTotal Company Sales 2013-2017 (US$m, AGR %)
Figure 8.2BAE Systems PlcSales by Segment of Business 2013-2017 (US$m, Total Company Sales AGR %)
Figure8.3 BAE Systems PlcCost of Research & Development 2013
-2017 (US$m, AGR %)
Figure 8.4 BAE Systems PlcPrimary Market Competitors 2018
Figure 8.5 General Dynamics Corporation Total Company Sales 2013-2017 (US$m, AGR %)
Figure 8.6 General Dynamics Corporation Sales by Segment of Business 2013-2017 (US$m, Total Company Sales AGR %)
Figure 8.7 General Dynamics Corporation Sales by Geographical Location 2013-2017 (US$m, Total Company Sales AGR %)
Figure 8.8 General Dynamics Corporation Primary Market Competitors 2018
Figure 8.9 Huntington Ingalls Industries, Inc Total Company Sales 2013-2017 (US$m, AGR %)
Figure 8.10Huntington Ingalls Industries, Inc. Sales by Segment of Business 2013-2017 (US$m, Total Company Sales AGR %)
Figure 8.11 Huntington Ingalls Industries, Inc. Primary Market Competitors 2018
Figure8.12Austal, Total Company Sales 2013-2017 (US$m, AGR %)
Figure 8.13 Austal, Sales by Segment of Business 2013-2017 (US$m, Total Company Sales AGR %)
Figure 8.14 Austal, Sales by Geographical Location 2013-2017 (US$m, Total Company Sales AGR %)
Figure 8.15 Austal, Primary Market Competitors 2018
Figure 8.16 Daewoo Shipbuilding & Marine Engineering Co., LtdTotal Company Sales 2013-2017 (US$m, AGR %)
Figure 8.17 Daewoo Shipbuilding & Marine Engineering Co., LtdPrimary Market Competitors 2018
Figure 8.18Fincantieri - CantieriNavaliItaliani S.p.A. Total Company Sales 2013-2017 (US$m, AGR %)
Figure 8.19Fincantieri – Cantieri Navali Italiani S.p.A., Sales by Segment of Business 2013-2017 (US$m, Total Company Sales AGR %)
Figure 8.20Fincantieri – Cantieri Navali Italiani S.p.A. Primary Market Competitors 2018
Figure 8.21 Garden Reach Shipbuilders & Engineers LtdTotal Company Sales 2013-2017 (US$m, AGR %)
Figure 8.22 Garden Reach Shipbuilders & Engineers LtdPrimary Market Competitors 2018
Figure 8.23Goa Shipyard Limited Total Company Sales 2013-2017 (US$m, AGR %)
Figure 8.24 Goa Shipyard Limited Primary Market Competitors 2018
Figure 8.25 Hyundai Heavy Industries Co., Ltd. Total Company Sales 2013-2017 (US$m, AGR %)
Figure 8.26 Hyundai Heavy Industries Co., Ltd. Primary Market Competitors 2018
Figure 8.27The Bangkok Dock Company Total Company Sales 2012-2016 (US$m, AGR %)
Figure 8.28The Bangkok Dock Company Primary Market Competitors 2018
Figure 8.29Navantia SA Total Company Sales 2012-2016 (US$m, AGR %)
Figure 8.30Navantia SACompany Primary Market Competitors 2018
Figure 8.31Lürssen Total Company Sales 2012-2016 (US$m, AGR %)
Figure 8.32Lürssen Company Primary Market Competitors 2018
Figure 8.33Damen Shipyards Group Total Company Sales 2013-2017 (US$m, AGR %)
Figure 8.34Damen Shipyards GroupCompany Primary Market Competitors 2018
Figure 8.35BMT Defence Services Ltd Total Company Sales 2013-2017 (US$m, AGR %)
List of tables
Table 1.1 Example of Offshore Patrol Vessel Market by Regional Market Forecast 2018-2028(US$mil, AGR %)
Table 3.1Global Offshore Patrol Vessel Market Forecast 2018-2028 (US$mil, AGR %, CAGR %)
Table 3.2 Global Offshore Patrol Vessel Market Drivers & Restraints 2018
Table 4.1 Global Offshore Patrol Vessel, By ApplicationForecast2018-2028(US$mil, AGR %)
Table 4.2 Global Offshore Patrol Vessel, By Application by Regional Market Forecast 2018-2028 (US$mil, Global AGR %)
Table 4.3 Global Offshore Patrol Vessel, By Application CAGR Forecast 2018-2023, 2023-2028, 2018-2028 (CAGR %)
Table 4.4 Global Offshore Patrol Vessel, By Military Submarketby Regional MarketForecast2018-2028 (US$mil, AGR %, CAGR %)
Table 4.5 Global Offshore Patrol Vessel, By EEZ Protection Submarket by Regional Market Forecast 2018-2028 (US$mil, AGR %, CAGR %)
Table 4.6 Global Offshore Patrol Vessel, By Search & Rescue Submarket by Regional Market Forecast 2018-2028 (US$mil, AGR %, CAGR %)
Table 4.7 Global Offshore Patrol Vessel, By Others Submarket by Regional Market Forecast 2018-2028 (US$mil, AGR %, CAGR %)
Table 5.1 Global Offshore Patrol Vessel, By TypeForecast 2018-2028(US$mil, AGR %)
Table 5.2 Global Offshore Patrol Vessel, By Type by Regional Market Forecast 2018-2028 (US$mil, Global AGR %)
Table 5.3 Global Offshore Patrol Vessel, By Type CAGR Forecast 2018-2023, 2023-2028, 2018-2028 (CAGR %)
Table 5.4 Global Offshore Patrol Vessel, By Warfighting Submarket by Regional Market Forecast 2018-2028 (US$mil, AGR %, CAGR %)
Table 5.5 Global Offshore Patrol Vessel, By Maritime Patrol Submarket by Regional Market Forecast 2018-2028 (US$mil, AGR %, CAGR %)
Table 6.1 Leading Regional Offshore Patrol VesselMarket, ByApplication Forecast 2018-2028 (US$mil, Global AGR %)
Table 6.2 Leading Regional Offshore Patrol Vessel Market, By Type Forecast 2018-2028 (US$mil, Global AGR %)
Table 6.3 Global Offshore Patrol Vessel, Submarket by Regional Market CAGR Forecast 2018-2023, 2023-2028, 2018-2028 (CAGR %)
Table 6.4 Regional Offshore Patrol Vessel Market Percentage Change in Market Share 2018-2023, 2023-2028, 2018-2028 (% Change)
Table 6.5 Asia-Pacific Offshore Patrol VesselMarket, By ApplicationForecast2018-2028 (US$mil, AGR %, CAGR %)
Table 6.6 Asia-Pacific Offshore Patrol Vessel Market, By Type Forecast 2018-2028 (US$mil, AGR %, CAGR %)
Table 6.7 Asia-Pacific Offshore Patrol Vessel Market, By Country Forecast 2018-2028 (US$mil, AGR %, CAGR %)
Table 6.8 Asia-Pacific Offshore Patrol Vessel Market Drivers & Restraints 2018
Table 6.9 Europe Offshore Patrol Vessel Market, By Application Forecast 2018-2028 (US$mil, AGR %, CAGR %)
Table 6.10Europe Offshore Patrol Vessel Market, By Type Forecast 2018-2028 (US$mil, AGR %, CAGR %)
Table 6.11 Europe Offshore Patrol Vessel Market, By Country Forecast 2018-2028 (US$b, AGR %, CAGR %, Cumulative)
Table 6.12 Europe Offshore Patrol Vessel Market Drivers & Restraints 2018
Table 6.13 North America Offshore Patrol Vessel Market, By Application Forecast 2018-2028 (US$mil, AGR %, CAGR %)
Table 6.14 North America Offshore Patrol Vessel Market, By Type Forecast 2018-2028 (US$mil, AGR %, CAGR %)
Table 6.15 North America Offshore Patrol Vessel Market, By Country Forecast 2018-2028 (US$b, AGR %, CAGR %, Cumulative)
Table 6.16 North America Offshore Patrol Vessel Market Drivers & Restraints 2018
Table 6.17 Latin America Offshore Patrol Vessel Market, By Application Forecast 2018-2028 (US$mil, AGR %, CAGR %)
Table 6.18 Latin America Offshore Patrol Vessel Market, By Type Forecast 2018-2028 (US$mil, AGR %, CAGR %)
Table 6.19 Latin America Offshore Patrol Vessel Market, By Countries Forecast 2018-2028 (US$mil, AGR %, CAGR %)
Table 6.20 Latin America Offshore Patrol Vessel Market Drivers & Restraints 2018
Table 6.21 Rest of the World Offshore Patrol Vessel Market, By Application Forecast 2018-2028 (US$mil, AGR %, CAGR %)
Table 6.22 Rest of the World Offshore Patrol Vessel Market, By Type Forecast 2018-2028 (US$mil, AGR %, CAGR %)
Table 6.23 Rest of the World Offshore Patrol Vessel Market, By Country Forecast 2018-2028 (US$mil, AGR %, CAGR %)
Table 6.24 Rest of the World Offshore Patrol Vessel Market Drivers & Restraints 2018
Table 7.1 Global Offshore Patrol Vessel Market SWOT Analysis2018-2028
Table 8.1 Leading Offshore Patrol Vessel Companiesin the World 2018
Table 8.2Recent Contracts of the Offshore Patrol Vessel Companies
Table 8.3 BAE Systems PlcProfile 2018 (CEO, Total Company SalesUS$m, Sales in the MarketUS$m, Share of Company Sales from Offshore Patrol Vessels Market %, Net Income / LossUS$m, Net Capital ExpenditureUS$m, Strongest Business Region, Business Segment in the Market, Submarket Involvement, HQ, Founded, No. of Employees, IR Contact, Ticker, Website)
Table 8.4 BAE Systems PlcRecent Development 2010-2017 (Date, Company Involved, Value US$m, Details)
Table 8.5 BAE Systems Plc, Total Company Sales 2013-2017 (US$m, AGR %)
Table 8.6 BAE Systems PlcSales by Segment of Business 2013-2017 (US$m, AGR %)
Table 8.7 BAE Systems PlcCost of Research & Development 2013-2017 (US$m, AGR %)
Table 8.8 BAE Systems PlcSales by Geographical Location 2013-2017 (US$m, AGR %)
Table 8.9 BAE Systems PlcNumber of Employees 2013-2017 (No. of Employees, AGR %)
Table 8.10 BAE Systems PlcOffshore Patrol Vessels Products / Services (Segment of Business, Product, Specification / Features)
Table 8.11 General Dynamics Corporation Profile 2018 (CEO, Total Company Sales US$m, Sales in the MarketUS$m, Share of Company Sales from Offshore patrol vessel Market %, Net Income / LossUS$m, Net Capital Expenditure US$m, Strongest Business Region, Business Segment in the Market, Submarket Involvement, HQ, Founded, No. of Employees, IR Contact, Ticker, Website)
Table 8.12General Dynamics Corporation Total Company Sales 2013-2017 (US$m, AGR %)
Table 8.13 General Dynamics Corporation Sales by Segment of Business 2013-2017 (US$m, AGR %)
Table 8.14 General Dynamics Corporation Sales by Geographical Location 2013-2017 (US$m, AGR %)
Table 8.15 General Dynamics Corporation Number of Employees 2013-2017 (No. of Employees, AGR %)
Table 8.16 General Dynamics Corporation Offshore patrol vessel Products / Services (Segment of Business, Product, Specification / Features)
Table 8.17 General Dynamics Corporation RecentDevelopments (Date, Company Involved, Value US$m, Details)
Table 8.18 Huntington Ingalls Industries, Inc. Profile 2018 (CEO, Total Company Sales US$m, Sales in the MarketUS$m, Share of Company Sales from Offshore Patrol Vessel Market %, Net Income / LossUS$m, Net Capital Expenditure US$m, Strongest Business Region, Business Segment in the Market, Submarket Involvement, HQ, Founded, No. of Employees, IR Contact, Ticker, Website)
Table 8.19 Huntington Ingalls Industries, Inc. Recent Developments (Date, Company Involved, Value US$m, Details)
Table 8.20 Huntington Ingalls Industries, Inc. Total Company Sales 2013-2017 (US$m, AGR %)
Table 8.21 Huntington Ingalls Industries, Inc. Sales by Segment of Business 2013-2017 (US$m, AGR %)
Table 8.22 Huntington Ingalls Industries, Inc. Number of Employees 2013-2017 (No. of Employees, AGR %)
Table 8.23 Huntington Ingalls Industries, Inc. Offshore patrol vessel Products / Services (Segment of Business, Product, Specification / Features)
Table 8.24 Austal Profile 2018 (CEO, Total Company Sales US$m, Sales in the MarketUS$m, Share of Company Sales from Offshore Patrol Vessel Market %, Net Income / LossUS$m, Net Capital Expenditure US$m, Strongest Business Region, Business Segment in the Market, Submarket Involvement, HQ, Founded, No. of Employees, IR Contact, Ticker, Website)
Table 8.25 Austal, Recent Development 2016-2017 (Date, Company Involved, Value US$m, Details)
Table 8.26 Austal Total Company Sales 2013-2017 (US$m, AGR %)
Table 8.27 Austal Sales by Segment of Business 2013-2017 (US$m, AGR %)
Table 8.28 Austal, Sales by Geographical Location 2013-2017 (US$m, AGR %)
Table 8.29 Austal Offshore patrol vessel Products / Services (Segment of Business, Product, Specification / Features)
Table 8.30 FassmerGmbh&Co.Recent Developments 2017 (Date, Company Involved, Value US$m, Details)
Table 8.31 Maritime Partner AS Recent Development 2016-2017 (Date, Company Involved, Value US$m, Details)
Table 8.32 SAFEBoats International, LLC Recent Development 2014-2017 (Date, Company Involved, Value US$m, Details)
Table 8.33 China Shipbuilding Industry Corporation Profile 2018 (CEO, Total Company SalesUS$m, Sales in the MarketUS$m, Share of Company Sales from Offshore Patrol Vessels Market %, Net Income / LossUS$m, Net Capital ExpenditureUS$m, Strongest Business Region, Business Segment in the Market, Submarket Involvement, HQ, Founded, No. of Employees, IR Contact, Ticker, Website)
Table 8.34 China Shipbuilding Industry Corporation Recent Developments 2012-2017 (Date, Company Involved, Value US$m, Details)
Table 8.35 Daewoo Shipbuilding & Marine Engineering Co., LtdProfile 2018 (CEO, Total Company Sales US $m, Sales in the Market US $m, Share of Company Sales from Offshore Patrol Vessels Market %, Net Income / Loss US$m, Net Capital Expenditure US$m, Strongest Business Region, Business Segment in the Market, Submarket Involvement, HQ, Founded, No. of Employees, IR Contact, Ticker, Website)
Table 8.36 Daewoo Shipbuilding & Marine Engineering Co., Ltd SelectDevelopments 2013-2014 (Date, Company Involved, Value US$m, Details)
Table 8.37 Daewoo Shipbuilding & Marine Engineering Co., LtdTotal Company Sales 2013-2017 (US$m, AGR %)
Table 8.38 Daewoo Shipbuilding & Marine Engineering Co., Ltd Offshore Patrol Vessels Products / Services (Segment of Business, Product, Specification / Features)
Table 8.39 Fincantieri –Cantieri Navali Italiani S.p.A. Profile 2018 (CEO, Total Company Sales US $m, Sales in the Market US $m, Share of Company Sales from Offshore Patrol Vessels Market %, Net Income / Loss US $m, Net Capital Expenditure US $m, Strongest Business Region, Business Segment in the Market, Submarket Involvement, HQ, Founded, No. of Employees, IR Contact, Ticker, Website)
Table 8.40 Fincantieri – Cantieri Navali Italiani S.p.A. Total Company Sales 2013-2017 (US$m, AGR %)
Table 8.41 Fincantieri – Cantieri Navali Italiani S.p.A. Sales by Segment of Business 2013-2017 (US$m, AGR %)
Table 8.42 Fincantieri – Cantieri Navali Italiani S.p.A. Offshore Patrol Vessels Products / Services (Segment of Business, Product, Specification / Features)
Table 8.43 Garden Reach Shipbuilders & Engineers LtdProfile 2018 (CEO, Total Company Sales US $m, Sales in the Market US $m, Share of Company Sales from Offshore Patrol Vessels Market %, Net Income / Loss US $m, Net Capital Expenditure US $m, Strongest Business Region, Business Segment in the Market, Submarket Involvement, HQ, Founded, No. of Employees, IR Contact, Ticker, Website)
Table 8.44 Garden Reach Shipbuilders & Engineers LtdSelect Developments 2012-2015 (Date, Company Involved, Value US$m, Details)
Table 8.45 Garden Reach Shipbuilders & Engineers LtdTotal Company Sales 2013-2017 (US$m, AGR %)
Table 8.46 Garden Reach Shipbuilders & Engineers Ltd Offshore Patrol Vessels Products / Services (Segment of Business, Product, Specification / Features)
Table 8.47 Goa Shipyard Limited Profile 2018 (CEO, Total Company Sales US $m, Sales in the Market US $m, Share of Company Sales from Offshore Patrol Vessels Market %, Net Income / Loss US $m, Net Capital Expenditure US $m, Strongest Business Region, Business Segment in the Market, Submarket Involvement, HQ, Founded, No. of Employees, IR Contact, Ticker, Website)
Table 8.48 Goa Shipyard Limited RecentDevelopments 2016-2017 (Date, Company Involved, Value US$m, Details)
Table 8.49 Goa Shipyard Limited LtdTotal Company Sales 2013-2017 (US$m, AGR %)
Table 8.50 Goa Shipyard Limited Offshore Patrol Vessels Products / Services (Segment of Business, Product, Specification / Features)
Table 8.51 Hyundai Heavy Industries Co., Ltd. Profile 2018 (CEO, Total Company Sales US $m, Sales in the Market US $m, Share of Company Sales from Offshore Patrol Vessels Market %, Net Income / Loss US $m, Net Capital Expenditure US $m, Strongest Business Region, Business Segment in the Market, Submarket Involvement, HQ, Founded, No. of Employees, IR Contact, Ticker, Website)
Table 8.52 Hyundai Heavy Industries Co., Ltd. SelectedDevelopments 2009-2016 (Date, Company Involved, Value US$m, Details)
Table 8.53 Hyundai Heavy Industries Co., Ltd. Total Company Sales 2013-2017 (US$m, AGR %)
Table 8.54 Hyundai Heavy Industries Co., Ltd. Offshore Patrol Vessels Products / Services (Segment of Business, Product, Specification / Features)
Table 8.55 The Bangkok Dock Company Profile 2018 (CEO, Total Company Sales US $m, Sales in the Market US $m, Share of Company Sales from Offshore Patrol Vessels Market %, Net Income / Loss US $m, Net Capital Expenditure US $m, Strongest Business Region, Business Segment in the Market, Submarket Involvement, HQ, Founded, No. of Employees, IR Contact, Ticker, Website)
Table 8.56The Bangkok Dock Company Total Company Sales 2012-2016 (US$m, AGR %)
Table 8.57The Bangkok Dock Company Offshore Patrol Vessels Products / Services (Segment of Business, Product, Specification / Features)
Table 8.58Navantia SA Profile 2018 (CEO, Total Company Sales US $m, Sales in the Market US $m, Share of Company Sales from Offshore Patrol Vessels Market %, Net Income / Loss US $m, Net Capital Expenditure US $m, Strongest Business Region, Business Segment in the Market, Submarket Involvement, HQ, Founded, No. of Employees, IR Contact, Ticker, Website)
Table 8.59 Navantia SA Selected Developments 2009-2016 (Date, Company Involved, Value US$m, Details)
Table 8.60 Navantia SA Total Company Sales 2012-2016 (US$m, AGR %)
Table 8.61 Navantia SA Company Offshore Patrol Vessels Products / Services (Segment of Business, Product, Specification / Features)
Table 8.62 Fr. LürssenWerft GmbH & Co. KGProfile 2018 (CEO, Total Company Sales US $m, Sales in the Market US $m, Share of Company Sales from Offshore Patrol Vessels Market %, Net Income / Loss US $m, Net Capital Expenditure US $m, Strongest Business Region, Business Segment in the Market, Submarket Involvement, HQ, Founded, No. of Employees, IR Contact, Ticker, Website)
Table 8.63 Fr. LürssenWerft GmbH & Co. KG Total Company Sales 2012-2016 (US$m, AGR %)
Table 8.64 Fr. LürssenWerft GmbH & Co. KGCompany Offshore Patrol Vessels Products / Services (Segment of Business, Product, Specification / Features)
Table 8.65 Damen Shipyards GroupProfile 2018 (CEO, Total Company Sales US $m, Sales in the Market US $m, Share of Company Sales from Offshore Patrol Vessels Market %, Net Income / Loss US $m, Net Capital Expenditure US $m, Strongest Business Region, Business Segment in the Market, Submarket Involvement, HQ, Founded, No. of Employees, IR Contact, Ticker, Website)
Table 8.66 Damen Shipyards Group Selected Developments 2009-2016 (Date, Company Involved, Value US$m, Details)
Table 8.67 Damen Shipyards Group Total Company Sales 2013-
2017(US$m, AGR %)
Table 8.68 Damen Shipyards Group Company Offshore Patrol Vessels Products / Services (Segment of Business, Product, Specification / Features)
Table 8.69BMT Defence Services Ltd Profile 2018 (CEO, Total Company SalesUS$m, Sales in the MarketUS$m, Share of Company Sales from Offshore Patrol Vessels Market %, Net Income / LossUS$m, Net Capital ExpenditureUS$m, Strongest Business Region, Business Segment in the Market, Submarket Involvement, HQ, Founded, No. of Employees, IR Contact, Ticker, Website)
Table 8.70 BMT defence Services Ltd Recent Development 2010-2017 (Date, Company Involved, Value US$m, Details)
Table 8.71 BMT Defence Services Ltd, Total Company Sales 2013-2017 (US$m, AGR %)
Table 8.72BMT Defence Services Ltd, Company SalesBy Segment 2015-2017 (US$m, AGR %)
Table 8.73 BMT Defence Services Ltd, Company Sales ByRegion 2015-2017 (US$m)
Table 8.74BMT Defence Services Ltd Number of Employees 2013-2017 (No. of Employees, AGR %)
Table 8.75LOMOcean Design Profile 2017 (CEO, Total Company SalesUS$m, Sales in the MarketUS$m, Share of Company Sales from Offshore Patrol Vessels Market %, Net Income / LossUS$m, Net Capital ExpenditureUS$m, Strongest Business Region, Business Segment in the Market, Submarket Involvement, HQ, Founded, No. of Employees, IR Contact, Ticker, Website)
Table 8.76 LOMOcean Design Recent Development 2010-2017 (Date, Company Involved, Value US$m, Details)
Table 8.77 LOMOcean Design Offshore Patrol Vessels Products / Services (Segment of Business, Product, Specification / Features)
Table 8.78 Asis Boats Profile 2018 (CEO, Total Company SalesUS$m, Sales in the MarketUS$m, Share of Company Sales from Offshore Patrol Vessels Market %, Net Income / LossUS$m, Net Capital ExpenditureUS$m, Strongest Business Region, Business Segment in the Market, Submarket Involvement, HQ, Founded, No. of Employees, IR Contact, Ticker, Website)
Table 8.79 Asis Boat Offshore Patrol Vessels Products / Services (Segment of Business, Product, Specification / Features)
Table 8.80 Other Leading Companies is the Offshore Patrol Vessel Market