Industries > Pharma > Top 20 Advanced Wound Care Companies 2020
Top 20 Advanced Wound Care Companies 2020
Smith & Nephew Plc., ConvaTec Group Plc., Coloplast A/S, 3M, B. Braun Melsungen AG and Other Companies
The global advanced wound care market was valued at $9.2bn in 2018. The largest segment of the advanced wound care market will continue to be active wound care throughout the forecast period. However, this segment will continue to lose market shares to wound care devices and wound care biologics sectors, from 55.2% in 2019 to 38.9% in 2029.
How this report will benefit you
Read on to discover how you can exploit the future business opportunities emerging in this sector.
In this brand new 129-page report you will receive 121 charts– all unavailable elsewhere.
The 129-page report provides clear detailed insight into the leading 20 companies in the advanced wound care market. Discover the key drivers and challenges affecting the market.
By ordering and reading our brand-new report today you stay better informed and ready to act.
Report Scope
• Global Advanced Wound Care Market forecast from 2019-2029
• Forecast of the Global Advanced Wound Care Market by region:
• North America
• South America
• Europe
• Asia-Pacific
• RoW
• Our study discusses the selected leading companies that are the major players in the global advanced wound care market:
• 3M Company
• Acelity L.P. Inc.
• B. Braun Melsungen AG
• BSN Medical GmbH
• Cardinal Health, Inc.
• Celularity, Inc.
• Coloplast A/S
• ConvaTec Group plc
• Generex Biotechnology Corp.
• Hill-Rom Holdings, Inc.
• Hollister Incorporated
• Integra LifeSciences Holdings Corporation
• Johnson & Johnson
• Lohmann & Rauscher GmbH & Co. Kg
• Medline Industries, Inc.
• Medtronic PLC
• Mölnlycke Health Care
• Organogenesis
• PAUL HARTMANN AG
• Smith & Nephew
• This report provides a SWOT analysis of the advanced wound care market.
• This report also discusses factors that drive and restrain the market, as well as opportunities in the advanced wound care market.
Visiongain’s study is intended for anyone requiring commercial analyses for the top 20 advanced wound care companies. You find data, trends and predictions.
Buy our report today Top 20 Advanced Wound Care Companies 2020: Smith & Nephew Plc., ConvaTec Group Plc., Coloplast A/S, 3M, B. Braun Melsungen AG and Other Companies.
Visiongain is a trading partner with the US Federal Government
CCR Ref number: KD4R6
Do you have any custom requirements we can help you with? Any need for specific country, geo region, market segment or specific company information? Contact us today, we can discuss your needs and see how we can help: sara.peerun@visiongain.com
1. Report Overview
1.1 Overview of the Global Advanced Wound Care Market
1.3 Benefits of This Report
1.4 Report Structure
1.5 Who is This Report For?
1.6 Methodology
1.6.1 Primary Research
1.6.2 Secondary Research
1.7 Frequently Asked Questions (FAQs)
1.8 Associated Visiongain Reports
1.9 About Visiongain
2. Introduction to the Advanced Wound Care Market
2.1 Advanced Wound Care Market Definition
2.1.1 Definition of Wound
2.1.2 Types of Wound
2.2 Advanced Wound Care Market Segmentation
2.2.1 Advanced Wound Care Market by Therapy
2.2.1.1 Traditional wound care
2.2.1.2 Advanced Wound Care
2.2.2 Advanced Wound Care Market by Biologics
2.2.2.1 Skin Replacement Therapies
2.2.2.2 Collagen-Based Therapies
2.2.2.3 Cell-Based Therapies
2.2.3 Advanced Wound Care market by Devices
2.2.3.1 Negative Pressure Wound Therapy (NPWT)
2.2.3.2 Ultrasound for Wound Therapy
2.3 Demand for Advanced Wound Care in Regional Markets
2.3.1 Americas Advanced Wound Care Market Overview - 2018
2.3.2 Europe Advanced Wound Care Market Overview- 2018
2.3.3 Asia-Pacific Advanced Wound Care Market 2018
3. Global Advanced Wound Care Market, 2018
3.1 Global Advanced Wound Care Market 2018 Overview
3.2 The World Advanced Wound Care Market: Industry Trends, 2018-2029
3.3 Drivers and Challenges for the Global Advanced Wound Care Market
3.3.1 Drivers
3.3.1.1 Increase in Aging Population:
3.3.1.2 Lifestyle Factors
3.3.1.3 Growing Incidence of Diabetes, Ulcers and Chronic Wounds
3.3.1.4 Technological Advancements and Government Initiatives
3.3.2 Challenges
3.3.2.1 High Cost Procedures
3.3.2.2 Disparity in Reimbursements
3.3.2.3 Reluctance to Accept New Technologies
3.3.3 Opportunities
3.3.3.1 Significant Growth Opportunities in Asia-Pacific and Developing Countries
3.3.3.2 Healthy Growth in the Active Wound Care Market
4. Leading 20 Companies Positioning in the Advanced Wound Care Market
4.1 Leading 20 Companies Ranking in the Advanced Wound Care Market
4.2 Global Advanced Wound Care Market Forecast, 2018-2029
5. Top 20 Advanced Wound Care Companies
5.1 Smith & Nephew Plc. Overview
5.1.1 Smith & Nephew Plc. Financial Outlook
5.1.2 Smith & Nephew Plc Product Portfolio
5.1.3 Smith & Nephew Plc Strategic Developments
5.2 Acelity (KCI and Systagenix) Overview
5.2.1 Acelity L.P. Inc. Financial Outlook
5.2.2 Acelity L.P. Inc. Product Portfolio
5.2.3 Acelity L.P. Inc. Strategic Developments
5.3 Mölnlycke Health Care AB Overview
5.3.1 Mölnlycke Financial Outlook
5.3.2 Mölnlycke Product Portfolio
5.3.3 Mölnlycke Strategic Developments
5.4 ConvaTec Group Plc Overview
5.4.1 ConvaTec Group Plc Financial Outlook
5.4.2 ConvaTec Group Plc Product Portfolio
5.4.3 ConvaTec Group Plc Strategic Developments
5.5 Coloplast A/S Overview
5.5.1 Coloplast A/S Financial Outlook
5.5.2 Coloplast A/S Product Portfolio
5.5.3 Coloplast A/S Strategic Developments
5.6 3M Company Overview
5.6. 3M Company Financial Outlook
5.6.2 3M Company Product Portfolio
5.6.3 3M Company Strategic Developments
5.7 B. Braun Melsungen AG Overview
5.7.1 B. Braun Melsungen AG Financial Outlook
5.7.2 B. Braun Melsungen AG Product Portfolio
5.7.3 B. Braun Melsungen AG Strategic Developments
5.8 BSN Medical GmbH Overview
5.8.1 BSN Medical GmbH Financial Outlook
5.8.2 BSN Medical GmbH Product Portfolio
5.8.3 BSN Medical GmbH Strategic Developments
5.9 Cardinal Health, Inc. Overview
5.9.1 Cardinal Health, Inc. Financial Outlook
5.9.2 Cardinal Health, Inc. Product Portfolio
5.9.3 Cardinal Health, Inc. Strategic Developments
5.10 Generex Biotechnology Corp. Overview
5.10.1 Generex Biotechnology Corp.Financial Outlook
5.10.2 Generex Biotechnology Corp. Product Portfolio
5.10.3 Generex Biotechnology Corp. Strategic Developments
5.11 Hill-Rom Holdings, Inc. Overview
5.11.1 Hill-Rom Holdings, Inc.Financial Outlook
5.9.2 Hill-Rom Holdings, Inc. Product Portfolio
5.11.3 Hill-Rom Holdings, Inc. Strategic Developments
5.12 Hollister, Inc. Overview
5.12.1 Hollister, Inc. Financial Outlook
5.12.2 Hollister, Inc. Product Portfolio
5.13 Integra LifeSciences Holdings Corporation Overview
5.13.1 Integra LifeSciences Holdings Corporation Financial Outlook
5.9.2 Integra LifeSciences Holdings Corporation Product Portfolio
5.13.3 Integra LifeSciences Holdings Corporation Strategic Developments
5.14 Lohmann & Rauscher GmbH & Co. Kg Overview
5.14.1 Lohmann & Rauscher GmbH & Co. Kg Financial Outlook
5.14.2 Lohmann & Rauscher GmbH & Co. Kg Product Portfolio
5.14.3 Lohmann & Rauscher GmbH & Co. Kg Strategic Developments
5.15 Medline Industries, Inc. Overview
5.15.1 Medline Industries, Inc. Financial Outlook
5.15.2 Medline Industries, Inc. Product Portfolio
5.16 Medtronic PLC Overview
5.16.1 Medtronic PLC Financial Outlook
5.16.2 Medtronic PLC Product Portfolio
5.16.3 Medtronic PLC Strategic Developments
5.17 Organogenesis Inc. Overview
5.17.1 Organogenesis Inc.Financial Outlook
5.17.2 Organogenesis Inc. Product Portfolio
5.17.3 Organogenesis Inc. Strategic Developments
5.18 PAUL HARTMANN AG Overview
5.18.1 PAUL HARTMANN AG Financial Outlook
5.18.2 PAUL HARTMANN AG Product Portfolio
5.19 Celularity, Inc.Overview
5.19.1 Celularity, Inc. Financial Outlook
5.19.2 Celularity, Inc. Product Portfolio
5.19.3 Celularity, Inc. Strategic Developments
5.20 Johnson & Johnson Overview
5.20.1 Johnson & Johnson Financial Outlook
5.5.2 Johnson & Johnson Product Portfolio
6 SWOT Analysis of the Global Advanced Wound Care Market
6.1 Strengths
6.2 Weaknesses
6.3 Opportunities
6.4 Threats
7. Conclusion
7.1 Continuous Innovation and a Strong R&D Pipeline
7.2 Higher Effectiveness Compared with Other Treatments
7.3 An Oligopolistic Market
7.4 Top 20 Companies and Revenue
Appendices
Associated Visiongain Reports
Visiongain Report Sales Order Form
About Visiongain
Visiongain Report Evaluation Form
List of Tables
Table 2.1 The Global Advanced Wound Care Market Revenue Forecast ($bn), 2018-2029
Table 2.2 The North America Advanced Wound Care Market Revenue Forecast ($bn) and Annual Growth (%), 2018-2029
Table 2.3 The Europe Advanced Wound Care Market Revenue Forecast ($bn) and Annual Growth (%), 2018-2029
Table 2.4 Asia-pacific Advanced Wound Care Market Revenue Forecast ($bn) and Annual Growth (%), 2018-2029
Table 4.1 Companies Profiled in this Report and Country HQ
Table 4.2 Global Advanced Wound Care Market Revenue Forecast ($bn) and Annual Growth (%), 2018-2029
Table 5.1 Smith & Nephew Plc.: Key Facts, 2019
Table 5.2 Smith & Nephew Plc.: Revenue ($million) and Revenue Shares (%) by Reporting Segment, 2018
Table 5.3 Smith & Nephew Plc.: Product Revenue ($million) and Revenue Shares (%) by Reporting Segment, 2018
Table 5.4 Smith & Nephew Plc.: Advanced Wound Management Revenue ($million), AGR (%) 2016-2018
Table 5.5 Smith & Nephew Plc.: Advanced Wound Management Product Revenue ($million) and Revenue Shares (%), 2018
Table 5.6 Smith & Nephew Plc.: Strategic Developments, 2015-2019
Table 5.7 Acelity L.P. Inc.: Key Facts, 2019
Table 5.8 Acelity L.P. Inc.: Strategic Developments, 2015-2019
Table 5.9 Mölnlycke: Key Facts, 2019
Table 5.10 Mölnlycke: Strategic Developments, 2015-2019
Table 5.11 ConvaTec Group Plc: Key Facts, 2019
Table 5.12 ConvaTec Group Plc: Revenue ($million) and Revenue Shares (%) by Reporting Segment, 2018
Table 5.13 ConvaTec Group Plc: Advanced Wound Care Revenue ($million), AGR (%) 2016-2018
Table 5.14 ConvaTec Group Plc: Strategic Developments, 2015-2019
Table 5.15 Coloplast A/S: Key Facts, 2018
Table 5.16 Coloplast A/S: Revenue ($million) and Revenue Shares (%) by Reporting Segment, 2018
Table 5.17 Coloplast A/S: Wound & Skin Care Revenue ($million), AGR (%) 2016-2018
Table 5.18 Coloplast A/S: Strategic Developments, 2015-2019
Table 5.19 3M Company: Key Facts, 2019
Table 5.20 3M Company: Revenue ($million) and Revenue Shares (%) by Reporting Segment, 2018
Table 5.21 3M Company: Strategic Developments, 2015-2018
Table 5.22 B. Braun Melsungen AG: Key Facts, 2019
Table 5.23 B. Braun Melsungen AG: Revenue ($million) and Revenue Shares (%) by Reporting Segment, 2017
Table 5.24 B. Braun Melsungen AG: Outpatient Revenue ($million), AGR (%) 2015-2017
Table 5.25 B. Braun Melsungen AG: Strategic Developments, 2015-2018
Table 5.26 BSN Medical GmbH: Key Facts, 2018
Table 5.27 BSN Medical GmbH: Strategic Developments, 2015-2018
Table 5.28 Cardinal Health, Inc.: Key Facts, 2019
Table 5.29 Cardinal Health, Inc.: Revenue ($million) and Revenue Shares (%) by Reporting Segment, 2018
Table 5.30 Cardinal Health, Inc.: Medical Segment Revenue ($million), AGR (%) 2016-2018
Table 5.31 Cardinal Health, Inc.: Strategic Developments, 2015-2019
Table 5.32 Generex Biotechnology Corp.: Key Facts, 2019
Table 5.33 Generex Biotechnology Corp.: Strategic Developments, 2015-2019
Table 5.34 Hill-Rom Holdings, Inc.: Key Facts, 2019
Table 5.35 Hill-Rom Holdings, Inc.: Revenue ($million) and Revenue Shares (%) by Reporting Segment, 2018
Table 5.36 Hill-Rom Holdings, Inc.: Healthcare Revenue ($million), AGR (%) 2016-2018
Table 5.37 Hill-Rom Holdings, Inc.: Strategic Developments, 2015-2018
Table 5.38 Hollister, Inc.: Key Facts, 2018
Table 5.39 Integra LifeSciences Holdings Corporation: Key Facts, 2019
Table 5.40 Integra LifeSciences Holdings Corporation: Revenue ($million) and Revenue Shares (%) by Reporting Segment, 2018
Table 5.41 Integra LifeSciences Holdings Corporation: Orthopedics & Tissue Technologies Revenue ($million), AGR (%) 2016-2018
Table 5.42 Integra LifeSciences Holdings Corporation: Strategic Developments, 2015-2018
Table 5.43 Lohmann & Rauscher GmbH & Co. Kg: Key Facts, 2018
Table 5.44 Lohmann & Rauscher GmbH & Co. Kg: Strategic Developments, 2015-2018
Table 5.45 Medline Industries, Inc.: Key Facts, 2018
Table 5.46 Medtronic PLC: Key Facts, 2018
Table 5.47 Medtronic PLC: Revenue ($million) and Revenue Shares (%) by Segment, 2018
Table 5.48 Medtronic PLC: Minimally Invasive Therapies Group Revenue ($million), AGR (%) 2016-2018
Table 5.49 Medtronic PLC: Minimally Invasive Product Revenue ($million) and Revenue Shares (%), 2018
Table 5.50 Medtronic PLC: Strategic Developments, 2015-2018
Table 5.51 Organogenesis Inc.: Key Facts, 2018
Table 5.52 Organogenesis Inc.: Strategic Developments, 2015-2018
Table 5.53 PAUL HARTMANN AG: Key Facts, 2019
Table 5.54 PAUL HARTMANN AG: Revenue ($million) and Revenue Shares (%) by Segment, 2018
Table 5.55 PAUL HARTMANN AG: Wound Management Revenue ($million), AGR (%) 2017-2018
Table 5.56 Celularity, Inc.: Key Facts, 2019
Table 5.57 Celularity, Inc.: Strategic Developments, 2015-2018
Table 5.58 Johnson & Johnson: Key Facts, 2019
Table 5.59 Johnson & Johnson: Revenue ($million) and Revenue Shares (%) by Reporting Segment, 2018
Table 5.60 Johnson & Johnson: Product Revenue ($million) and Revenue Shares (%) by Reporting Segment, 2018
Table 5.61 Johnson & Johnson: Wound Care/Other Revenue ($million), AGR (%) 2016-2018
Table 7.1 Top 20 Companies and Revenue, 2018 ($million)
List of Figures
Figure 4.1 Market share of key companies in advanced wound care market (%), 2018
Figure 4.2 Global Advanced Wound Care Market Revenue ($bn), 2018-2029
Figure 5.1 Smith & Nephew Plc.: Historical Revenues ($million, 2014-2018
Figure 5.2 Smith & Nephew Plc.: Revenue Shares (%) by Reporting Segment, 2018
Figure 5.3 Smith & Nephew Plc.: Revenue Shares (%) by Reporting Segment, 2018
Figure 5.4 Smith & Nephew Plc.: Revenue Shares (%) by Region, 2018
Figure 5.5 Smith & Nephew Plc: Advanced Wound Management Revenue ($million), 2016-2018
Figure 5.6 Smith & Nephew Plc.: Advanced Wound Management Product Revenue Shares (%), 2018
Figure 5.7 Mölnlycke : Historical Revenues ($million), 2014-2018
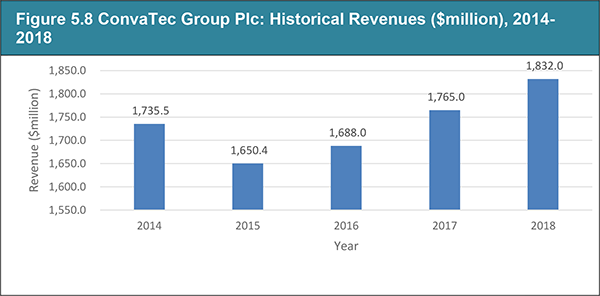
Figure 5.8 ConvaTec Group Plc: Historical Revenues ($million), 2014-2018
Figure 5.9 ConvaTec Group Plc: Revenue Shares (%) by Reporting Segment, 2018
Figure 5.10 ConvaTec Group Plc: Revenue Shares (%) by Region, 2018
Figure 5.11 ConvaTec Group Plc: Advanced Wound Care Revenue Shares (%), 2016-2018
Figure 5.12 Coloplast A/S: Historical Revenues ($million), 2014-2018
Figure 5.13 Coloplast A/S: Revenue Shares (%) by Reporting Segment, 2018
Figure 5.14 Coloplast A/S: Revenue Shares (%) by Region, 2018
Figure 5.15 Coloplast A/S: Wound & Skin Care Revenue ($million), 2016-2018
Figure 5.16 3M Company: Historical Revenues ($million), 2014-2018
Figure 5.17 3M Company: Revenue Shares (%) by Reporting Segment, 2018
Figure 5.18 3M Company: Revenue Shares (%) by Region, 2018
Figure 5.19 B. Braun Melsungen AG: Historical Revenues ($million), 2013-2017
Figure 5.20 B. Braun Melsungen AG: Revenue Shares (%) by Reporting Segment, 2017
Figure 5.21 B. Braun Melsungen AG: Revenue Shares (%) by Region, 2017
Figure 5.22 B. Braun Melsungen AG: Outpatient Revenue ($million), 2015-2017
Figure 5.23 Cardinal Health, Inc.: Historical Revenues ($million), 2014-2018
Figure 5.24 Cardinal Health, Inc.: Revenue Shares (%) by Reporting Segment, 2018
Figure 5.25 Cardinal Health, Inc.: Revenue Shares (%) by Region, 2018
Figure 5.26 Cardinal Health, Inc.: Medical Segment Revenue ($million), 2016-2018
Figure 5.27 Hill-Rom Holdings, Inc.: Historical Revenues ($million), 2014-2018
Figure 5.28 Hill-Rom Holdings, Inc.: Revenue Shares (%) by Reporting Segment, 2018
Figure 5.29 Hill-Rom Holdings, Inc.: Revenue Shares (%) by Region, 2018
Figure 5.30 Hill-Rom Holdings, Inc.: Healthcare Revenue ($million), 2016-2018
Figure 5.31 Integra LifeSciences Holdings Corporation: Historical Revenues ($million), 2014-2018
Figure 5.32 Integra LifeSciences Holdings Corporation: Revenue Shares (%) by Reporting Segment, 2018
Figure 5.33 Integra LifeSciences Holdings Corporation: Revenue Shares (%) by Region, 2018
Figure 5.34 Integra LifeSciences Holdings Corporation: Orthopedics & Tissue Technologies Revenue ($million), 2016-2018
Figure 5.35 Medtronic PLC: Historical Revenues ($million), 2014-2018
Figure 5.36 Medtronic PLC: Revenue Shares (%) by Segment, 2018
Figure 5.37 Medtronic PLC: Revenue Shares (%) by Product Type, 2018
Figure 5.38 Medtronic PLC: Revenue Shares (%) by Region, 2017
Figure 5.39 Medtronic PLC: Minimally Invasive Therapies Group Revenue ($million), 2016-2018
Figure 5.40 Medtronic PLC: Minimally Invasive Product Revenue Shares (%), 2018
Figure 5.42 PAUL HARTMANN AG: Revenue Shares (%) by Product Type, 2018
Figure 5.43 PAUL HARTMANN AG: Revenue Shares (%) by Region, 2018
Figure 5.44 PAUL HARTMANN AG: Wound Management Revenue ($million), 2017-2018
Figure 5.45 PAUL HARTMANN AG: Wound Management Revenue by Region($million), 2018
Figure 5.46 Johnson & Johnson: Historical Revenues ($million), 2014-2018
Figure 5.47 Johnson & Johnson: Revenue Shares (%) by Reporting Segment, 2018
Figure 5.48 Johnson & Johnson: Revenue Shares (%) by Product, 2018
Figure 5.49 Johnson & Johnson: Revenue Shares (%) by Region, 2018
Figure 5.50 Johnson & Johnson: Wound Care/Other Revenue ($million), 2016-2018
Figure 5.51 Johnson & Johnson: Wound Care/Other Revenue by Region ($million), 2018
Figure 6.1 SWOT Analysis of the Global Advanced Wound Care Market, 2019
3M Company
Acelity L.P. Inc.
Alliqua BioMedical
Avista Capital Partners
B. Braun Melsungen AG
Bristol-Myers Squibb
BSN Medical GmbH
Cardinal Health, Inc.
Celularity, Inc.
Center for Disease Control (CDC)
Codman Neurosurgery
Coloplast A/S
ConvaTec Group plc
Covidien Plc.
Crawford Healthcare
DeOst group
ER Squibb & Sons
FarrowMed
Food and Drug Administration (FDA)
Generex Biotechnology Corp.
GHD GesundHeits GMBH Deutschland
Healthpoint Biotheraputics
Hill-Rom Holdings, Inc.
Hollister Incorporated
Immodulon
Integra LifeSciences Holdings Corporation
International Diabetes Federation (IDF)
Johnson & Johnson
Johnson & Johnson
JoViPak
KCI
Lohmann & Rauscher GmbH & Co. Kg
Mediq
Medline Industries, Inc.
Medtronic PLC
Metasurg
Ministry of Health, Labour, and Welfare (MHLW)
Mölnlycke Health Care
Nordic Capital Partners
NuTech Medical
Olaregen Therapeutix Inc.
Organogenesis
PAUL HARTMANN AG
Pharmaceuticals and Medical Devices Agency (PMDA)
Regentys Corporation
SastoMed GmbH.
Smith & Nephew
SNaP
Sorbion
Spiracur Inc.
Sundance Enterprises, Inc.
TEI Biosciences Inc.
TEI Medical Inc.
Terumo Corporation
The Harvard Drug Group (THDG)
Tissue Analytics
World Health Organisation (WHO)
Wright Therapy Products, Inc.
Download sample pages
Complete the form below to download your free sample pages for Top 20 Advanced Wound Care Companies 2020
Related reports
-

Wound Debridement Market Report 2019-2029
Visiongain’s new report the Wound Debridement Market Report 2019-2029: Forecasts by Product (Gels, Ointments & Creams, Surgical Devices, Medical Gauzes,...
Full DetailsPublished: 01 January 1970 -

Moist Wound Dressings Report 2020-2030
Our new study lets you assess forecasted sales at overall world market and regional level. See financial results, trends, opportunities,...
Full DetailsPublished: 01 January 1970 -
Top 25 Dermatological Drugs Manufacturers 2019
Dermatological drugs market has been growing over the last decade. A combination of significant new market launches, and corporate activities...
Full DetailsPublished: 15 April 2019 -

Global Anaesthesia & Respiratory Devices Market Report 2019-2029
The market for anesthesia and respiratory devices is fragmented with major players accounting for about 50% of the market.
...Full DetailsPublished: 01 January 1970 -

Global Surgical Sutures Market 2020-2030
The global surgical sutures market is expected to reach $6.4bn in 2024 and is estimated to grow at a CAGR...
Full DetailsPublished: 08 October 2019 -

Oxygen Therapy Market Report 2020-2030
See financial performance of companies, trends, opportunities, and revenue growth
...Full DetailsPublished: 01 January 1970 -

Dermatological Drugs Market Forecast 2020-2030
The revenue of the dermatological drugs market in 2018 is estimated at $31bn and is expected to grow at a...Full DetailsPublished: 31 October 2019 -

Global OTC Pharmaceutical Market Forecast 2019-2029
The global OTC Pharmaceuticals market is estimated to be $162.64bn in 2018 and is expected to grow at a CAGR...
Full DetailsPublished: 31 July 2019 -

Global Nebulizers Market Report 2019-2029
Nebulizer is a medical device which converts the drug into mist and delivers it to the lungs directly. This technique...
Full DetailsPublished: 01 January 1970 -

Global Negative Pressure Wound Therapy Market 2019-2029
Negative pressure wound therapy (NPWT) is also known as vacuum-assisted wound closure) is used in the treatment of various acute...
Full DetailsPublished: 01 January 1970
Download sample pages
Complete the form below to download your free sample pages for Top 20 Advanced Wound Care Companies 2020
Do you have any custom requirements we can help you with?
Any specific country, geo region, market segment or specific company information?
Email us today, we can discuss your needs and see how we can help: jamie.roberts@visiongain.com
Would you like a free report overview of the report of your choice?
If so, please drop an email to Jamie Roberts stating your chosen report title to jamie.roberts@visiongain.com
Visiongain’s reports are based on comprehensive primary and secondary research. Those studies provide global market forecasts (sales by drug and class, with sub-markets and leading nations covered) and analyses of market drivers and restraints (including SWOT analysis) and current pipeline developments. To find out more about our reports methodology, please email jamie.roberts@visiongain.com
“Thank you for this Gene Therapy R&D Market report and for how easy the process was. Your colleague was very helpful and the report is just right for my purpose. This is the 2nd good report from Visiongain and a good price.”
Dr Luz Chapa Azuella, Mexico
American Association of Colleges of Pharmacy
American College of Clinical Pharmacy
American Pharmacists Association
American Society for Pharmacy Law
American Society of Consultant Pharmacists
American Society of Health-System Pharmacists
Association of Special Pharmaceutical Manufacturers
Australian College of Pharmacy
Biotechnology Industry Organization
Canadian Pharmacists Association
Canadian Society of Hospital Pharmacists
Chinese Pharmaceutical Association
College of Psychiatric and Neurologic Pharmacists
Danish Association of Pharmaconomists
European Association of Employed Community Pharmacists in Europe
European Medicines Agency
Federal Drugs Agency
General Medical Council
Head of Medicines Agency
International Federation of Pharmaceutical Manufacturers & Associations
International Pharmaceutical Federation
International Pharmaceutical Students’ Federation
Medicines and Healthcare Products Regulatory Agency
National Pharmacy Association
Norwegian Pharmacy Association
Ontario Pharmacists Association
Pakistan Pharmacists Association
Pharmaceutical Association of Mauritius
Pharmaceutical Group of the European Union
Pharmaceutical Society of Australia
Pharmaceutical Society of Ireland
Pharmaceutical Society Of New Zealand
Pharmaceutical Society of Northern Ireland
Professional Compounding Centers of America
Royal Pharmaceutical Society
The American Association of Pharmaceutical Scientists
The BioIndustry Association
The Controlled Release Society
The European Federation of Pharmaceutical Industries and Associations
The European Personalised Medicine Association
The Institute of Clinical Research
The International Society for Pharmaceutical Engineering
The Pharmaceutical Association of Israel
The Pharmaceutical Research and Manufacturers of America
The Pharmacy Guild of Australia
The Society of Hospital Pharmacists of Australia
Latest Pharma news
Visiongain Publishes Drug Delivery Technologies Market Report 2024-2034
The global Drug Delivery Technologies market is estimated at US$1,729.6 billion in 2024 and is projected to grow at a CAGR of 5.5% during the forecast period 2024-2034.
23 April 2024
Visiongain Publishes Cell Therapy Technologies Market Report 2024-2034
The cell therapy technologies market is estimated at US$7,041.3 million in 2024 and is projected to grow at a CAGR of 10.7% during the forecast period 2024-2034.
18 April 2024
Visiongain Publishes Automation in Biopharma Industry Market Report 2024-2034
The global Automation in Biopharma Industry market is estimated at US$1,954.3 million in 2024 and is projected to grow at a CAGR of 7% during the forecast period 2024-2034.
17 April 2024
Visiongain Publishes Anti-obesity Drugs Market Report 2024-2034
The global Anti-obesity Drugs market is estimated at US$11,540.2 million in 2024 and is expected to register a CAGR of 21.2% from 2024 to 2034.
12 April 2024
