As a key player in tire derived fuels, it is important for you to remain up to date with news surrounding COVID-19 and the tire industry
Thankfully, you don’t have to look any further. Visiongain has collated important tire industry updates from across the country. With the scale of the COVID-19 pandemic, no sector has been left unaffected. This is true for the tire industry. The last few months have seen a shift in rules and regulation surrounding commercial trucking and vehicle travel. It is important to stay abreast to the market activities to get an edge over competitors.
Tire Derived Fuels Market–our new study reveals trends, R&D progress, and predicted revenues
Tire derived fuels are fitting into a broader drive to improve environmental sustainability and address climate change. Several goals are seen as possible including renewability, elimination of toxins, optimized design and manufacturing, recyclability and use of post-consumer content. Tire derived fuels are serving to important purposes such as providing an alternative option to companies such as cement, paper & pulp to use tire derived fuels to save fuel cost and to save environment issues related to waste tires.
This report includes data analysis and invaluable insight into how COVID-19 will affect your industry. Access this report today.
To access the data contained in this document please email contactus@visiongain.com
If you read only 1 tire report this year – this is the report you need to read. Take a look at our report on tire derived fuels. It’ll give you an idea of what activities are in the global market and how you can leverage your products and services to generate revenue.
Key questions answered in this exclusive report are:
• What are the implication of vehicle and tire sales on tire recycling projects taking place now and over the next 10 years?
• Is there a greater need for product commercialisation to further scale the tire derived fuels market?
• Where is the tire derived fuels market heading? And how can you ensure you are at the forefront of the market?
You need to discover how this will impact the tire derived fuels market today, and over the next 10 years:
• Our 368-page report provides 219 tables and 211 charts/graphs exclusively to you.
• The report highlights key lucrative areas in the industry so you can target them – NOW.
• Contains in-depth analyse of global, regional and national sales and growth
• Highlights for you the key successful trends, changes and revenue projections made by your competitors
This report tells you TODAY how the tire derived fuels market will develop in the next 10 years, and in-line with the variations in COVID-19 economic recession and bounce. This market is more critical now than at any point over the last 10 years.
Forecasts to 2031 and other analyses reveal the commercial prospects
• In addition to revenue forecasting to 2031, our new study provides you with recent results, growth rates, and market shares.
• You find original analyses, with business outlooks and developments.
• Discover qualitative analyses (including market dynamics, drivers, opportunities, restraints and challenges), cost structure, impact of rising vehicle & tire prices and recent developments.
This report includes data analysis and invaluable insight into how COVID-19 will affect your industry. Four COVID-19 recovery patterns and their impact, namely, V, L, W and U are discussed in this report.
Global Tire Derived Fuels Market by Method Source (COVID Impact Analysis)
• Passenger Tire Replacements
• Light Truck Tire Replacements
• Heavy Truck Tire Replacements
• Tires from Scrapped Vehicles
Global Tire Derived Fuels Market By Raw Form Method (COVID Impact Analysis)
• Shredded & Chipped Tires
• Whole Tires
Global Tire Derived Fuels Market By End-User Based Method (COVID Impact Analysis)
• Cement Industry
• Pulp and Paper Mills Industry
• Electric Utilities Industry
• Industrial/Institutional Boilers
• Dedicated Tire-to-Energy Facilities
• Other End-User

In addition to the revenue predictions for the overall world market and segments, you will also find revenue forecasts for 4 regional and 20 leading national markets:
• North America Tire Derived Fuels Market, 2021 to 2031 Market Outlook
• U.S. Tire Derived Fuels Market, 2021 to 2031 Market Forecast & COVID Impact Analysis
• Canada Tire Derived Fuels Market, 2021 to 2031 Market Forecast & COVID Impact Analysis
• Europe Tire Derived Fuels Market, 2021 to 2031 Market Outlook
• Germany Tire Derived Fuels Market, 2021 to 2031 Market Forecast & COVID Impact Analysis
• Russia Tire Derived Fuels Market, 2021 to 2031 Market Forecast & COVID Impact Analysis
• United Kingdom Tire Derived Fuels Market, 2021 to 2031 Market Forecast & COVID Impact Analysis
• France Tire Derived Fuels Market, 2021 to 2031 Market Forecast & COVID Impact Analysis
• Italy Tire Derived Fuels Market, 2021 to 2031 Market Forecast & COVID Impact Analysis
• Rest of Europe Market Forecast & COVID Impact Analysis
• Asia Pacific Tire Derived Fuels Market, 2021 to 2031 Market Outlook
• China Tire Derived Fuels Market, 2021 to 2031 Market Forecast & COVID Impact Analysis
• Japan Tire Derived Fuels Market, 2021 to 2031 Market Forecast & COVID Impact Analysis
• India Tire Derived Fuels Market, 2021 to 2031 Market Forecast & COVID Impact Analysis
• Australia Tire Derived Fuels Market, 2021 to 2031 Market Forecast & COVID Impact Analysis
• Korea Tire Derived Fuels Market, 2021 to 2031 Market Forecast & COVID Impact Analysis
• Rest of Asia Pacific Market Forecast & COVID Impact Analysis
• LAMEA Tire Derived Fuels Market, 2021 to 2031 Market Outlook
• Brazil Tire Derived Fuels Market, 2021 to 2031 Market Forecast & COVID Impact Analysis
• Mexico Tire Derived Fuels Market, 2021 to 2031 Market Forecast & COVID Impact Analysis
• Saudi Arabia Tire Derived Fuels Market, 2021 to 2031 Market Forecast & COVID Impact Analysis
• South Africa Tire Derived Fuels Market, 2021 to 2031 Market Forecast & COVID Impact Analysis
• UAE Tire Derived Fuels Market, 2021 to 2031 Market Forecast & COVID Impact Analysis
• Rest of Latin America, Middle East and Africa
Need industry data? Please contact us today.
The report also includes profiles and for some of the leading companies in the Tire Derived Fuels Market, 2021 to 2031, with a focus on this segment of these companies’ operations.
Leading companies and the potential for market growth
• The Goodyear Tire & Rubber Company
• Toyo Tire Corporation Company
• Ambuja Cements Limited
• Bridgestone Corporation
• Cemex SAB de CV
• Columbus McKinnon Corp.
• Continental AG
• CRH PLC Building Material Company
• Heidelberg Cement Company
• LafargeHolcim Ltd Company
• Michelin Manufacturing Company
• UltraTech Cement Limited Company
• Entergy Corporation Company
• DN Tyre & Rubber PLC Company
• The Monarch Cement Company
Overall world revenue for Tire Derived Fuels Market, 2021 to 2031 Market will surpass US$xx million in 2020, our work calculates. We predict strong revenue growth through to 2031. Our work identifies which organizations hold the greatest potential. Discover their capabilities, progress, and commercial prospects, helping you stay ahead.
How the Tire Derived Fuels Market, 2021 to 2031 Market report helps you
In summary, our 369 page report provides you with the following knowledge:
• Revenue forecasts to 2031 for Tire Derived Fuels Market, 2021 to 2031 Market, with forecasts for raw form, source, end-user each forecasted at a global and regional level– discover the industry’s prospects, finding the most lucrative places for investments and revenues
• Revenue forecasts to 2031 for 5 regional and 20 key national markets – See forecasts for the Tire Derived Fuels Market, 2021 to 2031 market in North America, Europe, Asia-Pacific and LAMEA. Also forecasted is the market in the US, Canada, Mexico, Brazil, Germany, France, UK, Italy, Russia, China, India, Japan, and Australia among other prominent economies.
• Prospects for established firms and those seeking to enter the market– including company profiles for 15 of the major companies involved in the Tire Derived Fuels Market, 2021 to 2031 Market.
Find quantitative and qualitative analyses with independent predictions. Receive information that only our report contains, staying informed with this invaluable business intelligence.
Information found nowhere else
With our newly report title, you are less likely to fall behind in knowledge or miss out on opportunities. See how our work could benefit your research, analyses, and decisions. Visiongain’s study is for everybody needing commercial analyses for the Tire Derived Fuels Market, 2021 to 2031 Market and leading companies. You will find data, trends and predictions.
To access the data contained in this document please email contactus@visiongain.com
Buy our report today Tire Derived Fuel (TDF) Market Report 2021-2031: Forecasts by Raw Form (Shredded & Chipped Tires, Whole Tires), by Source (Passenger Tire Replacements, Light Truck Tire Replacements, Heavy Truck Tire Replacements, Tires from Scrapped Vehicles), End-user (Cement Industry, Pulp and Paper Mills Industry, Electric Utilities Industry, Industrial/Institutional Boilers, Dedicated Tire-to-Energy Facilities, Other End-user) and Regional and Leading National Market Analysis PLUS Analysis of Leading TDF Companies AND COVID-19 Recovery Scenarios. Avoid missing out by staying informed – order our report now.
Visiongain is a trading partner with the US Federal Government
CCR Ref number: KD4R6
Do you have any custom requirements we can help you with? Any need for a specific country, geo region, market segment or specific company information? Contact us today, we can discuss your needs and see how we can help: sara.peerun@visiongain.com
1. Report Overview
1.1 Why You Should Buy This Report
1.2 How This Report Delivers
1.3 Key Questions Answered by This Analytical Report Include:
1.4 Who is This Report For?
1.5 Methodology
1.5.1 Source of Information
1.5.2 Primary Research
1.5.3 Secondary Research
1.6 Market Evaluation & Forecasting Methodology
1.7 COIVD-19 Impact Recovery Pattern Analysis
1.7.1 V-Shaped Recovery
1.7.2 U-Shaped Recovery
1.7.3 W-Shaped Recovery
1.7.4 L-Shaped Recovery
1.8 Frequently Asked Questions (FAQ)
1.9 Associated Visiongain Reports
1.10 About Visiongain
2. Executive Summary
2.1 Key Take Away
3. Industry Structure and Technology Background
3.1 Industry Introduction
3.2 Industry Value Chain Analysis
3.3 Market Definitions
3.4 Scrap Tire and Rubber Remediation Treatment Technologies
3.5 Mechanical Treatment Technologies
3.5.1 Mechanical Shredding
3.5.2 Mechanical Grinding: Granulation
3.5.3 Cryogenic Treatment Technologies
3.5.4 Mechanical Devulcanization
3.6 Thermal Treatment Technologies
3.6.1 Pyrolysis Process for Scrap Tires Treatment
3.7 Gasification Process for Scrap Tire Treatment
3.7.1 Devulcanization Process for Scrap Tire Treatment
3.7.2 Crumb Rubber
3.8 Management Systems for Scrap Tire Collection and Recovery
4. Market Dynamics
4.1 Market Drivers
4.1.1 To Address the Issue of Climate Change Issue, Countries Are Opting for Tire Derived Fuels
4.1.2 Volatility of Oil Pricing and Supply Affecting Raw Material Prices
4.1.3 Tire Derived Fuels Are Fitting into A Broader Drive to Improve Environmental Sustainability
4.1.4 High Energy Associated with the Scrap Tires
4.1.5 The Biodegradability Argument Hinges On the Emergence of Industrial-Scale Composting Facilities
4.1.6 Tire Derived Fuels Possess Superior Properties to Their Oil-Based Competitors
4.2 Market Growth Restraining Factors
4.2.1 Cost of Production Associated with Tire Derived Fuels
4.2.2 Performance of Tire Derived Fuels in Heavy Load Works
4.3 Opportunities in the Global Market
4.3.1 Need for New and Expanded Markets for Tire Derived Fuels
4.3.2 TDF Expansion Requires Sustained Manufacturer Commitment & Investment
4.4 Challenges in the Market
4.4.1 A Major Market Challenge Is the Public Concern Regarding the Use Of Tires As Fuel
4.4.2 Access To Adequate Scrap Tire Supplies
4.4.3 Does Quality of Tire Derived Fuels Matters?
4.4.4 The Characterization Of Scrap Tire-Derived Products Through Standards Is Also An Important Challenge For The Global Market.
4.4.5 High Cost of Doing Business in global
4.4.6 Access to Financing for Running Business
4.5 SWOT Analysis of Tire Derived Market
4.5.1 Strengths of Tire Derived Fuels
4.5.1.1 Strong growth in coming years
4.5.1.2 Increasing demand for tire derived fuels due to stringent regulations for other conventional fuels
4.5.1.3 Heavy investments in R&D of tire derived fuels
4.5.1.4 Healthy competition in the global tire derived fuels market
4.5.2 Weakness of Tire Derived Fuels
4.5.2.1 Lower acceptance as compared to conventional fuels
4.5.2.2 Too many standards to qualify as industrial fuels
4.5.2.3 Till date none of the scrap derived products are capable of replacing regular fuels
4.5.3 Opportunities in the Tire Derived Fuels Market
4.5.3.1 Innovations in new materials and products
4.5.3.2 Adoption of new technologies for manufacturing tire derived fuels
4.5.3.3 Increasing adoption by various countries around the world
4.5.3.4 Increasing consumer awareness about scrape tire pollution
4.5.4 Threats in the Tire Derived Fuels Market
4.5.4.1 Stiff competition in the global market posing threats for leading players
4.5.4.2 Stringent regulations affecting market growth
4.5.4.3 Sustainable plastic product approval is a huge threat to manufacturing companies
4.6 Porter’s Five Forces Analysis
4.6.1 What are Porter Five (5) Forces
4.6.2 Intensity of Competitive Revelry (High)
4.6.3 Threat of New Entrances (Low)
4.6.4 The Threat of Substitute Products (High)
4.6.5 The Bargaining Power of Buyers (Moderate)
4.6.6 Bargaining Power of Supplier (High)
5. Global Tire Derived Fuels Market Outlook
5.1 Tire Derived Fuels Market Breakdown by Value (COVID-19 Impact V, W, U, L Shaped Recovery Analysis)
5.2 Tire Derived Fuels Market Breakdown by Region (COVID-19 Impact V, W, U, L Shaped Recovery Analysis)
5.3 Tire Derived Fuels Market Breakdown by Raw Form (COVID-19 Impact V, W, U, L Shaped Recovery Analysis)
5.4 Tire Derived Fuels Market Breakdown by Source (COVID-19 Impact V, W, U, L Shaped Recovery Analysis)
5.5 Tire Derived Fuels Market Breakdown by End-Use (COVID-19 Impact V, W, U, L Shaped Recovery Analysis)
5.5.1 Cement Industry
5.5.2 Process description
5.5.3 Tire-derived Fuel in the Paper and Pulp Industry
5.5.4 Tire-derived Fuel in Electric Utilities
5.5.5 Tire-derived Fuel in Industrial and Utility Boilers
6. North America Tire Derived Fuels Market Outlook
6.1 North America Tire Derived Fuels Market Breakdown Value (COVID-19 Impact V, W, U, L Shaped Recovery Analysis)
6.2 North America Tire-Derived Fuels Market Breakdown by Country COVID-19 Impact V, W, U, L Shaped Recovery Analysis)
6.3 US Tire-Derived Fuels Market Outlook (COVID-19 Impact V, W, U, L Shaped Recovery Analysis)
6.3.1 U.S. Scrap Tire Regulation, Legislation and Policies
6.4 Canada Tire-Derived Fuels Market Outlook (COVID-19 Impact V, W, U, L Shaped Recovery Analysis)
6.5 North America Tire Derived Fuels Market Breakdown by Raw Form (COVID-19 Impact V, W, U, L Shaped Recovery Analysis)
6.6 North America Tire Derived Fuels Market Breakdown by Source (COVID-19 Impact V, W, U, L Shaped Recovery Analysis)
6.7 North America Tire Derived Fuels Market Breakdown by End-Use (COVID-19 Impact V, W, U, L Shaped Recovery Analysis)
7. Europe Tire Derived Fuels Market Outlook
7.1 European Scrap Tire Regulation, Legislation and Policies
7.2 Europe Tire Derived Fuels Market Breakdown by Value (COVID-19 Impact V, W, U, L Shaped Recovery Analysis)
7.3 Europe Tire Derived Fuels Market Breakdown by Country (COVID-19 Impact V, W, U, L Shaped Recovery Analysis)
7.4 Russia Tire Derived Fuels Market Outlook (COVID-19 Impact V, W, U, L Shaped Recovery Analysis)
7.5 Germany Tire-Derived Fuels Market Outlook (COVID-19 Impact V, W, U, L Shaped Recovery Analysis)
7.6 France Tire-Derived Fuels Market Outlook (COVID-19 Impact V, W, U, L Shaped Recovery Analysis)
7.7 UK Tire-Derived Fuels Market Outlook (COVID-19 Impact V, W, U, L Shaped Recovery Analysis)
7.8 Italy Tire-Derived Fuels Market Outlook (COVID-19 Impact V, W, U, L Shaped Recovery Analysis)
7.9 Rest of Europe Tire-Derived Fuels Market Outlook (COVID-19 Impact V, W, U, L Shaped Recovery Analysis)
7.10 Europe Tire Derived Fuels Market Breakdown by Raw Form (COVID-19 Impact V, W, U, L Shaped Recovery Analysis)
7.11 Europe Tire Derived Fuels Market Breakdown by Source (COVID-19 Impact V, W, U, L Shaped Recovery Analysis)
7.12 Europe Tire Derived Fuels Market Breakdown by End-Use (COVID-19 Impact V, W, U, L Shaped Recovery Analysis)
8. Asia-Pacific Tire Derived Fuels Market Outlook
8.1 Asia-Pacific Tire Derived Fuels Market Breakdown by Value (COVID-19 Impact V, W, U, L Shaped Recovery Analysis)
8.2 Asia-Pacific Tire Derived Fuels Market Breakdown by Country (COVID-19 Impact V, W, U, L Shaped Recovery Analysis)
8.3 China Tire Derived Fuels Market Outlook (COVID-19 Impact V, W, U, L Shaped Recovery Analysis)
8.4 India Tire-Derived Fuels Market Outlook (COVID-19 Impact V, W, U, L Shaped Recovery Analysis)
8.5 Japan Tire-Derived Fuels Market Outlook (COVID-19 Impact V, W, U, L Shaped Recovery Analysis)
8.5.1 Japanese Scrap Tire Regulations, Legislation and Policies
8.6 Australia Tire-Derived Fuels Market Outlook (COVID-19 Impact V, W, U, L Shaped Recovery Analysis)
8.7 Korea Tire-Derived Fuels Market Outlook (COVID-19 Impact V, W, U, L Shaped Recovery Analysis)
8.8 Rest of Asia-Pacific Tire-Derived Fuels Market Outlook (COVID-19 Impact V, W, U, L Shaped Recovery Analysis)
8.9 Asia-Pacific Tire Derived Fuels Market Breakdown by Raw Form (COVID-19 Impact V, W, U, L Shaped Recovery Analysis)
8.10 Asia-Pacific Tire Derived Fuels Market Breakdown by Source (COVID-19 Impact V, W, U, L Shaped Recovery Analysis)
8.11 Asia-Pacific Tire Derived Fuels Market Breakdown by End-Use (COVID-19 Impact V, W, U, L Shaped Recovery Analysis)
9. LAMEA Tire Derived Fuels Market Outlook
9.1 Latin America Market Outlook
9.2 Middle East & Africa Market Outlook
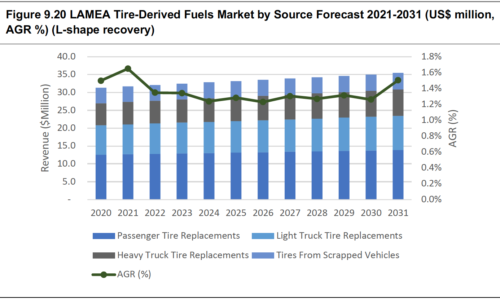
9.3 LAMEA Tire Derived Fuels Market Breakdown by Value (COVID-19 Impact V, W, U, L Shaped Recovery Analysis)
9.4 LAMEA Tire Derived Fuels Market Breakdown by Country (COVID-19 Impact V, W, U, L Shaped Recovery Analysis)
9.5 Brazil Tire Derived Fuels Market Outlook (COVID-19 Impact V, W, U, L Shaped Recovery Analysis)
9.6 Saudi Arabia Tire-Derived Fuels Market Outlook (COVID-19 Impact V, W, U, L Shaped Recovery Analysis)
9.7 South Africa Tire-Derived Fuels Market Outlook (COVID-19 Impact V, W, U, L Shaped Recovery Analysis)
9.8 Mexico Tire-Derived Fuels Market Outlook (COVID-19 Impact V, W, U, L Shaped Recovery Analysis)
9.9 UAE Tire-Derived Fuels Market Outlook (COVID-19 Impact V, W, U, L Shaped Recovery Analysis)
9.10 Rest of LAMEA Tire-Derived Fuels Market Outlook (COVID-19 Impact V, W, U, L Shaped Recovery Analysis)
9.11 LAMEA Tire Derived Fuels Market Breakdown by Raw Form (COVID-19 Impact V, W, U, L Shaped Recovery Analysis)
9.12 LAMEA Tire Derived Fuels Market Breakdown by Source (COVID-19 Impact V, W, U, L Shaped Recovery Analysis)
9.13 LAMEA Tire Derived Fuels Market Breakdown by End-Use (COVID-19 Impact V, W, U, L Shaped Recovery Analysis)
10. Company Profiles
10.1 Ambuja Cements Limited Company
10.1.1 Company Information
10.1.2 Company Overview
10.1.3 Company Financial Profile
10.1.4 Company Product Offerings
10.1.5 Company Recent Developments
10.2 Bridgestone Corporation Company
10.2.1 Company Information
10.2.2 Company Overview
10.2.3 Company Financial Profile
10.2.4 Company Product Offerings
10.2.5 Company Recent Developments
10.3 Cemex SAB de CV Company
10.3.1 Company Information
10.3.2 Company Overview
10.3.3 Company Financial Profile
10.3.4 Company Product Offerings
10.3.5 Company Recent Developments
10.4 Columbus McKinnon Corp. Company
10.4.1 Company Information
10.4.2 Company Overview
10.4.3 Company Financial Profile
10.4.4 Company Product Offerings
10.5 Continental AG Company
10.5.1 Company Information
10.5.2 Company Overview
10.5.3 Company Financial Profile
10.5.4 Company Product Offerings
10.5.5 Company Recent Developments
10.6 CRH PLC Building Material Company
10.6.1 Company Information
10.6.2 Company Overview
10.6.3 Company Financial Profile
10.6.4 Company Product Offerings
10.6.5 Company Recent Developments
10.7 Heidelberg Cement Company
10.7.1 Company Information
10.7.2 Company Overview
10.7.3 Company Financial Profile
10.7.4 Company Product Offerings
10.7.5 Company Recent Developments
10.8 LafargeHolcim Ltd Company
10.8.1 Company Information
10.8.2 Company Overview
10.8.3 Company Financial Profile
10.8.4 Company Product Offerings
10.8.5 Company Recent Developments
10.9 Michelin Manufacturing Company
10.9.1 Company Information
10.9.2 Company Overview
10.9.3 Company Financial Profile
10.9.4 Company Product Offerings
10.9.5 Company Recent Developments
10.10 Toyo Tire Corporation Company
10.10.1 Company Information
10.10.2 Company Overview
10.10.3 Company Financial Profile
10.10.4 Company Product Offerings
10.10.5 Company Recent Developments
10.11 UltraTech Cement Limited Company
10.11.1 Company Information
10.11.2 Company Overview
10.11.3 Company Financial Profile
10.11.4 Company Product Offerings
10.11.5 Company Recent Developments
10.12 Entergy Corporation Company
10.12.1 Company Information
10.12.2 Company Overview
10.12.3 Company Financial Profile
10.12.4 Company Product Offerings
10.12.5 Company Recent Developments
10.13 The Goodyear Tire & Rubber Company
10.13.1 Company Information
10.13.2 Company Overview
10.13.3 Company Financial Profile
10.13.4 Company Product Offerings
10.13.5 Company Recent Developments
10.14 DN Tyre & Rubber PLC Company
10.14.1 Company Information
10.14.2 Company Overview
10.14.3 Company Financial Profile
10.14.4 Company Product Offerings
10.15 The Monarch Cement Company
10.15.1 Company Information
10.15.2 Company Overview
10.15.3 Company Financial Profile
10.15.4 Company Product Offerings
11. Conclusion and Recommendations
11.1 TDF Supplier Competition, Capabilities, and Priorities
12. Glossary
List of Figures
Figure 2.1 Global Tire-Derived Fuels Market by Value Forecast 2021-2031 (US$ million, AGR %)
Figure 2.1 Global Tire-Derived Fuels Value Chain Outlook
Figure 2.1 Global Tire-Derived Fuels Market by Value Forecast 2021-2031 (US$ million, AGR %)
Figure 2.1 Global Tire-Derived Fuels Market by Value Forecast 2021-2031 (US$ million, AGR %) (V-shape recovery)
Figure 2.1 Global Tire-Derived Fuels Market by Value Forecast 2021-2031 (US$ million, AGR %) (W-shape recovery)
Figure 2.1 Global Tire-Derived Fuels Market by Value Forecast 2021-2031 (US$ million, AGR %) (U-shape recovery)
Figure 2.1 Global Tire-Derived Fuels Market by Value Forecast 2021-2031 (US$ million, AGR %) (L-shape recovery)
Figure 2.1 Global Tire-Derived Fuels Market by Region Forecast 2021-2031 (US$ million, AGR %)
Figure 2.1 Global Tire-Derived Fuels Market by Region Forecast 2021-2031 (US$ million, AGR %) (V-shape recovery)
Figure 2.1 Global Tire-Derived Fuels Market by Region Forecast 2021-2031 (US$ million, AGR %) (W-shape recovery)
Figure 2.1 Global Tire-Derived Fuels Market by Region Forecast 2021-2031 (US$ million, AGR %) (U-shape recovery)
Figure 2.1 Global Tire-Derived Fuels Market by Region Forecast 2021-2031 (US$ million, AGR %) (L-shape recovery)
Figure 2.1 Global Tire-Derived Fuels Market by Raw Form Forecast 2021-2031 (US$ million, AGR %)
Figure 2.1 Global Tire-Derived Fuels Market by Raw Form Forecast 2021-2031 (US$ million, AGR %) (V-shape recovery)
Figure 2.1 Global Tire-Derived Fuels Market by Raw Form Forecast 2021-2031 (US$ million, AGR %) (W-shape recovery)
Figure 2.1 Global Tire-Derived Fuels Market by Raw Form Forecast 2021-2031 (US$ million, AGR %) (U-shape recovery)
Figure 2.1 Global Tire-Derived Fuels Market by Raw Form Forecast 2021-2031 (US$ million, AGR %) (L-shape recovery)
Figure 2.1 Global Tire-Derived Fuels Market by Source Forecast 2021-2031 (US$ million, AGR %)
Figure 2.1 Global Tire-Derived Fuels Market by Source Forecast 2021-2031 (US$ million, AGR %) (V-shape recovery)
Figure 2.1 Global Tire-Derived Fuels Market by Source Forecast 2021-2031 (US$ million, AGR %) (W-shape recovery)
Figure 2.1 Global Tire-Derived Fuels Market by Source Forecast 2021-2031 (US$ million, AGR %) (U-shape recovery)
Figure 2.1 Global Tire-Derived Fuels Market by Source Forecast 2021-2031 (US$ million, AGR %) (L-shape recovery)
Figure 2.1 Global Tire-Derived Fuels Market by End-User Forecast 2021-2031 (US$ million, AGR %)
Figure 2.1 Global Tire-Derived Fuels Market by End-User Forecast 2021-2031 (US$ million, AGR %) (V-shape recovery)
Figure 2.1 Global Tire-Derived Fuels Market by End-User Forecast 2021-2031 (US$ million, AGR %) (W-shape recovery)
Figure 2.1 Global Tire-Derived Fuels Market by End-User Forecast 2021-2031 (US$ million, AGR %) (U-shape recovery)
Figure 2.1 Global Tire-Derived Fuels Market by End-User Forecast 2021-2031 (US$ million, AGR %) (L-shape recovery)
Figure 2.1 North America Tire-Derived Fuels Market by Value Forecast 2021-2031 (US$ million, AGR %)
Figure 2.1 North America Tire-Derived Fuels Market by Value Forecast 2021-2031 (US$ million, AGR %) (V-shape recovery)
Figure 2.1 North America Tire-Derived Fuels Market by Value Forecast 2021-2031 (US$ million, AGR %) (W-shape recovery)
Figure 2.1 North America Tire-Derived Fuels Market by Value Forecast 2021-2031 (US$ million, AGR %) (U-shape recovery)
Figure 2.1 North America Tire-Derived Fuels Market by Value Forecast 2021-2031 (US$ million, AGR %) (L-shape recovery)
Figure 2.1 North America Tire-Derived Fuels Market by Country Forecast 2021-2031 (US$ million, AGR %)
Figure 2.1 North America Tire-Derived Fuels Market by Country Forecast 2021-2031 (US$ million, AGR %) (V-shape recovery)
Figure 2.1 North America Tire-Derived Fuels Market by Country Forecast 2021-2031 (US$ million, AGR %) (W-shape recovery)
Figure 2.1 North America Tire-Derived Fuels Market by Country Forecast 2021-2031 (US$ million, AGR %) (U-shape recovery)
Figure 2.1 North America Tire-Derived Fuels Market by Country Forecast 2021-2031 (US$ million, AGR %) (L-shape recovery)
Figure 2.1 North America Tire-Derived Fuels Market by Raw Form Forecast 2021-2031 (US$ million, AGR %)
Figure 2.1 North America Tire-Derived Fuels Market by Raw Form Forecast 2021-2031 (US$ million, AGR %) (V-shape recovery)
Figure 2.1 North America Tire-Derived Fuels Market by Raw Form Forecast 2021-2031 (US$ million, AGR %) (W-shape recovery)
Figure 2.1 North America Tire-Derived Fuels Market by Raw Form Forecast 2021-2031 (US$ million, AGR %) (U-shape recovery)
Figure 2.1 North America Tire-Derived Fuels Market by Raw Form Forecast 2021-2031 (US$ million, AGR %) (L-shape recovery)
Figure 2.1 North America Tire-Derived Fuels Market by Source Forecast 2021-2031 (US$ million, AGR %)
Figure 2.1 North America Tire-Derived Fuels Market by Source Forecast 2021-2031 (US$ million, AGR %) (V-shape recovery)
Figure 2.1 North America Tire-Derived Fuels Market by Source Forecast 2021-2031 (US$ million, AGR %) (W-shape recovery)
Figure 2.1 North America Tire-Derived Fuels Market by Source Forecast 2021-2031 (US$ million, AGR %) (U-shape recovery)
Figure 2.1 North America Tire-Derived Fuels Market by Source Forecast 2021-2031 (US$ million, AGR %) (L-shape recovery)
Figure 2.1 North America Tire-Derived Fuels Market by End-User Forecast 2021-2031 (US$ million, AGR %)
Figure 2.1 North America Tire-Derived Fuels Market by End-User Forecast 2021-2031 (US$ million, AGR %) (V-shape recovery)
Figure 2.1 North America Tire-Derived Fuels Market by End-User Forecast 2021-2031 (US$ million, AGR %) (W-shape recovery)
Figure 2.1 North America Tire-Derived Fuels Market by End-User Forecast 2021-2031 (US$ million, AGR %) (U-shape recovery)
Figure 2.1 North America Tire-Derived Fuels Market by End-User Forecast 2021-2031 (US$ million, AGR %) (L-shape recovery)
Figure 2.1 Europe Tire-Derived Fuels Market by Value Forecast 2021-2031 (US$ million, AGR %)
Figure 2.1 Europe Tire-Derived Fuels Market by Value Forecast 2021-2031 (US$ million, AGR %) (V-shape recovery)
Figure 2.1 Europe Tire-Derived Fuels Market by Value Forecast 2021-2031 (US$ million, AGR %) (W-shape recovery)
Figure 2.1 Europe Tire-Derived Fuels Market by Value Forecast 2021-2031 (US$ million, AGR %) (U-shape recovery)
Figure 2.1 Europe Tire-Derived Fuels Market by Value Forecast 2021-2031 (US$ million, AGR %) (L-shape recovery)
Figure 2.1 Europe Tire-Derived Fuels Market by Country Forecast 2021-2031 (US$ million, AGR %)
Figure 2.1 Europe Tire-Derived Fuels Market by Country Forecast 2021-2031 (US$ million, AGR %) (V-shape recovery)
Figure 2.1 Europe Tire-Derived Fuels Market by Country Forecast 2021-2031 (US$ million, AGR %) (W-shape recovery)
Figure 2.1 Europe Tire-Derived Fuels Market by Country Forecast 2021-2031 (US$ million, AGR %) (U-shape recovery)
Figure 2.1 Europe Tire-Derived Fuels Market by Country Forecast 2021-2031 (US$ million, AGR %) (L-shape recovery)
Figure 2.1 Europe Tire-Derived Fuels Market by Raw Form Forecast 2021-2031 (US$ million, AGR %)
Figure 2.1 Europe Tire-Derived Fuels Market by Raw Form Forecast 2021-2031 (US$ million, AGR %) (V-shape recovery)
Figure 2.1 Europe Tire-Derived Fuels Market by Raw Form Forecast 2021-2031 (US$ million, AGR %) (W-shape recovery)
Figure 2.1 Europe Tire-Derived Fuels Market by Raw Form Forecast 2021-2031 (US$ million, AGR %) (U-shape recovery)
Figure 2.1 Europe Tire-Derived Fuels Market by Raw Form Forecast 2021-2031 (US$ million, AGR %) (L-shape recovery)
Figure 2.1 Europe Tire-Derived Fuels Market by Source Forecast 2021-2031 (US$ million, AGR %)
Figure 2.1 Europe Tire-Derived Fuels Market by Source Forecast 2021-2031 (US$ million, AGR %) (V-shape recovery)
Figure 2.1 Europe Tire-Derived Fuels Market by Source Forecast 2021-2031 (US$ million, AGR %) (W-shape recovery)
Figure 2.1 Europe Tire-Derived Fuels Market by Source Forecast 2021-2031 (US$ million, AGR %) (U-shape recovery)
Figure 2.1 Europe Tire-Derived Fuels Market by Source Forecast 2021-2031 (US$ million, AGR %) (L-shape recovery)
Figure 2.1 Europe Tire-Derived Fuels Market by End-User Forecast 2021-2031 (US$ million, AGR %)
Figure 2.1 Europe Tire-Derived Fuels Market by End-User Forecast 2021-2031 (US$ million, AGR %) (V-shape recovery)
Figure 2.1 Europe Tire-Derived Fuels Market by End-User Forecast 2021-2031 (US$ million, AGR %) (W-shape recovery)
Figure 2.1 Europe Tire-Derived Fuels Market by End-User Forecast 2021-2031 (US$ million, AGR %) (U-shape recovery)
Figure 2.1 Europe Tire-Derived Fuels Market by End-User Forecast 2021-2031 (US$ million, AGR %) (L-shape recovery)
Figure 2.1 Asia-Pacific Tire-Derived Fuels Market by Value Forecast 2021-2031 (US$ million, AGR %)
Figure 2.1 Asia-Pacific Tire-Derived Fuels Market by Value Forecast 2021-2031 (US$ million, AGR %) (V-shape recovery)
Figure 2.1 Asia-Pacific Tire-Derived Fuels Market by Value Forecast 2021-2031 (US$ million, AGR %) (W-shape recovery)
Figure 2.1 Asia-Pacific Tire-Derived Fuels Market by Value Forecast 2021-2031 (US$ million, AGR %) (U-shape recovery)
Figure 2.1 Asia-Pacific Tire-Derived Fuels Market by Value Forecast 2021-2031 (US$ million, AGR %) (L-shape recovery)
Figure 2.1 Asia-Pacific Tire-Derived Fuels Market by Country Forecast 2021-2031 (US$ million, AGR %)
Figure 2.1 Asia-Pacific Tire-Derived Fuels Market by Country Forecast 2021-2031 (US$ million, AGR %) (V-shape recovery)
Figure 2.1 Asia-Pacific Tire-Derived Fuels Market by Country Forecast 2021-2031 (US$ million, AGR %) (W-shape recovery)
Figure 2.1 Asia-Pacific Tire-Derived Fuels Market by Country Forecast 2021-2031 (US$ million, AGR %) (U-shape recovery)
Figure 2.1 Asia-Pacific Tire-Derived Fuels Market by Country Forecast 2021-2031 (US$ million, AGR %) (L-shape recovery)
Figure 2.1 Asia-Pacific Tire-Derived Fuels Market by Raw Form Forecast 2021-2031 (US$ million, AGR %)
Figure 2.1 Asia-Pacific Tire-Derived Fuels Market by Raw Form Forecast 2021-2031 (US$ million, AGR %) (V-shape recovery)
Figure 2.1 Asia-Pacific Tire-Derived Fuels Market by Raw Form Forecast 2021-2031 (US$ million, AGR %) (W-shape recovery)
Figure 2.1 Asia-Pacific Tire-Derived Fuels Market by Raw Form Forecast 2021-2031 (US$ million, AGR %) (U-shape recovery)
Figure 2.1 Asia-Pacific Tire-Derived Fuels Market by Raw Form Forecast 2021-2031 (US$ million, AGR %) (L-shape recovery)
Figure 2.1 Asia-Pacific Tire-Derived Fuels Market by Source Forecast 2021-2031 (US$ million, AGR %)
Figure 2.1 Asia-Pacific Tire-Derived Fuels Market by Source Forecast 2021-2031 (US$ million, AGR %) (V-shape recovery)
Figure 2.1 Asia-Pacific Tire-Derived Fuels Market by Source Forecast 2021-2031 (US$ million, AGR %) (W-shape recovery)
Figure 2.1 Asia-Pacific Tire-Derived Fuels Market by Source Forecast 2021-2031 (US$ million, AGR %) (U-shape recovery)
Figure 2.1 Asia-Pacific Tire-Derived Fuels Market by Source Forecast 2021-2031 (US$ million, AGR %) (L-shape recovery)
Figure 2.1 Asia-Pacific Tire-Derived Fuels Market by End-User Forecast 2021-2031 (US$ million, AGR %)
Figure 2.1 Asia-Pacific Tire-Derived Fuels Market by End-User Forecast 2021-2031 (US$ million, AGR %) (V-shape recovery)
Figure 2.1 Asia-Pacific Tire-Derived Fuels Market by End-User Forecast 2021-2031 (US$ million, AGR %) (W-shape recovery)
Figure 2.1 Asia-Pacific Tire-Derived Fuels Market by End-User Forecast 2021-2031 (US$ million, AGR %) (U-shape recovery)
Figure 2.1 Asia-Pacific Tire-Derived Fuels Market by End-User Forecast 2021-2031 (US$ million, AGR %) (L-shape recovery)
Figure 2.1 LAMEA Tire-Derived Fuels Market by Value Forecast 2021-2031 (US$ million, AGR %)
Figure 2.1 LAMEA Tire-Derived Fuels Market by Value Forecast 2021-2031 (US$ million, AGR %) (V-shape recovery)
Figure 2.1 LAMEA Tire-Derived Fuels Market by Value Forecast 2021-2031 (US$ million, AGR %) (W-shape recovery)
Figure 2.1 LAMEA Tire-Derived Fuels Market by Value Forecast 2021-2031 (US$ million, AGR %) (U-shape recovery)
Figure 2.1 LAMEA Tire-Derived Fuels Market by Value Forecast 2021-2031 (US$ million, AGR %) (L-shape recovery)
Figure 2.1 LAMEA Tire-Derived Fuels Market by Country Forecast 2021-2031 (US$ million, AGR %)
Figure 2.1 LAMEA Tire-Derived Fuels Market by Country Forecast 2021-2031 (US$ million, AGR %) (V-shape recovery)
Figure 2.1 LAMEA Tire-Derived Fuels Market by Country Forecast 2021-2031 (US$ million, AGR %) (W-shape recovery)
Figure 2.1 LAMEA Tire-Derived Fuels Market by Country Forecast 2021-2031 (US$ million, AGR %) (U-shape recovery)
Figure 2.1 LAMEA Tire-Derived Fuels Market by Country Forecast 2021-2031 (US$ million, AGR %) (L-shape recovery)
Figure 2.1 LAMEA Tire-Derived Fuels Market by Raw Form Forecast 2021-2031 (US$ million, AGR %)
Figure 2.1 LAMEA Tire-Derived Fuels Market by Raw Form Forecast 2021-2031 (US$ million, AGR %) (V-shape recovery)
Figure 2.1 LAMEA Tire-Derived Fuels Market by Raw Form Forecast 2021-2031 (US$ million, AGR %) (W-shape recovery)
Figure 2.1 LAMEA Tire-Derived Fuels Market by Raw Form Forecast 2021-2031 (US$ million, AGR %) (U-shape recovery)
Figure 2.1 LAMEA Tire-Derived Fuels Market by Raw Form Forecast 2021-2031 (US$ million, AGR %) (L-shape recovery)
Figure 2.1 LAMEA Tire-Derived Fuels Market by Source Forecast 2021-2031 (US$ million, AGR %)
Figure 2.1 LAMEA Tire-Derived Fuels Market by Source Forecast 2021-2031 (US$ million, AGR %) (V-shape recovery)
Figure 2.1 LAMEA Tire-Derived Fuels Market by Source Forecast 2021-2031 (US$ million, AGR %) (W-shape recovery)
Figure 2.1 LAMEA Tire-Derived Fuels Market by Source Forecast 2021-2031 (US$ million, AGR %) (U-shape recovery)
Figure 2.1 LAMEA Tire-Derived Fuels Market by Source Forecast 2021-2031 (US$ million, AGR %) (L-shape recovery)
Figure 2.1 LAMEA Tire-Derived Fuels Market by End-User Forecast 2021-2031 (US$ million, AGR %)
Figure 2.1 LAMEA Tire-Derived Fuels Market by End-User Forecast 2021-2031 (US$ million, AGR %) (V-shape recovery)
Figure 2.1 LAMEA Tire-Derived Fuels Market by End-User Forecast 2021-2031 (US$ million, AGR %) (W-shape recovery)
Figure 2.1 LAMEA Tire-Derived Fuels Market by End-User Forecast 2021-2031 (US$ million, AGR %) (U-shape recovery)
Figure 2.1 LAMEA Tire-Derived Fuels Market by End-User Forecast 2021-2031 (US$ million, AGR %) (L-shape recovery)
Figure 10.1 Ambuja Cements Limited Company: Company Revenue 2015-2019 (US$ Mn, AGR %)
Figure 10.2 Ambuja Cements Limited Company: Company Operating Income 2015-2019 (US$Mn)
Figure 10.3 Ambuja Cements Limited Company: Company EBITDA 2015-2019 (US$Mn)
Figure 10.4 Ambuja Cements Limited Company: Company Net Income/Loss 2015-2019 (US$Mn)
Figure 10.5 Bridgestone Corporation: Company Revenue 2015-2019 (US$ Mn, AGR %)
Figure 10.6 Bridgestone Corporation: Company Operating Income 2015-2019 (US$Mn)
Figure 10.7 Bridgestone Corporation: Company EBITDA 2015-2019 (US$Mn)
Figure 10.8 Bridgestone Corporation: Company Net Income/Loss 2015-2019 (US$Mn)
Figure 10.9 Cemex SAB de CV: Company Revenue 2015-2019 (US$ Mn, AGR %)
Figure 10.10 Cemex SAB de CV: Company Operating Income 2015-2019 (US$Mn)
Figure 10.11 Cemex SAB de CV: Company EBITDA 2015-2019 (US$Mn)
Figure 10.12 Cemex SAB de CV: Company Net Income/Loss 2015-2019 (US$Mn)
Figure 10.13 Columbus McKinnon Corporation: Company Revenue 2015-2019 (US$ Mn, AGR %)
Figure 10.14 Columbus McKinnon Corporation: Company Operating Income 2015-2019 (US$Mn)
Figure 10.15 Columbus McKinnon Corporation: Company EBITDA 2015-2019 (US$Mn)
Figure 10.16 Columbus McKinnon Corporation: Company Net Income/Loss 2015-2019 (US$Mn)
Figure 10.17 Continental AG: Company Revenue 2015-2019 (US$ Mn, AGR %)
Figure 10.18 Continental AG: Company Operating Income 2015-2019 (US$Mn)
Figure 10.19 Continental AG: Company EBITDA 2015-2019 (US$Mn)
Figure 10.20 Continental AG: Company Net Income/Loss 2015-2019 (US$Mn)
Figure 10.21 CRH PLC: Company Revenue 2015-2019 (US$ Mn, AGR %)
Figure 10.22 CRH PLC: Company Operating Income 2015-2019 (US$Mn)
Figure 10.23 CRH PLC: Company EBITDA 2015-2019 (US$Mn)
Figure 10.24 CRH PLC: Company Net Income/Loss 2015-2019 (US$Mn)
Figure 10.25 Heidelberg Cement: Company Revenue 2015-2019 (US$ Mn, AGR %)
Figure 10.26 Heidelberg Cement: Company Operating Income 2015-2019 (US$Mn)
Figure 10.27 Heidelberg Cement: Company EBITDA 2015-2019 (US$Mn)
Figure 10.28 Heidelberg Cement: Company Net Income/Loss 2015-2019 (US$Mn)
Figure 10.29 LafargeHolcim Ltd: Company Revenue 2015-2019 (US$ Mn, AGR %)
Figure 2.1 LafargeHolcim Ltd: Company Operating Income 2015-2019 (US$Mn)
Figure 10.31 LafargeHolcim Ltd: Company EBITDA 2015-2019 (US$Mn)
Figure 10.32 LafargeHolcim Ltd: Company Net Income/Loss 2015-2019 (US$Mn)
Figure 10.33 Michelin Manufacturing company: Company Revenue 2015-2019 (US$ Mn, AGR %)
Figure 2.1 Michelin Manufacturing company: Company Operating Income 2015-2019 (US$Mn)
Figure 10.35 Michelin Manufacturing company: Company EBITDA 2015-2019 (US$Mn)
Figure 10.36 Michelin Manufacturing company: Company Net Income/Loss 2015-2019 (US$Mn)
Figure 10.37 Toyo Tire Corporation: Company Revenue 2015-2019 (US$ Mn, AGR %)
Figure 10.38 Toyo Tire Corporation: Company Operating Income 2015-2019 (US$Mn)
Figure 10.39 Toyo Tire Corporation: Company EBITDA 2015-2019 (US$Mn)
Figure 10.40 Toyo Tire Corporation: Company Net Income/Loss 2015-2019 (US$Mn)
Figure 10.41 UltraTech Cement Limited: Company Revenue 2015-2019 (US$ Mn, AGR %)
Figure 10.42 UltraTech Cement Limited: Company Operating Income 2015-2019 (US$Mn)
Figure 10.43 UltraTech Cement Limited: Company EBITDA 2015-2019 (US$Mn)
Figure 10.44 UltraTech Cement Limited: Company Net Income/Loss 2015-2019 (US$Mn)
Figure 10.45 Entergy Corporation: Company Revenue 2015-2019 (US$ Mn, AGR %)
Figure 10.46 Entergy Corporation: Company Operating Income 2015-2019 (US$Mn)
Figure 10.47 Entergy Corporation: Company EBITDA 2015-2019 (US$Mn)
Figure 10.48 Entergy Corporation: Company Net Income/Loss 2015-2019 (US$Mn)
Figure 10.49 The Goodyear Tire & Rubber: Company Revenue 2015-2019 (US$ Mn, AGR %)
Figure 10.50 The Goodyear Tire & Rubber: Company Operating Income 2015-2019 (US$Mn)
Figure 10.51 The Goodyear Tire & Rubber: Company EBITDA 2015-2019 (US$Mn)
Figure 10.52 The Goodyear Tire & Rubber: Company Net Income/Loss 2015-2019 (US$Mn)
Figure 10.53 DN Tyre & Rubber Plc: Company Revenue 2015-2019 (US$ Mn, AGR %)
Figure 10.54 DN Tyre & Rubber Plc: Company Operating Income 2015-2019 (US$Mn)
Figure 10.55 DN Tyre & Rubber Plc: Company EBITDA 2015-2019 (US$Mn)
Figure 10.56 DN Tyre & Rubber Plc: Company Net Income/Loss 2015-2019 (US$Mn)
Figure 10.57 The Monarch Cement Company: Company Revenue 2015-2019 (US$ Mn, AGR %)
Figure 10.58 The Monarch Cement Company: Company Operating Income 2015-2019 (US$Mn)
Figure 10.59 The Monarch Cement Company: Company EBITDA 2015-2019 (US$Mn)
Figure 10.60 The Monarch Cement Company: Company Net Income/Loss 2015-2019 (US$Mn)
List of Tables
Table 2.1 Global Tire-Derived Fuels Market by Value Forecast 2021-2031 (US$ million, AGR %, CAGR %)
Table 2.1 Global Tire Derived Fuels Market Summary Table
Table 2.1 Caloric Values of Tire-derived Fuel and Other Fuels (Kilojoules per Kilogram)
Table 2.1 Global Tire-Derived Fuels Market by Value Forecast 2021-2031 (US$ million, AGR %, CAGR %)
Table 2.1 Global Tire-Derived Fuels Market by Value Forecast 2021-2031 (US$ million, AGR %, CAGR %) (V-shape recovery)
Table 2.1 Global Tire-Derived Fuels Market by Value Forecast 2021-2031 (US$ million, AGR %, CAGR %) (W-shape recovery)
Table 2.1 Global Tire-Derived Fuels Market by Value Forecast 2021-2031 (US$ million, AGR %, CAGR %) (U-shape recovery)
Table 2.1 Global Tire-Derived Fuels Market by Value Forecast 2021-2031 (US$ million, AGR %, CAGR %) (L-shape recovery)
Table 2.1 Global Tire-Derived Fuels Market by Region Forecast 2021-2031 (US$ million, AGR %, CAGR %)
Table 2.1 Global Tire-Derived Fuels Market by Region Forecast 2021-2031 (US$ million, AGR %, CAGR %) (V-shape recovery)
Table 2.1 Global Tire-Derived Fuels Market by Region Forecast 2021-2031 (US$ million, AGR %, CAGR %) (W-shape recovery)
Table 2.1 Global Tire-Derived Fuels Market by Region Forecast 2021-2031 (US$ million, AGR %, CAGR %) (U-shape recovery)
Table 2.1 Global Tire-Derived Fuels Market by Region Forecast 2021-2031 (US$ million, AGR %, CAGR %) (L-shape recovery)
Table 2.1 Global Tire-Derived Fuels Market by Raw Form Forecast 2021-2031 (US$ million, AGR %, CAGR %)
Table 2.1 Global Tire-Derived Fuels Market by Raw Form Forecast 2021-2031 (US$ million, AGR %, CAGR %) (V-shape recovery)
Table 2.1 Global Tire-Derived Fuels Market by Raw Form Forecast 2021-2031 (US$ million, AGR %, CAGR %) (W-shape recovery)
Table 2.1 Global Tire-Derived Fuels Market by Raw Form Forecast 2021-2031 (US$ million, AGR %, CAGR %) (U-shape recovery)
Table 2.1 Global Tire-Derived Fuels Market by Raw Form Forecast 2021-2031 (US$ million, AGR %, CAGR %) (L-shape recovery)
Table 2.1 Global Tire-Derived Fuels Market by Source Forecast 2021-2031 (US$ million, AGR %, CAGR %)
Table 2.1 Global Tire-Derived Fuels Market by Source Forecast 2021-2031 (US$ million, AGR %, CAGR %) (V-shape recovery)
Table 2.1 Global Tire-Derived Fuels Market by Source Forecast 2021-2031 (US$ million, AGR %, CAGR %) (W-shape recovery)
Table 2.1 Global Tire-Derived Fuels Market by Source Forecast 2021-2031 (US$ million, AGR %, CAGR %) (U-shape recovery)
Table 2.1 Global Tire-Derived Fuels Market by Source Forecast 2021-2031 (US$ million, AGR %, CAGR %) (L-shape recovery)
Table 2.1 Global Tire-Derived Fuels Market by End-User Forecast 2021-2031 (US$ million, AGR %, CAGR %)
Table 2.1 Global Tire-Derived Fuels Market by End-User Forecast 2021-2031 (US$ million, AGR %, CAGR %) (V-shape recovery)
Table 2.1 Global Tire-Derived Fuels Market by End-User Forecast 2021-2031 (US$ million, AGR %, CAGR %) (W-shape recovery)
Table 2.1 Global Tire-Derived Fuels Market by End-User Forecast 2021-2031 (US$ million, AGR %, CAGR %) (U-shape recovery)
Table 2.1 Global Tire-Derived Fuels Market by End-User Forecast 2021-2031 (US$ million, AGR %, CAGR %) (L-shape recovery)
Table 2.1 North America Tire-Derived Fuels Market by Value Forecast 2021-2031 (US$ million, AGR %, CAGR %)
Table 2.1 North America Tire-Derived Fuels Market by Value Forecast 2021-2031 (US$ million, AGR %, CAGR %) (V-shape recovery)
Table 2.1 North America Tire-Derived Fuels Market by Value Forecast 2021-2031 (US$ million, AGR %, CAGR %) (W-shape recovery)
Table 2.1 North America Tire-Derived Fuels Market by Value Forecast 2021-2031 (US$ million, AGR %, CAGR %) (U-shape recovery)
Table 2.1 North America Tire-Derived Fuels Market by Value Forecast 2021-2031 (US$ million, AGR %, CAGR %) (L-shape recovery)
Table 2.1 US Tire-Derived Fuels Market by Value Forecast 2021-2031 (US$ million, AGR %, CAGR %)
Table 2.1 US Tire-Derived Fuels Market by Value Forecast 2021-2031 (US$ million, AGR %, CAGR %) (V-shape recovery)
Table 2.1 US Tire-Derived Fuels Market by Value Forecast 2021-2031 (US$ million, AGR %, CAGR %) (W-shape recovery)
Table 2.1 US Tire-Derived Fuels Market by Value Forecast 2021-2031 (US$ million, AGR %, CAGR %) (U-shape recovery)
Table 2.1 US Tire-Derived Fuels Market by Value Forecast 2021-2031 (US$ million, AGR %, CAGR %) (L-shape recovery)
Table 2.1 Canada Tire-Derived Fuels Market by Value Forecast 2021-2031 (US$ million, AGR %, CAGR %)
Table 2.1 Canada Tire-Derived Fuels Market by Value Forecast 2021-2031 (US$ million, AGR %, CAGR %) (V-shape recovery)
Table 2.1 Canada Tire-Derived Fuels Market by Value Forecast 2021-2031 (US$ million, AGR %, CAGR %) (W-shape recovery)
Table 2.1 Canada Tire-Derived Fuels Market by Value Forecast 2021-2031 (US$ million, AGR %, CAGR %) (U-shape recovery)
Table 2.1 Canada Tire-Derived Fuels Market by Value Forecast 2021-2031 (US$ million, AGR %, CAGR %) (L-shape recovery)
Table 2.1 North America Tire-Derived Fuels Market by Raw Form Forecast 2021-2031 (US$ million, AGR %, CAGR %)
Table 2.1 North America Tire-Derived Fuels Market by Raw Form Forecast 2021-2031 (US$ million, AGR %, CAGR %) (V-shape recovery)
Table 2.1 North America Tire-Derived Fuels Market by Raw Form Forecast 2021-2031 (US$ million, AGR %, CAGR %) (W-shape recovery)
Table 2.1 North America Tire-Derived Fuels Market by Raw Form Forecast 2021-2031 (US$ million, AGR %, CAGR %) (U-shape recovery)
Table 2.1 North America Tire-Derived Fuels Market by Raw Form Forecast 2021-2031 (US$ million, AGR %, CAGR %) (L-shape recovery)
Table 2.1 North America Tire-Derived Fuels Market by Source Forecast 2021-2031 (US$ million, AGR %, CAGR %)
Table 2.1 North America Tire-Derived Fuels Market by Source Forecast 2021-2031 (US$ million, AGR %, CAGR %) (V-shape recovery)
Table 2.1 North America Tire-Derived Fuels Market by Source Forecast 2021-2031 (US$ million, AGR %, CAGR %) (W-shape recovery)
Table 2.1 North America Tire-Derived Fuels Market by Source Forecast 2021-2031 (US$ million, AGR %, CAGR %) (U-shape recovery)
Table 2.1 North America Tire-Derived Fuels Market by Source Forecast 2021-2031 (US$ million, AGR %, CAGR %) (L-shape recovery)
Table 2.1 North America Tire-Derived Fuels Market by End-User Forecast 2021-2031 (US$ million, AGR %, CAGR %)
Table 2.1 North America Tire-Derived Fuels Market by End-User Forecast 2021-2031 (US$ million, AGR %, CAGR %) (V-shape recovery)
Table 2.1 North America Tire-Derived Fuels Market by End-User Forecast 2021-2031 (US$ million, AGR %, CAGR %) (W-shape recovery)
Table 2.1 North America Tire-Derived Fuels Market by End-User Forecast 2021-2031 (US$ million, AGR %, CAGR %) (U-shape recovery)
Table 2.1 North America Tire-Derived Fuels Market by End-User Forecast 2021-2031 (US$ million, AGR %, CAGR %) (L-shape recovery)
Table 2.1 Europe Tire-Derived Fuels Market by Value Forecast 2021-2031 (US$ million, AGR %, CAGR %)
Table 2.1 Europe Tire-Derived Fuels Market by Value Forecast 2021-2031 (US$ million, AGR %, CAGR %) (V-shape recovery)
Table 2.1 Europe Tire-Derived Fuels Market by Value Forecast 2021-2031 (US$ million, AGR %, CAGR %) (W-shape recovery)
Table 2.1 Europe Tire-Derived Fuels Market by Value Forecast 2021-2031 (US$ million, AGR %, CAGR %) (U-shape recovery)
Table 2.1 Europe Tire-Derived Fuels Market by Value Forecast 2021-2031 (US$ million, AGR %, CAGR %) (L-shape recovery)
Table 2.1 Russia Tire-Derived Fuels Market by Value Forecast 2021-2031 (US$ million, AGR %, CAGR %)
Table 2.1 Russia Tire-Derived Fuels Market by Value Forecast 2021-2031 (US$ million, AGR %, CAGR %) (V-shape recovery)
Table 2.1 Russia Tire-Derived Fuels Market by Value Forecast 2021-2031 (US$ million, AGR %, CAGR %) (W-shape recovery)
Table 2.1 Russia Tire-Derived Fuels Market by Value Forecast 2021-2031 (US$ million, AGR %, CAGR %) (U-shape recovery)
Table 2.1 Russia Tire-Derived Fuels Market by Value Forecast 2021-2031 (US$ million, AGR %, CAGR %) (L-shape recovery)
Table 2.1 Germany Tire-Derived Fuels Market by Value Forecast 2021-2031 (US$ million, AGR %, CAGR %)
Table 2.1 Germany Tire-Derived Fuels Market by Value Forecast 2021-2031 (US$ million, AGR %, CAGR %) (V-shape recovery)
Table 2.1 Germany Tire-Derived Fuels Market by Value Forecast 2021-2031 (US$ million, AGR %, CAGR %) (W-shape recovery)
Table 2.1 Germany Tire-Derived Fuels Market by Value Forecast 2021-2031 (US$ million, AGR %, CAGR %) (U-shape recovery)
Table 2.1 Germany Tire-Derived Fuels Market by Value Forecast 2021-2031 (US$ million, AGR %, CAGR %) (L-shape recovery)
Table 2.1 France Tire-Derived Fuels Market by Value Forecast 2021-2031 (US$ million, AGR %, CAGR %)
Table 2.1 France Tire-Derived Fuels Market by Value Forecast 2021-2031 (US$ million, AGR %, CAGR %) (V-shape recovery)
Table 2.1 France Tire-Derived Fuels Market by Value Forecast 2021-2031 (US$ million, AGR %, CAGR %) (W-shape recovery)
Table 2.1 France Tire-Derived Fuels Market by Value Forecast 2021-2031 (US$ million, AGR %, CAGR %) (U-shape recovery)
Table 2.1 France Tire-Derived Fuels Market by Value Forecast 2021-2031 (US$ million, AGR %, CAGR %) (L-shape recovery)
Table 2.1 UK Tire-Derived Fuels Market by Value Forecast 2021-2031 (US$ million, AGR %, CAGR %)
Table 2.1 UK Tire-Derived Fuels Market by Value Forecast 2021-2031 (US$ million, AGR %, CAGR %) (V-shape recovery)
Table 2.1 UK Tire-Derived Fuels Market by Value Forecast 2021-2031 (US$ million, AGR %, CAGR %) (W-shape recovery)
Table 2.1 UK Tire-Derived Fuels Market by Value Forecast 2021-2031 (US$ million, AGR %, CAGR %) (U-shape recovery)
Table 2.1 UK Tire-Derived Fuels Market by Value Forecast 2021-2031 (US$ million, AGR %, CAGR %) (L-shape recovery)
Table 2.1 Italy Tire-Derived Fuels Market by Value Forecast 2021-2031 (US$ million, AGR %, CAGR %)
Table 2.1 Italy Tire-Derived Fuels Market by Value Forecast 2021-2031 (US$ million, AGR %, CAGR %) (V-shape recovery)
Table 2.1 Italy Tire-Derived Fuels Market by Value Forecast 2021-2031 (US$ million, AGR %, CAGR %) (W-shape recovery)
Table 2.1 Italy Tire-Derived Fuels Market by Value Forecast 2021-2031 (US$ million, AGR %, CAGR %) (U-shape recovery)
Table 2.1 Italy Tire-Derived Fuels Market by Value Forecast 2021-2031 (US$ million, AGR %, CAGR %) (L-shape recovery)
Table 2.1 Rest of Europe Tire-Derived Fuels Market by Value Forecast 2021-2031 (US$ million, AGR %, CAGR %)
Table 2.1 Rest of Europe Tire-Derived Fuels Market by Value Forecast 2021-2031 (US$ million, AGR %, CAGR %) (V-shape recovery)
Table 2.1 Rest of Europe Tire-Derived Fuels Market by Value Forecast 2021-2031 (US$ million, AGR %, CAGR %) (W-shape recovery)
Table 2.1 Rest of Europe Tire-Derived Fuels Market by Value Forecast 2021-2031 (US$ million, AGR %, CAGR %) (U-shape recovery)
Table 2.1 Rest of Europe Tire-Derived Fuels Market by Value Forecast 2021-2031 (US$ million, AGR %, CAGR %) (L-shape recovery)
Table 2.1 Europe Tire-Derived Fuels Market by Raw Form Forecast 2021-2031 (US$ million, AGR %, CAGR %)
Table 2.1 Europe Tire-Derived Fuels Market by Raw Form Forecast 2021-2031 (US$ million, AGR %, CAGR %) (V-shape recovery)
Table 2.1 Europe Tire-Derived Fuels Market by Raw Form Forecast 2021-2031 (US$ million, AGR %, CAGR %) (W-shape recovery)
Table 2.1 Europe Tire-Derived Fuels Market by Raw Form Forecast 2021-2031 (US$ million, AGR %, CAGR %) (U-shape recovery)
Table 2.1 Europe Tire-Derived Fuels Market by Raw Form Forecast 2021-2031 (US$ million, AGR %, CAGR %) (L-shape recovery)
Table 2.1 Europe Tire-Derived Fuels Market by Source Forecast 2021-2031 (US$ million, AGR %, CAGR %)
Table 2.1 Europe Tire-Derived Fuels Market by Source Forecast 2021-2031 (US$ million, AGR %, CAGR %) (V-shape recovery)
Table 2.1 Europe Tire-Derived Fuels Market by Source Forecast 2021-2031 (US$ million, AGR %, CAGR %) (W-shape recovery)
Table 2.1 Europe Tire-Derived Fuels Market by Source Forecast 2021-2031 (US$ million, AGR %, CAGR %) (U-shape recovery)
Table 2.1 Europe Tire-Derived Fuels Market by Source Forecast 2021-2031 (US$ million, AGR %, CAGR %) (L-shape recovery)
Table 2.1 Europe Tire-Derived Fuels Market by End-User Forecast 2021-2031 (US$ million, AGR %, CAGR %)
Table 2.1 Europe Tire-Derived Fuels Market by End-User Forecast 2021-2031 (US$ million, AGR %, CAGR %) (V-shape recovery)
Table 2.1 Europe Tire-Derived Fuels Market by End-User Forecast 2021-2031 (US$ million, AGR %, CAGR %) (W-shape recovery)
Table 2.1 Europe Tire-Derived Fuels Market by End-User Forecast 2021-2031 (US$ million, AGR %, CAGR %) (U-shape recovery)
Table 2.1 Europe Tire-Derived Fuels Market by End-User Forecast 2021-2031 (US$ million, AGR %, CAGR %) (L-shape recovery)
Table 2.1 Asia-Pacific Tire-Derived Fuels Market by Value Forecast 2021-2031 (US$ million, AGR %, CAGR %)
Table 2.1 Asia-Pacific Tire-Derived Fuels Market by Value Forecast 2021-2031 (US$ million, AGR %, CAGR %) (V-shape recovery)
Table 2.1 Asia-Pacific Tire-Derived Fuels Market by Value Forecast 2021-2031 (US$ million, AGR %, CAGR %) (W-shape recovery)
Table 2.1 Asia-Pacific Tire-Derived Fuels Market by Value Forecast 2021-2031 (US$ million, AGR %, CAGR %) (U-shape recovery)
Table 2.1 Asia-Pacific Tire-Derived Fuels Market by Value Forecast 2021-2031 (US$ million, AGR %, CAGR %) (L-shape recovery)
Table 2.1 China Tire-Derived Fuels Market by Value Forecast 2021-2031 (US$ million, AGR %, CAGR %)
Table 2.1 China Tire-Derived Fuels Market by Value Forecast 2021-2031 (US$ million, AGR %, CAGR %) (V-shape recovery)
Table 2.1 China Tire-Derived Fuels Market by Value Forecast 2021-2031 (US$ million, AGR %, CAGR %) (W-shape recovery)
Table 2.1 China Tire-Derived Fuels Market by Value Forecast 2021-2031 (US$ million, AGR %, CAGR %) (U-shape recovery)
Table 2.1 China Tire-Derived Fuels Market by Value Forecast 2021-2031 (US$ million, AGR %, CAGR %) (L-shape recovery)
Table 2.1 India Tire-Derived Fuels Market by Value Forecast 2021-2031 (US$ million, AGR %, CAGR %)
Table 2.1 India Tire-Derived Fuels Market by Value Forecast 2021-2031 (US$ million, AGR %, CAGR %) (V-shape recovery)
Table 2.1 India Tire-Derived Fuels Market by Value Forecast 2021-2031 (US$ million, AGR %, CAGR %) (W-shape recovery)
Table 2.1 India Tire-Derived Fuels Market by Value Forecast 2021-2031 (US$ million, AGR %, CAGR %) (U-shape recovery)
Table 2.1 India Tire-Derived Fuels Market by Value Forecast 2021-2031 (US$ million, AGR %, CAGR %) (L-shape recovery)
Table 2.1 Japan Tire-Derived Fuels Market by Value Forecast 2021-2031 (US$ million, AGR %, CAGR %)
Table 2.1 Japan Tire-Derived Fuels Market by Value Forecast 2021-2031 (US$ million, AGR %, CAGR %) (V-shape recovery)
Table 2.1 Japan Tire-Derived Fuels Market by Value Forecast 2021-2031 (US$ million, AGR %, CAGR %) (W-shape recovery)
Table 2.1 Japan Tire-Derived Fuels Market by Value Forecast 2021-2031 (US$ million, AGR %, CAGR %) (U-shape recovery)
Table 2.1 Japan Tire-Derived Fuels Market by Value Forecast 2021-2031 (US$ million, AGR %, CAGR %) (L-shape recovery)
Table 2.1 Australia Tire-Derived Fuels Market by Value Forecast 2021-2031 (US$ million, AGR %, CAGR %)
Table 2.1 Australia Tire-Derived Fuels Market by Value Forecast 2021-2031 (US$ million, AGR %, CAGR %) (V-shape recovery)
Table 2.1 Australia Tire-Derived Fuels Market by Value Forecast 2021-2031 (US$ million, AGR %, CAGR %) (W-shape recovery)
Table 2.1 Australia Tire-Derived Fuels Market by Value Forecast 2021-2031 (US$ million, AGR %, CAGR %) (U-shape recovery)
Table 2.1 Australia Tire-Derived Fuels Market by Value Forecast 2021-2031 (US$ million, AGR %, CAGR %) (L-shape recovery)
Table 2.1 Korea Tire-Derived Fuels Market by Value Forecast 2021-2031 (US$ million, AGR %, CAGR %)
Table 2.1 Korea Tire-Derived Fuels Market by Value Forecast 2021-2031 (US$ million, AGR %, CAGR %) (V-shape recovery)
Table 2.1 Korea Tire-Derived Fuels Market by Value Forecast 2021-2031 (US$ million, AGR %, CAGR %) (W-shape recovery)
Table 2.1 Korea Tire-Derived Fuels Market by Value Forecast 2021-2031 (US$ million, AGR %, CAGR %) (U-shape recovery)
Table 2.1 Korea Tire-Derived Fuels Market by Value Forecast 2021-2031 (US$ million, AGR %, CAGR %) (L-shape recovery)
Table 2.1 Rest of Asia-Pacific Tire-Derived Fuels Market by Value Forecast 2021-2031 (US$ million, AGR %, CAGR %)
Table 2.1 Rest of Asia-Pacific Tire-Derived Fuels Market by Value Forecast 2021-2031 (US$ million, AGR %, CAGR %) (V-shape recovery)
Table 2.1 Rest of Asia-Pacific Tire-Derived Fuels Market by Value Forecast 2021-2031 (US$ million, AGR %, CAGR %) (W-shape recovery)
Table 2.1 Rest of Asia-Pacific Tire-Derived Fuels Market by Value Forecast 2021-2031 (US$ million, AGR %, CAGR %) (U-shape recovery)
Table 2.1 Rest of Asia-Pacific Tire-Derived Fuels Market by Value Forecast 2021-2031 (US$ million, AGR %, CAGR %) (L-shape recovery)
Table 2.1 Asia-Pacific Tire-Derived Fuels Market by Raw Form Forecast 2021-2031 (US$ million, AGR %, CAGR %)
Table 2.1 Asia-Pacific Tire-Derived Fuels Market by Raw Form Forecast 2021-2031 (US$ million, AGR %, CAGR %) (V-shape recovery)
Table 2.1 Asia-Pacific Tire-Derived Fuels Market by Raw Form Forecast 2021-2031 (US$ million, AGR %, CAGR %) (W-shape recovery)
Table 2.1 Asia-Pacific Tire-Derived Fuels Market by Raw Form Forecast 2021-2031 (US$ million, AGR %, CAGR %) (U-shape recovery)
Table 2.1 Asia-Pacific Tire-Derived Fuels Market by Raw Form Forecast 2021-2031 (US$ million, AGR %, CAGR %) (L-shape recovery)
Table 2.1 Asia-Pacific Tire-Derived Fuels Market by Source Forecast 2021-2031 (US$ million, AGR %, CAGR %)
Table 2.1 Asia-Pacific Tire-Derived Fuels Market by Source Forecast 2021-2031 (US$ million, AGR %, CAGR %) (V-shape recovery)
Table 2.1 Asia-Pacific Tire-Derived Fuels Market by Source Forecast 2021-2031 (US$ million, AGR %, CAGR %) (W-shape recovery)
Table 2.1 Asia-Pacific Tire-Derived Fuels Market by Source Forecast 2021-2031 (US$ million, AGR %, CAGR %) (U-shape recovery)
Table 2.1 Asia-Pacific Tire-Derived Fuels Market by Source Forecast 2021-2031 (US$ million, AGR %, CAGR %) (L-shape recovery)
Table 2.1 Asia-Pacific Tire-Derived Fuels Market by End-User Forecast 2021-2031 (US$ million, AGR %, CAGR %)
Table 2.1 Asia-Pacific Tire-Derived Fuels Market by End-User Forecast 2021-2031 (US$ million, AGR %, CAGR %) (V-shape recovery)
Table 2.1 Asia-Pacific Tire-Derived Fuels Market by End-User Forecast 2021-2031 (US$ million, AGR %, CAGR %) (W-shape recovery)
Table 2.1 Asia-Pacific Tire-Derived Fuels Market by End-User Forecast 2021-2031 (US$ million, AGR %, CAGR %) (U-shape recovery)
Table 2.1 Asia-Pacific Tire-Derived Fuels Market by End-User Forecast 2021-2031 (US$ million, AGR %, CAGR %) (L-shape recovery)
Table 2.1 LAMEA Tire-Derived Fuels Market by Value Forecast 2021-2031 (US$ million, AGR %, CAGR %)
Table 2.1 LAMEA Tire-Derived Fuels Market by Value Forecast 2021-2031 (US$ million, AGR %, CAGR %) (V-shape recovery)
Table 2.1 LAMEA Tire-Derived Fuels Market by Value Forecast 2021-2031 (US$ million, AGR %, CAGR %) (W-shape recovery)
Table 2.1 LAMEA Tire-Derived Fuels Market by Value Forecast 2021-2031 (US$ million, AGR %, CAGR %) (U-shape recovery)
Table 2.1 LAMEA Tire-Derived Fuels Market by Value Forecast 2021-2031 (US$ million, AGR %, CAGR %) (L-shape recovery)
Table 2.1 Brazil Tire-Derived Fuels Market by Value Forecast 2021-2031 (US$ million, AGR %, CAGR %)
Table 2.1 Brazil Tire-Derived Fuels Market by Value Forecast 2021-2031 (US$ million, AGR %, CAGR %) (V-shape recovery)
Table 2.1 Brazil Tire-Derived Fuels Market by Value Forecast 2021-2031 (US$ million, AGR %, CAGR %) (W-shape recovery)
Table 2.1 Brazil Tire-Derived Fuels Market by Value Forecast 2021-2031 (US$ million, AGR %, CAGR %) (U-shape recovery)
Table 2.1 Brazil Tire-Derived Fuels Market by Value Forecast 2021-2031 (US$ million, AGR %, CAGR %) (L-shape recovery)
Table 2.1 Saudi Arabia Tire-Derived Fuels Market by Value Forecast 2021-2031 (US$ million, AGR %, CAGR %)
Table 2.1 Saudi Arabia Tire-Derived Fuels Market by Value Forecast 2021-2031 (US$ million, AGR %, CAGR %) (V-shape recovery)
Table 2.1 Saudi Arabia Tire-Derived Fuels Market by Value Forecast 2021-2031 (US$ million, AGR %, CAGR %) (W-shape recovery)
Table 2.1 Saudi Arabia Tire-Derived Fuels Market by Value Forecast 2021-2031 (US$ million, AGR %, CAGR %) (U-shape recovery)
Table 2.1 Saudi Arabia Tire-Derived Fuels Market by Value Forecast 2021-2031 (US$ million, AGR %, CAGR %) (L-shape recovery)
Table 2.1 South Africa Tire-Derived Fuels Market by Value Forecast 2021-2031 (US$ million, AGR %, CAGR %)
Table 2.1 South Africa Tire-Derived Fuels Market by Value Forecast 2021-2031 (US$ million, AGR %, CAGR %) (V-shape recovery)
Table 2.1 South Africa Tire-Derived Fuels Market by Value Forecast 2021-2031 (US$ million, AGR %, CAGR %) (W-shape recovery)
Table 2.1 South Africa Tire-Derived Fuels Market by Value Forecast 2021-2031 (US$ million, AGR %, CAGR %) (U-shape recovery)
Table 2.1 South Africa Tire-Derived Fuels Market by Value Forecast 2021-2031 (US$ million, AGR %, CAGR %) (L-shape recovery)
Table 2.1 Mexico Tire-Derived Fuels Market by Value Forecast 2021-2031 (US$ million, AGR %, CAGR %)
Table 2.1 Mexico Tire-Derived Fuels Market by Value Forecast 2021-2031 (US$ million, AGR %, CAGR %) (V-shape recovery)
Table 2.1 Mexico Tire-Derived Fuels Market by Value Forecast 2021-2031 (US$ million, AGR %, CAGR %) (W-shape recovery)
Table 2.1 Mexico Tire-Derived Fuels Market by Value Forecast 2021-2031 (US$ million, AGR %, CAGR %) (U-shape recovery)
Table 2.1 Mexico Tire-Derived Fuels Market by Value Forecast 2021-2031 (US$ million, AGR %, CAGR %) (L-shape recovery)
Table 2.1 UAE Tire-Derived Fuels Market by Value Forecast 2021-2031 (US$ million, AGR %, CAGR %)
Table 2.1 UAE Tire-Derived Fuels Market by Value Forecast 2021-2031 (US$ million, AGR %, CAGR %) (V-shape recovery)
Table 2.1 UAE Tire-Derived Fuels Market by Value Forecast 2021-2031 (US$ million, AGR %, CAGR %) (W-shape recovery)
Table 2.1 UAE Tire-Derived Fuels Market by Value Forecast 2021-2031 (US$ million, AGR %, CAGR %) (U-shape recovery)
Table 2.1 UAE Tire-Derived Fuels Market by Value Forecast 2021-2031 (US$ million, AGR %, CAGR %) (L-shape recovery)
Table 2.1 Rest of LAMEA Tire-Derived Fuels Market by Value Forecast 2021-2031 (US$ million, AGR %, CAGR %)
Table 2.1 Rest of LAMEA Tire-Derived Fuels Market by Value Forecast 2021-2031 (US$ million, AGR %, CAGR %) (V-shape recovery)
Table 2.1 Rest of LAMEA Tire-Derived Fuels Market by Value Forecast 2021-2031 (US$ million, AGR %, CAGR %) (W-shape recovery)
Table 2.1 Rest of LAMEA Tire-Derived Fuels Market by Value Forecast 2021-2031 (US$ million, AGR %, CAGR %) (U-shape recovery)
Table 2.1 Rest of LAMEA Tire-Derived Fuels Market by Value Forecast 2021-2031 (US$ million, AGR %, CAGR %) (L-shape recovery)
Table 2.1 LAMEA Tire-Derived Fuels Market by Raw Form Forecast 2021-2031 (US$ million, AGR %, CAGR %)
Table 2.1 LAMEA Tire-Derived Fuels Market by Raw Form Forecast 2021-2031 (US$ million, AGR %, CAGR %) (V-shape recovery)
Table 2.1 LAMEA Tire-Derived Fuels Market by Raw Form Forecast 2021-2031 (US$ million, AGR %, CAGR %) (W-shape recovery)
Table 2.1 LAMEA Tire-Derived Fuels Market by Raw Form Forecast 2021-2031 (US$ million, AGR %, CAGR %) (U-shape recovery)
Table 2.1 LAMEA Tire-Derived Fuels Market by Raw Form Forecast 2021-2031 (US$ million, AGR %, CAGR %) (L-shape recovery)
Table 2.1 LAMEA Tire-Derived Fuels Market by Source Forecast 2021-2031 (US$ million, AGR %, CAGR %)
Table 2.1 LAMEA Tire-Derived Fuels Market by Source Forecast 2021-2031 (US$ million, AGR %, CAGR %) (V-shape recovery)
Table 2.1 LAMEA Tire-Derived Fuels Market by Source Forecast 2021-2031 (US$ million, AGR %, CAGR %) (W-shape recovery)
Table 2.1 LAMEA Tire-Derived Fuels Market by Source Forecast 2021-2031 (US$ million, AGR %, CAGR %) (U-shape recovery)
Table 2.1 LAMEA Tire-Derived Fuels Market by Source Forecast 2021-2031 (US$ million, AGR %, CAGR %) (L-shape recovery)
Table 2.1 LAMEA Tire-Derived Fuels Market by End-User Forecast 2021-2031 (US$ million, AGR %, CAGR %)
Table 2.1 LAMEA Tire-Derived Fuels Market by End-User Forecast 2021-2031 (US$ million, AGR %, CAGR %) (V-shape recovery)
Table 2.1 LAMEA Tire-Derived Fuels Market by End-User Forecast 2021-2031 (US$ million, AGR %, CAGR %) (W-shape recovery)
Table 2.1 LAMEA Tire-Derived Fuels Market by End-User Forecast 2021-2031 (US$ million, AGR %, CAGR %) (U-shape recovery)
Table 2.1 LAMEA Tire-Derived Fuels Market by End-User Forecast 2021-2031 (US$ million, AGR %, CAGR %) (L-shape recovery)
Table 10.1 Ambuja Cements Limited: Company Information
Table 10.2 Ambuja Cements Limited Company: Company Revenue 2015-2019 (US$ Mn, AGR %)
Table 10.3 Ambuja Cements Limited: Company Product and Service Offerings
Table 10.4 Ambuja Cements Limited: Company Recent Developments till Nov,2020
Table 10.5 Bridgestone Corporation: Company Information
Table 10.6 Bridgestone Corporation: Company Revenue 2015-2019 (US$ Mn, AGR %)
Table 10.7 Bridgestone Corporation: Company Product and Service Offerings
Table 10.8 Bridgestone Corporation: Company Recent Developments till Nov,2020
Table 10.9 Cemex SAB de CV: Company Information
Table 10.10 Cemex SAB de CV: Company Revenue 2015-2019 (US$ Mn, AGR %)
Table 10.11 Cemex SAB de CV: Company Product and Service Offerings
Table 10.12 Cemex SAB de CV: Company Recent Developments till Nov,2020
Table 10.13 Columbus McKinnon Corp.: Company Information
Table 10.14 Columbus McKinnon Corporation: Company Revenue 2015-2019 (US$ Mn, AGR %)
Table 10.15 Columbus McKinnon Corporation: Company Product and Service Offerings
Table 10.16 Continental AG: Company Information
Table 10.17 Continental AG: Company Revenue 2015-2019 (US$ Mn, AGR %)
Table 10.18 Continental AG: Company Product and Service Offerings
Table 10.19 Continental AG: Company Recent Developments till Nov,2020
Table 10.20 CRH PLC: Company Information
Table 10.21 CRH PLC: Company Revenue 2015-2019 (US$ Mn, AGR %)
Table 10.22 CRH PLC: Company Product and Service Offerings
Table 10.23 CRH PLC: Company Recent Developments till Nov,2020
Table 10.24 Heidelberg Cement: Company Information
Table 10.25 Heidelberg Cement: Company Revenue 2015-2019 (US$ Mn, AGR %)
Table 10.26 Heidelberg Cement: Company Product and Service Offerings
Table 10.27 Heidelberg Cement: Company Recent Developments till Nov,2020
Table 10.28 LafargeHolcim Ltd: Company Information
Table 10.29 LafargeHolcim Ltd: Company Revenue 2015-2019 (US$ Mn, AGR %)
Table 10.30 LafargeHolcim Ltd: Company Product and Service Offerings
Table 10.31 LafargeHolcim Ltd: Company Recent Developments till Nov,2020
Table 10.32 Michelin Manufacturing company: Company Information
Table 10.33 Michelin Manufacturing company: Company Revenue 2015-2019 (US$ Mn, AGR %)
Table 10.34 Michelin Manufacturing company: Company Product and Service Offerings
Table 10.35 Michelin Manufacturing company: Company Recent Developments till Nov,2020
Table 10.36 Toyo Tire Corporation: Company Information
Table 10.37 Toyo Tire Corporation: Company Revenue 2015-2019 (US$ Mn, AGR %)
Table 10.38 Toyo Tire Corporation: Company Product and Service Offerings
Table 10.39 Toyo Tire Corporation: Company Recent Developments till Nov,2020
Table 10.40 UltraTech Cement Limited: Company Information
Table 10.41 UltraTech Cement Limited: Company Revenue 2015-2019 (US$ Mn, AGR %)
Table 10.42 UltraTech Cement Limited: Company Product and Service Offerings
Table 10.43 UltraTech Cement Limited: Company Recent Developments till Nov,2020
Table 10.44 Entergy Corporation: Company Information
Table 10.45 Entergy Corporation: Company Revenue 2015-2019 (US$ Mn, AGR %)
Table 10.46 Entergy Corporation: Company Product and Service Offerings
Table 10.47 Entergy Corporation: Company Recent Developments till Nov,2020
Table 10.48 The Goodyear Tire & Rubber: Company Information
Table 10.49 The Goodyear Tire & Rubber: Company Revenue 2015-2019 (US$ Mn, AGR %)
Table 10.50 The Goodyear Tire & Rubber: Company Product and Service Offerings
Table 10.51 The Goodyear Tire & Rubber: Company Recent Developments till Nov,2020
Table 10.52 DN Tyre & Rubber Plc: Company Information
Table 10.53 DN Tyre & Rubber Plc: Company Revenue 2015-2019 (US$ Mn, AGR %)
Table 10.54 DN Tyre & Rubber Plc: Company Product and Service Offerings
Table 10.55 The Monarch Cement Company: Company Information
Table 10.56 The Monarch Cement Company: Company Revenue 2015-2019 (US$ Mn, AGR %)
Table 10.57 The Monarch Cement Company: Company Product and Service Offerings
List of Companies Profiled in the report
Ambuja Cements Limited
Bridgestone Corporation
Cemex SAB de CV
Columbus McKinnon Corp.
Continental AG
CRH PLC Building Material Company
DN Tyre & Rubber PLC Company
Entergy Corporation Company
Heidelberg Cement Company
LafargeHolcim Ltd Company
Michelin Manufacturing Company
The Goodyear Tire & Rubber Company
The Monarch Cement Company
Toyo Tire Corporation Company
UltraTech Cement Limited Company
List of Other Companies Mentioned in the report
Al Shirawi Enterprises LLC
All American Tire Recycling
Ash Grove Cement Company
BDS Waste Disposal
C&R Tire Recycling Pty Ltd
Cadence Environmental Energy Inc.
CalPortland
Cherry Companies
Colt, Inc. Scrap Tire Centers
Construction Machinery Ltd (CML)
Dajin Enterprise Co., Ltd.
Dena Nano Ltd
Dunlop
Emanuel Tire LLC
Emterra Group Inc.
Engineering and Equipment Co. (EECO)
ESI, Inc. of Tennessee
ETR Group
Firestone
Front Range Tire Recycle Inc.
Global Tire Recycling
Globarket Tire Recycling LLC
Golden Bay Cement
Hikari World Co. Ltd
Holcim NZ
Infrastructure Project JSC (ISP Group)
Kokubu Shokai Inc.
L&S Tire Company
LafargeHolcim
Lakin Tire West Inc.
Liberty Tire Recycling
Lokman Recycling
Michelin Group
MS Tire recycling LLC
New River Tire Recycling
New Zealand Steel
Pan Pac
Penn Turf Inc.
Precimeca
PRM Energy Systems, Inc.
Probio Energy International
Process Barron
Product Stewardship Institute, Inc.
Ragn-Sells Group
RCBC Global Inc.
Recycling Equipment Canada
Reliable Tire Disposal
Renelux Cyprus Ltd.
ResourceCO Ltd
RMB Group
Ruixin Environmental Specialty Manufacturing Co. Ltd.
Settentrionale Trasporti S.p.A
Southeast Machinery
Tana Recycling Machinery (UK) Limited
Texas-Lehigh Cement Co.
The Monarch Cement Company
Tire Disposal & Recycling Inc.
Tirebin
Toyo Tire & Rubber Co. Ltd.
UltraTech Cement Ltd
West Coast Rubber Recycling Inc.
Wheelabrator Technologies Inc.
Wong Fong Engineering Works Pte Ltd
List of Associations
Alabama Tire Dealers Association
American Chemical Society – Rubber Division
Arkansas Independent Tire Dealers Association
Automotive Aftermarket Association Southeast
Automotive Tire Manufacturers’ Association (India)
British Tire Manufacturers’ Association
California Tire Dealers Association
Chesapeake Automotive Business Association
European Tire & Rim Technical Organisation
European Tire & Rubber Manufacturers’ Association
Georgia Tire Dealers and Retreaders Association
Imported Tire Manufacturers’ Association (Europe)
International Rubber Study Group
Louisiana Independent Tire Dealers Associatio
Michigan Tire & Vehicle Service Association
Mid-America Tire Dealers Association
National Tire Distributors’ Association (UK)
New England Tire & Service Association
New Jersey State Tire Dealers Association
North Central Tire Dealers and Suppliers Association
Ohio Tire and Automotive Association
South Carolina Tire Dealers & Retreaders Association
The Tire and Rim Association
The Tire Society (USA)
Tire Association of North America
Tire Industry Association (International)
Tire Retread Information Bureau (USA)
Tyre Recovery Association (UK)
U.S. Tire Manufacturers Association
 Market Report 2021-2031")