This latest report by business intelligence provider Visiongain assesses that Solar Street Lighting Market spending will reach US$ 29.30 billion by the middle of 2030. The worldwide Solar Street Lighting Market is anticipated to grow at a CAGR of 21.4 ##fold over the 2020 and 2030 prediction era. Globally, the development of smart cities has been a main driver of market growth. Solar street lighting are the forms of light that are used prominently for outdoor lighting and use solar power as their primary energy source. Photovoltaic panels that are installed on an embedded platform power these lamps. With the increase in supply for ongoing energy in both emerging and advanced areas, the possibility of the market for street lighting is growing. Other elements such as technological developments in street lighting design have resulted in reduced solar lighting parts, making them an appropriate solution to traditional street lighting. The industry for solar street lighting is increasing with authorities of different areas promoting the construction of renewable street lighting. This aspect, as well as cost efficiency and solar heating devices ‘ environmentally friendliness, drives the industry. Other variables such as the high maintenance needed for the cost of solar lighting devices, together with the big original capital needed, restrict the general market growth.
It is therefore critical that you have your timescales correct and your forecasting plans ready. This report will ensure that you do. Visiongain’s report will ensure that you keep informed and ahead of your competitors. Gain that competitive advantage.
Market Introduction
Market Overview and Trends
Growing supply for cellular-connected lamps is the main tendency in the global market for digital street lighting. Governments in several emerging nations are implementing cellular-connected solar-powered street lighting, as they are highly cost-effective and readily monitored. Solar street lights can be remotely controlled from an Internet of Things (IoT)-enabled device when connected to a mobile network. The falling price of solar lighting solutions is another trend seen in the market for solar street lighting. According to a National Renewable Energy Laboratory report, the cost of using solar photovoltaic (PV) cells for power generation dropped by 60%. The price in 2009 was about $7.06 per watt, falling in 2016 to $2.93 per watt. The price of installing domestic thermal photovoltaic batteries reduced from 6.0 percent to 7.0 percent per year between 1998 and 2013 and 12.0 percent during 2012–2013. Because solar photovoltaic cells are an inextricable component of renewable street lighting, the price of these lamps is anticipated to decrease.
While income loans and other subsidies provided by authorities in different advanced nations, such as the U.S. that backed the sector, may expire in the coming years, it will not have a adverse impact. This is because investors in the market exist in a large number, and the World Bank continues to extend strong support to developing countries, especially developing countries such as Nigeria, which would help in taking the worldwide market forward.
Market Dynamics:
Factors Influencing the Market Growth:
Low Maintenance Cost of Solar Street Lightings Propel the Growth
The increasing supply for clean energy is a significant trigger for the building industry for global solar roads. Easy installation, low maintenance costs and no damaging radiation during lamp manufacturing are some of the more variables that influence the development of the worldwide industry for street lighting panels. One of the most significant variables supporting the development of the global solar street lighting industry is the significant reduction of pollution through the use of solar energy to generate electricity. In addition, the working of street lighting even when the sun is not available or on a rainy day is another variable fueling the development of the global solar street lighting industry in the 2020 to 2030 forecast period.
Strict carbon emission laws and favourable public aid for renewable energy sources are the main considerations behind the development of the worldwide industry for lcd street lighting. Many countries ‘ governments, including China, India, and the United States, have stringent regulations and schemes, such as feed-in tariffs and quota-based renewable portfolio standards (RPSs). Moreover, initiatives are being taken by several nations to promote the use of renewable energy sources such as wind and sunlight. A goal to reduce environmental carbon footprint, which is increasing due to the use of non-renewable energy sources, has been set, thereby making the adherence to the regulations more stringent.
Governments offer economic assistance in the type of grants in various nations to promote the use of solar energy technologies. Numerous World Bank and International Finance Corporation launched initiatives, plans and programs to support the use of solar power contribute to the development of the street lighting industry. The World Bank has offered support to different countries to increase the use of renewable energy instead of conventional energy, ultimately to reduce carbon emissions and to curb the resulting pollution. For instance, the World Bank endorsed $100 million in financing for large-scale wind projects in India in March 2017.
Read on to discover how you can exploit the future business opportunities emerging in this sector. Visiongain’s new study tells you and tells you NOW. The 210-pages report provides clear, detailed insight into the global Solar Street Lighting market. Discover the key drivers and challenges affecting the market.
Factors Restraining the Market Growth:
One of the main variables hampering the development of the street lighting industry is the absence of LED standardization operation worldwide. Governments have enacted stringent legislation in several countries to encourage the use of energy-efficient techniques, but without standardizing item requirements. LED renewable street lighting requirements therefore differ across nations.
This also generates a barrier for providers as they must comply with the norms in nations where they plan to distribute the lamps. Another element hindering the development of the industry for electric street lighting is rigid contest due to the introduction of counterfeit products. In some parts of the world, although the demand for solar street lighting products is high, their low availability has led to the intrusion of inferior-quality products that cost lower. The penetration of counterfeit products has further led to increased competition in the market.
By ordering and reading our brand-new report today, you stay better informed and ready to act.
Report Scope
The report delivers considerable added value by revealing:
70 tables, charts and graphs are analyzing and revealing the growth prospects and outlook for the Solar Street Lighting market.
Global Solar Street Lighting market forecasts and analysis from 2020-2030.
Solar Street Lighting market provides revenue estimates, forecasts and analysis from 2020-2030 for Solar Street Lighting submarkets:
Forecasts and analysis of Solar Street Lighting market by Type between 2020-2030
Standalone Market, 2020-2030
Grid Connected Market, 2020-2030
Other Types Market, 2020-2030
Forecasts and analysis of Solar Street Lighting market by Light Source between 2020-2030
Light Emitting Diode (LED) Market, 2020-2030
Compact Fluorescent Lamps (CFL) Market, 2020-2030
Other Light Sources Market, 2020-2030
Forecasts and analysis of Solar Street Lighting market by Application between 2020-2030
Commercial Lighting Market, 2020-2030
Residential Market, 2020-2030
Industrial Market, 2020-2030
Other Application Market, 2020-2030
Regional Solar Street Lighting market forecasts from 2020-2030 with drivers and restraints for the countries including:
Geographic Breakdown
Focused regional forecasts and analysis explore the future opportunities:
North America Market, 2020-2030
US Market, 2020-2030
Canada Market, 2020-2030
Europe Market, 2020-2030
The UK Market, 2020-2030
Germany Market, 2020-2030
France Market, 2020-2030
Italy Market, 2020-2030
Spain Market, 2020-2030
Rest of Europe Market, 2020-2030
Asia-Pacific Market, 2020-2030
China Market, 2020-2030
India Market, 2020-2030
Japan Market, 2020-2030
Australia & New Zealand Market, 2020-2030
Rest of Asia-Pacific Market, 2020-2030
LAMEA Market, 2020-2030
Latin America Market, 2020-2030
Middle East Market, 2020-2030
Africa Market, 2020-2030

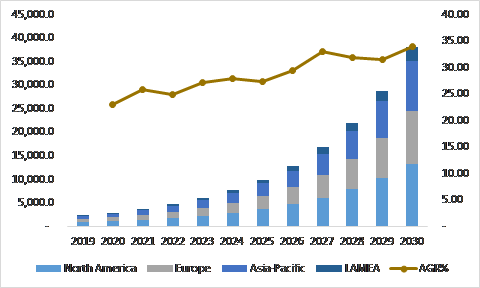
Figure:- Solar Street Lighting Market Size and Forecast by Application, 2020-2030
Demand for street lighting alternatives with renewable LED varies depending on different geographic areas. In North America, Asia-Pacific (APAC), Europe, and the Rest of the World (RoW), the renewable LED street lighting industry maintains a prominent proportion. Geographically, in 2019, APAC resulted the worldwide industry for renewable LED street lighting. Furthermore, the APAC area is anticipated to dominate the industry throughout the 2020-2030 prediction and develop at 11.9% CAGR. With the global solar LED street lighting industry, rising environmental concerns are anticipated to fuel the development of the APAC region. With the growing customer awareness campaigns and subsidies given by the govt to increase the renewable LED street lighting industry across the Middle East and Africa, RoW area is anticipated to develop at the greatest CAGR of 14.2 times over the forecast period.
China and India are among the main nations in the street lighting industry for APAC solar LED. India paid for 2019’s largest stake. This is largely owing to the difficulties experienced by most of the country’s remote regions in accessing energy owing to lengthy transmission lines and insufficient electrification, contributing to renewable LED street lighting being adopted in India. Solar LED street lighting helps to meet customers ‘ demands at a reduced price. In addition, by providing products at subsidized prices, the Government of India is operating towards the implementation of sunlight LED street lighting.
Company profiles for the leading Solar Street Lighting companies
Company Profiles of Leading Players
Anhui Longvolt Energy Co., Ltd.
Bisol
Greenshine New Energy
Solar Lighting International
Solar G
Orion Solar
Covimed Solar
Leadsun
Jinhua SunMaster Solar Lighting Co., Ltd.
Solar Electric Power Company (SEPCO)
Shenzhen Spark Optoelectronics S&T Co., Ltd.
Other Key Players in the market
Zhuhai Bomin Solar Technology Co., Ltd.
Solux
Urja Global Limited
Sol, Inc.
Solar Street Lights USA
Exide Industries Ltd.
Su-Kam Power Systems Ltd.
Sunna Design
Philips Lighting Holding B.V.
SOKOYO Solar Group
Dragons Breath Solar
Bridgelux, Inc.
Omega Solar
meeco AG
KAGA, Inc.
EnGoPlanet Inc.
SOLEKTRA INT.
Jiangsu Sokoyo Solar Lighting Co., Ltd.
Urja Global Ltd.
Conclusions and recommendations which will aid decision-making
How will you benefit from this report?
Keep your knowledge base up to speed. Don’t get left behind
Reinforce your strategic decision-making with definitive and reliable market data
Learn how to exploit new technological trends
Realise your company’s full potential within the market
Understand the competitive landscape and identify potential new business opportunities & partnerships
Who should read this report?
Anyone with involvement in the Solar Street Lighting
Solar energy operators
Engineering contractors
Investment managers
Arbitrage companies and divisions
Solar energy price reporting companies
Solar energy company managers
Solar energy consultants
Solar energy company executives and analysts
Heads of strategic development
Business development managers
Marketing managers
Market analysts,
Technologists
Suppliers
Investors
Banks
Government agencies
Visiongain’s study is intended for anyone requiring commercial analyses for the Solar Street Lighting market and leading companies. You find data, trends and predictions.
Buy our report today the Solar Street Lighting Market Forecast 2020-2030. Avoid missing out by staying informed – get our report now.
Visiongain is a trading partner with the US Federal Government
CCR Ref number: KD4R6
Do you have any custom requirements we can help you with? Any need for specific country, geo region, market segment or specific company information? Contact us today, we can discuss your needs and see how we can help sara.peerun@visiongain.com
Report Overview
1.1 Global Solar Street Lighting Market
1.2 Global Solar Street Lighting Market Overview
1.3 Global Solar Street Lighting Market Segmentation
1.4 The Emergence of Solar Street Lighting in the Industry
1.5 Why You Should Read This Report
1.6 How This Report Delivers
1.7 Key Questions Answered by This Analytical Report
1.8 Methodology
1.8.1 Secondary Research
1.8.2 Market Evaluation & Forecasting Methodology
1.9 Frequently Asked Questions (FAQ)
1.10 Associated Visiongain Reports
1.11 About Visiongain
2. Introduction to Solar Street Lighting Market
2.1 Market Definition
2.2 Industry Outlook
2.3 Value Chain Analysis
2.4 Industry Structure
2.5 Current Status & Trends
2.6 Demand & Supply Analysis
2.7 Trade Analysis
2.8 Price Trend Analysis
3. Global Solar Street Lighting Market Analysis
3.1 PEST Analysis of the Solar Street Lighting Market
3.2 Expert Opinion
3.2.1 Primary Correspondents
3.3 Market Outlook
3.4 Drivers & Restraints
3.5 Dominant Region/Country
3.6 Market Scenario
3.7 Overall Growth Rate, Globally
3.8 SWOT Analysis of the Solar Street Lighting Market
3.8.1 Strengths
3.8.2 Weaknesses
3.8.3 Opportunities
3.8.4 Threats
3.9 Porter’s Five Forces Analysis
3.9.1 Competitive Rivalry
3.9.2 Supplier Power
3.9.3 Buyer Power
3.9.4 Threat of Substitute
3..9.5 Threat of New Entrant
4. Solar Street Lighting: Global Market Analysis by Segments
4.1 Global Solar Street Lighting Market Forecast, by Type 2020-2030
4.1.1 Type Overview
4.1.2 Standalone Market, 2020-2030
4.1.3 Grid Connected Market, 2020-2030
4.1.4 Other Types Market, 2020-2030
4.2 Global Solar Street Lighting Market Forecast, by Light Source 2020-2030
4.2.1 Light Source Overview
4.2.2 Light Emitting Diode (LED) Market, 2020-2030
4.2.3 Compact Fluorescent Lamps (CFL) Market, 2020-2030
4.2.4 Other Light Sources Market, 2020-2030
4.3 Global Solar Street Lighting Market Forecast, by Application 2020-2030
4.3.1 Application Overview
4.3.2 Commercial Lighting Market, 2020-2030
4.3.3 Residential Market, 2020-2030
4.3.4 Industrial Market, 2020-2030
4.3.5 Other Application Market, 2020-2030
5. Leading Regions in Solar Street Lighting Market 2020-2030
5.1 Regional Overview
5.1.1 North America
5.1.2 Europe
5.1.3 Asia Pacific
5.1.4 LAMEA
5.1.5 Leading Countries/ Regions
5.2 U.S. Solar Street Lighting Market Forecast, 2020-2030
5.2.1 U.S. Solar Street Lighting Submarket, By Type Forecast 2020-2030
5.2.2 U.S. Solar Street Lighting Submarket, By Light Source Forecast 2020-2030
5.2.3 U.S. Solar Street Lighting Submarket, By Application Forecast 2020-2030
5.2.4 U.S. Solar Street Lighting Submarket, By Forecast 2020-2030
5.3 Canada Solar Street Lighting Market Forecast, 2020-2030
5.3.1 Canada Solar Street Lighting Submarket, By Type Forecast 2020-2030
5.3.2 Canada Solar Street Lighting Submarket, By Light Source Forecast 2020-2030
5.3.3 Canada Solar Street Lighting Submarket, By Application Forecast 2020-2030
5.3.4 Canada Solar Street Lighting Submarket, By Forecast 2020-2030
5.4 The UK Solar Street Lighting Market Forecast, 2020-2030
5.4.1 The UK Solar Street Lighting Submarket, By Type Forecast 2020-2030
5.4.2 The UK Solar Street Lighting Submarket, By Light Source Forecast 2020-2030
5.4.3 The UK Solar Street Lighting Submarket, By Application Forecast 2020-2030
5.4.4 The UK Solar Street Lighting Submarket, By Forecast 2020-2030
5.5 Germany Solar Street Lighting Market Forecast, 2020-2030
5.5.1 Germany Solar Street Lighting Submarket, By Type Forecast 2020-2030
5.5.2 Germany Solar Street Lighting Submarket, By Light Source Forecast 2020-2030
5.5.3 Germany Solar Street Lighting Submarket, By Application Forecast 2020-2030
5.5.4 Germany Solar Street Lighting Submarket, By Forecast 2020-2030
5.6 France Solar Street Lighting Market Forecast, 2020-2030
5.6.1 France Solar Street Lighting Submarket, By Type Forecast 2020-2030
5.6.2 France Solar Street Lighting Submarket, By Light Source Forecast 2020-2030
5.6.3 France Solar Street Lighting Submarket, By Application Forecast 2020-2030
5.6.4 France Solar Street Lighting Submarket, By Forecast 2020-2030
5.7 Italy Solar Street Lighting Market Forecast, 2020-2030
5.7.1 Italy Solar Street Lighting Submarket, By Type Forecast 2020-2030
5.7.2 Italy Solar Street Lighting Submarket, By Light Source Forecast 2020-2030
5.7.3 Italy Solar Street Lighting Submarket, By Application Forecast 2020-2030
5.7.4 Italy Solar Street Lighting Submarket, By Forecast 2020-2030
5.8 Spain Solar Street Lighting Market Forecast, 2020-2030
5.8.1 Spain Solar Street Lighting Submarket, By Type Forecast 2020-2030
5.8.2 Spain Solar Street Lighting Submarket, By Light Source Forecast 2020-2030
5.8.3 Spain Solar Street Lighting Submarket, By Application Forecast 2020-2030
5.8.4 Spain Solar Street Lighting Submarket, By Forecast 2020-2030
5.9 Rest of Europe Solar Street Lighting Market Forecast, 2020-2030
5.9.1 Rest of Europe Solar Street Lighting Submarket, By Type Forecast 2020-2030
5.9.2 Rest of Europe Solar Street Lighting Submarket, By Light Source Forecast 2020-2030
5.9.3 Rest of Europe Solar Street Lighting Submarket, By Application Forecast 2020-2030
5.9.4 Rest of Europe Solar Street Lighting Submarket, By Forecast 2020-2030
5.10 China Solar Street Lighting Market Forecast, 2020-2030
5.10.1 China Solar Street Lighting Submarket, By Type Forecast 2020-2030
5.10.2 China Solar Street Lighting Submarket, By Light Source Forecast 2020-2030
5.10.3 China Solar Street Lighting Submarket, By Application Forecast 2020-2030
5.10.4 China Solar Street Lighting Submarket, By Forecast 2020-2030
5.11 India Solar Street Lighting Market Forecast, 2020-2030
5.11.1 India Solar Street Lighting Submarket, By Type Forecast 2020-2030
5.11.2 India Solar Street Lighting Submarket, By Light Source Forecast 2020-2030
5.11.3 India Solar Street Lighting Submarket, By Application Forecast 2020-2030
5.11.4 India Solar Street Lighting Submarket, By Forecast 2020-2030
5.12 Japan Solar Street Lighting Market Forecast, 2020-2030
5.12.1 Japan Solar Street Lighting Submarket, By Type Forecast 2020-2030
5.12.2 Japan Solar Street Lighting Submarket, By Light Source Forecast 2020-2030
5.12.3 Japan Solar Street Lighting Submarket, By Application Forecast 2020-2030
5.12.4 Japan Solar Street Lighting Submarket, By Forecast 2020-2030
5.13 Australia & New Zealand Solar Street Lighting Market Forecast, 2020-2030
5.13.1 Australia & New Zealand Solar Street Lighting Submarket, By Type Forecast 2020-2030
5.13.2 Australia & New Zealand Solar Street Lighting Submarket, By Light Source Forecast 2020-2030
5.13.3 Australia & New Zealand Solar Street Lighting Submarket, By Application Forecast 2020-2030
5.13.4 Australia & New Zealand Solar Street Lighting Submarket, By Forecast 2020-2030
5.14 Rest of Asia-Pacific Solar Street Lighting Market Forecast, 2020-2030
5.14.1 Rest of Asia-Pacific Solar Street Lighting Submarket, By Type Forecast 2020-2030
5.14.2 Rest of Asia-Pacific Solar Street Lighting Submarket, By Light Source Forecast 2020-2030
5.14.3 Rest of Asia-Pacific Solar Street Lighting Submarket, By Application Forecast 2020-2030
5.14.4 Rest of Asia-Pacific Solar Street Lighting Submarket, By Forecast 2020-2030
5.15 Latin America Solar Street Lighting Market Forecast, 2020-2030
5.15.1 Latin America Solar Street Lighting Submarket, By Type Forecast 2020-2030
5.15.2 Latin America Solar Street Lighting Submarket, By Light Source Forecast 2020-2030
5.15.3 Latin America Solar Street Lighting Submarket, By Application Forecast 2020-2030
5.15.4 Latin America Solar Street Lighting Submarket, By Forecast 2020-2030
5.16 Middle East Solar Street Lighting Market Forecast, 2020-2030
5.16.1 Middle East Solar Street Lighting Submarket, By Type Forecast 2020-2030
5.16.2 Middle East Solar Street Lighting Submarket, By Light Source Forecast 2020-2030
5.16.3 Middle East Solar Street Lighting Submarket, By Application Forecast 2020-2030
5.16.4 Middle East Solar Street Lighting Submarket, By Forecast 2020-2030
5.17 Africa Solar Street Lighting Market Forecast, 2020-2030
5.17.1 Africa Solar Street Lighting Submarket, By Type Forecast 2020-2030
5.17.2 Africa Solar Street Lighting Submarket, By Light Source Forecast 2020-2030
5.17.3 Africa Solar Street Lighting Submarket, By Application Forecast 2020-2030
5.17.4 Africa Solar Street Lighting Submarket, By Forecast 2020-2030
7. Leading Companies in The Solar Street Lighting Market
7.1 Greenshine New Energy
7.1.1 Greenshine New Energy Products and Services
7.1.2 Analysis of Greenshine New Energy within the Solar Street Lighting Market
7.1.3 Greenshine New Energy M&A Activity
7.1.4 Future Outlook for Greenshine New Energy
7.1.5 Greenshine New Energy Projects
7.2 Solar Lighting International
7.2.1 Solar Lighting International Products and Services
7.2.2 Analysis of Solar Lighting International within the Solar Street Lighting Market
7.2.3 Solar Lighting International M&A Activity
7.2.4 Future Outlook for Solar Lighting International
7.2.5 Solar Lighting International Projects
7.3 Anhui Longvolt Energy Co., Ltd.
7.3.1 Anhui Longvolt Energy Co., Ltd. Products and Services
7.3.2 Analysis of Anhui Longvolt Energy Co., Ltd. within the Solar Street Lighting Market
7.3.3 Anhui Longvolt Energy Co., Ltd. M&A Activity
7.3.4 Future Outlook for Anhui Longvolt Energy Co., Ltd.
7.3.5 Anhui Longvolt Energy Co., Ltd. Projects
7.4 Bisol
7.4.1 Bisol Products and Services
7.4.2 Analysis of Bisol within the Solar Street Lighting Market
7.4.3 Bisol M&A Activity
7.4.4 Future Outlook for Bisol
7.4.5 Bisol Projects
7.5 Solar G
7.5.1 Solar G Products and Services
7.5.2 Analysis of Solar G within the Solar Street Lighting Market
7.5.3 Solar G M&A Activity
7.5.4 Future Outlook for Solar G
7.5.5 Solar G Projects
7.6 Orion Solar
7.6.1 Orion Solar Products and Services
7.6.2 Analysis of Orion Solar within the Solar Street Lighting Market
7.6.3 Orion Solar M&A Activity
7.6.4 Future Outlook for Orion Solar
7.6.5 Orion Solar Projects
7.7 Covimed Solar
7.7.1 Covimed Solar Products and Services
7.7.2 Analysis of Covimed Solar within the Solar Street Lighting Market
7.7.3 Covimed Solar M&A Activity
7.7.4 Future Outlook for Covimed Solar
7.7.5 Covimed Solar Projects
7.8 Leadsun
7.8.1 Leadsun Products and Services
7.8.2 Analysis of Leadsun within the Solar Street Lighting Market
7.8.3 Leadsun M&A Activity
7.8.4 Future Outlook for Leadsun
7.8.5 Leadsun Projects
7.9 Jinhua SunMaster Solar Lighting Co., Ltd.
7.9.1 Jinhua SunMaster Solar Lighting Co., Ltd. Products and Services
7.9.2 Analysis of Jinhua SunMaster Solar Lighting Co., Ltd. within the Solar Street Lighting Market
7.9.3 Jinhua SunMaster Solar Lighting Co., Ltd. M&A Activity
7.9.4 Future Outlook for Jinhua SunMaster Solar Lighting Co., Ltd.
7.9.5 Jinhua SunMaster Solar Lighting Co., Ltd. Projects
7.10 Solar Electric Power Company (SEPCO)
7.10.1 Solar Electric Power Company (SEPCO) Products and Services
7.10.2 Analysis of Solar Electric Power Company (SEPCO) within the Solar Street Lighting Market
7.10.3 Solar Electric Power Company (SEPCO) M&A Activity
7.10.4 Future Outlook for Solar Electric Power Company (SEPCO)
7.10.5 Solar Electric Power Company (SEPCO) Projects
7.11 Shenzhen Spark Optoelectronics S&T Co., Ltd.
7.11.1 Shenzhen Spark Optoelectronics S&T Co., Ltd. Products and Services
7.11.2 Analysis of Shenzhen Spark Optoelectronics S&T Co., Ltd. within the Solar Street Lighting Market
7.11.3 Shenzhen Spark Optoelectronics S&T Co., Ltd. M&A Activity
7.11.4 Future Outlook for Shenzhen Spark Optoelectronics S&T Co., Ltd.
7.11.5 Shenzhen Spark Optoelectronics S&T Co., Ltd. Projects
8. Conclusions and Recommendations
8.1 Global Solar Street Lighting Market Outlook
8.2 Recommendations
9. Glossary
Associated Visiongain Reports
Visiongain Report Sales Order Form
Appendix A
About Visiongain
Appendix B
Visiongain Report Evaluation Form
List of Tables
Table 1.0 Key Highlights
Table 3.1 PEST Analysis, Solar Street Lighting Market
Table 3.2 SWOT Analysis
Table 4.1 Global Solar Street Lighting Market Forecast 2020-2030 ($Bn, AGR %, CAGR %, Cumulative)
Table 4.2 Global Solar Street Lighting Submarket, By Type Forecast 2020-2030 ($billion, AGR %, Cumulative)
Table 4.3 Global Solar Street Lighting Submarket, By Application Forecast 2020-2030 ($billion, AGR %, Cumulative)
Table 4.4 Global Solar Street Lighting Submarket, By Forecast 2020-2030 ($billion, AGR %, Cumulative)
Table 5.1 Global Solar Street Lighting Market, by Country/Region Forecast 2020-2030 ($billion, AGR %, Cumulative)
Table 5.2 Global Solar Street Lighting Market, by Country/Region Forecast 2020-2030 ($billion, AGR %, Cumulative)
Table 5.3 Canada Solar Street Lighting Market Forecast 2020-2030 ($billion, , AGR %, CAGR %, Cumulative)
Table 5.4 Canada Solar Street Lighting Submarket, By Type Forecast 2020-2030 ($billion, AGR %, Cumulative)
Table 5.5 Canada Solar Street Lighting Submarket, By Light Source Forecast 2020-2030 ($billion, AGR %, Cumulative)
Table 5.6 US Solar Street Lighting Market Submarket, By Application Forecast 2020-2030 ($billion, , AGR %, CAGR %, Cumulative)
Table 5.7 US Solar Street Lighting Submarket, By Type Forecast 2020-2030 ($billion, AGR %, Cumulative)
Table 5.8 US Solar Street Lighting Submarket, By Light Source Forecast 2020-2030 ($billion, AGR %, Cumulative)
Table 5.9 Latin America Solar Street Lighting Market Forecast 2020-2030 ($billion, , AGR %, CAGR %, Cumulative)
Table 5.10 Latin America Solar Street Lighting Submarket, By Type Forecast 2020-2030 ($billion, AGR %, Cumulative)
Table 5.11 Latin America Solar Street Lighting Submarket, By Light Source Forecast 2020-2030 ($billion, AGR %, Cumulative)
Table 5.12 Germany Solar Street Lighting Market Submarket, By Application Forecast 2020-2030 ($billion, , AGR %, CAGR %, Cumulative)
Table 5.13 Germany Solar Street Lighting Submarket, By Type Forecast 2020-2030 ($billion, AGR %, Cumulative)
Table 5.14 Germany Solar Street Lighting Submarket, By Light Source Forecast 2020-2030 ($billion, AGR %, Cumulative)
Table 5.15 UK Solar Street Lighting Market Submarket, By Application Forecast 2020-2030 ($billion, , AGR %, CAGR %, Cumulative)
Table 5.16 UK Solar Street Lighting Submarket, By Type Forecast 2020-2030 ($billion, AGR %, Cumulative)
Table 5.17 UK Solar Street Lighting Submarket, By Light Source Forecast 2020-2030 ($billion, AGR %, Cumulative)
Table 5.18 Spain Solar Street Lighting Market Submarket, By Application Forecast 2020-2030 ($billion, , AGR %, CAGR %, Cumulative)
Table 5.19 Spain Solar Street Lighting Submarket, By Type Forecast 2020-2030 ($billion, AGR %, Cumulative)
Table 5.20 Spain Solar Street Lighting Submarket, By Light Source Forecast 2020-2030 ($billion, AGR %, Cumulative)
Table 5.21 UK Solar Street Lighting Submarket, By Application Forecast 2020-2030 ($billion, , AGR %, CAGR %, Cumulative)
Table 5.22 UK Solar Street Lighting Submarket, By Type Forecast 2020-2030 ($billion, AGR %, Cumulative)
Table 5.23 UK Solar Street Lighting Submarket, By Light Source Forecast 2020-2030 ($billion, AGR %, Cumulative)
Table 5.24 China Solar Street Lighting Submarket, By Application Forecast 2020-2030 ($billion, , AGR %, CAGR %, Cumulative)
Table 5.25 China Solar Street Lighting Submarket, By Type Forecast 2020-2030 ($billion, AGR %, Cumulative)
Table 5.26 China Solar Street Lighting Submarket, By Light Source Forecast 2020-2030 ($billion, AGR %, Cumulative)
Table 5.27 Australia Solar Street Lighting Submarket, By Application Forecast 2020-2030 ($billion, , AGR %, CAGR %, Cumulative)
Table 5.28 Australia Solar Street Lighting Submarket, By Type Forecast 2020-2030 ($billion, AGR %, Cumulative)
Table 5.29 Australia Solar Street Lighting Submarket, By Light Source Forecast 2020-2030 ($billion, AGR %, Cumulative)
Table 5.30 South Korea Solar Street Lighting Submarket, By Application Forecast 2020-2030 ($billion, , AGR %, CAGR %, Cumulative)
Table 5.31 South Korea Solar Street Lighting Submarket, By Type Forecast 2020-2030 ($billion, AGR %, Cumulative)
Table 5.32 South Korea Solar Street Lighting Submarket, By Light Source Forecast 2020-2030 ($billion, AGR %, Cumulative)
Table 5.33 Japan Solar Street Lighting Submarket, By Application Forecast 2020-2030 ($billion, , AGR %, CAGR %, Cumulative)
Table 5.34 Japan Solar Street Lighting Submarket, By Type Forecast 2020-2030 ($billion, AGR %, Cumulative)
Table 5.35 Japan Solar Street Lighting Submarket, By Light Source Forecast 2020-2030 ($billion, AGR %, Cumulative)
Table 5.36 India Solar Street Lighting Submarket, By Application Forecast 2020-2030 ($billion, , AGR %, CAGR %, Cumulative)
Table 5.37 India Solar Street Lighting Submarket, By Type Forecast 2020-2030 ($billion, AGR %, Cumulative)
Table 5.38 India Solar Street Lighting Submarket, By Light Source Forecast 2020-2030 ($billion, AGR %, Cumulative)
Table 5.39 Middle East Solar Street Lighting Submarket, By Application Forecast 2020-2030 ($billion, , AGR %, CAGR %, Cumulative)
Table 5.40 Middle East Solar Street Lighting Submarket, By Type Forecast 2020-2030 ($billion, AGR %, Cumulative)
Table 5.41 Middle East Solar Street Lighting Submarket, By Light Source Forecast 2020-2030 ($billion, AGR %, Cumulative)
Table 5.42 Rest of Asia-Pacific Solar Street Lighting Submarket, By Application Forecast 2020-2030 ($billion , , AGR %, CAGR %, Cumulative)
Table 5.43 Rest of Asia-Pacific Solar Street Lighting Submarket, By Type Forecast 2020-2030 ($billion , AGR %, Cumulative)
Table 5.44 Rest of Asia-Pacific Solar Street Lighting Submarket, By Light Source Forecast 2020-2030 ($billion , AGR %, Cumulative)
Table 5.45 Rest of Europe Solar Street Lighting Submarket, By Application Forecast 2020-2030 ($billion, , AGR %, CAGR %, Cumulative)
Table 5.46 Rest of Europe Solar Street Lighting Submarket, By Type Forecast 2020-2030 ($billion, AGR %, Cumulative)
Table 5.47 Rest of Europe Solar Street Lighting Submarket, By Light Source Forecast 2020-2030 ($billion, AGR %, Cumulative)
Table 5.48 Africa Solar Street Lighting Submarket, By Application Forecast 2020-2030 ($billion, , AGR %, CAGR %, Cumulative)
Table 5.49 Africa Solar Street Lighting Submarket, By Type Forecast 2020-2030 ($billion, AGR %, Cumulative)
Table 5.50 Africa Solar Street Lighting Submarket, By Light Source Forecast 2020-2030 ($billion, AGR %, Cumulative)
Table 5.51 Spain Solar Street Lighting Submarket, By Application Forecast 2020-2030 ($billion , , AGR %, CAGR %, Cumulative)
Table 5.52 Spain Solar Street Lighting Submarket, By Type Forecast 2020-2030 ($billion , AGR %, Cumulative)
Table 5.53 Spain Solar Street Lighting Submarket, By Light Source Forecast 2020-2030 ($billion , AGR %, Cumulative)
Table 7.1 Greenshine New Energy Profile 2019 (Market Entry, Public/Private, Headquarters, Geography, Key Market, Listed on, Products/Services
Table 7.2 Greenshine New Energy Profile 2019 (Market Entry, Public/Private, Headquarter, Total Company Revenue $billion, Change in Revenue, Geography, Key Market, Listed on, Products/Services)
Table 7.3 Greenshine New Energy Products and Services (Product/Service, Notes)
Table 7.4 Greenshine New Energy Total Company Sales 2015-2019 (US$billion, AGR %)
Table 7.5 Greenshine New Energy Total Company Recent Development 2015-2019
Table 7.6 Solar Lighting International Profile 2019 (Market Entry, Public/Private, Headquarter, Total Company Revenue $billion, Change in Revenue, Geography, Key Market, Listed on, Products/Services)
Table 7.7 Solar Lighting International Products and Services (Product/Service, Notes)
Table 7.8 Solar Lighting International Total Company Sales 2015-2019 (US$billion, AGR %)
Table 7.9 Solar Lighting International Total Company Recent Development 2015-2019
Table 7.10 Anhui Longvolt Energy Co., Ltd. Profile 2019 (Market Entry, Public/Private, Headquarter, Total Company Revenue $billion, Change in Revenue, Geography, Key Market, Listed on, Products/Services)
Table 7.11 Anhui Longvolt Energy Co., Ltd. Products and Services (Product/Service, Notes)
Table 7.12 Anhui Longvolt Energy Co., Ltd. Total Company Sales 2015-2019 (US$billion, AGR %)
Table 7.13 Anhui Longvolt Energy Co., Ltd. Total Company Recent Development 2015-2019
Table 7.14 Bisol Profile 2019 (Market Entry, Public/Private, Headquarter, Total Company Revenue $billion, Change in Revenue, Geography, Key Market, Listed on, Products/Services)
Table 7.15 Bisol Products and Services (Product/Service, Notes)
Table 7.16 Bisol Total Company Sales 2015-2019 (US$billion, AGR %)
Table 7.17 Bisol Total Company Recent Development 2015-2019
Table 7.18 Solar G Profile 2019 (Market Entry, Public/Private, Headquarter, Total Company Revenue $billion, Change in Revenue, Geography, Key Market, Listed on, Products/Services)
Table 7.19 Solar G Products and Services (Product/Service, Notes)
Table 7.20 Solar G Total Company Sales 2015-2019 (US$billion, AGR %)
Table 7.21 Solar G Total Company Recent Development 2015-2019
Table 7.22 Orion Solar Profile 2019 (Market Entry, Public/Private, Headquarter, Total Company Revenue $billion, Change in Revenue, Geography, Key Market, Listed on, Products/Services)
Table 7.23 Orion Solar Products and Services (Product/Service, Notes)
Table 7.24 Orion Solar Total Company Sales 2015-2019 (US$billion, AGR %)
Table 7.25 Orion Solar Total Company Recent Development 2015-2019
Table 7.26 Covimed Solar Profile 2019 (Market Entry, Public/Private, Headquarter, Total Company Revenue $billion, Change in Revenue, Geography, Key Market, Listed on, Products/Services)
Table 7.27 Covimed Solar Products and Services (Product/Service, Notes)
Table 7.28 Covimed Solar Total Company Sales 2015-2019 (US$billion, AGR %)
Table 7.29 Covimed Solar Total Company Recent Development 2015-2019
Table 7.30 Leadsun Profile 2019 (Market Entry, Public/Private, Headquarter, Total Company Revenue $billion, Change in Revenue, Geography, Key Market, Listed on, Products/Services)
Table 7.31 Leadsun Products and Services (Product/Service, Notes)
Table 7.32 Leadsun Total Company Sales 2015-2019 (US$billion, AGR %)
Table 7.33 Leadsun Total Company Recent Development 2015-2019
Table 7.34 Jinhua SunMaster Solar Lighting Co., Ltd. Profile 2019 (Market Entry, Public/Private, Headquarter, Total Company Revenue $billion, Change in Revenue, Geography, Key Market, Listed on, Products/Services)
Table 7.35 Jinhua SunMaster Solar Lighting Co., Ltd. Products and Services (Product/Service, Notes)
Table 7.36 Jinhua SunMaster Solar Lighting Co., Ltd. Total Company Sales 2015-2019 (US$billion, AGR %)
Table 7.37 Jinhua SunMaster Solar Lighting Co., Ltd. Total Company Recent Development 2015-2019
Table 7.38 Solar Electric Power Company (SEPCO) Profile 2019 (Market Entry, Public/Private, Headquarter, Total Company Revenue $billion, Change in Revenue, Geography, Key Market, Listed on, Products/Services)
Table 7.39 Solar Electric Power Company (SEPCO) Products and Services (Product/Service, Notes)
Table 7.40 Solar Electric Power Company (SEPCO) Total Company Sales 2015-2019 (US$billion, AGR %)
Table 7.41 Solar Electric Power Company (SEPCO) Total Company Recent Development 2015-2019
Table 7.42 Shenzhen Spark Optoelectronics S&T Co., Ltd. Profile 2019 (Market Entry, Public/Private, Headquarter, Total Company Revenue $billion, Change in Revenue, Geography, Key Market, Listed on, Products/Services)
Table 7.43 Shenzhen Spark Optoelectronics S&T Co., Ltd. Products and Services (Product/Service, Notes)
Table 7.44 Shenzhen Spark Optoelectronics S&T Co., Ltd. Total Company Sales 2015-2019 (US$billion, AGR %)
Table 7.45 Shenzhen Spark Optoelectronics S&T Co., Ltd. Total Company Recent Development 2015-2019
List of Figures
Figure 1.1 Global Solar Street Lighting Market Segmentation
Figure 2.1 Solar Street Lighting Value Chain Analysis
Figure 3.1 Solar Street Lighting Supply-Demand Analysis
Figure 4.1 Global Solar Street Lighting Forecast 2020-2030 ($billion, AGR %)
Figure 4.2 Global Solar Street Lighting Market Forecast 2020-2030
Figure 4.3 Global Solar Street Lighting Submarket Forecast by 2020-2030 ($ billion)
Figure 4.4 Global Solar Street Lighting Market By Type Share Forecast 2020, 2025, 2030 (% Share)
Figure 4.19 Global Solar Street Lighting by Submarket By Type Forecast 2020-2030 ($ million)
Figure 4.20 Global Solar Street Lighting Market, by Share Forecast 2020, 2025, 2030 (% Share)
Figure 4.21 Solar Street Lighting Market, By Type Forecast 2020-2030 ($billion, AGR%)
Figure 4.23 Solar Street Lighting Market, By Type Forecast 2020-2030 ($billion, AGR%)
Figure 4.25 Solar Street Lighting Market, By Type Forecast 2020-2030 ($billion, AGR%)
Figure 4.27 Solar Street Lighting Market, By Type Forecast 2020-2030 ($billion, AGR%)
Figure 5.1 Regional/Country Solar Street Lighting Market, by 2020-2030
Figure 5.3 Leading Country/Regional Solar Street Lighting Market Share, by 2020
Figure 5.4 Leading Country/Regional Solar Street Lighting Market Share, by 2025
Figure 5.5 Leading Country/Regional Solar Street Lighting Market Share, by 2030
Figure 5.6 Canada Solar Street Lighting Market Forecast 2020-2030 ($billion, AGR%)
Figure 5.7 Canada Solar Street Lighting Market, by Forecast 2020-2030
Figure 5.8 Canada Solar Street Lighting Submarket, By Type Forecast 2020-2030
Figure 5.9 Canada Solar Street Lighting Submarket , By Light Source Forecast 2020-2030
Figure 5.10 Canada Solar Street Lighting Submarket , By Application 2020-2030 ($billion, AGR%)
Figure 5.10 U.S. Solar Street Lighting Market Forecast 2020-2030 ($billion, AGR%)
Figure 5.11 U.S. Solar Street Lighting Market, by Forecast 2020-2030
Figure 5.12 U.S. Solar Street Lighting Submarket, By Type Forecast 2020-2030
Figure 5.13 U.S. Solar Street Lighting Submarket , By Light Source Forecast 2020-2030
Figure 5.13 U.S. Solar Street Lighting Submarket , By Application Forecast 2020-2030
Figure 5.14 Latin America Solar Street Lighting Market Forecast 2020-2030 ($billion , AGR%)
Figure 5.15 Latin America Solar Street Lighting Market, by Forecast 2020-2030
Figure 5.16 Latin America Solar Street Lighting Submarket, By Type Forecast 2020-2030
Figure 5.17 Latin America Solar Street Lighting Submarket , By Light Source Forecast 2020-2030
Figure 5.17 Latin America Solar Street Lighting Submarket , By Application Forecast 2020-2030
Figure 5.18 Germany Solar Street Lighting Market Forecast 2020-2030 ($billion, AGR%)
Figure 5.19 Germany Solar Street Lighting Market, by Forecast 2020-2030
Figure 5.20 Germany Solar Street Lighting Submarket, By Type Forecast 2020-2030
Figure 5.21 Germany Solar Street Lighting Submarket , By Light Source Forecast 2020-2030
Figure 5.21 Germany Solar Street Lighting Submarket , By Application Forecast 2020-2030
Figure 5.22 U.K. Solar Street Lighting Market Forecast 2020-2030 ($billion, AGR%)
Figure 5.23 U.K. Solar Street Lighting Market, by Forecast 2020-2030
Figure 5.24 U.K. Solar Street Lighting Submarket, By Type Forecast 2020-2030
Figure 5.25 U.K. Solar Street Lighting Submarket , By Light Source Forecast 2020-2030
Figure 5.25 U.K. Solar Street Lighting Submarket , By Application Forecast 2020-2030
Figure 5.26 Spain Solar Street Lighting Market Forecast 2020-2030 ($billion, AGR%)
Figure 5.27 Spain Solar Street Lighting Market, by Forecast 2020-2030
Figure 5.28 Spain Solar Street Lighting Submarket, By Type Forecast 2020-2030
Figure 5.29 Spain Solar Street Lighting Submarket , By Light Source Forecast 2020-2030
Figure 5.30 UK Solar Street Lighting Market Forecast 2020-2030 ($billion, AGR%)
Figure 5.31 UK Solar Street Lighting Market, by Forecast 2020-2030
Figure 5.32 UK Solar Street Lighting Submarket, By Type Forecast 2020-2030
Figure 5.33 UK Solar Street Lighting Submarket , By Light Source Forecast 2020-2030
Figure 5.34 China Solar Street Lighting Market Forecast 2020-2030 ($billion, AGR%)
Figure 5.35 China Solar Street Lighting Submarket , By Application, by Forecast 2020-2030
Figure 5.36 China Solar Street Lighting Submarket, By Type Forecast 2020-2030
Figure 5.37 China Solar Street Lighting Submarket , By Light Source Forecast 2020-2030
Figure 5.38 Australia Solar Street Lighting Market Forecast 2020-2030 ($billion, AGR%)
Figure 5.39 Australia Solar Street Lighting Submarket , By Application, by Forecast 2020-2030
Figure 5.40 Australia Solar Street Lighting Submarket, By Type Forecast 2020-2030
Figure 5.41 Australia Solar Street Lighting Submarket , By Light Source Forecast 2020-2030
Figure 5.42 South Korea Solar Street Lighting Market Forecast 2020-2030 ($billion, AGR%)
Figure 5.43 South Korea Solar Street Lighting Submarket , By Application, by Forecast 2020-2030
Figure 5.44 South Korea Solar Street Lighting Submarket, By Type Forecast 2020-2030
Figure 5.45 South Korea Solar Street Lighting Submarket , By Light Source Forecast 2020-2030
Figure 5.46 Japan Solar Street Lighting Market Forecast 2020-2030 ($billion, AGR%)
Figure 5.47 Japan Solar Street Lighting Submarket , By Application, by Forecast 2020-2030
Figure 5.48 Japan Solar Street Lighting Submarket, By Type Forecast 2020-2030
Figure 5.49 Japan Solar Street Lighting Submarket , By Light Source Forecast 2020-2030
Figure 5.50 India Solar Street Lighting Market Forecast 2020-2030 ($billion, AGR%)
Figure 5.51 India Solar Street Lighting Submarket , By Application, by Forecast 2020-2030
Figure 5.52 India Solar Street Lighting Submarket, By Type Forecast 2020-2030
Figure 5.53 India Solar Street Lighting Submarket , By Light Source Forecast 2020-2030
Figure 5.54 Middle East Solar Street Lighting Market Forecast 2020-2030 ($billion, AGR%)
Figure 5.55 Middle East Solar Street Lighting Submarket , By Application, by Forecast 2020-2030
Figure 5.56 Middle East Solar Street Lighting Submarket, By Type Forecast 2020-2030
Figure 5.57 Middle East Solar Street Lighting Submarket , By Light Source Forecast 2020-2030
Figure 5.70 Rest of the World Solar Street Lighting Market Forecast 2020-2030 ($billion , AGR%)
Figure 5.71 Rest of the World Solar Street Lighting Submarket , By Application, by Forecast 2020-2030
Figure 5.72 Rest of the World Solar Street Lighting Submarket, By Type Forecast 2020-2030
Figure 5.73 Rest of the World Solar Street Lighting Submarket , By Light Source Forecast 2020-2030
Figure 7.1 Greenshine New Energy Total Company Sales 2013-2019 (US$ million, AGR %)
Figure 7.2 Solar Lighting International Total Company Sales 2013-2019 (US$ million, AGR %)
Figure 7.3 Anhui Longvolt Energy Co., Ltd. Total Company Sales 2013-2019 (US$ Bn, AGR %)
Figure 7.6 Bisol Company Sales 2013-2019 (US$ bn, AGR %)
Figure 7.7 Bisol Revenue % Share, by Application Segment, 2019
Figure 7.8 Bisol Revenue % Share, by Geographical Trade, 2019
Figure 7.9 Bisol Revenue % Share, by Business Segment, 2019
Figure 7.10 Solar G Revenue % Share, by Geographic Segment, 2019
Figure 7.11 Orion Solar Company Total Company Sales 2013-2019 (US$ million, AGR %)
Figure 7.12 Covimed Solar Total Company Sales 2013-2019 (US$ million, AGR %)
Figure 7.13 Covimed Solar Revenue % Share, by Regional Segment, 2019
Figure 7.14 Leadsun Total Company Sales 2013-2019 (US$ million, AGR %)
Figure 7.15 Leadsun Revenue % Share, by Regional Segment, 2019
Figure 7.16 Leadsun Revenue % Share, by Business Segment, 2019
Figure 7.17 Jinhua SunMaster Solar Lighting Co., Ltd. Total Company Sales 2013-2019 (US$ bn, AGR %)
Figure 7.18 Solar Electric Power Company (SEPCO) Total Company Revenue 2013-2019 (US$ bn, AGR %)
Figure 7.19 Solar Electric Power Company (SEPCO) Company Sales 2014-2019 (US$ bn, AGR %)
Figure 7.20 Solar Electric Power Company (SEPCO) Revenue % Share, by Business Segment, 2019