The State of Charge (SoC) Market Report 2021-2031: This report will prove invaluable to leading firms striving for new revenue pockets if they wish to better understand the industry and its underlying dynamics. It will be useful for companies that would like to expand into different industries or to expand their existing operations in a new region.
Enhance Technical Maturity Of The Battery
The lithium battery, despite its well-established technological foundation, should not be considered technologically mature. The commercialization of vehicles and portable radios in the early part of the twentieth century produced a demand for automotive and consumer appliance batteries. After WWII, a wider range of portable consumer devices, such as radios, shavers, and toys, were available, necessitating the development of better batteries. Until the late 1950s, when sealed nickel-cadmium and lead-acid batteries were introduced, these early battery-powered products required non-rechargeable primary batteries.
Develop New Applications For A Wider Variety Of Batteries
These advanced batteries enable an increasing range of portable products, including those previously powered by primary cells or rechargeable of first generation (flashlights, radios, etc.). There are other items without the most advanced batteries that are not truly practical or handy (smartphones, portable computers and tablets). The potential for new and developing markets in batteries exists, though. The hybrid and plug-in EV batteries business is increasing fast, as are novel applications for medical batteries. Further novel uses are promising recently, smart sensors, MEMS and other applications for microbatteries.
What Are These Questions You Should Ask Before Buying A Market Research Report?
• How is the state of Charge (SoC) market evolving?
• What is driving and restraining the state of Charge (SoC) market?
• How will each state of Charge (SoC) submarket segment grow over the forecast period and how much revenue will these submarkets account for in 2031?
• How will the market shares for each state of Charge (SoC) submarket develop from 2021 to 2031?
• What will be the main driver for the overall market from 2021 to 2031?
• Will leading state of Charge (SoC) markets broadly follow the macroeconomic dynamics, or will individual national markets outperform others?
• How will the market shares of the national markets change by 2031 and which geographical region will lead the market in 2031?
• Who are the leading players and what are their prospects over the forecast period?
• What are the state of Charge (SoC) projects for these leading companies?
• How will the industry evolve during the period between 2020 and 2031?
• What are the implication of state of Charge (SoC) projects taking place now and over the next 10 years?
• Is there a greater need for product commercialisation to further scale the state of Charge (SoC) market?
• Where is the state of Charge (SoC) market heading? And how can you ensure you are at the forefront of the market?
• What can be the best investment options for new product and service lines?
• What are the key prospects for moving companies into a new growth path? C-suite?
You need to discover how this will impact the state of Charge (SoC) market today, and over the next 10 years:
• Our 430-page report provides 278 tables and 274 charts/graphs exclusively to you.
• The report highlights key lucrative areas in the industry so you can target them – NOW.
• Contains in-depth analyse of global, regional and national sales and growth
• Highlights for you the key successful trends, changes and revenue projections made by your competitors
This report tells you TODAY how the state of Charge (SoC) market will develop in the next 10 years, and in-line with the variations in COVID-19 economic recession and bounce. This market is more critical now than at any point over the last 10 years.
Delivers exclusive COVID-19 variations economic data specific to your market.
To access the data contained in this document please email contactus@visiongain.com
Forecasts to 2031 and other analyses reveal the commercial prospects
• In addition to revenue forecasting to 2031, our new study provides you with recent results, growth rates, and market shares.
• You find original analyses, with business outlooks and developments.
• Discover qualitative analyses (including market dynamics, drivers, opportunities, restraints and challenges), cost structure, impact of rising state of Charge (SoC) prices and recent developments.
This report includes data analysis and invaluable insight into how COVID-19 will affect the industry and your company. Four COVID-19 recovery patterns and their impact, namely, V, L, W and U are discussed in this report.
Global State of Charge (SoC) Market (COVID Impact Analysis) by Type
• State of Charge (SOC)
• Critical Surface Charge (CSC)
• State of Health
Global State of Charge (SoC) Market (COVID Impact Analysis) by Application
• Battery Electric Vehicle (BEV)
• Plug-in Hybrid Electric Vehicle (PHEV)
• Hybrid Vehicle (HV)
• Energy Storage Battery
• Other Applications
Global State of Charge (SoC) Market (COVID Impact Analysis) by Model
• Simple Battery Model
• Advanced Simple Battery Model
• Thevenin Battery Model
• Modified Thevenin Battery Model
• Third-Order Battery Model
• Other Model
Global State of Charge (SoC) Market (COVID Impact Analysis) by Monitoring Methods
• Open Circuit Voltage Method
• Specific Gravity (SG) Method
• Coulomb Counting Method
• Impedance Measurement Method

In addition to the revenue predictions for the overall world market and segments, you will also find revenue forecasts for 4 regional and 20 leading national markets:
• North America State of Charge (SoC) Market, 2021 to 2031 Market Outlook
• U.S. State of Charge (SoC) Market, 2021 to 2031 Market Forecast & COVID Impact Analysis
• Canada State of Charge (SoC) Market, 2021 to 2031 Market Forecast & COVID Impact Analysis
• Mexico State of Charge (SoC) Market, 2021 to 2031 Market Forecast & COVID Impact Analysis
• Europe State of Charge (SoC) Market, 2021 to 2031 Market Outlook
• Germany State of Charge (SoC) Market, 2021 to 2031 Market Forecast & COVID Impact Analysis
• Spain State of Charge (SoC) Market, 2021 to 2031 Market Forecast & COVID Impact Analysis
• United Kingdom State of Charge (SoC) Market, 2021 to 2031 Market Forecast & COVID Impact Analysis
• France State of Charge (SoC) Market, 2021 to 2031 Market Forecast & COVID Impact Analysis
• Italy State of Charge (SoC) Market, 2021 to 2031 Market Forecast & COVID Impact Analysis
• Rest of Europe Market Forecast & COVID Impact Analysis
• Asia Pacific State of Charge (SoC) Market, 2021 to 2031 Market Outlook
• China State of Charge (SoC) Market, 2021 to 2031 Market Forecast & COVID Impact Analysis
• Japan State of Charge (SoC) Market, 2021 to 2031 Market Forecast & COVID Impact Analysis
• India State of Charge (SoC) Market, 2021 to 2031 Market Forecast & COVID Impact Analysis
• Australia State of Charge (SoC) Market, 2021 to 2031 Market Forecast & COVID Impact Analysis
• South Korea State of Charge (SoC) Market, 2021 to 2031 Market Forecast & COVID Impact Analysis
• Rest of Asia Pacific Market Forecast & COVID Impact Analysis
• LAMEA State of Charge (SoC) Market, 2021 to 2031 Market Outlook
• Brazil State of Charge (SoC) Market, 2021 to 2031 Market Forecast & COVID Impact Analysis
• Turkey State of Charge (SoC) Market, 2021 to 2031 Market Forecast & COVID Impact Analysis
• Saudi Arabia State of Charge (SoC) Market, 2021 to 2031 Market Forecast & COVID Impact Analysis
• South Africa State of Charge (SoC) Market, 2021 to 2031 Market Forecast & COVID Impact Analysis
• UAE State of Charge (SoC) Market, 2021 to 2031 Market Forecast & COVID Impact Analysis
• Rest of Latin America, Middle East and Africa
Need industry data? Please contact us today.
The report also includes profiles and for some of the leading companies in the State of Charge (SoC) Market, 2021 to 2031, with a focus on this segment of these companies’ operations.
Leading companies and the potential for market growth
• Philadelphia Scientific LLC
• Alpine Power Systems
• Battery Watering Technologies
• Texas Instruments
• Progressive Dynamics, Inc.
• Battery Clinic, Inc
• Global Digital Instruments
• Abler
• Encell Technology, Inc
• Materials Transportation Company
• Cellwatch Battery Monitoring
• Balmar DC Charging Solutions
• Xantrex
• Linklite Systems
• Victron Energy
• Mastervolt
• Blue Sea Systems
• Nasa Marine Limited
Overall world revenue for State of Charge (SoC) Market, 2021 to 2031 in terms of value the market will surpass US$xx million in 2021, our work calculates. We predict strong revenue growth through to 2031. Our work identifies which organizations hold the greatest potential. Discover their capabilities, progress, and commercial prospects, helping you stay ahead.
How the State of Charge (SoC) Market, 2021 to 2031 Market report helps you?
In summary, our 430-page report provides you with the following knowledge:
• Revenue forecasts to 2031 for State of Charge (SoC) Market, 2021 to 2031 Market, with forecasts for type, application, model, monitoring methods, each forecasted at a global and regional level– discover the industry’s prospects, finding the most lucrative places for investments and revenues
• Revenue forecasts to 2031 for 4 regional and 20 key national markets – See forecasts for the State of Charge (SoC) Market, 2021 to 2031 market in North America, Europe, Asia-Pacific and LAMEA. Also forecasted is the market in the US, Canada, Mexico, Brazil, Germany, France, UK, Italy, China, India, Japan, and Australia among other prominent economies.
• Prospects for established firms and those seeking to enter the market– including company profiles for 20 of the major companies involved in the State of Charge (SoC) Market, 2021 to 2031 Market.
Find quantitative and qualitative analyses with independent predictions. Receive information that only our report contains, staying informed with this invaluable business intelligence.
Information found nowhere else
With our newly report title, you are less likely to fall behind in knowledge or miss out on opportunities. See how our work could benefit your research, analyses, and decisions. Visiongain’s study is for everybody needing commercial analyses for the State of Charge (SoC) Market, 2021 to 2031 Market and leading companies. You will find data, trends and predictions.
To access the data contained in this document please email contactus@visiongain.com
Buy our report today State-of-Charge (SoC) Market Report 2021-2031: Forecasts by Type (State of Charge (SoC), Critical Surface Charge (CSC), State of Health), by Application (Battery Electric Vehicle (BEV), Plug-in Hybrid Electric Vehicle (PHEV), Hybrid Vehicle (HV), Energy Storage Battery, Other), by Model (Simple Battery Model, Advanced Simple Battery Model, Thevenin Battery Model, Modified Thevenin Battery Model, Third-Order Battery Model, Other), by Monitoring Methods (Open Circuit Voltage Method, Specific Gravity (SG) Method, Coulomb Counting Method, Impedance Measurement Method) AND Regional and Leading National Market Analysis PLUS Analysis of Leading SoC Companies AND COVID-19 Recovery Scenarios. Avoid missing out by staying informed – order our report now.
Visiongain is a trading partner with the US Federal Government
CCR Ref number: KD4R6
Do you have any custom requirements we can help you with? Any need for a specific country, geo region, market segment or specific company information? Contact us today, we can discuss your needs and see how we can help: sara.peerun@visiongain.com
1. Report Overview
1.1 Introduction to State-of-Charge (SoC) Market
1.2 Global State-of-Charge (SoC) Market Overview
1.3 What are the Objectives of this Report?
1.4 What is the Scope of the Report?
1.5 State-of-Charge (SoC) Market Definition
1.6 Why You Should Read This Report
1.7 What This Report Delivers
1.8 Key Questions Answered By This Analytical Report Include:
1.9 Who is This Report for?
1.10 Research Methodology
1.10.1 Primary Research
1.10.2 Secondary Research
1.10.3 Market Evaluation & Forecasting Methodology
1.11 Frequently Asked Questions (FAQs)
1.12 Associated Visiongain Reports
1.13 About Visiongain
2 Executive Summary
3 State-of-Charge (SoC) Industry Structure
3.1 Overview
3.2 Types Of Batteries
3.2.1 Lead-Acid Batteries
3.2.2 AGM (Absorbed Glass Mat) Batteries
3.2.3 Gel Cell Batteries
3.2.4 Lithium-Ion (Li-Ion) Battery
3.2.5 Nickel-Cadmium (Ni-Cd) Battery
3.2.6 Silver-Oxide Batteries
3.3 Battery Model Variables
3.3.1 Voltage
3.3.2 Capacity
3.3.3 Internal Resistance
3.3.4 Self-discharge
3.4 Battery Modeling Techniques
3.4.1 Electrochemical Models
3.4.2 Physical Models
3.4.3 Equivalent Circuit Models
3.5 The Flowchart Presenting The Algorithm SOC
3.6 Overview of SOC Estimating Mathematical Methods
3.6.1 Terminal Voltage Method.
3.6.2 Impedance Method.
3.6.3 Impedance Spectroscopy Method.
3.7 Overview of SOC and SOH Estimation Methods
3.7.1 Voltage Method
3.7.2 Kalman Filter Method
3.8 Battery SOC Measurement Principle
3.9 Battery State Of Charge Estimation
3.10 Battery Charging and Discharging Parameters
3.10.1 Battery State of Charge (BSOC)
3.10.2 Depth of Discharge
3.10.3 Daily Depth of Discharge
3.10.4 Charging and Discharging Rates
3.10.5 Charging and Discharging Regimes
3.11 Battery Technical Specifications
4 Global Market Outlook
4.1 Current Trends in the Global Market
4.2 Market Driving Factors
4.2.1 Enhance Technical Maturity Of The Battery
4.2.2 Developments in Lithinum Batteries
4.2.3 Develop New Applications For A Wider Variety Of Batteries
4.3 Market Restraining Factors
4.3.1 SOC Battery Industry Has Been Significantly Affected By Legislation
4.3.2 Production Scale Remains A Difficulty In Lithinum Batteries
4.3.3 Energy Density Of A Battery Is Restricted By Its Chemistry
4.4 Opportunities in the Global Market
4.4.1 Initiatives By The Government And Regulatory Bodies
4.4.2 Increasing The Use Of Battery In Wearable Technology
4.5 Challenges in the Global Market
4.5.1 The Power Density Of A Battery Is Critical For Electric Vehicle Efficiency.
4.5.2 Higher Cost And Sustainability
4.6 SWOT Analysis
4.6.1 Strength
4.6.2 Weakness
4.6.3 Opportunities
4.6.4 Threats
4.7 PEST Analysis
4.7.1 Political Factors
4.7.2 Economic Factors
4.7.3 Social Factors
4.7.4 Technological Factors
4.8 Porter’s Five Forces
4.8.1 Bargaining Power of Buyer
4.8.2 Threat of New Entrants
4.8.3 Bargaining Power of Suppliers
4.8.4 Threat of Substitutes
4.8.5 Competitive Rivalry
4.9 Covid-19 Impact on Industry
5 Global State-of-Charge (SoC) Market Analysis
5.1 Global Market Outlook
5.2 Global Market Size Estimation and Forecast
5.2.1 Pre-COVID-19 Market Scenario
5.2.2 Post-COVID-19 Market Scenarios (V, W, U, L-Shaped Recovery Analysis)
5.3 Regional Market Size Estimation and Forecast
5.3.1 Pre-COVID-19 Market Scenario
5.3.2 Post-COVID-19 Market Scenarios (V, W, U, L-Shaped Recovery Analysis)
6 Global Market Size Estimation and Forecast by Type
6.1 Segment Overview
6.1.1 State Of Charge
6.1.2 Critical Surface Charge (CSC)
6.1.3 State Of Health
6.2 Pre-COVID-19 Market Scenario
6.3 Post-COVID-19 Market Scenarios (V, W, U, L-Shaped Recovery Analysis)
7 Global Market Size Estimation and Forecast by Application
7.1 Trends And Developments In Electric Vehicle Markets
7.1.1 Europe
7.1.2 China
7.1.3 United States
7.1.4 Other Countries
7.2 Segment Overview
7.2.1 Battery Electric Vehicle (BEV)
7.2.2 Plug-in Hybrid Electric Vehicle (PHEV)
7.2.3 Hybrid Vehicle (HV)
7.2.4 Energy Storage Battery
7.3 Pre-COVID-19 Market Scenario
7.4 Post-COVID-19 Market Scenarios (V, W, U, L-Shaped Recovery Analysis)
8 Global Market Size Estimation and Forecast by Model
8.1 Segment Overview
8.1.1 Simple Battery Model
8.1.2 Advanced Simple Battery Model
8.1.3 Thevenin Battery Model
8.1.4 Modified Thevenin Battery Model
8.1.5 Third-Order Battery Model
8.2 Pre-COVID-19 Market Scenario
8.3 Post-COVID-19 Market Scenarios (V, W, U, L-Shaped Recovery Analysis)
9 Global Market Size Estimation and Forecast by Monitoring Methods
9.1 Segment Overview
9.1.1 Open Circuit Voltage Method
9.1.2 Specific Gravity (SG) Method
9.1.3 Coulomb Counting Method
9.1.4 Impedance Measurement Method
9.2 Pre-COVID-19 Market Scenario
9.3 Post-COVID-19 Market Scenarios (V, W, U, L-Shaped Recovery Analysis)
10 North America State-of-Charge (SoC) Market Analysis
10.1 North America Market Outlook
10.2 North America Market Size Estimation and Forecast
10.2.1 Pre-COVID-19 Market Scenario
10.2.2 Post-COVID-19 Market Scenarios (V, W, U, L-Shaped Recovery Analysis)
10.3 Country Market Size Estimation and Forecast
10.3.1 Pre-COVID-19 Market Scenario
10.3.2 Post-COVID-19 Market Scenarios (V, W, U, L-Shaped Recovery Analysis)
10.4 North America Market Size Estimation and Forecast by Type
10.4.1 Pre-COVID-19 Market Scenario
10.4.2 Post-COVID-19 Market Scenarios (V, W, U, L-Shaped Recovery Analysis)
10.5 North America Market Size Estimation and Forecast by Application
10.5.1 Pre-COVID-19 Market Scenario
10.5.2 Post-COVID-19 Market Scenarios (V, W, U, L-Shaped Recovery Analysis)
10.6 North America Market Size Estimation and Forecast by Model
10.6.1 Pre-COVID-19 Market Scenario
10.6.2 Post-COVID-19 Market Scenarios (V, W, U, L-Shaped Recovery Analysis)
10.7 North America Market Size Estimation and Forecast by Monitoring Methods
10.7.1 Pre-COVID-19 Market Scenario
10.7.2 Post-COVID-19 Market Scenarios (V, W, U, L-Shaped Recovery Analysis)
10.8 US State-of-Charge (SoC) Market Analysis
10.8.1 Rapidly Growing Use Of Batteries In U.S.
10.8.2 Energy Storage Battery Industry
10.8.3 Battery Development
10.8.4 Pre-COVID-19 Market Scenario
10.8.5 Post-COVID-19 Market Scenarios (V, W, U, L-Shaped Recovery Analysis)
10.9 Canada State-of-Charge (SoC) Market Analysis
10.9.1 Increasing Use Of Batteries in Canada
10.9.2 The Battery In Wearable Tech
10.9.3 A Battery Production
10.9.4 Pre-COVID-19 Market Scenario
10.9.5 Post-COVID-19 Market Scenarios (V, W, U, L-Shaped Recovery Analysis)
10.10 Mexico State-of-Charge (SoC) Market Analysis
10.10.1 Batteries Developments in Mexico
10.10.2 Pre-COVID-19 Market Scenario
10.10.3 Post-COVID-19 Market Scenarios (V, W, U, L-Shaped Recovery Analysis)
11 Europe State-of-Charge (SoC) Market Analysis
11.1 Europe Market Outlook
11.2 Europe Market Size Estimation and Forecast
11.2.1 Pre-COVID-19 Market Scenario
11.2.2 Post-COVID-19 Market Scenarios (V, W, U, L-Shaped Recovery Analysis)
11.3 Country Market Size Estimation and Forecast
11.3.1 Pre-COVID-19 Market Scenario
11.3.2 Post-COVID-19 Market Scenarios (V, W, U, L-Shaped Recovery Analysis)
11.4 Europe Market Size Estimation and Forecast by Type
11.4.1 Pre-COVID-19 Market Scenario
11.4.2 Post-COVID-19 Market Scenarios (V, W, U, L-Shaped Recovery Analysis)
11.5 Europe Market Size Estimation and Forecast by Application
11.5.1 Pre-COVID-19 Market Scenario
11.5.2 Post-COVID-19 Market Scenarios (V, W, U, L-Shaped Recovery Analysis)
11.6 Europe Market Size Estimation and Forecast by Model
11.6.1 Pre-COVID-19 Market Scenario
11.6.2 Post-COVID-19 Market Scenarios (V, W, U, L-Shaped Recovery Analysis)
11.7 Europe Market Size Estimation and Forecast by Monitoring Methods
11.7.1 Pre-COVID-19 Market Scenario
11.7.2 Post-COVID-19 Market Scenarios (V, W, U, L-Shaped Recovery Analysis)
11.8 Germany State-of-Charge (SoC) Market Analysis
11.8.1 Pre-COVID-19 Market Scenario
11.8.2 Post-COVID-19 Market Scenarios (V, W, U, L-Shaped Recovery Analysis)
11.9 UK State-of-Charge (SoC) Market Analysis
11.9.1 Pre-COVID-19 Market Scenario
11.9.2 Post-COVID-19 Market Scenarios (V, W, U, L-Shaped Recovery Analysis)
11.10 France State-of-Charge (SoC) Market Analysis
11.10.1 Pre-COVID-19 Market Scenario
11.10.2 Post-COVID-19 Market Scenarios (V, W, U, L-Shaped Recovery Analysis)
11.11 Italy State-of-Charge (SoC) Market Analysis
11.11.1 Pre-COVID-19 Market Scenario
11.11.2 Post-COVID-19 Market Scenarios (V, W, U, L-Shaped Recovery Analysis)
11.12 Spain State-of-Charge (SoC) Market Analysis
11.12.1 Pre-COVID-19 Market Scenario
11.12.2 Post-COVID-19 Market Scenarios (V, W, U, L-Shaped Recovery Analysis)
11.13 Rest of Europe State-of-Charge (SoC) Market Analysis
11.13.1 Pre-COVID-19 Market Scenario
11.13.2 Post-COVID-19 Market Scenarios (V, W, U, L-Shaped Recovery Analysis)
12 Asia-Pacific State-of-Charge (SoC) Market Analysis
12.1 Asia-Pacific Market Outlook
12.2 Asia-Pacific Market Size Estimation and Forecast
12.2.1 Pre-COVID-19 Market Scenario
12.2.2 Post-COVID-19 Market Scenarios (V, W, U, L-Shaped Recovery Analysis)
12.3 Country Market Size Estimation and Forecast
12.3.1 Pre-COVID-19 Market Scenario
12.3.2 Post-COVID-19 Market Scenarios (V, W, U, L-Shaped Recovery Analysis)
12.4 Asia-Pacific Market Size Estimation and Forecast by Type
12.4.1 Pre-COVID-19 Market Scenario
12.4.2 Post-COVID-19 Market Scenarios (V, W, U, L-Shaped Recovery Analysis)
12.5 Asia-Pacific Market Size Estimation and Forecast by Application
12.5.1 Pre-COVID-19 Market Scenario
12.5.2 Post-COVID-19 Market Scenarios (V, W, U, L-Shaped Recovery Analysis)
12.6 Asia-Pacific Market Size Estimation and Forecast by Model
12.6.1 Pre-COVID-19 Market Scenario
12.6.2 Post-COVID-19 Market Scenarios (V, W, U, L-Shaped Recovery Analysis)
12.7 Asia-Pacific Market Size Estimation and Forecast by Monitoring Methods
12.7.1 Pre-COVID-19 Market Scenario
12.7.2 Post-COVID-19 Market Scenarios (V, W, U, L-Shaped Recovery Analysis)
12.8 China State-of-Charge (SoC) Market Analysis
12.8.1 Pre-COVID-19 Market Scenario
12.8.2 Post-COVID-19 Market Scenarios (V, W, U, L-Shaped Recovery Analysis)
12.9 India State-of-Charge (SoC) Market Analysis
12.9.1 Pre-COVID-19 Market Scenario
12.9.2 Post-COVID-19 Market Scenarios (V, W, U, L-Shaped Recovery Analysis)
12.10 Japan State-of-Charge (SoC) Market Analysis
12.10.1 Pre-COVID-19 Market Scenario
12.10.2 Post-COVID-19 Market Scenarios (V, W, U, L-Shaped Recovery Analysis)
12.11 South Korea State-of-Charge (SoC) Market Analysis
12.11.1 Pre-COVID-19 Market Scenario
12.11.2 Post-COVID-19 Market Scenarios (V, W, U, L-Shaped Recovery Analysis)
12.12 Australia State-of-Charge (SoC) Market Analysis
12.12.1 Pre-COVID-19 Market Scenario
12.12.2 Post-COVID-19 Market Scenarios (V, W, U, L-Shaped Recovery Analysis)
12.13 Rest of Asia-Pacific State-of-Charge (SoC) Market Analysis
12.13.1 Pre-COVID-19 Market Scenario
12.13.2 Post-COVID-19 Market Scenarios (V, W, U, L-Shaped Recovery Analysis)
13 LAMEA State-of-Charge (SoC) Market Analysis
13.1 LAMEA Market Outlook
13.2 LAMEA Market Size Estimation and Forecast
13.2.1 Pre-COVID-19 Market Scenario
13.2.2 Post-COVID-19 Market Scenarios (V, W, U, L-Shaped Recovery Analysis)
13.3 Country Market Size Estimation and Forecast
13.3.1 Pre-COVID-19 Market Scenario
13.3.2 Post-COVID-19 Market Scenarios (V, W, U, L-Shaped Recovery Analysis)
13.4 LAMEA Market Size Estimation and Forecast by Type
13.4.1 Pre-COVID-19 Market Scenario
13.4.2 Post-COVID-19 Market Scenarios (V, W, U, L-Shaped Recovery Analysis)
13.5 LAMEA Market Size Estimation and Forecast by Application
13.5.1 Pre-COVID-19 Market Scenario
13.5.2 Post-COVID-19 Market Scenarios (V, W, U, L-Shaped Recovery Analysis)
13.6 LAMEA Market Size Estimation and Forecast by Model
13.6.1 Pre-COVID-19 Market Scenario
13.6.2 Post-COVID-19 Market Scenarios (V, W, U, L-Shaped Recovery Analysis)
13.7 LAMEA Market Size Estimation and Forecast by Monitoring Methods
13.7.1 Pre-COVID-19 Market Scenario
13.7.2 Post-COVID-19 Market Scenarios (V, W, U, L-Shaped Recovery Analysis)
13.8 Brazil State-of-Charge (SoC) Market Analysis
13.8.1 Pre-COVID-19 Market Scenario
13.8.2 Post-COVID-19 Market Scenarios (V, W, U, L-Shaped Recovery Analysis)
13.9 South Africa State-of-Charge (SoC) Market Analysis
13.9.1 Pre-COVID-19 Market Scenario
13.9.2 Post-COVID-19 Market Scenarios (V, W, U, L-Shaped Recovery Analysis)
13.10 Saudi Arabia State-of-Charge (SoC) Market Analysis
13.10.1 Pre-COVID-19 Market Scenario
13.10.2 Post-COVID-19 Market Scenarios (V, W, U, L-Shaped Recovery Analysis)
13.11 Turkey State-of-Charge (SoC) Market Analysis
13.11.1 Pre-COVID-19 Market Scenario
13.11.2 Post-COVID-19 Market Scenarios (V, W, U, L-Shaped Recovery Analysis)
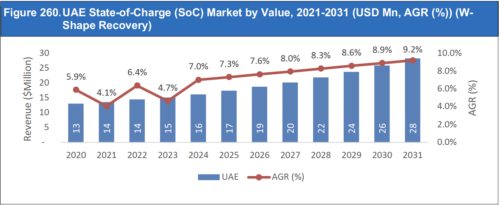
13.12 UAE State-of-Charge (SoC) Market Analysis
13.12.1 Pre-COVID-19 Market Scenario
13.12.2 Post-COVID-19 Market Scenarios (V, W, U, L-Shaped Recovery Analysis)
13.13 Rest of LAMEA State-of-Charge (SoC) Market Analysis
13.13.1 Pre-COVID-19 Market Scenario
13.13.2 Post-COVID-19 Market Scenarios (V, W, U, L-Shaped Recovery Analysis)
14 Leading Company Profiles
14.1 Company Market Share
14.2 Key Strategies Adopted By Manufacturers
14.3 Philadelphia Scientific LLC
14.3.1 Company Overview
14.3.2 Company Overview
14.3.3 Company Product Benchmarking
14.4 Alpine Power Systems
14.4.1 Company Snapshot
14.4.2 Company Overview
14.4.3 Company Product Benchmarking
14.4.4 Company Recent Developments
14.5 Battery Watering Technologies
14.5.1 Company Snapshot
14.5.2 Company Overview
14.5.3 Company Product Benchmarking
14.6 Texas Instruments
14.6.1 Company Snapshot
14.6.2 Company Overview
14.6.3 Company Financial Profile
14.6.4 Company Product Benchmarking
14.6.5 Company Recent Developments
14.7 Progressive Dynamics, Inc.
14.7.1 Company Snapshot
14.7.2 Company Overview
14.7.3 Company Product Benchmarking
14.8 Battery Clinic, Inc
14.8.1 Company Snapshot
14.8.2 Company Overview
14.8.3 Company Product Benchmarking
14.9 Global Digital Instruments
14.9.1 Company Snapshot
14.9.2 Company Overview
14.9.3 Company Product Benchmarking
14.10 Abler
14.10.1 Company Snapshot
14.10.2 Company Overview
14.10.3 Company Product Benchmarking
14.11 Encell Technology, Inc
14.11.1 Company Snapshot
14.11.2 Company Overview
14.11.3 Company Product Benchmarking
14.12 Materials Transportation Company
14.12.1 Company Snapshot
14.12.2 Company Overview
14.12.3 Company Product Benchmarking
14.13 Cellwatch Battery Monitoring
14.13.1 Company Snapshot
14.13.2 Company Overview
14.13.3 Company Product Benchmarking
14.14 Balmar DC Charging Solutions
14.14.1 Company Snapshot
14.14.2 Company Overview
14.14.3 Company Product Benchmarking
14.14.4 Company Recent Developments
14.15 Xantrex
14.15.1 Company Snapshot
14.15.2 Company Overview
14.15.3 Company Product Benchmarking
14.15.4 Company Recent Developments
14.16 Linklite Systems
14.16.1 Company Snapshot
14.16.2 Company Overview
14.16.3 Company Product Benchmarking
14.17 Victron Energy
14.17.1 Company Snapshot
14.17.2 Company Overview
14.17.3 Company Product Benchmarking
14.18 Mastervolt
14.18.1 Company Snapshot
14.18.2 Company Overview
14.18.3 Company Product Benchmarking
14.18.4 Company Recent Developments
14.19 Blue Sea Systems
14.19.1 Company Snapshot
14.19.2 Company Overview
14.19.3 Company Product Benchmarking
14.20 Nasa Marine Limited
14.20.1 Company Snapshot
14.20.2 Company Overview
14.20.3 Company Product Benchmarking
15 Conclusion and Recommendations
15.1 Concluding Remarks
15.2 Recommendations
16 Glossary Terms
List of Tables
Table 1. Global State-of-Charge (SoC) Market Forecast, 2021-2031 (USD Mn, AGR (%), CAGR(%))
Table 2. Global State-of-Charge (SoC) Market Snapshot, 2021 & 2031 (US$million, CAGR %)
Table 3. Global State-of-Charge (SoC) Market Forecast, 2021-2031 (USD Mn, AGR (%), CAGR(%))
Table 4. Global State-of-Charge (SoC) Market Forecast, 2021-2031 (USD Mn, AGR (%), CAGR(%))(V-Shape Recovery)
Table 5. Global State-of-Charge (SoC) Market Forecast, 2021-2031 (USD Mn, AGR (%), CAGR(%)) (W-Shape Recovery)
Table 6. Global State-of-Charge (SoC) Market Forecast, 2021-2031 (USD Mn, AGR (%), CAGR(%)) (U-Shape Recovery)
Table 7. Global State-of-Charge (SoC) Market Forecast, 2021-2031 (USD Mn, AGR (%), CAGR(%))(L-Shape Recovery)
Table 8. Global State-of-Charge (SoC) Market by Region, 2021-2031 (USD Mn, AGR (%), CAGR(%))
Table 9. Global State-of-Charge (SoC) Market by Region, 2021-2031 (USD Mn, AGR (%), CAGR(%))(V-Shape Recovery)
Table 10. Global State-of-Charge (SoC) Market by Region, 2021-2031 (USD Mn, AGR (%), CAGR(%)) (W-Shape Recovery)
Table 11. Global State-of-Charge (SoC) Market by Region, 2021-2031 (USD Mn, AGR (%), CAGR(%)) (U-Shape Recovery)
Table 12. Global State-of-Charge (SoC) Market by Region, 2021-2031 (USD Mn, AGR (%), CAGR(%)) (L-Shape Recovery)
Table 13. Global State-of-Charge (SoC) Market by Type, 2021-2031 (USD Mn, AGR (%), CAGR(%))
Table 14. Global State-of-Charge (SoC) Market by Type, 2021-2031 (USD Mn, AGR (%), CAGR(%))(V-Shape Recovery)
Table 15. Global State-of-Charge (SoC) Market by Type, 2021-2031 (USD Mn, AGR (%), CAGR(%)) (W-Shape Recovery)
Table 16. Global State-of-Charge (SoC) Market by Type, 2021-2031 (USD Mn, AGR (%), CAGR(%)) (U-Shape Recovery)
Table 17. Global State-of-Charge (SoC) Market by Type, 2021-2031 (USD Mn, AGR (%), CAGR(%)) (L-Shape Recovery)
Table 18. Global State-of-Charge (SoC) Market by Application, 2021-2031 (USD Mn, AGR (%), CAGR(%))
Table 19. Global State-of-Charge (SoC) Market by Application, 2021-2031 (USD Mn, AGR (%), CAGR(%))(V-Shape Recovery)
Table 20. Global State-of-Charge (SoC) Market by Application, 2021-2031 (USD Mn, AGR (%), CAGR(%)) (W-Shape Recovery)
Table 21. Global State-of-Charge (SoC) Market by Application, 2021-2031 (USD Mn, AGR (%), CAGR(%)) (U-Shape Recovery)
Table 22. Global State-of-Charge (SoC) Market by Application, 2021-2031 (USD Mn, AGR (%), CAGR(%)) (L-Shape Recovery)
Table 23. Global State-of-Charge (SoC) Market by Model, 2021-2031 (USD Mn, AGR (%), CAGR(%))
Table 24. Global State-of-Charge (SoC) Market by Model, 2021-2031 (USD Mn, AGR (%), CAGR(%))(V-Shape Recovery)
Table 25. Global State-of-Charge (SoC) Market by Model, 2021-2031 (USD Mn, AGR (%), CAGR(%)) (W-Shape Recovery)
Table 26. Global State-of-Charge (SoC) Market by Model, 2021-2031 (USD Mn, AGR (%), CAGR(%)) (U-Shape Recovery)
Table 27. Global State-of-Charge (SoC) Market by Model, 2021-2031 (USD Mn, AGR (%), CAGR(%)) (L-Shape Recovery)
Table 28. Global State-of-Charge (SoC) Market by Monitoring Methods, 2021-2031 (USD Mn, AGR (%), CAGR(%))
Table 29. Global State-of-Charge (SoC) Market by Monitoring Methods, 2021-2031 (USD Mn, AGR (%), CAGR(%))(V-Shape Recovery)
Table 30. Global State-of-Charge (SoC) Market by Monitoring Methods, 2021-2031 (USD Mn, AGR (%), CAGR(%)) (W-Shape Recovery)
Table 31. Global State-of-Charge (SoC) Market by Monitoring Methods, 2021-2031 (USD Mn, AGR (%), CAGR(%)) (U-Shape Recovery)
Table 32. Global State-of-Charge (SoC) Market by Monitoring Methods, 2021-2031 (USD Mn, AGR (%), CAGR(%)) (L-Shape Recovery)
Table 33. North America State-of-Charge (SoC) Market by Value, 2021-2031 (USD Mn, AGR (%), CAGR(%))
Table 34. North America State-of-Charge (SoC) Market by Value, 2021-2031 (USD Mn, AGR (%), CAGR(%))(V-Shape Recovery)
Table 35. North America State-of-Charge (SoC) Market by Value, 2021-2031 (USD Mn, AGR (%), CAGR(%)) (W-Shape Recovery)
Table 36. North America State-of-Charge (SoC) Market by Value, 2021-2031 (USD Mn, AGR (%), CAGR(%)) (U-Shape Recovery)
Table 37. North America State-of-Charge (SoC) Market by Value, 2021-2031 (USD Mn, AGR (%), CAGR(%)) (L-Shape Recovery)
Table 38. North America State-of-Charge (SoC) Market by Type, 2021-2031 (USD Mn, AGR (%), CAGR(%))
Table 39. North America State-of-Charge (SoC) Market by Type, 2021-2031 (USD Mn, AGR (%), CAGR(%))(V-Shape Recovery)
Table 40. North America State-of-Charge (SoC) Market by Type, 2021-2031 (USD Mn, AGR (%), CAGR(%)) (W-Shape Recovery)
Table 41. North America State-of-Charge (SoC) Market by Type, 2021-2031 (USD Mn, AGR (%), CAGR(%)) (U-Shape Recovery)
Table 42. North America State-of-Charge (SoC) Market by Type, 2021-2031 (USD Mn, AGR (%), CAGR(%)) (L-Shape Recovery)
Table 43. North America State-of-Charge (SoC) Market by Application, 2021-2031 (USD Mn, AGR (%), CAGR(%))
Table 44. North America State-of-Charge (SoC) Market by Application, 2021-2031 (USD Mn, AGR (%), CAGR(%))(V-Shape Recovery)
Table 45. North America State-of-Charge (SoC) Market by Application, 2021-2031 (USD Mn, AGR (%), CAGR(%)) (W-Shape Recovery)
Table 46. North America State-of-Charge (SoC) Market by Application, 2021-2031 (USD Mn, AGR (%), CAGR(%)) (U-Shape Recovery)
Table 47. North America State-of-Charge (SoC) Market by Application, 2021-2031 (USD Mn, AGR (%), CAGR(%)) (L-Shape Recovery)
Table 48. North America State-of-Charge (SoC) Market by Model, 2021-2031 (USD Mn, AGR (%), CAGR(%))
Table 49. North America State-of-Charge (SoC) Market by Model, 2021-2031 (USD Mn, AGR (%), CAGR(%))(V-Shape Recovery)
Table 50. North America State-of-Charge (SoC) Market by Model, 2021-2031 (USD Mn, AGR (%), CAGR(%)) (W-Shape Recovery)
Table 51. North America State-of-Charge (SoC) Market by Model, 2021-2031 (USD Mn, AGR (%), CAGR(%)) (U-Shape Recovery)
Table 52. North America State-of-Charge (SoC) Market by Model, 2021-2031 (USD Mn, AGR (%), CAGR(%)) (L-Shape Recovery)
Table 53. North America State-of-Charge (SoC) Market by Monitoring Methods, 2021-2031 (USD Mn, AGR (%), CAGR(%))
Table 54. North America State-of-Charge (SoC) Market by Monitoring Methods, 2021-2031 (USD Mn, AGR (%), CAGR(%))(V-Shape Recovery)
Table 55. North America State-of-Charge (SoC) Market by Monitoring Methods, 2021-2031 (USD Mn, AGR (%), CAGR(%)) (W-Shape Recovery)
Table 56. North America State-of-Charge (SoC) Market by Monitoring Methods, 2021-2031 (USD Mn, AGR (%), CAGR(%)) (U-Shape Recovery)
Table 57. North America State-of-Charge (SoC) Market by Monitoring Methods, 2021-2031 (USD Mn, AGR (%), CAGR(%)) (L-Shape Recovery)
Table 58. US State-of-Charge (SoC) Market by Value, 2021-2031 (USD Mn, AGR (%), CAGR(%))
Table 59. US State-of-Charge (SoC) Market by Value, 2021-2031 (USD Mn, AGR (%), CAGR(%))(V-Shape Recovery)
Table 60. US State-of-Charge (SoC) Market by Value, 2021-2031 (USD Mn, AGR (%), CAGR(%)) (W-Shape Recovery)
Table 61. US State-of-Charge (SoC) Market by Value, 2021-2031 (USD Mn, AGR (%), CAGR(%)) (U-Shape Recovery)
Table 62. US State-of-Charge (SoC) Market by Value, 2021-2031 (USD Mn, AGR (%), CAGR(%)) (L-Shape Recovery)
Table 63. Canada State-of-Charge (SoC) Market by Value, 2021-2031 (USD Mn, AGR (%), CAGR(%))
Table 64. Canada State-of-Charge (SoC) Market by Value, 2021-2031 (USD Mn, AGR (%), CAGR(%))(V-Shape Recovery)
Table 65. Canada State-of-Charge (SoC) Market by Value, 2021-2031 (USD Mn, AGR (%), CAGR(%)) (W-Shape Recovery)
Table 66. Canada State-of-Charge (SoC) Market by Value, 2021-2031 (USD Mn, AGR (%), CAGR(%)) (U-Shape Recovery)
Table 67. Canada State-of-Charge (SoC) Market by Value, 2021-2031 (USD Mn, AGR (%), CAGR(%)) (L-Shape Recovery)
Table 68. Mexico State-of-Charge (SoC) Market by Value, 2021-2031 (USD Mn, AGR (%), CAGR(%))
Table 69. Mexico State-of-Charge (SoC) Market by Value, 2021-2031 (USD Mn, AGR (%), CAGR(%))(V-Shape Recovery)
Table 70. Mexico State-of-Charge (SoC) Market by Value, 2021-2031 (USD Mn, AGR (%), CAGR(%)) (W-Shape Recovery)
Table 71. Mexico State-of-Charge (SoC) Market by Value, 2021-2031 (USD Mn, AGR (%), CAGR(%)) (U-Shape Recovery)
Table 72. Mexico State-of-Charge (SoC) Market by Value, 2021-2031 (USD Mn, AGR (%), CAGR(%)) (L-Shape Recovery)
Table 73. Europe State-of-Charge (SoC) Market by Value, 2021-2031 (USD Mn, AGR (%), CAGR(%))
Table 74. Europe State-of-Charge (SoC) Market by Value, 2021-2031 (USD Mn, AGR (%), CAGR(%))(V-Shape Recovery)
Table 75. Europe State-of-Charge (SoC) Market by Value, 2021-2031 (USD Mn, AGR (%), CAGR(%)) (W-Shape Recovery)
Table 76. Europe State-of-Charge (SoC) Market by Value, 2021-2031 (USD Mn, AGR (%), CAGR(%)) (U-Shape Recovery)
Table 77. Europe State-of-Charge (SoC) Market by Value, 2021-2031 (USD Mn, AGR (%), CAGR(%)) (L-Shape Recovery)
Table 78. Europe State-of-Charge (SoC) Market by Type, 2021-2031 (USD Mn, AGR (%), CAGR(%))
Table 79. Europe State-of-Charge (SoC) Market by Type, 2021-2031 (USD Mn, AGR (%), CAGR(%))(V-Shape Recovery)
Table 80. Europe State-of-Charge (SoC) Market by Type, 2021-2031 (USD Mn, AGR (%), CAGR(%)) (W-Shape Recovery)
Table 81. Europe State-of-Charge (SoC) Market by Type, 2021-2031 (USD Mn, AGR (%), CAGR(%)) (U-Shape Recovery)
Table 82. Europe State-of-Charge (SoC) Market by Type, 2021-2031 (USD Mn, AGR (%), CAGR(%)) (L-Shape Recovery)
Table 83. Europe State-of-Charge (SoC) Market by Application, 2021-2031 (USD Mn, AGR (%), CAGR(%))
Table 84. Europe State-of-Charge (SoC) Market by Application, 2021-2031 (USD Mn, AGR (%), CAGR(%))(V-Shape Recovery)
Table 85. Europe State-of-Charge (SoC) Market by Application, 2021-2031 (USD Mn, AGR (%), CAGR(%)) (W-Shape Recovery)
Table 86. Europe State-of-Charge (SoC) Market by Application, 2021-2031 (USD Mn, AGR (%), CAGR(%)) (U-Shape Recovery)
Table 87. Europe State-of-Charge (SoC) Market by Application, 2021-2031 (USD Mn, AGR (%), CAGR(%)) (L-Shape Recovery)
Table 88. Europe State-of-Charge (SoC) Market by Model, 2021-2031 (USD Mn, AGR (%), CAGR(%))
Table 89. Europe State-of-Charge (SoC) Market by Model, 2021-2031 (USD Mn, AGR (%), CAGR(%))(V-Shape Recovery)
Table 90. Europe State-of-Charge (SoC) Market by Model, 2021-2031 (USD Mn, AGR (%), CAGR(%)) (W-Shape Recovery)
Table 91. Europe State-of-Charge (SoC) Market by Model, 2021-2031 (USD Mn, AGR (%), CAGR(%)) (U-Shape Recovery)
Table 92. Europe State-of-Charge (SoC) Market by Model, 2021-2031 (USD Mn, AGR (%), CAGR(%)) (L-Shape Recovery)
Table 93. Europe State-of-Charge (SoC) Market by Monitoring Methods, 2021-2031 (USD Mn, AGR (%), CAGR(%))
Table 94. Europe State-of-Charge (SoC) Market by Monitoring Methods, 2021-2031 (USD Mn, AGR (%), CAGR(%))(V-Shape Recovery)
Table 95. Europe State-of-Charge (SoC) Market by Monitoring Methods, 2021-2031 (USD Mn, AGR (%), CAGR(%)) (W-Shape Recovery)
Table 96. Europe State-of-Charge (SoC) Market by Monitoring Methods, 2021-2031 (USD Mn, AGR (%), CAGR(%)) (U-Shape Recovery)
Table 97. Europe State-of-Charge (SoC) Market by Monitoring Methods, 2021-2031 (USD Mn, AGR (%), CAGR(%)) (L-Shape Recovery)
Table 98. Germany State-of-Charge (SoC) Market by Value, 2021-2031 (USD Mn, AGR (%), CAGR(%))
Table 99. Germany State-of-Charge (SoC) Market by Value, 2021-2031 (USD Mn, AGR (%), CAGR(%))(V-Shape Recovery)
Table 100. Germany State-of-Charge (SoC) Market by Value, 2021-2031 (USD Mn, AGR (%), CAGR(%)) (W-Shape Recovery)
Table 101. Germany State-of-Charge (SoC) Market by Value, 2021-2031 (USD Mn, AGR (%), CAGR(%)) (U-Shape Recovery)
Table 102. Germany State-of-Charge (SoC) Market by Value, 2021-2031 (USD Mn, AGR (%), CAGR(%)) (L-Shape Recovery)
Table 103. UK State-of-Charge (SoC) Market by Value, 2021-2031 (USD Mn, AGR (%), CAGR(%))
Table 104. UK State-of-Charge (SoC) Market by Value, 2021-2031 (USD Mn, AGR (%), CAGR(%))(V-Shape Recovery)
Table 105. UK State-of-Charge (SoC) Market by Value, 2021-2031 (USD Mn, AGR (%), CAGR(%)) (W-Shape Recovery)
Table 106. UK State-of-Charge (SoC) Market by Value, 2021-2031 (USD Mn, AGR (%), CAGR(%)) (U-Shape Recovery)
Table 107. UK State-of-Charge (SoC) Market by Value, 2021-2031 (USD Mn, AGR (%), CAGR(%)) (L-Shape Recovery)
Table 108. France State-of-Charge (SoC) Market by Value, 2021-2031 (USD Mn, AGR (%), CAGR(%))
Table 109. France State-of-Charge (SoC) Market by Value, 2021-2031 (USD Mn, AGR (%), CAGR(%))(V-Shape Recovery)
Table 110. France State-of-Charge (SoC) Market by Value, 2021-2031 (USD Mn, AGR (%), CAGR(%)) (W-Shape Recovery)
Table 111. France State-of-Charge (SoC) Market by Value, 2021-2031 (USD Mn, AGR (%), CAGR(%)) (U-Shape Recovery)
Table 112. France State-of-Charge (SoC) Market by Value, 2021-2031 (USD Mn, AGR (%), CAGR(%)) (L-Shape Recovery)
Table 113. Italy State-of-Charge (SoC) Market by Value, 2021-2031 (USD Mn, AGR (%), CAGR(%))
Table 114. Italy State-of-Charge (SoC) Market by Value, 2021-2031 (USD Mn, AGR (%), CAGR(%))(V-Shape Recovery)
Table 115. Italy State-of-Charge (SoC) Market by Value, 2021-2031 (USD Mn, AGR (%), CAGR(%)) (W-Shape Recovery)
Table 116. Italy State-of-Charge (SoC) Market by Value, 2021-2031 (USD Mn, AGR (%), CAGR(%)) (U-Shape Recovery)
Table 117. Italy State-of-Charge (SoC) Market by Value, 2021-2031 (USD Mn, AGR (%), CAGR(%)) (L-Shape Recovery)
Table 118. Spain State-of-Charge (SoC) Market by Value, 2021-2031 (USD Mn, AGR (%), CAGR(%))
Table 119. Spain State-of-Charge (SoC) Market by Value, 2021-2031 (USD Mn, AGR (%), CAGR(%))(V-Shape Recovery)
Table 120. Spain State-of-Charge (SoC) Market by Value, 2021-2031 (USD Mn, AGR (%), CAGR(%)) (W-Shape Recovery)
Table 121. Spain State-of-Charge (SoC) Market by Value, 2021-2031 (USD Mn, AGR (%), CAGR(%)) (U-Shape Recovery)
Table 122. Spain State-of-Charge (SoC) Market by Value, 2021-2031 (USD Mn, AGR (%), CAGR(%)) (L-Shape Recovery)
Table 123. Rest of Europe State-of-Charge (SoC) Market by Value, 2021-2031 (USD Mn, AGR (%), CAGR(%))
Table 124. Rest of Europe State-of-Charge (SoC) Market by Value, 2021-2031 (USD Mn, AGR (%), CAGR(%))(V-Shape Recovery)
Table 125. Rest of Europe State-of-Charge (SoC) Market by Value, 2021-2031 (USD Mn, AGR (%), CAGR(%)) (W-Shape Recovery)
Table 126. Rest of Europe State-of-Charge (SoC) Market by Value, 2021-2031 (USD Mn, AGR (%), CAGR(%)) (U-Shape Recovery)
Table 127. Rest of Europe State-of-Charge (SoC) Market by Value, 2021-2031 (USD Mn, AGR (%), CAGR(%)) (L-Shape Recovery)
Table 128. Asia-Pacific State-of-Charge (SoC) Market by Value, 2021-2031 (USD Mn, AGR (%), CAGR(%))
Table 129. Asia-Pacific State-of-Charge (SoC) Market by Value, 2021-2031 (USD Mn, AGR (%), CAGR(%))(V-Shape Recovery)
Table 130. Asia-Pacific State-of-Charge (SoC) Market by Value, 2021-2031 (USD Mn, AGR (%), CAGR(%)) (W-Shape Recovery)
Table 131. Asia-Pacific State-of-Charge (SoC) Market by Value, 2021-2031 (USD Mn, AGR (%), CAGR(%)) (U-Shape Recovery)
Table 132. Asia-Pacific State-of-Charge (SoC) Market by Value, 2021-2031 (USD Mn, AGR (%), CAGR(%)) (L-Shape Recovery)
Table 133. Asia-Pacific State-of-Charge (SoC) Market by Type, 2021-2031 (USD Mn, AGR (%), CAGR(%))
Table 134. Asia-Pacific State-of-Charge (SoC) Market by Type, 2021-2031 (USD Mn, AGR (%), CAGR(%))(V-Shape Recovery)
Table 135. Asia-Pacific State-of-Charge (SoC) Market by Type, 2021-2031 (USD Mn, AGR (%), CAGR(%)) (W-Shape Recovery)
Table 136. Asia-Pacific State-of-Charge (SoC) Market by Type, 2021-2031 (USD Mn, AGR (%), CAGR(%)) (U-Shape Recovery)
Table 137. Asia-Pacific State-of-Charge (SoC) Market by Type, 2021-2031 (USD Mn, AGR (%), CAGR(%)) (L-Shape Recovery)
Table 138. Asia-Pacific State-of-Charge (SoC) Market by Application, 2021-2031 (USD Mn, AGR (%), CAGR(%))
Table 139. Asia-Pacific State-of-Charge (SoC) Market by Application, 2021-2031 (USD Mn, AGR (%), CAGR(%))(V-Shape Recovery)
Table 140. Asia-Pacific State-of-Charge (SoC) Market by Application, 2021-2031 (USD Mn, AGR (%), CAGR(%)) (W-Shape Recovery)
Table 141. Asia-Pacific State-of-Charge (SoC) Market by Application, 2021-2031 (USD Mn, AGR (%), CAGR(%)) (U-Shape Recovery)
Table 142. Asia-Pacific State-of-Charge (SoC) Market by Application, 2021-2031 (USD Mn, AGR (%), CAGR(%)) (L-Shape Recovery)
Table 143. Asia-Pacific State-of-Charge (SoC) Market by Model, 2021-2031 (USD Mn, AGR (%), CAGR(%))
Table 144. Asia-Pacific State-of-Charge (SoC) Market by Model, 2021-2031 (USD Mn, AGR (%), CAGR(%))(V-Shape Recovery)
Table 145. Asia-Pacific State-of-Charge (SoC) Market by Model, 2021-2031 (USD Mn, AGR (%), CAGR(%)) (W-Shape Recovery)
Table 146. Asia-Pacific State-of-Charge (SoC) Market by Model, 2021-2031 (USD Mn, AGR (%), CAGR(%)) (U-Shape Recovery)
Table 147. Asia-Pacific State-of-Charge (SoC) Market by Model, 2021-2031 (USD Mn, AGR (%), CAGR(%)) (L-Shape Recovery)
Table 148. Asia-Pacific State-of-Charge (SoC) Market by Monitoring Methods, 2021-2031 (USD Mn, AGR (%), CAGR(%))
Table 149. Asia-Pacific State-of-Charge (SoC) Market by Monitoring Methods, 2021-2031 (USD Mn, AGR (%), CAGR(%))(V-Shape Recovery)
Table 150. Asia-Pacific State-of-Charge (SoC) Market by Monitoring Methods, 2021-2031 (USD Mn, AGR (%), CAGR(%)) (W-Shape Recovery)
Table 151. Asia-Pacific State-of-Charge (SoC) Market by Monitoring Methods, 2021-2031 (USD Mn, AGR (%), CAGR(%)) (U-Shape Recovery)
Table 152. Asia-Pacific State-of-Charge (SoC) Market by Monitoring Methods, 2021-2031 (USD Mn, AGR (%), CAGR(%)) (L-Shape Recovery)
Table 153. China State-of-Charge (SoC) Market by Value, 2021-2031 (USD Mn, AGR (%), CAGR(%))
Table 154. China State-of-Charge (SoC) Market by Value, 2021-2031 (USD Mn, AGR (%), CAGR(%))(V-Shape Recovery)
Table 155. China State-of-Charge (SoC) Market by Value, 2021-2031 (USD Mn, AGR (%), CAGR(%)) (W-Shape Recovery)
Table 156. China State-of-Charge (SoC) Market by Value, 2021-2031 (USD Mn, AGR (%), CAGR(%)) (U-Shape Recovery)
Table 157. China State-of-Charge (SoC) Market by Value, 2021-2031 (USD Mn, AGR (%), CAGR(%)) (L-Shape Recovery)
Table 158. India State-of-Charge (SoC) Market by Value, 2021-2031 (USD Mn, AGR (%), CAGR(%))
Table 159. India State-of-Charge (SoC) Market by Value, 2021-2031 (USD Mn, AGR (%), CAGR(%))(V-Shape Recovery)
Table 160. India State-of-Charge (SoC) Market by Value, 2021-2031 (USD Mn, AGR (%), CAGR(%)) (W-Shape Recovery)
Table 161. India State-of-Charge (SoC) Market by Value, 2021-2031 (USD Mn, AGR (%), CAGR(%)) (U-Shape Recovery)
Table 162. India State-of-Charge (SoC) Market by Value, 2021-2031 (USD Mn, AGR (%), CAGR(%)) (L-Shape Recovery)
Table 163. Japan State-of-Charge (SoC) Market by Value, 2021-2031 (USD Mn, AGR (%), CAGR(%))
Table 164. Japan State-of-Charge (SoC) Market by Value, 2021-2031 (USD Mn, AGR (%), CAGR(%))(V-Shape Recovery)
Table 165. Japan State-of-Charge (SoC) Market by Value, 2021-2031 (USD Mn, AGR (%), CAGR(%)) (W-Shape Recovery)
Table 166. Japan State-of-Charge (SoC) Market by Value, 2021-2031 (USD Mn, AGR (%), CAGR(%)) (U-Shape Recovery)
Table 167. Japan State-of-Charge (SoC) Market by Value, 2021-2031 (USD Mn, AGR (%), CAGR(%)) (L-Shape Recovery)
Table 168. South Korea State-of-Charge (SoC) Market by Value, 2021-2031 (USD Mn, AGR (%), CAGR(%))
Table 169. South Korea State-of-Charge (SoC) Market by Value, 2021-2031 (USD Mn, AGR (%), CAGR(%))(V-Shape Recovery)
Table 170. South Korea State-of-Charge (SoC) Market by Value, 2021-2031 (USD Mn, AGR (%), CAGR(%)) (W-Shape Recovery)
Table 171. South Korea State-of-Charge (SoC) Market by Value, 2021-2031 (USD Mn, AGR (%), CAGR(%)) (U-Shape Recovery)
Table 172. South Korea State-of-Charge (SoC) Market by Value, 2021-2031 (USD Mn, AGR (%), CAGR(%)) (L-Shape Recovery)
Table 173. Australia State-of-Charge (SoC) Market by Value, 2021-2031 (USD Mn, AGR (%), CAGR(%))
Table 174. Australia State-of-Charge (SoC) Market by Value, 2021-2031 (USD Mn, AGR (%), CAGR(%))(V-Shape Recovery)
Table 175. Australia State-of-Charge (SoC) Market by Value, 2021-2031 (USD Mn, AGR (%), CAGR(%)) (W-Shape Recovery)
Table 176. Australia State-of-Charge (SoC) Market by Value, 2021-2031 (USD Mn, AGR (%), CAGR(%)) (U-Shape Recovery)
Table 177. Australia State-of-Charge (SoC) Market by Value, 2021-2031 (USD Mn, AGR (%), CAGR(%)) (L-Shape Recovery)
Table 178. Rest of Asia-Pacific State-of-Charge (SoC) Market by Value, 2021-2031 (USD Mn, AGR (%), CAGR(%))
Table 179. Rest of Asia-Pacific State-of-Charge (SoC) Market by Value, 2021-2031 (USD Mn, AGR (%), CAGR(%))(V-Shape Recovery)
Table 180. Rest of Asia-Pacific State-of-Charge (SoC) Market by Value, 2021-2031 (USD Mn, AGR (%), CAGR(%)) (W-Shape Recovery)
Table 181. Rest of Asia-Pacific State-of-Charge (SoC) Market by Value, 2021-2031 (USD Mn, AGR (%), CAGR(%)) (U-Shape Recovery)
Table 182. Rest of Asia-Pacific State-of-Charge (SoC) Market by Value, 2021-2031 (USD Mn, AGR (%), CAGR(%)) (L-Shape Recovery)
Table 183. LAMEA State-of-Charge (SoC) Market by Value, 2021-2031 (USD Mn, AGR (%), CAGR(%))
Table 184. LAMEA State-of-Charge (SoC) Market by Value, 2021-2031 (USD Mn, AGR (%), CAGR(%))(V-Shape Recovery)
Table 185. LAMEA State-of-Charge (SoC) Market by Value, 2021-2031 (USD Mn, AGR (%), CAGR(%)) (W-Shape Recovery)
Table 186. LAMEA State-of-Charge (SoC) Market by Value, 2021-2031 (USD Mn, AGR (%), CAGR(%)) (U-Shape Recovery)
Table 187. LAMEA State-of-Charge (SoC) Market by Value, 2021-2031 (USD Mn, AGR (%), CAGR(%)) (L-Shape Recovery)
Table 188. LAMEA State-of-Charge (SoC) Market by Type, 2021-2031 (USD Mn, AGR (%), CAGR(%))
Table 189. LAMEA State-of-Charge (SoC) Market by Type, 2021-2031 (USD Mn, AGR (%), CAGR(%))(V-Shape Recovery)
Table 190. LAMEA State-of-Charge (SoC) Market by Type, 2021-2031 (USD Mn, AGR (%), CAGR(%)) (W-Shape Recovery)
Table 191. LAMEA State-of-Charge (SoC) Market by Type, 2021-2031 (USD Mn, AGR (%), CAGR(%)) (U-Shape Recovery)
Table 192. LAMEA State-of-Charge (SoC) Market by Type, 2021-2031 (USD Mn, AGR (%), CAGR(%)) (L-Shape Recovery)
Table 193. LAMEA State-of-Charge (SoC) Market by Application, 2021-2031 (USD Mn, AGR (%), CAGR(%))
Table 194. LAMEA State-of-Charge (SoC) Market by Application, 2021-2031 (USD Mn, AGR (%), CAGR(%))(V-Shape Recovery)
Table 195. LAMEA State-of-Charge (SoC) Market by Application, 2021-2031 (USD Mn, AGR (%), CAGR(%)) (W-Shape Recovery)
Table 196. LAMEA State-of-Charge (SoC) Market by Application, 2021-2031 (USD Mn, AGR (%), CAGR(%)) (U-Shape Recovery)
Table 197. LAMEA State-of-Charge (SoC) Market by Application, 2021-2031 (USD Mn, AGR (%), CAGR(%)) (L-Shape Recovery)
Table 198. LAMEA State-of-Charge (SoC) Market by Model, 2021-2031 (USD Mn, AGR (%), CAGR(%))
Table 199. LAMEA State-of-Charge (SoC) Market by Model, 2021-2031 (USD Mn, AGR (%), CAGR(%))(V-Shape Recovery)
Table 200. LAMEA State-of-Charge (SoC) Market by Model, 2021-2031 (USD Mn, AGR (%), CAGR(%)) (W-Shape Recovery)
Table 201. LAMEA State-of-Charge (SoC) Market by Model, 2021-2031 (USD Mn, AGR (%), CAGR(%)) (U-Shape Recovery)
Table 202. LAMEA State-of-Charge (SoC) Market by Model, 2021-2031 (USD Mn, AGR (%), CAGR(%)) (L-Shape Recovery)
Table 203. LAMEA State-of-Charge (SoC) Market by Monitoring Methods, 2021-2031 (USD Mn, AGR (%), CAGR(%))
Table 204. LAMEA State-of-Charge (SoC) Market by Monitoring Methods, 2021-2031 (USD Mn, AGR (%), CAGR(%))(V-Shape Recovery)
Table 205. LAMEA State-of-Charge (SoC) Market by Monitoring Methods, 2021-2031 (USD Mn, AGR (%), CAGR(%)) (W-Shape Recovery)
Table 206. LAMEA State-of-Charge (SoC) Market by Monitoring Methods, 2021-2031 (USD Mn, AGR (%), CAGR(%)) (U-Shape Recovery)
Table 207. LAMEA State-of-Charge (SoC) Market by Monitoring Methods, 2021-2031 (USD Mn, AGR (%), CAGR(%)) (L-Shape Recovery)
Table 208. Brazil State-of-Charge (SoC) Market by Value, 2021-2031 (USD Mn, AGR (%), CAGR(%))
Table 209. Brazil State-of-Charge (SoC) Market by Value, 2021-2031 (USD Mn, AGR (%), CAGR(%))(V-Shape Recovery)
Table 210. Brazil State-of-Charge (SoC) Market by Value, 2021-2031 (USD Mn, AGR (%), CAGR(%)) (W-Shape Recovery)
Table 211. Brazil State-of-Charge (SoC) Market by Value, 2021-2031 (USD Mn, AGR (%), CAGR(%)) (U-Shape Recovery)
Table 212. Brazil State-of-Charge (SoC) Market by Value, 2021-2031 (USD Mn, AGR (%), CAGR(%)) (L-Shape Recovery)
Table 213. South Africa State-of-Charge (SoC) Market by Value, 2021-2031 (USD Mn, AGR (%), CAGR(%))
Table 214. South Africa State-of-Charge (SoC) Market by Value, 2021-2031 (USD Mn, AGR (%), CAGR(%))(V-Shape Recovery)
Table 215. South Africa State-of-Charge (SoC) Market by Value, 2021-2031 (USD Mn, AGR (%), CAGR(%)) (W-Shape Recovery)
Table 216. South Africa State-of-Charge (SoC) Market by Value, 2021-2031 (USD Mn, AGR (%), CAGR(%)) (U-Shape Recovery)
Table 217. South Africa State-of-Charge (SoC) Market by Value, 2021-2031 (USD Mn, AGR (%), CAGR(%)) (L-Shape Recovery)
Table 218. Saudi Arabia State-of-Charge (SoC) Market by Value, 2021-2031 (USD Mn, AGR (%), CAGR(%))
Table 219. Saudi Arabia State-of-Charge (SoC) Market by Value, 2021-2031 (USD Mn, AGR (%), CAGR(%))(V-Shape Recovery)
Table 220. Saudi Arabia State-of-Charge (SoC) Market by Value, 2021-2031 (USD Mn, AGR (%), CAGR(%)) (W-Shape Recovery)
Table 221. Saudi Arabia State-of-Charge (SoC) Market by Value, 2021-2031 (USD Mn, AGR (%), CAGR(%)) (U-Shape Recovery)
Table 222. Saudi Arabia State-of-Charge (SoC) Market by Value, 2021-2031 (USD Mn, AGR (%), CAGR(%)) (L-Shape Recovery)
Table 223. Turkey State-of-Charge (SoC) Market by Value, 2021-2031 (USD Mn, AGR (%), CAGR(%))
Table 224. Turkey State-of-Charge (SoC) Market by Value, 2021-2031 (USD Mn, AGR (%), CAGR(%))(V-Shape Recovery)
Table 225. Turkey State-of-Charge (SoC) Market by Value, 2021-2031 (USD Mn, AGR (%), CAGR(%)) (W-Shape Recovery)
Table 226. Turkey State-of-Charge (SoC) Market by Value, 2021-2031 (USD Mn, AGR (%), CAGR(%)) (U-Shape Recovery)
Table 227. Turkey State-of-Charge (SoC) Market by Value, 2021-2031 (USD Mn, AGR (%), CAGR(%)) (L-Shape Recovery)
Table 228. UAE State-of-Charge (SoC) Market by Value, 2021-2031 (USD Mn, AGR (%), CAGR(%))
Table 229. UAE State-of-Charge (SoC) Market by Value, 2021-2031 (USD Mn, AGR (%), CAGR(%))(V-Shape Recovery)
Table 230. UAE State-of-Charge (SoC) Market by Value, 2021-2031 (USD Mn, AGR (%), CAGR(%)) (W-Shape Recovery)
Table 231. UAE State-of-Charge (SoC) Market by Value, 2021-2031 (USD Mn, AGR (%), CAGR(%)) (U-Shape Recovery)
Table 232. UAE State-of-Charge (SoC) Market by Value, 2021-2031 (USD Mn, AGR (%), CAGR(%)) (L-Shape Recovery)
Table 233. Rest of LAMEA State-of-Charge (SoC) Market by Value, 2021-2031 (USD Mn, AGR (%), CAGR(%))
Table 234. Rest of LAMEA State-of-Charge (SoC) Market by Value, 2021-2031 (USD Mn, AGR (%), CAGR(%))(V-Shape Recovery)
Table 235. Rest of LAMEA State-of-Charge (SoC) Market by Value, 2021-2031 (USD Mn, AGR (%), CAGR(%)) (W-Shape Recovery)
Table 236. Rest of LAMEA State-of-Charge (SoC) Market by Value, 2021-2031 (USD Mn, AGR (%), CAGR(%)) (U-Shape Recovery)
Table 237. Rest of LAMEA State-of-Charge (SoC) Market by Value, 2021-2031 (USD Mn, AGR (%), CAGR(%)) (L-Shape Recovery)
Table 238. Key Strategy Adopted by Key Players in Global State of Charge (SoC) Market, 2018-2021
Table 239. Philadelphia Scientific LLC Company Information
Table 240. Philadelphia Scientific LLC: Company Product and Service Benchmarking
Table 241. Alpine Power Systems.: Company Information
Table 242. Alpine Power Systems.: Company Product and Service
Table 243. Alpine Power Systems Company Recent Developments till Feb,2021
Table 244. Battery Watering Technologies.: Company Information
Table 245. Texas Instruments.: Company Information
Table 246. Texas Instruments.: Company Revenue 2016-2020(US$Mn, AGR %)
Table 247. Texas Instruments.: Company Product and Service
Table 248. Texas Instruments Company Recent Developments till Feb,2021
Table 249. Progressive Dynamics, Inc.: Company Information
Table 250. Progressive Dynamics, Inc.: Company Product and Service Benchmarking
Table 251. Battery Clinic, Inc: Company Information
Table 252. Battery Clinic, Inc: Company Product and Service
Table 253. Global Digital Instruments.: Company Information
Table 254. Global Digital Instruments.: Company Product and Service Benchmarking
Table 255. Alber.: Company Information
Table 256. Abler.: Company Product and Service
Table 257. Encell Technology, Inc: Company Information
Table 258. Encell Technology, Inc: Company Product and Service Benchmarking
Table 259. Materials Transportation Company: Company Information
Table 260. Materials Transportation Company: Company Product and Service Benchmarking
Table 261. Cellwatch Battery Monitoring.: Company Information
Table 262. Balmar DC Charging Solutions: Company Information
Table 263. Balmar DC Charging Solutions : Company Product and Service Benchmarking
Table 264. Balmar DC Charging Solutions : Company Recent Developments till Feb,2020
Table 265. Xantrex.: Company Information
Table 266. Xantrex : Company Product and Service Benchmarking
Table 267. Xantrex Recent Developments till Feb,2021
Table 268. Linklite Systems: Company Information
Table 269. Linklite Systems: Company Product and Service Benchmarking
Table 270. Victron Energy: Company Information
Table 271. Victron Energy: Company Product and Service Benchmarking
Table 272. Mastervolt: Company Information
Table 273. Mastervolt: Company Product and Service Benchmarking
Table 274. Mastervolt: Recent Developments till Apr,2021
Table 275. Blue Sea Systems: Company Information
Table 276. Blue Sea Systems : Company Product and Service Benchmarking
Table 277. Nasa Marine Limited.: Company Information
Table 278. Nasa Marine Limited.: Company Product and Service Benchmarking
List of Figures
Figure 1. Global State-of-Charge (SoC) Market Forecast, 2021-2031 (USD Mn, AGR (%))
Figure 2. Global State-of-Charge (SoC) Market Segmentation
Figure 3. Lead-Acid Batteries
Figure 4. Flowchart Presenting the algorithm of SOC
Figure 5. Current Trends in the Global Market
Figure 6. SWOT Analysis
Figure 7. PEST Analysis
Figure 8. Porters Five Forces
Figure 9. Global State-of-Charge (SoC) Market Forecast, 2021-2031 (USD Mn, AGR (%))
Figure 10. Global State-of-Charge (SoC) Market Forecast, 2021-2031 (USD Mn, AGR (%))(V-Shape Recovery)
Figure 11. Global State-of-Charge (SoC) Market Forecast, 2021-2031 (USD Mn, AGR (%)) (W-Shape Recovery)
Figure 12. Global State-of-Charge (SoC) Market Forecast, 2021-2031 (USD Mn, AGR (%)) (U-Shape Recovery)
Figure 13. Global State-of-Charge (SoC) Market Forecast, 2021-2031 (USD Mn, AGR (%)) (L-Shape Recovery)
Figure 14. Global State-of-Charge (SoC) Market by Region, 2021-2031 (USD Mn, AGR (%))
Figure 15. Global State-of-Charge (SoC) Market by Region, 2021-2031 (USD Mn, AGR (%))(V-Shape Recovery)
Figure 16. Global State-of-Charge (SoC) Market by Region, 2021-2031 (USD Mn, AGR (%)) (W-Shape Recovery)
Figure 17. Global State-of-Charge (SoC) Market by Region, 2021-2031 (USD Mn, AGR (%)) (U-Shape Recovery)
Figure 18. Global State-of-Charge (SoC) Market by Region, 2021-2031 (USD Mn, AGR (%)) (L-Shape Recovery)
Figure 19. Global State-of-Charge (SoC) Market by Type, 2021-2031 (USD Mn, AGR (%))
Figure 20. Global State-of-Charge (SoC) Market by Type, 2021-2031 (USD Mn, AGR (%))(V-Shape Recovery)
Figure 21. Global State-of-Charge (SoC) Market by Type, 2021-2031 (USD Mn, AGR (%)) (W-Shape Recovery)
Figure 22. Global State-of-Charge (SoC) Market by Type, 2021-2031 (USD Mn, AGR (%)) (U-Shape Recovery)
Figure 23. Global State-of-Charge (SoC) Market by Type, 2021-2031 (USD Mn, AGR (%)) (L-Shape Recovery)
Figure 24. Global State-of-Charge (SoC) Market by Application, 2021-2031 (USD Mn, AGR (%))
Figure 25. Global State-of-Charge (SoC) Market by Application, 2021-2031 (USD Mn, AGR (%))
Figure 26. Global State-of-Charge (SoC) Market by Application, 2021-2031 (USD Mn, AGR (%))(V-Shape Recovery)
Figure 27. Global State-of-Charge (SoC) Market by Application, 2021-2031 (USD Mn, AGR (%)) (W-Shape Recovery)
Figure 28. Global State-of-Charge (SoC) Market by Application, 2021-2031 (USD Mn, AGR (%)) (U-Shape Recovery)
Figure 29. Global State-of-Charge (SoC) Market by Application, 2021-2031 (USD Mn, AGR (%)) (L-Shape Recovery)
Figure 30. Simple Battery Model
Figure 31. Thevenin Battery Model
Figure 32. Modified Thevenin Battery Model
Figure 33. Third-Order Battery Model
Figure 34. Global State-of-Charge (SoC) Market by Model, 2021-2031 (USD Mn, AGR (%))
Figure 35. Global State-of-Charge (SoC) Market by Model, 2021-2031 (USD Mn, AGR (%))(V-Shape Recovery)
Figure 36. Global State-of-Charge (SoC) Market by Model, 2021-2031 (USD Mn, AGR (%)) (W-Shape Recovery)
Figure 37. Global State-of-Charge (SoC) Market by Model, 2021-2031 (USD Mn, AGR (%)) (U-Shape Recovery)
Figure 38. Global State-of-Charge (SoC) Market by Model, 2021-2031 (USD Mn, AGR (%)) (L-Shape Recovery)
Figure 39. Global State-of-Charge (SoC) Market by Monitoring Methods, 2021-2031 (USD Mn, AGR (%))
Figure 40. Global State-of-Charge (SoC) Market by Monitoring Methods, 2021-2031 (USD Mn, AGR (%))(V-Shape Recovery)
Figure 41. Global State-of-Charge (SoC) Market by Monitoring Methods, 2021-2031 (USD Mn, AGR (%)) (W-Shape Recovery)
Figure 42. Global State-of-Charge (SoC) Market by Monitoring Methods, 2021-2031 (USD Mn, AGR (%)) (U-Shape Recovery)
Figure 43. Global State-of-Charge (SoC) Market by Monitoring Methods, 2021-2031 (USD Mn, AGR (%)) (L-Shape Recovery)
Figure 44. North America State-of-Charge (SoC) Market by Value, 2021-2031 (USD Mn, AGR (%))
Figure 45. North America State-of-Charge (SoC) Market by Value, 2021-2031 (USD Mn, AGR (%))(V-Shape Recovery)
Figure 46. North America State-of-Charge (SoC) Market by Value, 2021-2031 (USD Mn, AGR (%)) (W-Shape Recovery)
Figure 47. North America State-of-Charge (SoC) Market by Value, 2021-2031 (USD Mn, AGR (%)) (U-Shape Recovery)
Figure 48. North America State-of-Charge (SoC) Market by Value, 2021-2031 (USD Mn, AGR (%)) (L-Shape Recovery)
Figure 49. North America State-of-Charge (SoC) Market by Country, 2021-2031 (USD Mn, AGR (%))
Figure 50. North America State-of-Charge (SoC) Market by Country, 2021-2031 (USD Mn, AGR (%))(V-Shape Recovery)
Figure 51. North America State-of-Charge (SoC) Market by Country, 2021-2031 (USD Mn, AGR (%)) (W-Shape Recovery)
Figure 52. North America State-of-Charge (SoC) Market by Country, 2021-2031 (USD Mn, AGR (%)) (U-Shape Recovery)
Figure 53. North America State-of-Charge (SoC) Market by Country, 2021-2031 (USD Mn, AGR (%)) (L-Shape Recovery)
Figure 54. North America State-of-Charge (SoC) Market by Type, 2021-2031 (USD Mn, AGR (%))
Figure 55. North America State-of-Charge (SoC) Market by Type, 2021-2031 (USD Mn, AGR (%))(V-Shape Recovery)
Figure 56. North America State-of-Charge (SoC) Market by Type, 2021-2031 (USD Mn, AGR (%)) (W-Shape Recovery)
Figure 57. North America State-of-Charge (SoC) Market by Type, 2021-2031 (USD Mn, AGR (%)) (U-Shape Recovery)
Figure 58. North America State-of-Charge (SoC) Market by Type, 2021-2031 (USD Mn, AGR (%)) (L-Shape Recovery)
Figure 59. North America State-of-Charge (SoC) Market by Application, 2021-2031 (USD Mn, AGR (%))
Figure 60. North America State-of-Charge (SoC) Market by Application, 2021-2031 (USD Mn, AGR (%))(V-Shape Recovery)
Figure 61. North America State-of-Charge (SoC) Market by Application, 2021-2031 (USD Mn, AGR (%)) (W-Shape Recovery)
Figure 62. North America State-of-Charge (SoC) Market by Application, 2021-2031 (USD Mn, AGR (%)) (U-Shape Recovery)
Figure 63. North America State-of-Charge (SoC) Market by Application, 2021-2031 (USD Mn, AGR (%)) (L-Shape Recovery)
Figure 64. North America State-of-Charge (SoC) Market by Model, 2021-2031 (USD Mn, AGR (%))
Figure 65. North America State-of-Charge (SoC) Market by Model, 2021-2031 (USD Mn, AGR (%))(V-Shape Recovery)
Figure 66. North America State-of-Charge (SoC) Market by Model, 2021-2031 (USD Mn, AGR (%)) (W-Shape Recovery)
Figure 67. North America State-of-Charge (SoC) Market by Model, 2021-2031 (USD Mn, AGR (%)) (U-Shape Recovery)
Figure 68. North America State-of-Charge (SoC) Market by Model, 2021-2031 (USD Mn, AGR (%)) (L-Shape Recovery)
Figure 69. North America State-of-Charge (SoC) Market by Monitoring Methods, 2021-2031 (USD Mn, AGR (%))
Figure 70. North America State-of-Charge (SoC) Market by Monitoring Methods, 2021-2031 (USD Mn, AGR (%))(V-Shape Recovery)
Figure 71. North America State-of-Charge (SoC) Market by Monitoring Methods, 2021-2031 (USD Mn, AGR (%)) (W-Shape Recovery)
Figure 72. North America State-of-Charge (SoC) Market by Monitoring Methods, 2021-2031 (USD Mn, AGR (%)) (U-Shape Recovery)
Figure 73. North America State-of-Charge (SoC) Market by Monitoring Methods, 2021-2031 (USD Mn, AGR (%)) (L-Shape Recovery)
Figure 74. US State-of-Charge (SoC) Market by Value, 2021-2031 (USD Mn, AGR (%))
Figure 75. US State-of-Charge (SoC) Market by Value, 2021-2031 (USD Mn, AGR (%))(V-Shape Recovery)
Figure 76. US State-of-Charge (SoC) Market by Value, 2021-2031 (USD Mn, AGR (%)) (W-Shape Recovery)
Figure 77. US State-of-Charge (SoC) Market by Value, 2021-2031 (USD Mn, AGR (%)) (U-Shape Recovery)
Figure 78. US State-of-Charge (SoC) Market by Value, 2021-2031 (USD Mn, AGR (%)) (L-Shape Recovery)
Figure 79. Canada State-of-Charge (SoC) Market by Value, 2021-2031 (USD Mn, AGR (%))
Figure 80. Canada State-of-Charge (SoC) Market by Value, 2021-2031 (USD Mn, AGR (%))(V-Shape Recovery)
Figure 81. Canada State-of-Charge (SoC) Market by Value, 2021-2031 (USD Mn, AGR (%)) (W-Shape Recovery)
Figure 82. Canada State-of-Charge (SoC) Market by Value, 2021-2031 (USD Mn, AGR (%)) (U-Shape Recovery)
Figure 83. Canada State-of-Charge (SoC) Market by Value, 2021-2031 (USD Mn, AGR (%)) (L-Shape Recovery)
Figure 84. Mexico State-of-Charge (SoC) Market by Value, 2021-2031 (USD Mn, AGR (%))
Figure 85. Mexico State-of-Charge (SoC) Market by Value, 2021-2031 (USD Mn, AGR (%))(V-Shape Recovery)
Figure 86. Mexico State-of-Charge (SoC) Market by Value, 2021-2031 (USD Mn, AGR (%)) (W-Shape Recovery)
Figure 87. Mexico State-of-Charge (SoC) Market by Value, 2021-2031 (USD Mn, AGR (%)) (U-Shape Recovery)
Figure 88. Mexico State-of-Charge (SoC) Market by Value, 2021-2031 (USD Mn, AGR (%)) (L-Shape Recovery)
Figure 89. Europe State-of-Charge (SoC) Market by Value, 2021-2031 (USD Mn, AGR (%))
Figure 90. Europe State-of-Charge (SoC) Market by Value, 2021-2031 (USD Mn, AGR (%))(V-Shape Recovery)
Figure 91. Europe State-of-Charge (SoC) Market by Value, 2021-2031 (USD Mn, AGR (%)) (W-Shape Recovery)
Figure 92. Europe State-of-Charge (SoC) Market by Value, 2021-2031 (USD Mn, AGR (%)) (U-Shape Recovery)
Figure 93. Europe State-of-Charge (SoC) Market by Value, 2021-2031 (USD Mn, AGR (%)) (L-Shape Recovery)
Figure 94. Europe State-of-Charge (SoC) Market by Country, 2021-2031 (USD Mn, AGR (%))
Figure 95. Europe State-of-Charge (SoC) Market by Country, 2021-2031 (USD Mn, AGR (%))(V-Shape Recovery)
Figure 96. Europe State-of-Charge (SoC) Market by Country, 2021-2031 (USD Mn, AGR (%)) (W-Shape Recovery)
Figure 97. Europe State-of-Charge (SoC) Market by Country, 2021-2031 (USD Mn, AGR (%)) (U-Shape Recovery)
Figure 98. Europe State-of-Charge (SoC) Market by Country, 2021-2031 (USD Mn, AGR (%)) (L-Shape Recovery)
Figure 99. Europe State-of-Charge (SoC) Market by Type, 2021-2031 (USD Mn, AGR (%))
Figure 100. Europe State-of-Charge (SoC) Market by Type, 2021-2031 (USD Mn, AGR (%))(V-Shape Recovery)
Figure 101. Europe State-of-Charge (SoC) Market by Type, 2021-2031 (USD Mn, AGR (%)) (W-Shape Recovery)
Figure 102. Europe State-of-Charge (SoC) Market by Type, 2021-2031 (USD Mn, AGR (%)) (U-Shape Recovery)
Figure 103. Europe State-of-Charge (SoC) Market by Type, 2021-2031 (USD Mn, AGR (%)) (L-Shape Recovery)
Figure 104. Europe State-of-Charge (SoC) Market by Application, 2021-2031 (USD Mn, AGR (%))
Figure 105. Europe State-of-Charge (SoC) Market by Application, 2021-2031 (USD Mn, AGR (%))(V-Shape Recovery)
Figure 106. Europe State-of-Charge (SoC) Market by Application, 2021-2031 (USD Mn, AGR (%)) (W-Shape Recovery)
Figure 107. Europe State-of-Charge (SoC) Market by Application, 2021-2031 (USD Mn, AGR (%)) (U-Shape Recovery)
Figure 108. Europe State-of-Charge (SoC) Market by Application, 2021-2031 (USD Mn, AGR (%)) (L-Shape Recovery)
Figure 109. Europe State-of-Charge (SoC) Market by Model, 2021-2031 (USD Mn, AGR (%))
Figure 110. Europe State-of-Charge (SoC) Market by Model, 2021-2031 (USD Mn, AGR (%))(V-Shape Recovery)
Figure 111. Europe State-of-Charge (SoC) Market by Model, 2021-2031 (USD Mn, AGR (%)) (W-Shape Recovery)
Figure 112. Europe State-of-Charge (SoC) Market by Model, 2021-2031 (USD Mn, AGR (%)) (U-Shape Recovery)
Figure 113. Europe State-of-Charge (SoC) Market by Model, 2021-2031 (USD Mn, AGR (%)) (L-Shape Recovery)
Figure 114. Europe State-of-Charge (SoC) Market by Monitoring Methods, 2021-2031 (USD Mn, AGR (%))
Figure 115. Europe State-of-Charge (SoC) Market by Monitoring Methods, 2021-2031 (USD Mn, AGR (%))(V-Shape Recovery)
Figure 116. Europe State-of-Charge (SoC) Market by Monitoring Methods, 2021-2031 (USD Mn, AGR (%)) (W-Shape Recovery)
Figure 117. Europe State-of-Charge (SoC) Market by Monitoring Methods, 2021-2031 (USD Mn, AGR (%)) (U-Shape Recovery)
Figure 118. Europe State-of-Charge (SoC) Market by Monitoring Methods, 2021-2031 (USD Mn, AGR (%)) (L-Shape Recovery)
Figure 119. Germany State-of-Charge (SoC) Market by Value, 2021-2031 (USD Mn, AGR (%))
Figure 120. Germany State-of-Charge (SoC) Market by Value, 2021-2031 (USD Mn, AGR (%))(V-Shape Recovery)
Figure 121. Germany State-of-Charge (SoC) Market by Value, 2021-2031 (USD Mn, AGR (%)) (W-Shape Recovery)
Figure 122. Germany State-of-Charge (SoC) Market by Value, 2021-2031 (USD Mn, AGR (%)) (U-Shape Recovery)
Figure 123. Germany State-of-Charge (SoC) Market by Value, 2021-2031 (USD Mn, AGR (%)) (L-Shape Recovery)
Figure 124. UK State-of-Charge (SoC) Market by Value, 2021-2031 (USD Mn, AGR (%))
Figure 125. UK State-of-Charge (SoC) Market by Value, 2021-2031 (USD Mn, AGR (%))(V-Shape Recovery)
Figure 126. UK State-of-Charge (SoC) Market by Value, 2021-2031 (USD Mn, AGR (%)) (W-Shape Recovery)
Figure 127. UK State-of-Charge (SoC) Market by Value, 2021-2031 (USD Mn, AGR (%)) (U-Shape Recovery)
Figure 128. UK State-of-Charge (SoC) Market by Value, 2021-2031 (USD Mn, AGR (%)) (L-Shape Recovery)
Figure 129. France State-of-Charge (SoC) Market by Value, 2021-2031 (USD Mn, AGR (%))
Figure 130. France State-of-Charge (SoC) Market by Value, 2021-2031 (USD Mn, AGR (%))(V-Shape Recovery)
Figure 131. France State-of-Charge (SoC) Market by Value, 2021-2031 (USD Mn, AGR (%)) (W-Shape Recovery)
Figure 132. France State-of-Charge (SoC) Market by Value, 2021-2031 (USD Mn, AGR (%)) (U-Shape Recovery)
Figure 133. France State-of-Charge (SoC) Market by Value, 2021-2031 (USD Mn, AGR (%)) (L-Shape Recovery)
Figure 134. Italy State-of-Charge (SoC) Market by Value, 2021-2031 (USD Mn, AGR (%))
Figure 135. Italy State-of-Charge (SoC) Market by Value, 2021-2031 (USD Mn, AGR (%))(V-Shape Recovery)
Figure 136. Italy State-of-Charge (SoC) Market by Value, 2021-2031 (USD Mn, AGR (%)) (W-Shape Recovery)
Figure 137. Italy State-of-Charge (SoC) Market by Value, 2021-2031 (USD Mn, AGR (%)) (U-Shape Recovery)
Figure 138. Italy State-of-Charge (SoC) Market by Value, 2021-2031 (USD Mn, AGR (%)) (L-Shape Recovery)
Figure 139. Spain State-of-Charge (SoC) Market by Value, 2021-2031 (USD Mn, AGR (%))
Figure 140. Spain State-of-Charge (SoC) Market by Value, 2021-2031 (USD Mn, AGR (%))(V-Shape Recovery)
Figure 141. Spain State-of-Charge (SoC) Market by Value, 2021-2031 (USD Mn, AGR (%)) (W-Shape Recovery)
Figure 142. Spain State-of-Charge (SoC) Market by Value, 2021-2031 (USD Mn, AGR (%)) (U-Shape Recovery)
Figure 143. Spain State-of-Charge (SoC) Market by Value, 2021-2031 (USD Mn, AGR (%)) (L-Shape Recovery)
Figure 144. Rest of Europe State-of-Charge (SoC) Market by Value, 2021-2031 (USD Mn, AGR (%))
Figure 145. Rest of Europe State-of-Charge (SoC) Market by Value, 2021-2031 (USD Mn, AGR (%))(V-Shape Recovery)
Figure 146. Rest of Europe State-of-Charge (SoC) Market by Value, 2021-2031 (USD Mn, AGR (%)) (W-Shape Recovery)
Figure 147. Rest of Europe State-of-Charge (SoC) Market by Value, 2021-2031 (USD Mn, AGR (%)) (U-Shape Recovery)
Figure 148. Rest of Europe State-of-Charge (SoC) Market by Value, 2021-2031 (USD Mn, AGR (%)) (L-Shape Recovery)
Figure 149. Asia-Pacific State-of-Charge (SoC) Market by Value, 2021-2031 (USD Mn, AGR (%))
Figure 150. Asia-Pacific State-of-Charge (SoC) Market by Value, 2021-2031 (USD Mn, AGR (%))(V-Shape Recovery)
Figure 151. Asia-Pacific State-of-Charge (SoC) Market by Value, 2021-2031 (USD Mn, AGR (%)) (W-Shape Recovery)
Figure 152. Asia-Pacific State-of-Charge (SoC) Market by Value, 2021-2031 (USD Mn, AGR (%)) (U-Shape Recovery)
Figure 153. Asia-Pacific State-of-Charge (SoC) Market by Value, 2021-2031 (USD Mn, AGR (%)) (L-Shape Recovery)
Figure 154. Asia-Pacific State-of-Charge (SoC) Market by Country, 2021-2031 (USD Mn, AGR (%))
Figure 155. Asia-Pacific State-of-Charge (SoC) Market by Country, 2021-2031 (USD Mn, AGR (%))(V-Shape Recovery)
Figure 156. Asia-Pacific State-of-Charge (SoC) Market by Country, 2021-2031 (USD Mn, AGR (%)) (W-Shape Recovery)
Figure 157. Asia-Pacific State-of-Charge (SoC) Market by Country, 2021-2031 (USD Mn, AGR (%)) (U-Shape Recovery)
Figure 158. Asia-Pacific State-of-Charge (SoC) Market by Country, 2021-2031 (USD Mn, AGR (%)) (L-Shape Recovery)
Figure 159. Asia-Pacific State-of-Charge (SoC) Market by Type, 2021-2031 (USD Mn, AGR (%))
Figure 160. Asia-Pacific State-of-Charge (SoC) Market by Type, 2021-2031 (USD Mn, AGR (%))(V-Shape Recovery)
Figure 161. Asia-Pacific State-of-Charge (SoC) Market by Type, 2021-2031 (USD Mn, AGR (%)) (W-Shape Recovery)
Figure 162. Asia-Pacific State-of-Charge (SoC) Market by Type, 2021-2031 (USD Mn, AGR (%)) (U-Shape Recovery)
Figure 163. Asia-Pacific State-of-Charge (SoC) Market by Type, 2021-2031 (USD Mn, AGR (%)) (L-Shape Recovery)
Figure 164. Asia-Pacific State-of-Charge (SoC) Market by Application, 2021-2031 (USD Mn, AGR (%))
Figure 165. Asia-Pacific State-of-Charge (SoC) Market by Application, 2021-2031 (USD Mn, AGR (%))(V-Shape Recovery)
Figure 166. Asia-Pacific State-of-Charge (SoC) Market by Application, 2021-2031 (USD Mn, AGR (%)) (W-Shape Recovery)
Figure 167. Asia-Pacific State-of-Charge (SoC) Market by Application, 2021-2031 (USD Mn, AGR (%)) (U-Shape Recovery)
Figure 168. Asia-Pacific State-of-Charge (SoC) Market by Application, 2021-2031 (USD Mn, AGR (%)) (L-Shape Recovery)
Figure 169. Asia-Pacific State-of-Charge (SoC) Market by Model, 2021-2031 (USD Mn, AGR (%))
Figure 170. Asia-Pacific State-of-Charge (SoC) Market by Model, 2021-2031 (USD Mn, AGR (%))(V-Shape Recovery)
Figure 171. Asia-Pacific State-of-Charge (SoC) Market by Model, 2021-2031 (USD Mn, AGR (%)) (W-Shape Recovery)
Figure 172. Asia-Pacific State-of-Charge (SoC) Market by Model, 2021-2031 (USD Mn, AGR (%)) (U-Shape Recovery)
Figure 173. Asia-Pacific State-of-Charge (SoC) Market by Model, 2021-2031 (USD Mn, AGR (%)) (L-Shape Recovery)
Figure 174. Asia-Pacific State-of-Charge (SoC) Market by Monitoring Methods, 2021-2031 (USD Mn, AGR (%))
Figure 175. Asia-Pacific State-of-Charge (SoC) Market by Monitoring Methods, 2021-2031 (USD Mn, AGR (%))(V-Shape Recovery)
Figure 176. Asia-Pacific State-of-Charge (SoC) Market by Monitoring Methods, 2021-2031 (USD Mn, AGR (%)) (W-Shape Recovery)
Figure 177. Asia-Pacific State-of-Charge (SoC) Market by Monitoring Methods, 2021-2031 (USD Mn, AGR (%)) (U-Shape Recovery)
Figure 178. Asia-Pacific State-of-Charge (SoC) Market by Monitoring Methods, 2021-2031 (USD Mn, AGR (%)) (L-Shape Recovery)
Figure 179. China State-of-Charge (SoC) Market by Value, 2021-2031 (USD Mn, AGR (%))
Figure 180. China State-of-Charge (SoC) Market by Value, 2021-2031 (USD Mn, AGR (%))(V-Shape Recovery)
Figure 181. China State-of-Charge (SoC) Market by Value, 2021-2031 (USD Mn, AGR (%)) (W-Shape Recovery)
Figure 182. China State-of-Charge (SoC) Market by Value, 2021-2031 (USD Mn, AGR (%)) (U-Shape Recovery)
Figure 183. China State-of-Charge (SoC) Market by Value, 2021-2031 (USD Mn, AGR (%)) (L-Shape Recovery)
Figure 184. India State-of-Charge (SoC) Market by Value, 2021-2031 (USD Mn, AGR (%))
Figure 185. India State-of-Charge (SoC) Market by Value, 2021-2031 (USD Mn, AGR (%))(V-Shape Recovery)
Figure 186. India State-of-Charge (SoC) Market by Value, 2021-2031 (USD Mn, AGR (%)) (W-Shape Recovery)
Figure 187. India State-of-Charge (SoC) Market by Value, 2021-2031 (USD Mn, AGR (%)) (U-Shape Recovery)
Figure 188. India State-of-Charge (SoC) Market by Value, 2021-2031 (USD Mn, AGR (%)) (L-Shape Recovery)
Figure 189. Japan State-of-Charge (SoC) Market by Value, 2021-2031 (USD Mn, AGR (%))
Figure 190. Japan State-of-Charge (SoC) Market by Value, 2021-2031 (USD Mn, AGR (%))(V-Shape Recovery)
Figure 191. Japan State-of-Charge (SoC) Market by Value, 2021-2031 (USD Mn, AGR (%)) (W-Shape Recovery)
Figure 192. Japan State-of-Charge (SoC) Market by Value, 2021-2031 (USD Mn, AGR (%)) (U-Shape Recovery)
Figure 193. Japan State-of-Charge (SoC) Market by Value, 2021-2031 (USD Mn, AGR (%)) (L-Shape Recovery)
Figure 194. South Korea State-of-Charge (SoC) Market by Value, 2021-2031 (USD Mn, AGR (%))
Figure 195. South Korea State-of-Charge (SoC) Market by Value, 2021-2031 (USD Mn, AGR (%))(V-Shape Recovery)
Figure 196. South Korea State-of-Charge (SoC) Market by Value, 2021-2031 (USD Mn, AGR (%)) (W-Shape Recovery)
Figure 197. South Korea State-of-Charge (SoC) Market by Value, 2021-2031 (USD Mn, AGR (%)) (U-Shape Recovery)
Figure 198. South Korea State-of-Charge (SoC) Market by Value, 2021-2031 (USD Mn, AGR (%)) (L-Shape Recovery)
Figure 199. Australia State-of-Charge (SoC) Market by Value, 2021-2031 (USD Mn, AGR (%))
Figure 200. Australia State-of-Charge (SoC) Market by Value, 2021-2031 (USD Mn, AGR (%))(V-Shape Recovery)
Figure 201. Australia State-of-Charge (SoC) Market by Value, 2021-2031 (USD Mn, AGR (%)) (W-Shape Recovery)
Figure 202. Australia State-of-Charge (SoC) Market by Value, 2021-2031 (USD Mn, AGR (%)) (U-Shape Recovery)
Figure 203. Australia State-of-Charge (SoC) Market by Value, 2021-2031 (USD Mn, AGR (%)) (L-Shape Recovery)
Figure 204. Rest of Asia-Pacific State-of-Charge (SoC) Market by Value, 2021-2031 (USD Mn, AGR (%))
Figure 205. Rest of Asia-Pacific State-of-Charge (SoC) Market by Value, 2021-2031 (USD Mn, AGR (%))(V-Shape Recovery)
Figure 206. Rest of Asia-Pacific State-of-Charge (SoC) Market by Value, 2021-2031 (USD Mn, AGR (%)) (W-Shape Recovery)
Figure 207. Rest of Asia-Pacific State-of-Charge (SoC) Market by Value, 2021-2031 (USD Mn, AGR (%)) (U-Shape Recovery)
Figure 208. Rest of Asia-Pacific State-of-Charge (SoC) Market by Value, 2021-2031 (USD Mn, AGR (%)) (L-Shape Recovery)
Figure 209. LAMEA State-of-Charge (SoC) Market by Value, 2021-2031 (USD Mn, AGR (%))
Figure 210. LAMEA State-of-Charge (SoC) Market by Value, 2021-2031 (USD Mn, AGR (%))(V-Shape Recovery)
Figure 211. LAMEA State-of-Charge (SoC) Market by Value, 2021-2031 (USD Mn, AGR (%)) (W-Shape Recovery)
Figure 212. LAMEA State-of-Charge (SoC) Market by Value, 2021-2031 (USD Mn, AGR (%)) (U-Shape Recovery)
Figure 213. LAMEA State-of-Charge (SoC) Market by Value, 2021-2031 (USD Mn, AGR (%)) (L-Shape Recovery)
Figure 214. LAMEA State-of-Charge (SoC) Market by Country, 2021-2031 (USD Mn, AGR (%))
Figure 215. LAMEA State-of-Charge (SoC) Market by Country, 2021-2031 (USD Mn, AGR (%))(V-Shape Recovery)
Figure 216. LAMEA State-of-Charge (SoC) Market by Country, 2021-2031 (USD Mn, AGR (%)) (W-Shape Recovery)
Figure 217. LAMEA State-of-Charge (SoC) Market by Country, 2021-2031 (USD Mn, AGR (%)) (U-Shape Recovery)
Figure 218. LAMEA State-of-Charge (SoC) Market by Country, 2021-2031 (USD Mn, AGR (%)) (L-Shape Recovery)
Figure 219. LAMEA State-of-Charge (SoC) Market by Type, 2021-2031 (USD Mn, AGR (%))
Figure 220. LAMEA State-of-Charge (SoC) Market by Type, 2021-2031 (USD Mn, AGR (%))(V-Shape Recovery)
Figure 221. LAMEA State-of-Charge (SoC) Market by Type, 2021-2031 (USD Mn, AGR (%)) (W-Shape Recovery)
Figure 222. LAMEA State-of-Charge (SoC) Market by Type, 2021-2031 (USD Mn, AGR (%)) (U-Shape Recovery)
Figure 223. LAMEA State-of-Charge (SoC) Market by Type, 2021-2031 (USD Mn, AGR (%)) (L-Shape Recovery)
Figure 224. LAMEA State-of-Charge (SoC) Market by Application, 2021-2031 (USD Mn, AGR (%))
Figure 225. LAMEA State-of-Charge (SoC) Market by Application, 2021-2031 (USD Mn, AGR (%))(V-Shape Recovery)
Figure 226. LAMEA State-of-Charge (SoC) Market by Application, 2021-2031 (USD Mn, AGR (%)) (W-Shape Recovery)
Figure 227. LAMEA State-of-Charge (SoC) Market by Application, 2021-2031 (USD Mn, AGR (%)) (U-Shape Recovery)
Figure 228. LAMEA State-of-Charge (SoC) Market by Application, 2021-2031 (USD Mn, AGR (%)) (L-Shape Recovery)
Figure 229. LAMEA State-of-Charge (SoC) Market by Model, 2021-2031 (USD Mn, AGR (%))
Figure 230. LAMEA State-of-Charge (SoC) Market by Model, 2021-2031 (USD Mn, AGR (%))(V-Shape Recovery)
Figure 231. LAMEA State-of-Charge (SoC) Market by Model, 2021-2031 (USD Mn, AGR (%)) (W-Shape Recovery)
Figure 232. LAMEA State-of-Charge (SoC) Market by Model, 2021-2031 (USD Mn, AGR (%)) (U-Shape Recovery)
Figure 233. LAMEA State-of-Charge (SoC) Market by Model, 2021-2031 (USD Mn, AGR (%)) (L-Shape Recovery)
Figure 234. LAMEA State-of-Charge (SoC) Market by Monitoring Methods, 2021-2031 (USD Mn, AGR (%))
Figure 235. LAMEA State-of-Charge (SoC) Market by Monitoring Methods, 2021-2031 (USD Mn, AGR (%))(V-Shape Recovery)
Figure 236. LAMEA State-of-Charge (SoC) Market by Monitoring Methods, 2021-2031 (USD Mn, AGR (%)) (W-Shape Recovery)
Figure 237. LAMEA State-of-Charge (SoC) Market by Monitoring Methods, 2021-2031 (USD Mn, AGR (%)) (U-Shape Recovery)
Figure 238. LAMEA State-of-Charge (SoC) Market by Monitoring Methods, 2021-2031 (USD Mn, AGR (%)) (L-Shape Recovery)
Figure 239. Brazil State-of-Charge (SoC) Market by Value, 2021-2031 (USD Mn, AGR (%))
Figure 240. Brazil State-of-Charge (SoC) Market by Value, 2021-2031 (USD Mn, AGR (%))(V-Shape Recovery)
Figure 241. Brazil State-of-Charge (SoC) Market by Value, 2021-2031 (USD Mn, AGR (%)) (W-Shape Recovery)
Figure 242. Brazil State-of-Charge (SoC) Market by Value, 2021-2031 (USD Mn, AGR (%)) (U-Shape Recovery)
Figure 243. Brazil State-of-Charge (SoC) Market by Value, 2021-2031 (USD Mn, AGR (%)) (L-Shape Recovery)
Figure 244. South Africa State-of-Charge (SoC) Market by Value, 2021-2031 (USD Mn, AGR (%))
Figure 245. South Africa State-of-Charge (SoC) Market by Value, 2021-2031 (USD Mn, AGR (%))(V-Shape Recovery)
Figure 246. South Africa State-of-Charge (SoC) Market by Value, 2021-2031 (USD Mn, AGR (%)) (W-Shape Recovery)
Figure 247. South Africa State-of-Charge (SoC) Market by Value, 2021-2031 (USD Mn, AGR (%)) (U-Shape Recovery)
Figure 248. South Africa State-of-Charge (SoC) Market by Value, 2021-2031 (USD Mn, AGR (%)) (L-Shape Recovery)
Figure 249. Saudi Arabia State-of-Charge (SoC) Market by Value, 2021-2031 (USD Mn, AGR (%))
Figure 250. Saudi Arabia State-of-Charge (SoC) Market by Value, 2021-2031 (USD Mn, AGR (%))(V-Shape Recovery)
Figure 251. Saudi Arabia State-of-Charge (SoC) Market by Value, 2021-2031 (USD Mn, AGR (%)) (W-Shape Recovery)
Figure 252. Saudi Arabia State-of-Charge (SoC) Market by Value, 2021-2031 (USD Mn, AGR (%)) (U-Shape Recovery)
Figure 253. Saudi Arabia State-of-Charge (SoC) Market by Value, 2021-2031 (USD Mn, AGR (%)) (L-Shape Recovery)
Figure 254. Turkey State-of-Charge (SoC) Market by Value, 2021-2031 (USD Mn, AGR (%))
Figure 255. Turkey State-of-Charge (SoC) Market by Value, 2021-2031 (USD Mn, AGR (%))(V-Shape Recovery)
Figure 256. Turkey State-of-Charge (SoC) Market by Value, 2021-2031 (USD Mn, AGR (%)) (W-Shape Recovery)
Figure 257. Turkey State-of-Charge (SoC) Market by Value, 2021-2031 (USD Mn, AGR (%)) (U-Shape Recovery)
Figure 258. Turkey State-of-Charge (SoC) Market by Value, 2021-2031 (USD Mn, AGR (%)) (L-Shape Recovery)
Figure 259. UAE State-of-Charge (SoC) Market by Value, 2021-2031 (USD Mn, AGR (%))
Figure 260. UAE State-of-Charge (SoC) Market by Value, 2021-2031 (USD Mn, AGR (%))(V-Shape Recovery)
Figure 261. UAE State-of-Charge (SoC) Market by Value, 2021-2031 (USD Mn, AGR (%)) (W-Shape Recovery)
Figure 262. UAE State-of-Charge (SoC) Market by Value, 2021-2031 (USD Mn, AGR (%)) (U-Shape Recovery)
Figure 263. UAE State-of-Charge (SoC) Market by Value, 2021-2031 (USD Mn, AGR (%)) (L-Shape Recovery)
Figure 264. Rest of LAMEA State-of-Charge (SoC) Market by Value, 2021-2031 (USD Mn, AGR (%))
Figure 265. Rest of LAMEA State-of-Charge (SoC) Market by Value, 2021-2031 (USD Mn, AGR (%))(V-Shape Recovery)
Figure 266. Rest of LAMEA State-of-Charge (SoC) Market by Value, 2021-2031 (USD Mn, AGR (%)) (W-Shape Recovery)
Figure 267. Rest of LAMEA State-of-Charge (SoC) Market by Value, 2021-2031 (USD Mn, AGR (%)) (U-Shape Recovery)
Figure 268. Rest of LAMEA State-of-Charge (SoC) Market by Value, 2021-2031 (USD Mn, AGR (%)) (L-Shape Recovery)
Figure 269. Company Market Share
Figure 270. Global State of Charge (SoC)Market by Key Business Strategy, 2018-2021 (%)
Figure 271. Texas Instruments.: Company Revenue 2016-2020(US$Mn, AGR %)
Figure 272. Texas Instruments.: Company Operating Income 2016-2020(US$Mn, AGR %)
Figure 273. Texas Instruments.: Company Net Income 2016-2020(US$Mn, AGR %)
Figure 274. Texas Instruments.: Company EBITDA 2016-2020(US$Mn, AGR %)
List of Companies Profiled in the report
Abler
Alpine Power Systems
Balmar DC Charging Solutions
Battery Clinic, Inc
Battery Watering Technologies
Blue Sea Systems
Cellwatch Battery Monitoring
Encell Technology, Inc
Global Digital Instruments
Linklite Systems
Mastervolt
Materials Transportation Company
Nasa Marine Limited
Philadelphia Scientific LLC
Progressive Dynamics, Inc.
Texas Instruments
Victron Energy
Xantrex
List of Other Companies Mentioned in the report
ABB Ltd
AEG Power Solutions B.V
Aggreko Plc
BYD Company Limited
Electrovaya Inc.
General Electric (GE)
GS Yuasa International Ltd.
Hitachi Ltd.
LG Chemicals
Mitsubishi Electric Corporation
NGK Insulators, Ltd.
Nidec Industries
OutBack Power Technologies, Inc
Panasonic Corporation
SAFT
Samsung SDI Co., Ltd
SMA Solar Technology AG
SOCOMEC Group S.A
Sumitomo Electric Industries, Ltd.
Tesla Energy Operations Inc. (SolarCity)
A123 Systems
ABB Ltd.
AES Energy Storage LLC
Altair Nanotechnologies Inc.
American Vanadium
Aquion Energy
ARRA
Axion Power International Inc.
BYD Co.
Deeya Energy Inc.
Dow Kokam LLC
East Penn Manufacturing Co. Inc.
Ecoult
Electrovaya Inc.
EnerSys
EnerVault Corporation
Eos Energy Storage
FIAMM SpA
General Electric Company
Glidemeister Energy Solutions
GS Yasua Corporation
Hitachi Ltd.
LG Chem Ltd
Mitsubishi Electric Company
NGK Insulators Ltd.
Panasonic
Primus Power Corporation
RedFlow Ltd
Ren21
Réseau Distribution France (ERDF)
S&C Electric
Saft SA
Samsung
Sumitomo Electric Industries
TEPCO-NGK
Tesla
ViZn Energy
Xtreme Power Inc.
Younicos
ZBB Energy Corp.
List of Associations Mentioned in the Report
Advanced Lead Acid Battery Consortium (ALABC)
Advanced Research Projects Agency-Energy (ARPA-E)
Australian Labor Party
Australian Renewable Energy Agency (ARENA)
California Energy Commission
California Public Utilities Commission (CPUC)
Centre for Renewable Energy Development (CRED)
Centre for the Commercialisc of Electric Technologies (CCET)
China Electrical Power Research Institute (CEPRI)
China Southern Power Grid
Commonwealth Scientific and Industrial Research Organisation (CSIRO)
Department of Energy and Climate Change (DECC)
Electric Reliability Council of Texas (ERCOT)
Electric Vehicles Initiative (EVI)
European Commission
European Commission Joint Research Centre
European Union
Federal Association of Energy Storage (BVES)
Fraunhofer Society
Fraunhofer Society Research Organisation
Fraunhofer Society Research Organisation
German Federal Association of Energy and Water Industries (BDEW)
Global Wind Energy Council (GWEC)
Harvard Business School
International Energy Agency (IEA)
International Energy Agency (IEA)
Italian Ministry of Economy and Finances
Japan Aerospace Exploration Agency (JAXA)
Korea Institute of Energy Research (KIER)
Los Angeles Department of Water and Power (LADWP)
New York Battery and Energy Storage Technology Consortium (NY-BEST)
New York State Energy Research and Development Authority (NYSERDA)
Organisation for Economic Co-operation and Development (OECD)
Public Utilities Commission of Ohio (PUCO)
Renewable Energy Policy Network for the 21st Century (REN21)
Rutgers, The State University of New Jersey
Sandia National Laboratories
Seattle University
South Korean Ministry of Knowledge Economy
State Grid Corporation of China (SGCC)
Texas Public Utilities Commission
The California Public Utilities Commission (CPUC)
The China Electrical Power Research Institute (CEPRI)
The Federal Energy Regulatory Commission (FERC)
The Federal Energy Regulatory Commission (FERC) (US)
The Korea Institute of Energy Research (KIER)
The Ministry of Economy and Finances (Japan)
The Ministry of Economy, Trade and Industry (METI)
The Ministry of Energy of Ontario
The New York State Energy Research and Development Authority (NYSERDA)
The Office of Gas and Electricity Markets (Ofgem)
The UK Department of Energy and Climate Change (DECC)
The US Department of Energy (DOE)
The US Energy Information Administration (EIA)
U.S. Energy Information Administration (EIA)
UK Technology Strategy Board (TSB)
UNFCCC
United Nations Framework Convention on Climate Change (UNFCCC)
US Federal Energy Regulatory Commission (FERC)
US Republican Party
World Economic Forum
 Market Report 2021-2031")