Industries > Automotive > Battery Electric Vehicle (BEV) Market Report 2021-2031
 Market Report 2021-2031")
Battery Electric Vehicle (BEV) Market Report 2021-2031
Forecasts by Vehicle Type (Passenger Vehicles, Light Commercial Vehicles (LCVs), and Heavy Commercial Vehicles (HCVs), by Battery Type (Lithium-ion Batteries, Lead-acid Batteries, and Nickel-metal Hydride Batteries) AND Regional and Leading National Market Analysis PLUS Analysis of Leading BEV Companies AND COVID-19 Recovery Scenarios
Battery Electric Vehicle (BEV) Market – our new study reveals current and future trends, major driving factors, regulatory framework, and predicted revenues/volume
With the rise in stringent government regulations regarding the use of fuel-efficient vehicles to control the emissions across the globe, the demand of zero emission vehicles is expected to rise which leads in the increased sales of BEVs. Further, owing to high oil prices around the world, market for fuel-efficient cars has risen drastically over the years. The limited fossil fuel availability has resulted in the increased prices of gasoline and diesel, which furthermore prompting customers to switch from ICE vehicles to battery operated vehicles. However, rising governments interference in terms of strict emissions regulations and promoting fuel efficient vehicles, BEVs demand is estimated to rise.
• Tesla India was incorporated as a subsidiary of the foreign holding company in Bengaluru, Karnataka. The company has planned to launch EV in India by 2022.
• Nissan and Uber have signed a deal to support the introduction of 2,000 all-electric Nissan LEAFs.
• BMW Group planned over 30 billion euros on future-oriented technologies up to 2025.
• Beijing Automotive Group Co., Ltd. (BAIC Group) launched the 2020 BEIJING-EU5.
These are just some of the business-critical headlines that have surfaced automotive industry in the past 12 months. How are you and your company reacting to such news? By ordering and reading our newly published report today, you will be fully informed and ready to act.
Which region might offer good growth potential in the coming years?
APAC battery electric vehicle (BEV) market is estimated to have a potential of more than US$x million by the end of 2031. APAC is one of the leaders in the automotive industry and now it is moving towards more innovation and advancement in automotive. APAC is the fastest growing market owing to the largest population base especially in China and India. Growing initiatives regarding the research and development for battery electric vehicle (BEV) and adoption of ZEVs will enhance the overall market demand.
Growing automotive production and sales, presence of major automotive OEMs, rising need to reduce the CO2 emission, and adoption of electric vehicles, increasing investment in the development of more advanced vehicles, government support and initiatives, growing standard of living, rising environmental concern, and increasing per capita income; all these factors are expected to boost the demand of battery electric vehicle (BEV) in the APAC region.
BEVs are at its introductory phase in South America, Middle East, and Africa thus have the potential to offer maximum profit. Our report analyze each niche region to help our customers to target untapped market. How are you, and your company, planning to enhance the reach into very niche countries? By ordering and reading our new report today, you will be fully informed and ready to act.
To access the data contained in this document please email contactus@visiongain.com
How the COVID-19 has impacted the global battery electric vehicle (BEV) market?
Due to the COVID-19, the market is being analyzed further in terms of various recovery patterns (V-shaped, U-shaped, L-shaped, and W-shaped) to provide bird’s eye view on each aspects of the market. The COVID-19 pandemic hit the global automotive industry very hard and fast. Disruption in whole supply chain, supply and demand imbalance, strict government guidelines in the form of complete or partial lockdown, non-availability of workforce, large-scale manufacturing interruptions, and the closure of assembly plants; are some of the symptoms faced by the automotive industry due to COVID-19. Further, COVID-19 has put a lot of pressure on a market due to which it is still struggling with a global demand downturn, which is likely to lead to further merger and acquisition activity.
Visiongain report will enhance your understanding about the battery electric vehicle (BEV) market in terms of demand drivers, regulatory framework, major players, key strategic initiatives taken, major challenges, and trends in the industry.
What are the key factors contributing to the enhancement of the global battery electric vehicle (BEV) market? To find out you must look into the report if you are one of the prominent stakeholders of the market. This report will further help you to be ahead of the other stakeholders with regard to strategic planning. This report will also assist you in aligning your company with market trends. Visiongain report provides a detailed trend analysis of the global battery electric vehicle (BEV) market along with the forecast to determine prospective investment areas.
The newly updated report indicates that the global battery electric vehicle (BEV) market was valued at around US$xx million in 2020 (pre-COVID-19 forecast) and is expected to register a compound annual growth rate of xx% during the forecast period 2021-2031. To find out the post-COVID-19 forecast and its impact make the purchase decision today. Increasing demand for automotive vehicles across the globe, stringent government regulations regarding vehicular emission, rising consumer awareness about the use of fuel-efficient vehicles, growing innovation along with advanced technology, and growing need to minimize greenhouse gas and air pollutant emissions; are the prime factors driving the demand of battery electric vehicle (BEV) across the globe.
Curious about the newly published battery electric vehicle (BEV) report? Buy our report to find answers to the key questions and much more:
• How the market is evolving after the COVID-19 pandemic?
• How are you going to survive the impact of this pandemic?
• Which region is most impacted?
• Which region is least impacted?
• What are the key supportive factors?
• What factors could lead to the reshaping of the market?
• How the demand is geographically distributed?
• What are the market growth hindering factors?
• What are the latest innovations?
• What are the major substitutes of BEVs?
• How the supply chain functioning?
• Which recovery scenario offers good growth potential?
• What strategies major companies are adopting?
Answers to all these questions will help you to understand the current market scenario and will advise you in the strategic decision making to always keep you ahead of your close competitors.
Discover how to stay ahead
Our 1110 pages report provides 1357 tables and charts/graphs. Read on to discover the most lucrative areas in the industry and the future market prospects. Our new study lets you assess forecasted sales at overall world market and regional level. See financial results, trends, opportunities, and revenue predictions. Much opportunity remains in this growing Battery Electric Vehicle (BEV) Market. See how to exploit the opportunities.
Forecasts to 2031 and other analyses reveal the commercial prospects
• In addition to revenue forecasting to 2031, our new study provides you with recent results, growth rates, and market shares.
• You find original analyses, with business outlooks and developments.
• Discover qualitative analyses (including market dynamics, drivers, opportunities, restraints and challenges), product profiles and commercial developments.

Discover sales predictions for the global market and submarkets
Battery Electric Vehicle (BEV) Market: By Vehicle Type
• Passenger Vehicles
• Light Commercial Vehicles
• Heavy Commercial Vehicles
Battery Electric Vehicle (BEV) Market: By Battery Type
• Lithium-ion Batteries
• Lead-acid Batteries
• Nickel-metal Hydride Batteries
In addition to the revenue predictions for the overall world market and segments, you will also find revenue forecasts for 4 regional and 39 leading national markets:
• North America Battery Electric Vehicle (BEV) Market Outlook
• U.S. Battery Electric Vehicle (BEV) Market Forecast & COVID Impact Analysis
• Canada Battery Electric Vehicle (BEV) Market Forecast & COVID Impact Analysis
• Mexico Battery Electric Vehicle (BEV) Market Forecast & COVID Impact Analysis
• Europe Battery Electric Vehicle (BEV) Market Outlook
• Germany Battery Electric Vehicle (BEV) Market Forecast & COVID Impact Analysis
• Norway Battery Electric Vehicle (BEV) Market Forecast & COVID Impact Analysis
• Netherlands Battery Electric Vehicle (BEV) Market Forecast & COVID Impact Analysis
• France Battery Electric Vehicle (BEV) Market Forecast & COVID Impact Analysis
• UK Battery Electric Vehicle (BEV) Market Forecast & COVID Impact Analysis
• Sweden Battery Electric Vehicle (BEV) Market Forecast & COVID Impact Analysis
• Switzerland Battery Electric Vehicle (BEV) Market Forecast & COVID Impact Analysis
• Italy Battery Electric Vehicle (BEV) Market Forecast & COVID Impact Analysis
• Spain Battery Electric Vehicle (BEV) Market Forecast & COVID Impact Analysis
• Austria Battery Electric Vehicle (BEV) Market Forecast & COVID Impact Analysis
• Belgium Battery Electric Vehicle (BEV) Market Forecast & COVID Impact Analysis
• Portugal Battery Electric Vehicle (BEV) Market Forecast & COVID Impact Analysis
• Finland Battery Electric Vehicle (BEV) Market Forecast & COVID Impact Analysis
• Denmark Battery Electric Vehicle (BEV) Market Forecast & COVID Impact Analysis
• Ireland Battery Electric Vehicle (BEV) Market Forecast & COVID Impact Analysis
• Hungary Battery Electric Vehicle (BEV) Market Forecast & COVID Impact Analysis
• Poland Battery Electric Vehicle (BEV) Market Forecast & COVID Impact Analysis
• Romania Battery Electric Vehicle (BEV) Market Forecast & COVID Impact Analysis
• Luxembourg Battery Electric Vehicle (BEV) Market Forecast & COVID Impact Analysis
• Iceland Battery Electric Vehicle (BEV) Market Forecast & COVID Impact Analysis
• Czech Republic Battery Electric Vehicle (BEV) Market Forecast & COVID Impact Analysis
• Slovenia Battery Electric Vehicle (BEV) Market Forecast & COVID Impact Analysis
• Bulgaria Battery Electric Vehicle (BEV) Market Forecast & COVID Impact Analysis
• Malta Battery Electric Vehicle (BEV) Market Forecast & COVID Impact Analysis
• Greece Battery Electric Vehicle (BEV) Market Forecast & COVID Impact Analysis
• Slovakia Battery Electric Vehicle (BEV) Market Forecast & COVID Impact Analysis
• Rest of Europe Battery Electric Vehicle (BEV) Market Forecast & COVID Impact Analysis
• Asia Pacific Battery Electric Vehicle (BEV) Market Outlook
• China Battery Electric Vehicle (BEV) Market Forecast & COVID Impact Analysis
• Japan Battery Electric Vehicle (BEV) Market Forecast & COVID Impact Analysis
• India Battery Electric Vehicle (BEV) Market Forecast & COVID Impact Analysis
• South Korea Battery Electric Vehicle (BEV) Market Forecast & COVID Impact Analysis
• Australia Battery Electric Vehicle (BEV) Market Forecast & COVID Impact Analysis
• Rest of APAC Battery Electric Vehicle (BEV) Market Forecast & COVID Impact Analysis
• Rest of World Battery Electric Vehicle (BEV) Market Outlook
• South America Battery Electric Vehicle (BEV) Market Forecast & COVID Impact Analysis
• Middle East Battery Electric Vehicle (BEV) Market Forecast & COVID Impact Analysis
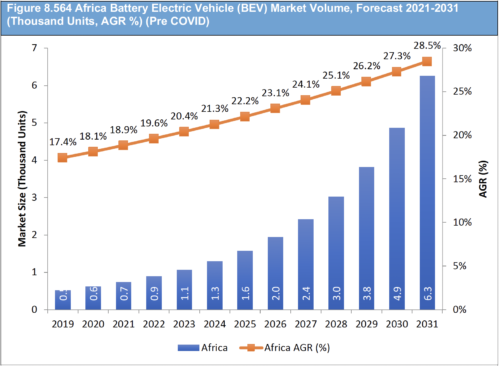
• Africa Battery Electric Vehicle (BEV) Market Forecast & COVID Impact Analysis
Need industry data? Please contact us today.
The report also includes profiles and for some of the leading companies in the Battery Electric Vehicle (BEV) market, with a focus on this segment of these companies’ operations.
Leading companies and the potential for market growth
Based on our estimates, overall revenue for Battery Electric Vehicle (BEV) Market will surpass $x million in 2021. We predict very strong revenue growth through to 2031. Our report identifies which organizations hold the greatest potential. Discover their capabilities, progress, and commercial prospects, helping you stay ahead.
How the Battery Electric Vehicle (BEV) Market report helps you
In summary, our 1110-page report provides you with the following knowledge:
• Revenue forecasts to 2031 for Battery Electric Vehicle (BEV) Market, with forecasts for Vehicle Type and battery type, each forecasted at a global and regional level– discover the industry’s prospects, finding the most lucrative places for investments and revenues
• Revenue forecasts to 2031 for 4 regional and 39 key national markets – See forecasts for the Battery Electric Vehicle (BEV) market in North America, Europe, Asia-Pacific and Rest of the World. Also forecasted is the market in the US, Canada, Mexico, Germany, Norway, Netherlands, France, UK, Sweden, Switzerland, Italy, Spain, Austria, Belgium, Portugal, Finland, Denmark, Ireland, Hungary, Poland, Romania, Luxembourg, Iceland, Czech Republic, Slovenia, Bulgaria, Malta, Greece, Slovakia, India, China, Japan, South Korea, Australia, Brazil, Argentina, UAE, and Saudi Arabia among other prominent economies.
• Prospects for established firms and those seeking to enter the market– including company profiles for 20 of the major companies involved in the Battery Electric Vehicle (BEV) market. Some of the company’s profiled in this report include Tesla, Inc., Nissan Motor Corporation, Renault S.A., Bayerische Motoren Werke AG, Beijing Automotive Industry Holding Co., Ltd., Chery Automobile Co., Ltd., Volkswagen AG, SAIC Motor Corporation Limited, BYD Company Ltd., Zhejiang Geely Holding Group Co., Ltd., Blue Bird Corporation, Volvo Cars, Kia Corporation, General Motors Company, Audi AG, Hyundai Motor Company, Tata Motors, Porsche AG, Polestar AB, and Ford Motor Company.
Find quantitative and qualitative analyses with independent predictions. Receive information that only our report contains, staying informed with this invaluable business intelligence.
Information found nowhere else
With our newly report title, you are less likely to fall behind in knowledge or miss out on opportunities. See how our work could benefit your research, analyses, and decisions. Visiongain’s study is for everybody needing commercial analyses for the Battery Electric Vehicle (BEV) market and leading companies. You will find data, trends and predictions.
To access the data contained in this document please email contactus@visiongain.com
Buy our report today Battery Electric Vehicle (BEV) Market Report 2021-2031: Forecasts by Vehicle Type (Passenger Vehicles, Light Commercial Vehicles (LCVs), and Heavy Commercial Vehicles (HCVs), by Battery Type (Lithium-ion Batteries, Lead-acid Batteries, and Nickel-metal Hydride Batteries) AND Regional and Leading National Market Analysis PLUS Analysis of Leading BEV Companies AND COVID-19 Recovery Scenarios.
Avoid missing out by staying informed – order our report now.
Visiongain is a trading partner with the US Federal Government
CCR Ref number: KD4R6
Do you have any custom requirements we can help you with? Any need for a specific country, geo region, market segment or specific company information? Contact us today, we can discuss your needs and see how we can help: sara.peerun@visiongain.com
1. Report Overview
1.1. Global Battery Electric Vehicle (BEV) Market Overview
1.2. Market Definition
1.3. Why You Should Read This Report
1.4. How This Report Delivers
1.5. Key Questions Answered by This Analytical Report Include:
1.6. Who is This Report For?
1.7. Methodology
1.7.1. Primary Research
1.7.2. Secondary Research
1.7.3. Market Evaluation & Forecasting Methodology
1.8. Frequently Asked Questions (FAQ)
1.9. Associated Visiongain Reports
1.10. About Visiongain
2. Global Battery Electric Vehicle (BEV) Market – Executive Summery
2.1. Global Battery Electric Vehicle (BEV) Market Segmentation
3. Global Battery Electric Vehicle (BEV) Industry Structure
3.1 How Do BEVs Work?
3.2 Key Components of BEVs
3.3 Battery Electric Vehicle (BEV) Submarket Definition by Vehicle Type
3.3.1 Passenger Vehicles
3.3.2 Light Commercial Vehicles
3.3.3 Heavy Commercial Vehicles
3.4 Battery Electric Vehicle (BEV) Submarket Definition by Battery Type
3.4.1 Lithium-ion Batteries
3.4.2 Lead-acid Batteries
3.4.3 Nickel-metal Hydride Batteries
3.5 Battery Electric Vehicle (BEV) Market – Value Chain Analysis
3.6 Battery Electric Vehicle (BEV) Market – Price Trend Analysis
4. Global Battery Electric Vehicle (BEV) Market Outlook
4.1 Pre-COVID Forecast: Global Battery Electric Vehicle (BEV) Market 2021-2031
4.2 “V” Shaped Recovery: Global Battery Electric Vehicle (BEV) Market Revenue 2021-2031
4.3 “U” shaped Recovery Global Battery Electric Vehicle (BEV) Market Revenue 2021-2031
4.4 “L” shaped Recovery: Global Battery Electric Vehicle (BEV) Market Revenue 2021-2031
4.5 “W” Shaped Recovery: Global Battery Electric Vehicle (BEV) Market Revenue 2021-2031
5. Global Battery Electric Vehicle (BEV) Market Dynamics
5.1 Market Drivers
5.1.1 Stringent Government Regulations Regarding Vehicular Emission
5.1.2 Rising Consumer Awareness about the Use of Fuel-Efficient Vehicles
5.1.3 Growing Innovation along with Advanced Technology
5.1.4 Growing need to Minimize Greenhouse Gas and Air Pollutant Emissions
5.1.5 Reducing Dependency on Other Fuel Alternative
5.1.6 Tackling climate change
5.2 Market Restraints
5.2.1 High Initial Cost Associated with Battery Electric Vehicles
5.2.2 Limited Range
5.2.3 Limited Road and Public Charging Infrastructure
5.3 Market Challenges
5.3.1 Policy, regulation and other legal issues
5.3.2 COVID-19 Impact
5.4 Market Trends and Opportunities
5.4.1 Significant Improvement in Public Charging Infrastructure
5.4.2 Government Initiatives Promoting BEVs
5.5 SWOT Analysis
5.6 Porter’s Five Forces Analysis
5.6.1 Bargaining Power of Suppliers - Moderate
5.6.2 Bargaining Power of Buyers – Moderate to High
5.6.3 Threat of Substitutes - Moderate
5.6.4 Threat of New Entrants - Moderate
5.6.5 Competitive Rivalry - Moderate to High
5.7 PESTLE Analysis
5.8 Regulatory Framework
6. Global Battery Electric Vehicle (BEV) Market by Vehicle Type Forecast 2021-2031 (Pre COVID and V, U, W and L COVID Recovery Scenarios)
6.1 Passenger Vehicles is the Largest Segment in the Global Battery Electric Vehicles Market
6.2 Global Battery Electric Passenger Vehicles Market Forecast 2021-2031
6.3 Global Battery Electric Light Commercial Vehicles Market Forecast 2021-2031
6.4 Global Battery Electric Heavy Commercial Vehicles Market Forecast 2021-2031
7. Global Battery Electric Vehicle (BEV) Market by Battery Type Forecast 2021-2031 (Pre COVID and V, U, W and L COVID Recovery Scenarios)
7.1 Lithium-ion Batteries is the Largest and Fastest Growing Segment in the Global Battery Electric Vehicles Market
8. Regional & Leading National Battery Electric Vehicle (BEV) Market Forecast 2021-2031 (Pre COVID and V, U, W and L COVID Recovery Scenarios)
8.1 Asia-Pacific is the Largest Region in the Global Battery Electric Vehicles Market
8.2 North America Battery Electric Vehicle (BEV) Market 2021-2031
8.2.1 North America Battery Electric Vehicle (BEV) Market by Vehicle Type Forecast 2021-2031
8.2.1.1 Passenger Vehicle Submarket by Vehicle Type is Expected to Acquire Largest Share
8.2.2 North America Battery Electric Vehicle (BEV) Market by Battery Type Forecast 2021-2031
8.2.2.1 Lithium-ion Batteries Submarket by Battery Type is Expected to Grow at Fastest Rate during the whole forecast period
8.2.3 North America Battery Electric Vehicle (BEV) Market by Country 2021-2031
8.2.4 US Battery Electric Vehicle (BEV) Market 2021-2031
8.2.4.1 Strict Government Regulation to Control the Emission
8.2.4.1 US Battery Electric Vehicle (BEV) Market by Vehicle Type Forecast 2021-2031
8.2.4.2 US Battery Electric Vehicle (BEV) Market by Battery Type Forecast 2021-2031
8.2.5 Canada Battery Electric Vehicle (BEV) Market 2021-2031
8.2.5.1 Rising Demand of Light Weight Vehicles
8.2.5.1 Canada Battery Electric Vehicle (BEV) Market by Vehicle Type Forecast 2021-2031
8.2.5.2 Canada Battery Electric Vehicle (BEV) Market by Battery Type Forecast 2021-2031
8.2.6 Mexico Battery Electric Vehicle (BEV) Market 2021-2031
8.2.6.1 Growing Automotive Industry
8.2.6.1 Mexico Battery Electric Vehicle (BEV) Market by Vehicle Type Forecast 2021-2031
8.3 Europe Battery Electric Vehicle (BEV) Market 2021-2031
8.3.1 Europe Battery Electric Vehicle (BEV) Market by Vehicle Type Forecast 2021-2031
8.3.1.1 Passenger vehicle segment by vehicle Type is dominated the market in the base year and is expected to dominate in the forecast period as well due to high adoption in the various applications
8.3.2 Europe Battery Electric Vehicle (BEV) Market by Battery Type Forecast 2021-2031
8.3.2.1 Lithium-ion Battery segment by battery Type acquired the largest share by revenue and expected to maintain its position in the coming years
8.3.3 Europe Battery Electric Vehicle (BEV) Market by Country 2021-2031
8.3.3.1 Norway held the largest share by revenue and expected to be replaced its position by Germany in the coming years
8.3.4 Germany Battery Electric Vehicle (BEV) Market by Vehicle Type Forecast 2021-2031
8.3.4.1 Developed Nation with the Strong Automotive Sector
8.3.5 Norway Battery Electric Vehicle (BEV) Market by Vehicle Type Forecast 2021-2031
8.3.5.1 Rising Demand of Electric Vehicles
8.3.6 Netherlands Battery Electric Vehicle (BEV) Market by Vehicle Type Forecast 2021-2031
8.3.6.1 Supportive Government Regulations
8.3.7 France Battery Electric Vehicle (BEV) Market by Vehicle Type Forecast 2021-2031
8.3.7.1 Rising lightweight vehicles demand
8.3.8 UK Battery Electric Vehicle (BEV) Market by Vehicle Type Forecast 2021-2031
8.3.8.1 Public and Private Investment in Automotive Sector
8.3.9 Sweden Battery Electric Vehicle (BEV) Market by Vehicle Type Forecast 2021-2031
8.3.9.1 High Adoption of Electric Vehicles
8.3.10 Switzerland Battery Electric Vehicle (BEV) Market by Vehicle Type Forecast 2021-2031
8.3.10.1 Strong Emission Regulations
8.3.11 Italy Battery Electric Vehicle (BEV) Market by Vehicle Type Forecast 2021-2031
8.3.11.1 Focus towards R&D
8.3.12 Spain Battery Electric Vehicle (BEV) Market by Vehicle Type Forecast 2021-2031
8.3.12.1 Replacement of conventional vehicles with the BEVs
8.3.13 Austria Battery Electric Vehicle (BEV) Market by Vehicle Type Forecast 2021-2031
8.3.13.1 High adoption of zero emission vehicles
8.3.14 Belgium Battery Electric Vehicle (BEV) Market 2021-2031
8.3.14.1 Supportive government policies
8.3.15 Portugal Battery Electric Vehicle (BEV) Market 2021-2031
8.3.15.1 Improvement in public charging infrastructure
8.3.16 Finland Battery Electric Vehicle (BEV) Market 2021-2031
8.3.16.1 Introduction of new BEVs
8.3.17 Denmark Battery Electric Vehicle (BEV) Market 2021-2031
8.3.17.1 Investment in R&D
8.3.18 Ireland Battery Electric Vehicle (BEV) Market 2021-2031
8.3.18.1 Adoption of sustainability models
8.3.19 Hungary Battery Electric Vehicle (BEV) Market 2021-2031
8.3.19.1 Supportive government regulations
8.3.20 Poland Battery Electric Vehicle (BEV) Market 2021-2031
8.3.20.1 Rising consumer awareness regarding the adoption of BEVs
8.3.21 Romania Battery Electric Vehicle (BEV) Market 2021-2031
8.3.21.1 Rising investments in public and private charging infrastructure
8.3.22 Luxembourg Battery Electric Vehicle (BEV) Market 2021-2031
8.3.22.1 Entry of foreign players with advanced offerings
8.3.23 Iceland Battery Electric Vehicle (BEV) Market 2021-2031
8.3.23.1 Huge charging infrastructure and supportive government initiatives
8.3.24 Czech Republic Battery Electric Vehicle (BEV) Market 2021-2031
8.3.24.1 Electric cars and network of charging stations
8.3.25 Slovenia Battery Electric Vehicle (BEV) Market 2021-2031
8.3.25.1 Government of Slovenia has adopted a strategy to boost the adoption of electric vehicles and reduce carbon emissions
8.3.26 Bulgaria Battery Electric Vehicle (BEV) Market 2021-2031
8.3.26.1 Electric mobility in Bulgaria is gaining momentum with increased involvement of public and private players
8.3.27 Malta Battery Electric Vehicle (BEV) Market 2021-2031
8.3.27.1 Government is providing subsidies
8.3.28 Greece Battery Electric Vehicle (BEV) Market 2021-2031
8.3.28.1 Extensive subsidies to foster electric mobility
8.3.29 Slovakia Battery Electric Vehicle (BEV) Market 2021-2031
8.3.29.1 Government has allocated funds to support the development of BEVs
8.3.30 Rest of Europe Battery Electric Vehicle (BEV) Market 2021-2031
8.4 APAC Battery Electric Vehicle (BEV) Market 2021-2031
8.4.1 APAC Battery Electric Vehicle (BEV) Market by Vehicle Type Forecast 2021-2031
8.4.1.1 Passenger vehicle segment is expected to rise at significant growth rate during the forecast period
8.4.2 APAC Battery Electric Vehicle (BEV) Market by Battery Type Forecast 2021-2031
8.4.1.1 Lithium-ion batteries segment offer huge opportunity in the forecast period due to its higher adoption
8.4.3 APAC Battery Electric Vehicle (BEV) Market by Country 2021-2031
8.4.4 China Battery Electric Vehicle (BEV) Market 2021-2031
8.4.4.1 Largest producer and consumer of electric vehicles
8.4.4.1 China Battery Electric Vehicle (BEV) Market by Vehicle Type Forecast 2021-2031
8.4.4.2 China Battery Electric Vehicle (BEV) Market by Battery Type Forecast 2021-2031
8.4.5 Japan Battery Electric Vehicle (BEV) Market 2021-2031
8.4.5.1 Developed nation
8.4.5.1 Japan Battery Electric Vehicle (BEV) Market by Vehicle Type Forecast 2021-2031
8.4.5.2 Japan Battery Electric Vehicle (BEV) Market by Battery Type Forecast 2021-2031
8.4.6 India Battery Electric Vehicle (BEV) Market by Vehicle Type Forecast 2021-2031
8.4.6.1 Rising investment in automotive sector
8.4.7 South Korea Battery Electric Vehicle (BEV) Market by Vehicle Type Forecast 2021-2031
8.4.7.1 Rising automotive production
8.4.8 Australia Battery Electric Vehicle (BEV) Market by Vehicle Type Forecast 2021-2031
8.4.8.1 Strict emission regulations
8.4.9 Rest of APAC Battery Electric Vehicle (BEV) Market 2021-2031
8.5 RoW Battery Electric Vehicle (BEV) Market 2021-2031
8.5.1 RoW Battery Electric Vehicle (BEV) Market by Vehicle Type Forecast 2021-2031
8.5.1.1 Passenger vehicle is the prominent segment by vehicle type which offers huge growth potential
8.5.2 RoW Battery Electric Vehicle (BEV) Market by Battery Type Forecast 2021-2031
8.5.2.1 Lithium-ion batteries segment is expected to be the largest segment
8.5.3 RoW Battery Electric Vehicle (BEV) Market by Region 2021-2031
8.5.3.1 South Africa region is expected to be the largest and fastest growing
8.5.4 South America Battery Electric Vehicle (BEV) Market by Country Forecast 2021-2031
8.5.4.1 Presence of major OEMS
8.5.5 Middle East Battery Electric Vehicle (BEV) Market by Country Forecast 2021-2031
8.5.5.1 High demand of advanced vehicles
8.5.6 Africa Battery Electric Vehicle (BEV) Market 2021-2031
8.5.6.1 Rising investment by foreign players
9. Leading Battery Electric Vehicle (BEV) Companies
9.1 TESLA, INC.
9.1.1 Tesla, Inc. Company Introduction
9.1.2 Tesla, Inc. Company Overview
9.1.3 Tesla, Inc. Battery Electric Vehicle (BEV) Product Portfolio
9.1.4 Tesla, Inc. Financial Analysis
9.1.4.1 Net Revenue
9.1.4.2 Revenue by Region
9.1.4.3 Revenue by Segment
9.1.5 Tesla, Inc. Recent Developments
9.2 NISSAN MOTOR CORPORATION
9.2.1 Nissan Motor Corporation Company Introduction
9.2.2 Nissan Motor Corporation Company Overview
9.2.3 Nissan Motor Corporation Battery Electric Vehicle (BEV) Product Portfolio
9.2.4 Nissan Motor Corporation Financial Analysis
9.2.4.1 Net Revenue
9.2.4.2 Revenue by Region
9.2.4.3 Revenue by Segment
9.2.5 Nissan Motor Corporation Recent Developments
9.3 RENAULT S.A.
9.3.1 Renault S.A. Company Introduction
9.3.2 Renault S.A. Company Overview
9.3.3 Renault S.A. Battery Electric Vehicle (BEV) Products Portfolio
9.3.4 Renault S.A. Financial Analysis
9.3.4.1 Net Revenue
9.3.4.2 Revenue by Region
9.3.4.3 Revenue by Segment
9.3.5 Renault S.A. Recent Developments
9.4 BAYERISCHE MOTOREN WERKE AG
9.4.1 Bayerische Motoren Werke AG Company Introduction
9.4.2 Bayerische Motoren Werke AG Company Overview
9.4.3 Bayerische Motoren Werke AG Battery Electric Vehicle (BEV) Products Portfolio
9.4.4 Bayerische Motoren Werke AG Financial Analysis
9.4.4.1 Net Revenue
9.4.4.2 Revenue by Region
9.4.4.3 Revenue by Segment
9.4.5 Bayerische Motoren Werke AG Recent Developments
9.5 BEIJING AUTOMOTIVE INDUSTRY HOLDING CO., LTD.
9.5.1 Beijing Automotive Industry Holding Co., Ltd. Company Introduction
9.5.2 Beijing Automotive Industry Holding Co., Ltd. Company Overview
9.5.3 Beijing Automotive Industry Holding Co., Ltd. Battery Electric Vehicle (BEV) Products Portfolio
9.5.4 Beijing Automotive Industry Holding Co., Ltd. Financial Analysis
9.5.4.1 Net Revenue
9.5.4.2 Revenue by Region
9.5.4.3 Revenue by Segment
9.5.5 Beijing Automotive Industry Holding Co., Ltd. Recent Developments
9.6 CHERY AUTOMOBILE CO., LTD.
9.6.1 Chery Automobile Co., Ltd. Company Introduction
9.6.2 Chery Automobile Co., Ltd. Company Overview
9.6.3 Chery Automobile Co., Ltd. Battery Electric Vehicle (BEV) Products Portfolio
9.6.4 Chery Automobile Co., Ltd. Recent Developments
9.7 VOLKSWAGEN AG
9.7.1 Volkswagen AG Company Introduction
9.7.2 Volkswagen AG Company Overview
9.7.3 Volkswagen AG Battery Electric Vehicle (BEV) Products Portfolio
9.7.4 Volkswagen AG Financial Analysis
9.7.4.1 Net Revenue
9.7.4.2 Revenue by Region
9.7.4.3 Revenue by Segment
9.7.5 Volkswagen AG Recent Developments
9.8 SAIC MOTOR CORPORATION LIMITED
9.8.1 SAIC Motor Corporation Limited Company Introduction
9.8.2 SAIC Motor Corporation Limited Company Overview
9.8.3 SAIC Motor Corporation Limited Battery Electric Vehicle (BEV) Products Portfolio
9.8.4 SAIC Motor Corporation Limited Financial Analysis
9.8.4.1 Net Revenue
9.8.4.2 Revenue by Region
9.8.4.3 Revenue by Segment
9.8.5 SAIC Motor Corporation Limited Recent Developments
9.9 BYD COMPANY LTD.
9.9.1 BYD Company Ltd. Company Introduction
9.9.2 BYD Company Ltd. Company Overview
9.9.3 BYD Company Ltd. Battery Electric Vehicle (BEV) Products Portfolio
9.9.4 BYD Company Ltd. Financial Analysis
9.9.4.1 Net Revenue
9.9.4.2 Revenue by Region
9.9.4.3 Revenue by Segment
9.9.5 BYD Company Ltd. Recent Developments
9.10 ZHEJIANG GEELY HOLDING GROUP CO., LTD.
9.10.1 Zhejiang Geely Holding Group Co., Ltd. Company Introduction
9.10.2 Zhejiang Geely Holding Group Co., Ltd. Company Overview
9.10.3 Zhejiang Geely Holding Group Co., Ltd. Battery Electric Vehicle (BEV) Products Portfolio
9.10.4 Zhejiang Geely Holding Group Co., Ltd. Financial Analysis
9.10.4.1 Net Revenue
9.10.4.2 Revenue by Region
9.10.4.3 Revenue by Segment
9.10.5 Zhejiang Geely Holding Group Co., Ltd. Recent Developments
9.11 BLUE BIRD CORPORATION
9.11.1 Blue Bird Corporation Company Introduction
9.11.2 Blue Bird Corporation Company Overview
9.11.3 Blue Bird Corporation Battery Electric Vehicle (BEV) Products Portfolio
9.11.4 Blue Bird Corporation Financial Analysis
9.11.4.1 Net Revenue
9.11.4.2 Revenue by Region
9.11.4.3 Revenue by Segment
9.11.5 Blue Bird Corporation Recent Developments
9.12 VOLVO CAR CORPORATION
9.12.1 Volvo Car Corporation Company Introduction
9.12.2 Volvo Car Corporation Company Overview
9.12.3 Volvo Car Corporation Battery Electric Vehicle (BEV) Products Portfolio
9.12.4 Volvo Car Corporation Financial Analysis
9.12.4.1 Net Revenue
9.12.4.2 Revenue by Region
9.12.4.3 Revenue by Segment
9.12.5 Volvo Car Corporation Recent Developments
9.13 KIA CORPORATION
9.13.1 Kia Corporation Company Introduction
9.13.2 Kia Corporation Company Overview
9.13.3 Kia Corporation Battery Electric Vehicle (BEV) Products Portfolio
9.13.4 Kia Corporation Financial Analysis
9.13.4.1 Net Revenue
9.13.4.2 Revenue by Region
9.13.4.3 Revenue by Segment
9.13.5 Kia Corporation Recent Developments
9.14 GENERAL MOTORS COMPANY
9.14.1 General Motors Company Introduction
9.14.2 General Motors Company Overview
9.14.3 General Motors Company Battery Electric Vehicle (BEV) Products Portfolio
9.14.4 General Motors Company Financial Analysis
9.14.4.1 Net Revenue
9.14.4.2 Revenue by Region
9.14.4.3 Revenue by Segment
9.14.5 General Motors Company Recent Developments
9.15 AUDI AG
9.15.1 Audi AG Company Introduction
9.15.2 Audi AG Company Overview
9.15.3 Audi AG Battery Electric Vehicle (BEV) Products Portfolio
9.15.4 Audi AG Financial Analysis
9.15.4.1 Net Revenue
9.15.4.2 Revenue by Region
9.15.4.3 Revenue by Segment
9.15.5 Audi AG Recent Developments
9.16 HYUNDAI MOTOR COMPANY
9.16.1 Hyundai Motor Company Introduction
9.16.2 Hyundai Motor Company Overview
9.16.3 Hyundai Motor Company Battery Electric Vehicle (BEV) Products Portfolio
9.16.4 Hyundai Motor Company Financial Analysis
9.16.4.1 Net Revenue
9.16.4.2 Revenue by Region
9.16.4.3 Revenue by Segment
9.16.5 Hyundai Motor Company Recent Developments
9.17 TATA MOTORS LIMITED
9.17.1 Tata Motors Limited Company Introduction
9.17.2 Tata Motors Limited Company Overview
9.17.3 Tata Motors Limited Battery Electric Vehicle (BEV) Products Portfolio
9.17.4 Tata Motors Limited Financial Analysis
9.17.4.1 Net Revenue
9.17.4.2 Revenue by Region
9.17.4.3 Revenue by Segment
9.17.5 Tata Motors Limited Recent Developments
9.18 PORSCHE AG
9.18.1 Porsche AG Company Introduction
9.18.2 Porsche AG Company Overview
9.18.3 Porsche AG Battery Electric Vehicle (BEV) Products Portfolio
9.18.4 Porsche AG Financial Analysis
9.18.4.1 Net Revenue
9.18.4.2 Revenue by Region
9.18.4.3 Revenue by Segment
9.18.5 Porsche AG Recent Developments
9.19 Ford Motor Company
9.19.1 Ford Motor Company Introduction
9.19.2 Ford Motor Company Overview
9.19.3 Ford Motor Company Battery Electric Vehicle (BEV) Products Portfolio
9.19.4 Ford Motor Company Financial Analysis
9.19.4.1 Net Revenue
9.19.4.2 Revenue by Region
9.19.4.3 Revenue by Segment
9.19.5 Ford Motor Company Recent Developments
9.20 POLESTAR AB
9.20.1 Polestar AB Company Introduction
9.20.2 Polestar AB Company Overview
9.20.3 Polestar AB Battery Electric Vehicle (BEV) Products Portfolio
9.20.4 Polestar AB Recent Developments
9.21 Other Battery Electric Vehicle (BEV) Market Players
9.22 List of Associations and Organizations
10. Conclusions and Recommendations
10.1 Conclusions
10.2 Recommendations
11. Glossary
List of Tables
Table 2.1 Global Battery Electric Vehicle (BEV) Market Snapshot, 2021 & 2031 (US$Mn, Thousand Units, CAGR %) (Pre COVID)
Table 3.1 Batteries Comparison
Table 4.1 Global Battery Electric Vehicle (BEV) Market Revenue, Forecast 2021-2031 (US$Mn, AGR %, CAGR %) (Pre COVID)
Table 4.2 Global Battery Electric Vehicle (BEV) Market Volume, Forecast 2021-2031 (Thousand Units, AGR %, CAGR %) (Pre COVID)
Table 4.3 Global Battery Electric Vehicle (BEV) Market Revenue, Forecast 2021-2031 (US$Mn, AGR %, CAGR %) (V Shaped Recovery)
Table 4.4 Global Battery Electric Vehicle (BEV) Market Volume, Forecast 2021-2031 (Thousand Units, AGR %, CAGR %) (V Shaped Recovery)
Table 4.5 Global Battery Electric Vehicle (BEV) Market Revenue, Forecast 2021-2031 (US$Mn, AGR %, CAGR %) (U Shaped Recovery)
Table 4.6 Global Battery Electric Vehicle (BEV) Market Volume, Forecast 2021-2031 (Thousand Units, AGR %, CAGR %) (U Shaped Recovery)
Table 4.7 Global Battery Electric Vehicle (BEV) Market Revenue, Forecast 2021-2031 (US$Mn, AGR %, CAGR %) (L Shaped Recovery)
Table 4.8 Global Battery Electric Vehicle (BEV) Market Volume, Forecast 2021-2031 (Thousand Units, AGR %, CAGR %) (L Shaped Recovery)
Table 4.9 Global Battery Electric Vehicle (BEV) Market Revenue, Forecast 2021-2031 (US$Mn, AGR %, CAGR %) (W Shaped Recovery)
Table 4.10 Global Battery Electric Vehicle (BEV) Market Volume, Forecast 2021-2031 (Thousand Units, AGR %, CAGR %) (W Shaped Recovery)
Table 5.1 Global Battery Electric Vehicle (BEV) Market SWOT Analysis 2021-2031
Table 5.2 Global Battery Electric Vehicle (BEV) Market PESTLE Analysis
Table 5.3 Global Battery Electric Vehicle (BEV) Market Regulatory Framework
Table 6.1 Global Battery Electric Vehicle (BEV) Market Revenue by Vehicle Type, Forecast 2021-2031 (US$Mn, AGR %, CAGR %) (Pre COVID)
Table 6.2 Global Battery Electric Vehicle (BEV) Market Volume by Vehicle Type, Forecast 2021-2031 (Thousand Units, AGR %, CAGR %) (Pre COVID)
Table 6.3 Global Battery Electric Vehicle (BEV) Market Revenue by Vehicle Type, Forecast 2021-2031 (US$Mn, AGR %, CAGR %) (V Shaped Recovery)
Table 6.4 Global Battery Electric Vehicle (BEV) Market Volume by Vehicle Type, Forecast 2021-2031 (Thousand Units, AGR %, CAGR %) (V Shaped Recovery)
Table 6.5 Global Battery Electric Vehicle (BEV) Market Revenue by Vehicle Type, Forecast 2021-2031 (US$Mn, AGR %, CAGR %) (U Shaped Recovery)
Table 6.6 Global Battery Electric Vehicle (BEV) Market Volume by Vehicle Type, Forecast 2021-2031 (Thousand Units, AGR %, CAGR %) (U Shaped Recovery)
Table 6.7 Global Battery Electric Vehicle (BEV) Market Revenue by Vehicle Type, Forecast 2021-2031 (US$Mn, AGR %, CAGR %) (L Shaped Recovery)
Table 6.8 Global Battery Electric Vehicle (BEV) Market Volume by Vehicle Type, Forecast 2021-2031 (Thousand Units, AGR %, CAGR %) (L Shaped Recovery)
Table 6.9 Global Battery Electric Vehicle (BEV) Market Revenue by Vehicle Type, Forecast 2021-2031 (US$Mn, AGR %, CAGR %) (W Shaped Recovery)
Table 6.10 Global Battery Electric Vehicle (BEV) Market Volume by Vehicle Type, Forecast 2021-2031 (Thousand Units, AGR %, CAGR %) (W Shaped Recovery)
Table 6.11 Global Battery Electric Passenger Vehicles Market Revenue by Region, Forecast 2021-2031 (US$Mn, AGR %, CAGR %) (Pre COVID)
Table 6.12 Global Battery Electric Passenger Vehicles Market Volume by Region, Forecast 2021-2031 (Thousand Units, AGR %, CAGR %) (Pre COVID)
Table 6.13 Global Battery Electric Passenger Vehicles Market Revenue by Region, Forecast 2021-2031 (US$Mn, AGR %, CAGR %) (V Shaped Recovery)
Table 6.14 Global Battery Electric Passenger Vehicles Market Volume by Region, Forecast 2021-2031 (Thousand Units, AGR %, CAGR %) (V Shaped Recovery)
Table 6.15 Global Battery Electric Passenger Vehicles Market Revenue by Region, Forecast 2021-2031 (US$Mn, AGR %, CAGR %) (U Shaped Recovery)
Table 6.16 Global Battery Electric Passenger Vehicles Market Volume by Region, Forecast 2021-2031 (Thousand Units, AGR %, CAGR %) (U Shaped Recovery)
Table 6.17 Global Battery Electric Passenger Vehicles Market Revenue by Region, Forecast 2021-2031 (US$Mn, AGR %, CAGR %) (L Shaped Recovery)
Table 6.18 Global Battery Electric Passenger Vehicles Market Volume by Region, Forecast 2021-2031 (Thousand Units, AGR %, CAGR %) (L Shaped Recovery)
Table 6.19 Global Battery Electric Passenger Vehicles Market Revenue by Region, Forecast 2021-2031 (US$Mn, AGR %, CAGR %) (W Shaped Recovery)
Table 6.20 Global Battery Electric Passenger Vehicles Market Volume by Region, Forecast 2021-2031 (Thousand Units, AGR %, CAGR %) (W Shaped Recovery)
Table 6.21 Global Battery Electric Light Commercial Vehicles Market Revenue by Region, Forecast 2021-2031 (US$Mn, AGR %, CAGR %) (Pre COVID)
Table 6.22 Global Battery Electric Light Commercial Vehicles Market Volume by Region, Forecast 2021-2031 (Thousand Units, AGR %, CAGR %) (Pre COVID)
Table 6.23 Global Battery Electric Light Commercial Vehicles Market Revenue by Region, Forecast 2021-2031 (US$Mn, AGR %, CAGR %) (V Shaped Recovery)
Table 6.24 Global Battery Electric Light Commercial Vehicles Market Volume by Region, Forecast 2021-2031 (Thousand Units, AGR %, CAGR %) (V Shaped Recovery)
Table 6.25 Global Battery Electric Light Commercial Vehicles Market Revenue by Region, Forecast 2021-2031 (US$Mn, AGR %, CAGR %) (U Shaped Recovery)
Table 6.26 Global Battery Electric Light Commercial Vehicles Market Volume by Region, Forecast 2021-2031 (Thousand Units, AGR %, CAGR %) (U Shaped Recovery)
Table 6.27 Global Battery Electric Light Commercial Vehicles Market Revenue by Region, Forecast 2021-2031 (US$Mn, AGR %, CAGR %) (L Shaped Recovery)
Table 6.28 Global Battery Electric Light Commercial Vehicles Market Volume by Region, Forecast 2021-2031 (Thousand Units, AGR %, CAGR %) (L Shaped Recovery)
Table 6.29 Global Battery Electric Light Commercial Vehicles Market Revenue by Region, Forecast 2021-2031 (US$Mn, AGR %, CAGR %) (W Shaped Recovery)
Table 6.30 Global Battery Electric Light Commercial Vehicles Market Volume by Region, Forecast 2021-2031 (Thousand Units, AGR %, CAGR %) (W Shaped Recovery)
Table 6.31 Global Battery Electric Heavy Commercial Vehicles Market Revenue by Region, Forecast 2021-2031 (US$Mn, AGR %, CAGR %) (Pre COVID)
Table 6.32 Global Battery Electric Heavy Commercial Vehicles Market Volume by Region, Forecast 2021-2031 (Thousand Units, AGR %, CAGR %) (Pre COVID)
Table 6.33 Global Battery Electric Heavy Commercial Vehicles Market Revenue by Region, Forecast 2021-2031 (US$Mn, AGR %, CAGR %) (V Shaped Recovery)
Table 6.34 Global Battery Electric Heavy Commercial Vehicles Market Volume by Region, Forecast 2021-2031 (Thousand Units, AGR %, CAGR %) (V Shaped Recovery)
Table 6.35 Global Battery Electric Heavy Commercial Vehicles Market Revenue by Region, Forecast 2021-2031 (US$Mn, AGR %, CAGR %) (U Shaped Recovery)
Table 6.36 Global Battery Electric Heavy Commercial Vehicles Market Volume by Region, Forecast 2021-2031 (Thousand Units, AGR %, CAGR %) (U Shaped Recovery)
Table 6.37 Global Battery Electric Heavy Commercial Vehicles Market Revenue by Region, Forecast 2021-2031 (US$Mn, AGR %, CAGR %) (L Shaped Recovery)
Table 6.38 Global Battery Electric Heavy Commercial Vehicles Market Volume by Region, Forecast 2021-2031 (Thousand Units, AGR %, CAGR %) (L Shaped Recovery)
Table 6.39 Global Battery Electric Heavy Commercial Vehicles Market Revenue by Region, Forecast 2021-2031 (US$Mn, AGR %, CAGR %) (W Shaped Recovery)
Table 6.40 Global Battery Electric Heavy Commercial Vehicles Market Volume by Region, Forecast 2021-2031 (Thousand Units, AGR %, CAGR %) (W Shaped Recovery)
Table 7.1 Global Battery Electric Vehicle (BEV) Market Revenue by Battery Type, Forecast 2021-2031 (US$Mn, AGR %, CAGR %) (Pre COVID)
Table 7.2 Global Battery Electric Vehicle (BEV) Market Revenue by Battery Type, Forecast 2021-2031 (US$Mn, AGR %, CAGR %) (V Shaped Recovery)
Table 7.3 Global Battery Electric Vehicle (BEV) Market Revenue by Battery Type, Forecast 2021-2031 (US$Mn, AGR %, CAGR %) (U Shaped Recovery)
Table 7.4 Global Battery Electric Vehicle (BEV) Market Revenue by Battery Type, Forecast 2021-2031 (US$Mn, AGR %, CAGR %) (L Shaped Recovery)
Table 7.5 Global Battery Electric Vehicle (BEV) Market Revenue by Battery Type, Forecast 2021-2031 (US$Mn, AGR %, CAGR %) (W Shaped Recovery)
Table 8.1 Global Battery Electric Vehicle (BEV) Market Revenue by Region, Forecast 2021-2031 (US$Mn, AGR %, CAGR %) (Pre COVID)
Table 8.2 Global Battery Electric Vehicle (BEV) Market Volume by Region, Forecast 2021-2031 (Thousand Units, AGR %, CAGR %) (Pre COVID)
Table 8.3 North America Battery Electric Vehicle (BEV) Market Revenue, Forecast 2021-2031 (US$Mn, AGR %, CAGR %) (Pre COVID)
Table 8.4 North America Battery Electric Vehicle (BEV) Market Volume, Forecast 2021-2031 (Thousand Units, AGR %, CAGR %) (Pre COVID)
Table 8.5 North America Battery Electric Vehicle (BEV) Market Revenue, Forecast 2021-2031 (US$Mn, AGR %, CAGR %) (V Shaped Recovery)
Table 8.6 North America Battery Electric Vehicle (BEV) Market Volume, Forecast 2021-2031 (Thousand Units, AGR %, CAGR %) (V Shaped Recovery)
Table 8.7 North America Battery Electric Vehicle (BEV) Market Revenue, Forecast 2021-2031 (US$Mn, AGR %, CAGR %) (U Shaped Recovery)
Table 8.8 North America Battery Electric Vehicle (BEV) Market Volume, Forecast 2021-2031 (Thousand Units, AGR %, CAGR %) (U Shaped Recovery)
Table 8.9 North America Battery Electric Vehicle (BEV) Market Revenue, Forecast 2021-2031 (US$Mn, AGR %, CAGR %) (L Shaped Recovery)
Table 8.10 North America Battery Electric Vehicle (BEV) Market Volume, Forecast 2021-2031 (Thousand Units, AGR %, CAGR %) (L Shaped Recovery)
Table 8.11 North America Battery Electric Vehicle (BEV) Market Revenue, Forecast 2021-2031 (US$Mn, AGR %, CAGR %) (W Shaped Recovery)
Table 8.12 North America Battery Electric Vehicle (BEV) Market Volume, Forecast 2021-2031 (Thousand Units, AGR %, CAGR %) (W Shaped Recovery)
Table 8.13 North America Battery Electric Vehicle (BEV) Market Revenue by Vehicle Type, Forecast 2021-2031 (US$Mn, AGR %, CAGR %) (Pre COVID)
Table 8.14 North America Battery Electric Vehicle (BEV) Market Volume by Vehicle Type, Forecast 2021-2031 (Thousand Units, AGR %, CAGR %) (Pre COVID)
Table 8.15 North America Battery Electric Vehicle (BEV) Market Revenue by Vehicle Type, Forecast 2021-2031 (US$Mn, AGR %, CAGR %) (V Shaped Recovery)
Table 8.16 North America Battery Electric Vehicle (BEV) Market Volume by Vehicle Type, Forecast 2021-2031 (Thousand Units, AGR %, CAGR %) (V Shaped Recovery)
Table 8.17 North America Battery Electric Vehicle (BEV) Market Revenue by Vehicle Type, Forecast 2021-2031 (US$Mn, AGR %, CAGR %) (U Shaped Recovery)
Table 8.18 North America Battery Electric Vehicle (BEV) Market Volume by Vehicle Type, Forecast 2021-2031 (Thousand Units, AGR %, CAGR %) (U Shaped Recovery)
Table 8.19 North America Battery Electric Vehicle (BEV) Market Revenue by Vehicle Type, Forecast 2021-2031 (US$Mn, AGR %, CAGR %) (L Shaped Recovery)
Table 8.20 North America Battery Electric Vehicle (BEV) Market Volume by Vehicle Type, Forecast 2021-2031 (Thousand Units, AGR %, CAGR %) (L Shaped Recovery)
Table 8.21 North America Battery Electric Vehicle (BEV) Market Revenue by Vehicle Type, Forecast 2021-2031 (US$Mn, AGR %, CAGR %) (W Shaped Recovery)
Table 8.22 North America Battery Electric Vehicle (BEV) Market Volume by Vehicle Type, Forecast 2021-2031 (Thousand Units, AGR %, CAGR %) (W Shaped Recovery)
Table 8.23 North America Battery Electric Vehicle (BEV) Market Revenue by Battery Type, Forecast 2021-2031 (US$Mn, AGR %, CAGR %) (Pre COVID)
Table 8.24 North America Battery Electric Vehicle (BEV) Market Revenue by Battery Type, Forecast 2021-2031 (US$Mn, AGR %, CAGR %) (V Shaped Recovery)
Table 8.25 North America Battery Electric Vehicle (BEV) Market Revenue by Battery Type, Forecast 2021-2031 (US$Mn, AGR %, CAGR %) (U Shaped Recovery)
Table 8.26 North America Battery Electric Vehicle (BEV) Market Revenue by Battery Type, Forecast 2021-2031 (US$Mn, AGR %, CAGR %) (L Shaped Recovery)
Table 8.27 North America Battery Electric Vehicle (BEV) Market Revenue by Battery Type, Forecast 2021-2031 (US$Mn, AGR %, CAGR %) (W Shaped Recovery)
Table 8.28 North America Battery Electric Vehicle (BEV) Market Revenue by Country, Forecast 2021-2031 (US$Mn, AGR %, CAGR %) (Pre COVID)
Table 8.29 North America Battery Electric Vehicle (BEV) Market Volume by Country, Forecast 2021-2031 (Thousand Units, AGR %, CAGR %) (Pre COVID)
Table 8.30 North America Battery Electric Vehicle (BEV) Market Revenue by Country, Forecast 2021-2031 (US$Mn, AGR %, CAGR %) (V Shaped Recovery)
Table 8.31 North America Battery Electric Vehicle (BEV) Market Volume by Country, Forecast 2021-2031 (Thousand Units, AGR %, CAGR %) (V Shaped Recovery)
Table 8.32 North America Battery Electric Vehicle (BEV) Market Revenue by Country, Forecast 2021-2031 (US$Mn, AGR %, CAGR %) (U Shaped Recovery)
Table 8.33 North America Battery Electric Vehicle (BEV) Market Volume by Country, Forecast 2021-2031 (Thousand Units, AGR %, CAGR %) (U Shaped Recovery)
Table 8.34 North America Battery Electric Vehicle (BEV) Market Revenue by Country, Forecast 2021-2031 (US$Mn, AGR %, CAGR %) (L Shaped Recovery)
Table 8.35 North America Battery Electric Vehicle (BEV) Market Volume by Country, Forecast 2021-2031 (Thousand Units, AGR %, CAGR %) (L Shaped Recovery)
Table 8.36 North America Battery Electric Vehicle (BEV) Market Revenue by Country, Forecast 2021-2031 (US$Mn, AGR %, CAGR %) (W Shaped Recovery)
Table 8.37 North America Battery Electric Vehicle (BEV) Market Volume by Country, Forecast 2021-2031 (Thousand Units, AGR %, CAGR %) (W Shaped Recovery)
Table 8.38 US Battery Electric Vehicle (BEV) Market Revenue by Vehicle Type, Forecast 2021-2031 (US$Mn, AGR %, CAGR %) (Pre COVID)
Table 8.39 US Battery Electric Vehicle (BEV) Market Volume by Vehicle Type, Forecast 2021-2031 (Thousand Units, AGR %, CAGR %) (Pre COVID)
Table 8.40 US Battery Electric Vehicle (BEV) Market Revenue by Vehicle Type, Forecast 2021-2031 (US$Mn, AGR %, CAGR %) (V Shaped Recovery)
Table 8.41 US Battery Electric Vehicle (BEV) Market Volume by Vehicle Type, Forecast 2021-2031 (Thousand Units, AGR %, CAGR %) (V Shaped Recovery)
Table 8.42 US Battery Electric Vehicle (BEV) Market Revenue by Vehicle Type, Forecast 2021-2031 (US$Mn, AGR %, CAGR %) (U Shaped Recovery)
Table 8.43 US Battery Electric Vehicle (BEV) Market Volume by Vehicle Type, Forecast 2021-2031 (Thousand Units, AGR %, CAGR %) (U Shaped Recovery)
Table 8.44 US Battery Electric Vehicle (BEV) Market Revenue by Vehicle Type, Forecast 2021-2031 (US$Mn, AGR %, CAGR %) (L Shaped Recovery)
Table 8.45 US Battery Electric Vehicle (BEV) Market Volume by Vehicle Type, Forecast 2021-2031 (Thousand Units, AGR %, CAGR %) (U Shaped Recovery)
Table 8.46 US Battery Electric Vehicle (BEV) Market Revenue by Vehicle Type, Forecast 2021-2031 (US$Mn, AGR %, CAGR %) (W Shaped Recovery)
Table 8.47 US Battery Electric Vehicle (BEV) Market Volume by Vehicle Type, Forecast 2021-2031 (Thousand Units, AGR %, CAGR %) (U Shaped Recovery)
Table 8.48 US Battery Electric Vehicle (BEV) Market Revenue by Battery Type, Forecast 2021-2031 (US$Mn, AGR %, CAGR %) (Pre COVID)
Table 4.49 US Battery Electric Vehicle (BEV) Market Revenue by Battery Type, Forecast 2021-2031 (US$Mn, AGR %, CAGR %) (V Shaped Recovery)
Table 8.50 US Battery Electric Vehicle (BEV) Market Revenue by Battery Type, Forecast 2021-2031 (US$Mn, AGR %, CAGR %) (U Shaped Recovery)
Table 8.51 US Battery Electric Vehicle (BEV) Market Revenue by Battery Type, Forecast 2021-2031 (US$Mn, AGR %, CAGR %) (L Shaped Recovery)
Table 8.52 US Battery Electric Vehicle (BEV) Market Revenue by Battery Type, Forecast 2021-2031 (US$Mn, AGR %, CAGR %) (W Shaped Recovery)
Table 8.53 Canada Battery Electric Vehicle (BEV) Market Revenue by Vehicle Type, Forecast 2021-2031 (US$Mn, AGR %, CAGR %) (Pre COVID)
Table 8.54 Canada Battery Electric Vehicle (BEV) Market Volume by Vehicle Type, Forecast 2021-2031 (Thousand Units, AGR %, CAGR %) (Pre COVID)
Table 8.55 Canada Battery Electric Vehicle (BEV) Market Revenue by Vehicle Type, Forecast 2021-2031 (US$Mn, AGR %, CAGR %) (V Shaped Recovery)
Table 8.56 Canada Battery Electric Vehicle (BEV) Market Volume by Vehicle Type, Forecast 2021-2031 (Thousand Units, AGR %, CAGR %) (V Shaped Recovery)
Table 8.57 Canada Battery Electric Vehicle (BEV) Market Revenue by Vehicle Type, Forecast 2021-2031 (US$Mn, AGR %, CAGR %) (U Shaped Recovery)
Table 8.58 Canada Battery Electric Vehicle (BEV) Market Volume by Vehicle Type, Forecast 2021-2031 (Thousand Units, AGR %, CAGR %) (U Shaped Recovery)
Table 8.59 Canada Battery Electric Vehicle (BEV) Market Revenue by Vehicle Type, Forecast 2021-2031 (US$Mn, AGR %, CAGR %) (L Shaped Recovery)
Table 8.60 Canada Battery Electric Vehicle (BEV) Market Volume by Vehicle Type, Forecast 2021-2031 (Thousand Units, AGR %, CAGR %) (L Shaped Recovery)
Table 8.61 Canada Battery Electric Vehicle (BEV) Market Revenue by Vehicle Type, Forecast 2021-2031 (US$Mn, AGR %, CAGR %) (W Shaped Recovery)
Table 8.62 Canada Battery Electric Vehicle (BEV) Market Volume by Vehicle Type, Forecast 2021-2031 (Thousand Units, AGR %, CAGR %) (W Shaped Recovery)
Table 8.63 Canada Battery Electric Vehicle (BEV) Market Revenue by Battery Type, Forecast 2021-2031 (US$Mn, AGR %, CAGR %) (Pre COVID)
Table 8.64 Canada Battery Electric Vehicle (BEV) Market Revenue by Battery Type, Forecast 2021-2031 (US$Mn, AGR %, CAGR %) (V Shaped Recovery)
Table 8.65 Canada Battery Electric Vehicle (BEV) Market Revenue by Battery Type, Forecast 2021-2031 (US$Mn, AGR %, CAGR %) (U Shaped Recovery)
Table 8.66 Canada Battery Electric Vehicle (BEV) Market Revenue by Battery Type, Forecast 2021-2031 (US$Mn, AGR %, CAGR %) (L Shaped Recovery)
Table 8.67 Canada Battery Electric Vehicle (BEV) Market Revenue by Battery Type, Forecast 2021-2031 (US$Mn, AGR %, CAGR %) (W Shaped Recovery)
Table 8.68 Mexico Battery Electric Vehicle (BEV) Market Revenue by Vehicle Type, Forecast 2021-2031 (US$Mn, AGR %, CAGR %) (Pre COVID)
Table 8.69 Mexico Battery Electric Vehicle (BEV) Market Volume by Vehicle Type, Forecast 2021-2031 (Thousand Units, AGR %, CAGR %) (Pre COVID)
Table 8.70 Mexico Battery Electric Vehicle (BEV) Market Revenue by Vehicle Type, Forecast 2021-2031 (US$Mn, AGR %, CAGR %) (V Shaped Recovery)
Table 8.71 Mexico Battery Electric Vehicle (BEV) Market Volume by Vehicle Type, Forecast 2021-2031 (Thousand Units, AGR %, CAGR %) (V Shaped Recovery)
Table 8.72 Mexico Battery Electric Vehicle (BEV) Market Revenue by Vehicle Type, Forecast 2021-2031 (US$Mn, AGR %, CAGR %) (U Shaped Recovery)
Table 8.73 Mexico Battery Electric Vehicle (BEV) Market Volume by Vehicle Type, Forecast 2021-2031 (Thousand Units, AGR %, CAGR %) (U Shaped Recovery)
Table 8.74 Mexico Battery Electric Vehicle (BEV) Market Revenue by Vehicle Type, Forecast 2021-2031 (US$Mn, AGR %, CAGR %) (L Shaped Recovery)
Table 8.75 Mexico Battery Electric Vehicle (BEV) Market Volume by Vehicle Type, Forecast 2021-2031 (Thousand Units, AGR %, CAGR %) (L Shaped Recovery)
Table 8.76 Mexico Battery Electric Vehicle (BEV) Market Revenue by Vehicle Type, Forecast 2021-2031 (US$Mn, AGR %, CAGR %) (W Shaped Recovery)
Table 8.77 Mexico Battery Electric Vehicle (BEV) Market Volume by Vehicle Type, Forecast 2021-2031 (Thousand Units, AGR %, CAGR %) (W Shaped Recovery)
Table 8.78 Europe Battery Electric Vehicle (BEV) Market Revenue, Forecast 2021-2031 (US$Mn, AGR %, CAGR %) (Pre COVID)
Table 8.79 Europe Battery Electric Vehicle (BEV) Market Volume, Forecast 2021-2031 (Thousand Units, AGR %, CAGR %) (Pre COVID)
Table 8.80 Europe Battery Electric Vehicle (BEV) Market Revenue, Forecast 2021-2031 (US$Mn, AGR %, CAGR %) (V Shaped Recovery)
Table 8.81 Europe Battery Electric Vehicle (BEV) Market Volume, Forecast 2021-2031 (Thousand Units, AGR %, CAGR %) (V Shaped Recovery)
Table 8.82 Europe Battery Electric Vehicle (BEV) Market Revenue, Forecast 2021-2031 (US$Mn, AGR %, CAGR %) (U Shaped Recovery)
Table 8.83 Europe Battery Electric Vehicle (BEV) Market Volume, Forecast 2021-2031 (Thousand Units, AGR %, CAGR %) (U Shaped Recovery)
Table 8.84 Europe Battery Electric Vehicle (BEV) Market Revenue, Forecast 2021-2031 (US$Mn, AGR %, CAGR %) (L Shaped Recovery)
Table 8.85 Europe Battery Electric Vehicle (BEV) Market Volume, Forecast 2021-2031 (Thousand Units, AGR %, CAGR %) (L Shaped Recovery)
Table 8.86 Europe Battery Electric Vehicle (BEV) Market Revenue, Forecast 2021-2031 (US$Mn, AGR %, CAGR %) (W Shaped Recovery)
Table 8.87 Europe Battery Electric Vehicle (BEV) Market Volume, Forecast 2021-2031 (Thousand Units, AGR %, CAGR %) (W Shaped Recovery)
Table 8.88 Europe Battery Electric Vehicle (BEV) Market Revenue by Vehicle Type, Forecast 2021-2031 (US$Mn, AGR %, CAGR %) (Pre COVID)
Table 8.89 Europe Battery Electric Vehicle (BEV) Market Volume by Vehicle Type, Forecast 2021-2031 (Thousand Units, AGR %, CAGR %) (Pre COVID)
Table 8.90 Europe Battery Electric Vehicle (BEV) Market Revenue by Vehicle Type, Forecast 2021-2031 (US$Mn, AGR %, CAGR %) (V Shaped Recovery)
Table 8.91 Europe Battery Electric Vehicle (BEV) Market Volume by Vehicle Type, Forecast 2021-2031 (Thousand Units, AGR %, CAGR %) (V Shaped Recovery)
Table 8.92 Europe Battery Electric Vehicle (BEV) Market Revenue by Vehicle Type, Forecast 2021-2031 (US$Mn, AGR %, CAGR %) (U Shaped Recovery)
Table 8.93 Europe Battery Electric Vehicle (BEV) Market Volume by Vehicle Type, Forecast 2021-2031 (Thousand Units, AGR %, CAGR %) (U Shaped Recovery)
Table 8.94 Europe Battery Electric Vehicle (BEV) Market Revenue by Vehicle Type, Forecast 2021-2031 (US$Mn, AGR %, CAGR %) (L Shaped Recovery)
Table 8.95 Europe Battery Electric Vehicle (BEV) Market Volume by Vehicle Type, Forecast 2021-2031 (Thousand Units, AGR %, CAGR %) (L Shaped Recovery)
Table 8.96 Europe Battery Electric Vehicle (BEV) Market Revenue by Vehicle Type, Forecast 2021-2031 (US$Mn, AGR %, CAGR %) (W Shaped Recovery)
Table 8.97 Europe Battery Electric Vehicle (BEV) Market Volume by Vehicle Type, Forecast 2021-2031 (Thousand Units, AGR %, CAGR %) (W Shaped Recovery)
Table 8.98 Europe Battery Electric Vehicle (BEV) Market Revenue by Battery Type, Forecast 2021-2031 (US$Mn, AGR %, CAGR %) (Pre COVID)
Table 8.99 Europe Battery Electric Vehicle (BEV) Market Revenue by Battery Type, Forecast 2021-2031 (US$Mn, AGR %, CAGR %) (V Shaped Recovery)
Table 8.100 Europe Battery Electric Vehicle (BEV) Market Revenue by Battery Type, Forecast 2021-2031 (US$Mn, AGR %, CAGR %) (U Shaped Recovery)
Table 8.101 Europe Battery Electric Vehicle (BEV) Market Revenue by Battery Type, Forecast 2021-2031 (US$Mn, AGR %, CAGR %) (L Shaped Recovery)
Table 8.102 Europe Battery Electric Vehicle (BEV) Market Revenue by Battery Type, Forecast 2021-2031 (US$Mn, AGR %, CAGR %) (W Shaped Recovery)
Table 8.103 Europe Battery Electric Vehicle (BEV) Market Revenue by Country, Forecast 2021-2031 (US$Mn, AGR %, CAGR %) (Pre COVID)
Table 8.104 Europe Battery Electric Vehicle (BEV) Market Volume by Country, Forecast 2021-2031 (Thousand Units, AGR %, CAGR %) (Pre COVID)
Table 8.105 Germany Battery Electric Vehicle (BEV) Market Revenue by Vehicle Type, Forecast 2021-2031 (US$Mn, AGR %, CAGR %) (Pre COVID)
Table 8.106 Germany Battery Electric Vehicle (BEV) Market Volume by Vehicle Type, Forecast 2021-2031 (Thousand Units, AGR %, CAGR %) (Pre COVID)
Table 8.107 Germany Battery Electric Vehicle (BEV) Market Revenue by Vehicle Type, Forecast 2021-2031 (US$Mn, AGR %, CAGR %) (V Shaped Recovery)
Table 8.108 Germany Battery Electric Vehicle (BEV) Market Volume by Vehicle Type, Forecast 2021-2031 (Thousand Units, AGR %, CAGR %) (V Shaped Recovery)
Table 8.109 Germany Battery Electric Vehicle (BEV) Market Revenue by Vehicle Type, Forecast 2021-2031 (US$Mn, AGR %, CAGR %) (U Shaped Recovery)
Table 8.110 Germany Battery Electric Vehicle (BEV) Market Volume by Vehicle Type, Forecast 2021-2031 (Thousand Units, AGR %, CAGR %) (U Shaped Recovery)
Table 8.111 Germany Battery Electric Vehicle (BEV) Market Revenue by Vehicle Type, Forecast 2021-2031 (US$Mn, AGR %, CAGR %) (L Shaped Recovery)
Table 8.112 Germany Battery Electric Vehicle (BEV) Market Volume by Vehicle Type, Forecast 2021-2031 (Thousand Units, AGR %, CAGR %) (L Shaped Recovery)
Table 8.113 Germany Battery Electric Vehicle (BEV) Market Revenue by Vehicle Type, Forecast 2021-2031 (US$Mn, AGR %, CAGR %) (W Shaped Recovery)
Table 8.114 Germany Battery Electric Vehicle (BEV) Market Volume by Vehicle Type, Forecast 2021-2031 (Thousand Units, AGR %, CAGR %) (W Shaped Recovery)
Table 8.115 Norway Battery Electric Vehicle (BEV) Market Revenue by Vehicle Type, Forecast 2021-2031 (US$Mn, AGR %, CAGR %) (Pre COVID)
Table 8.116 Norway Battery Electric Vehicle (BEV) Market Volume by Vehicle Type, Forecast 2021-2031 (Thousand Units, AGR %, CAGR %) (Pre COVID)
Table 8.117 Norway Battery Electric Vehicle (BEV) Market Revenue by Vehicle Type, Forecast 2021-2031 (US$Mn, AGR %, CAGR %) (V Shaped Recovery)
Table 8.118 Norway Battery Electric Vehicle (BEV) Market Volume by Vehicle Type, Forecast 2021-2031 (Thousand Units, AGR %, CAGR %) (V Shaped Recovery)
Table 8.119 Norway Battery Electric Vehicle (BEV) Market Revenue by Vehicle Type, Forecast 2021-2031 (US$Mn, AGR %, CAGR %) (U Shaped Recovery)
Table 8.120 Norway Battery Electric Vehicle (BEV) Market Volume by Vehicle Type, Forecast 2021-2031 (Thousand Units, AGR %, CAGR %) (U Shaped Recovery)
Table 8.121 Norway Battery Electric Vehicle (BEV) Market Revenue by Vehicle Type, Forecast 2021-2031 (US$Mn, AGR %, CAGR %) (L Shaped Recovery)
Table 8.122 Norway Battery Electric Vehicle (BEV) Market Volume by Vehicle Type, Forecast 2021-2031 (Thousand Units, AGR %, CAGR %) (L Shaped Recovery)
Table 8.123 Norway Battery Electric Vehicle (BEV) Market Revenue by Vehicle Type, Forecast 2021-2031 (US$Mn, AGR %, CAGR %) (W Shaped Recovery)
Table 8.124 Norway Battery Electric Vehicle (BEV) Market Volume by Vehicle Type, Forecast 2021-2031 (Thousand Units, AGR %, CAGR %) (W Shaped Recovery)
Table 8.125 Netherlands Battery Electric Vehicle (BEV) Market Revenue by Vehicle Type, Forecast 2021-2031 (US$Mn, AGR %, CAGR %) (Pre COVID)
Table 8.126 Netherlands Battery Electric Vehicle (BEV) Market Volume by Vehicle Type, Forecast 2021-2031 (Thousand Units, AGR %, CAGR %) (Pre COVID)
Table 8.127 Netherlands Battery Electric Vehicle (BEV) Market Revenue by Vehicle Type, Forecast 2021-2031 (US$Mn, AGR %, CAGR %) (V Shaped Recovery)
Table 8.128 Netherlands Battery Electric Vehicle (BEV) Market Volume by Vehicle Type, Forecast 2021-2031 (Thousand Units, AGR %, CAGR %) (V Shaped Recovery)
Table 8.129 Netherlands Battery Electric Vehicle (BEV) Market Revenue by Vehicle Type, Forecast 2021-2031 (US$Mn, AGR %, CAGR %) (U Shaped Recovery)
Table 8.130 Netherlands Battery Electric Vehicle (BEV) Market Volume by Vehicle Type, Forecast 2021-2031 (Thousand Units, AGR %, CAGR %) (U Shaped Recovery)
Table 8.131 Netherlands Battery Electric Vehicle (BEV) Market Revenue by Vehicle Type, Forecast 2021-2031 (US$Mn, AGR %, CAGR %) (L Shaped Recovery)
Table 8.132 Netherlands Battery Electric Vehicle (BEV) Market Volume by Vehicle Type, Forecast 2021-2031 (Thousand Units, AGR %, CAGR %) (L Shaped Recovery)
Table 8.133 Netherlands Battery Electric Vehicle (BEV) Market Revenue by Vehicle Type, Forecast 2021-2031 (US$Mn, AGR %, CAGR %) (W Shaped Recovery)
Table 8.134 Netherlands Battery Electric Vehicle (BEV) Market Volume by Vehicle Type, Forecast 2021-2031 (Thousand Units, AGR %, CAGR %) (W Shaped Recovery)
Table 8.135 France Battery Electric Vehicle (BEV) Market Revenue by Vehicle Type, Forecast 2021-2031 (US$Mn, AGR %, CAGR %) (Pre COVID)
Table 8.136 France Battery Electric Vehicle (BEV) Market Volume by Vehicle Type, Forecast 2021-2031 (Thousand Units, AGR %, CAGR %) (Pre COVID)
Table 8.137 France Battery Electric Vehicle (BEV) Market Revenue by Vehicle Type, Forecast 2021-2031 (US$Mn, AGR %, CAGR %) (V Shaped Recovery)
Table 8.138 France Battery Electric Vehicle (BEV) Market Volume by Vehicle Type, Forecast 2021-2031 (Thousand Units, AGR %, CAGR %) (V Shaped Recovery)
Table 8.139 France Battery Electric Vehicle (BEV) Market Revenue by Vehicle Type, Forecast 2021-2031 (US$Mn, AGR %, CAGR %) (U Shaped Recovery)
Table 8.140 France Battery Electric Vehicle (BEV) Market Volume by Vehicle Type, Forecast 2021-2031 (Thousand Units, AGR %, CAGR %) (U Shaped Recovery)
Table 8.141 France Battery Electric Vehicle (BEV) Market Revenue by Vehicle Type, Forecast 2021-2031 (US$Mn, AGR %, CAGR %) (L Shaped Recovery)
Table 8.142 France Battery Electric Vehicle (BEV) Market Volume by Vehicle Type, Forecast 2021-2031 (Thousand Units, AGR %, CAGR %) (L Shaped Recovery)
Table 8.143 France Battery Electric Vehicle (BEV) Market Revenue by Vehicle Type, Forecast 2021-2031 (US$Mn, AGR %, CAGR %) (W Shaped Recovery)
Table 8.144 France Battery Electric Vehicle (BEV) Market Volume by Vehicle Type, Forecast 2021-2031 (Thousand Units, AGR %, CAGR %) (W Shaped Recovery)
Table 8.145 UK Battery Electric Vehicle (BEV) Market Revenue by Vehicle Type, Forecast 2021-2031 (US$Mn, AGR %, CAGR %) (Pre COVID)
Table 8.146 UK Battery Electric Vehicle (BEV) Market Volume by Vehicle Type, Forecast 2021-2031 (Thousand Units, AGR %, CAGR %) (Pre COVID)
Table 8.147 UK Battery Electric Vehicle (BEV) Market Revenue by Vehicle Type, Forecast 2021-2031 (US$Mn, AGR %, CAGR %) (V Shaped Recovery)
Table 8.148 UK Battery Electric Vehicle (BEV) Market Volume by Vehicle Type, Forecast 2021-2031 (Thousand Units, AGR %, CAGR %) (V Shaped Recovery)
Table 8.149 UK Battery Electric Vehicle (BEV) Market Revenue by Vehicle Type, Forecast 2021-2031 (US$Mn, AGR %, CAGR %) (U Shaped Recovery)
Table 8.150 UK Battery Electric Vehicle (BEV) Market Volume by Vehicle Type, Forecast 2021-2031 (Thousand Units, AGR %, CAGR %) (U Shaped Recovery)
Table 8.151 UK Battery Electric Vehicle (BEV) Market Revenue by Vehicle Type, Forecast 2021-2031 (US$Mn, AGR %, CAGR %) (L Shaped Recovery)
Table 8.152 UK Battery Electric Vehicle (BEV) Market Volume by Vehicle Type, Forecast 2021-2031 (Thousand Units, AGR %, CAGR %) (L Shaped Recovery)
Table 8.153 UK Battery Electric Vehicle (BEV) Market Revenue by Vehicle Type, Forecast 2021-2031 (US$Mn, AGR %, CAGR %) (W Shaped Recovery)
Table 8.154 UK Battery Electric Vehicle (BEV) Market Volume by Vehicle Type, Forecast 2021-2031 (Thousand Units, AGR %, CAGR %) (W Shaped Recovery)
Table 8.155 Sweden Battery Electric Vehicle (BEV) Market Revenue by Vehicle Type, Forecast 2021-2031 (US$Mn, AGR %, CAGR %) (Pre COVID)
Table 8.156 Sweden Battery Electric Vehicle (BEV) Market Volume by Vehicle Type, Forecast 2021-2031 (Thousand Units, AGR %, CAGR %) (Pre COVID)
Table 8.157 Sweden Battery Electric Vehicle (BEV) Market Revenue by Vehicle Type, Forecast 2021-2031 (US$Mn, AGR %, CAGR %) (V Shaped Recovery)
Table 8.158 Sweden Battery Electric Vehicle (BEV) Market Volume by Vehicle Type, Forecast 2021-2031 (Thousand Units, AGR %, CAGR %) (V Shaped Recovery)
Table 8.159 Sweden Battery Electric Vehicle (BEV) Market Revenue by Vehicle Type, Forecast 2021-2031 (US$Mn, AGR %, CAGR %) (U Shaped Recovery)
Table 8.160 Sweden Battery Electric Vehicle (BEV) Market Volume by Vehicle Type, Forecast 2021-2031 (Thousand Units, AGR %, CAGR %) (U Shaped Recovery)
Table 8.161 Sweden Battery Electric Vehicle (BEV) Market Revenue by Vehicle Type, Forecast 2021-2031 (US$Mn, AGR %, CAGR %) (L Shaped Recovery)
Table 8.162 Sweden Battery Electric Vehicle (BEV) Market Volume by Vehicle Type, Forecast 2021-2031 (Thousand Units, AGR %, CAGR %) (L Shaped Recovery)
Table 8.163 Sweden Battery Electric Vehicle (BEV) Market Revenue by Vehicle Type, Forecast 2021-2031 (US$Mn, AGR %, CAGR %) (W Shaped Recovery)
Table 8.164 Sweden Battery Electric Vehicle (BEV) Market Volume by Vehicle Type, Forecast 2021-2031 (Thousand Units, AGR %, CAGR %) (W Shaped Recovery)
Table 8.165 Switzerland Battery Electric Vehicle (BEV) Market Revenue by Vehicle Type, Forecast 2021-2031 (US$Mn, AGR %, CAGR %) (Pre COVID)
Table 8.166 Switzerland Battery Electric Vehicle (BEV) Market Volume by Vehicle Type, Forecast 2021-2031 (Thousand Units, AGR %, CAGR %) (Pre COVID)
Table 8.167 Switzerland Battery Electric Vehicle (BEV) Market Revenue by Vehicle Type, Forecast 2021-2031 (US$Mn, AGR %, CAGR %) (V Shaped Recovery)
Table 8.168 Switzerland Battery Electric Vehicle (BEV) Market Volume by Vehicle Type, Forecast 2021-2031 (Thousand Units, AGR %, CAGR %) (V Shaped Recovery)
Table 8.169 Switzerland Battery Electric Vehicle (BEV) Market Revenue by Vehicle Type, Forecast 2021-2031 (US$Mn, AGR %, CAGR %) (U Shaped Recovery)
Table 8.170 Switzerland Battery Electric Vehicle (BEV) Market Volume by Vehicle Type, Forecast 2021-2031 (Thousand Units, AGR %, CAGR %) (V Shaped Recovery)
Table 8.171 Switzerland Battery Electric Vehicle (BEV) Market Revenue by Vehicle Type, Forecast 2021-2031 (US$Mn, AGR %, CAGR %) (L Shaped Recovery)
Table 8.172 Switzerland Battery Electric Vehicle (BEV) Market Volume by Vehicle Type, Forecast 2021-2031 (Thousand Units, AGR %, CAGR %) (L Shaped Recovery)
Table 8.173 Switzerland Battery Electric Vehicle (BEV) Market Revenue by Vehicle Type, Forecast 2021-2031 (US$Mn, AGR %, CAGR %) (W Shaped Recovery)
Table 8.174 Switzerland Battery Electric Vehicle (BEV) Market Volume by Vehicle Type, Forecast 2021-2031 (Thousand Units, AGR %, CAGR %) (W Shaped Recovery)
Table 8.175 Italy Battery Electric Vehicle (BEV) Market Revenue by Vehicle Type, Forecast 2021-2031 (US$Mn, AGR %, CAGR %) (Pre COVID)
Table 8.176 Italy Battery Electric Vehicle (BEV) Market Volume by Vehicle Type, Forecast 2021-2031 (Thousand Units, AGR %, CAGR %) (Pre COVID)
Table 8.177 Italy Battery Electric Vehicle (BEV) Market Revenue by Vehicle Type, Forecast 2021-2031 (US$Mn, AGR %, CAGR %) (V Shaped Recovery)
Table 8.178 Italy Battery Electric Vehicle (BEV) Market Volume by Vehicle Type, Forecast 2021-2031 (Thousand Units, AGR %, CAGR %) (V Shaped Recovery
Table 8.179 Italy Battery Electric Vehicle (BEV) Market Revenue by Vehicle Type, Forecast 2021-2031 (US$Mn, AGR %, CAGR %) (U Shaped Recovery)
Table 8.180 Italy Battery Electric Vehicle (BEV) Market Volume by Vehicle Type, Forecast 2021-2031 (Thousand Units, AGR %, CAGR %) (U Shaped Recovery
Table 8.181 Italy Battery Electric Vehicle (BEV) Market Revenue by Vehicle Type, Forecast 2021-2031 (US$Mn, AGR %, CAGR %) (L Shaped Recovery)
Table 8.182 Italy Battery Electric Vehicle (BEV) Market Volume by Vehicle Type, Forecast 2021-2031 (Thousand Units, AGR %, CAGR %) (L Shaped Recovery
Table 8.183 Italy Battery Electric Vehicle (BEV) Market Revenue by Vehicle Type, Forecast 2021-2031 (US$Mn, AGR %, CAGR %) (W Shaped Recovery)
Table 8.184 Italy Battery Electric Vehicle (BEV) Market Volume by Vehicle Type, Forecast 2021-2031 (Thousand Units, AGR %, CAGR %) (W Shaped Recovery
Table 8.185 Spain Battery Electric Vehicle (BEV) Market Revenue by Vehicle Type, Forecast 2021-2031 (US$Mn, AGR %, CAGR %) (Pre COVID)
Table 8.186 Spain Battery Electric Vehicle (BEV) Market Volume by Vehicle Type, Forecast 2021-2031 (Thousand Units, AGR %, CAGR %) (Pre COVID)
Table 8.187 Spain Battery Electric Vehicle (BEV) Market Revenue by Vehicle Type, Forecast 2021-2031 (US$Mn, AGR %, CAGR %) (V Shaped Recovery)
Table 8.188 Spain Battery Electric Vehicle (BEV) Market Volume by Vehicle Type, Forecast 2021-2031 (Thousand Units, AGR %, CAGR %) (V Shaped Recovery)
Table 8.189 Spain Battery Electric Vehicle (BEV) Market Revenue by Vehicle Type, Forecast 2021-2031 (US$Mn, AGR %, CAGR %) (U Shaped Recovery)
Table 8.190 Spain Battery Electric Vehicle (BEV) Market Volume by Vehicle Type, Forecast 2021-2031 (Thousand Units, AGR %, CAGR %) (U Shaped Recovery)
Table 8.191 Spain Battery Electric Vehicle (BEV) Market Revenue by Vehicle Type, Forecast 2021-2031 (US$Mn, AGR %, CAGR %) (L Shaped Recovery)
Table 8.192 Spain Battery Electric Vehicle (BEV) Market Volume by Vehicle Type, Forecast 2021-2031 (Thousand Units, AGR %, CAGR %) (L Shaped Recovery)
Table 8.193 Spain Battery Electric Vehicle (BEV) Market Revenue by Vehicle Type, Forecast 2021-2031 (US$Mn, AGR %, CAGR %) (W Shaped Recovery)
Table 8.194 Spain Battery Electric Vehicle (BEV) Market Volume by Vehicle Type, Forecast 2021-2031 (Thousand Units, AGR %, CAGR %) (W Shaped Recovery)
Table 8.195 Austria Battery Electric Vehicle (BEV) Market Revenue by Vehicle Type, Forecast 2021-2031 (US$Mn, AGR %, CAGR %) (Pre COVID)
Table 8.196 Austria Battery Electric Vehicle (BEV) Market Volume by Vehicle Type, Forecast 2021-2031 (Thousand Units, AGR %, CAGR %) (Pre COVID)
Table 8.197 Austria Battery Electric Vehicle (BEV) Market Revenue by Vehicle Type, Forecast 2021-2031 (US$Mn, AGR %, CAGR %) (V Shaped Recovery)
Table 8.198 Austria Battery Electric Vehicle (BEV) Market Volume by Vehicle Type, Forecast 2021-2031 (Thousand Units, AGR %, CAGR %) (V Shaped Recovery)
Table 8.199 Austria Battery Electric Vehicle (BEV) Market Revenue by Vehicle Type, Forecast 2021-2031 (US$Mn, AGR %, CAGR %) (U Shaped Recovery)
Table 8.200 Austria Battery Electric Vehicle (BEV) Market Volume by Vehicle Type, Forecast 2021-2031 (Thousand Units, AGR %, CAGR %) (U Shaped Recovery)
Table 8.201 Austria Battery Electric Vehicle (BEV) Market Revenue by Vehicle Type, Forecast 2021-2031 (US$Mn, AGR %, CAGR %) (L Shaped Recovery)
Table 8.202 Austria Battery Electric Vehicle (BEV) Market Volume by Vehicle Type, Forecast 2021-2031 (Thousand Units, AGR %, CAGR %) (L Shaped Recovery)
Table 8.203 Austria Battery Electric Vehicle (BEV) Market Revenue by Vehicle Type, Forecast 2021-2031 (US$Mn, AGR %, CAGR %) (W Shaped Recovery)
Table 8.204 Austria Battery Electric Vehicle (BEV) Market Volume by Vehicle Type, Forecast 2021-2031 (Thousand Units, AGR %, CAGR %) (W Shaped Recovery)
Table 8.205 Belgium Battery Electric Vehicle (BEV) Market Revenue, Forecast 2021-2031 (US$Mn, AGR %, CAGR %) (Pre COVID)
Table 8.206 Belgium Battery Electric Vehicle (BEV) Market Volume, Forecast 2021-2031 (Thousand Units, AGR %, CAGR %) (Pre COVID)
Table 8.207 Belgium Battery Electric Vehicle (BEV) Market Revenue, Forecast 2021-2031 (US$Mn, AGR %, CAGR %) (V Shaped Recovery)
Table 8.208 Belgium Battery Electric Vehicle (BEV) Market Volume, Forecast 2021-2031 (Thousand Units, AGR %, CAGR %) (V Shaped Recovery)
Table 8.209 Belgium Battery Electric Vehicle (BEV) Market Revenue, Forecast 2021-2031 (US$Mn, AGR %, CAGR %) (U Shaped Recovery)
Table 8.210 Belgium Battery Electric Vehicle (BEV) Market Volume, Forecast 2021-2031 (Thousand Units, AGR %, CAGR %) (U Shaped Recovery)
Table 8.211 Belgium Battery Electric Vehicle (BEV) Market Revenue, Forecast 2021-2031 (US$Mn, AGR %, CAGR %) (L Shaped Recovery)
Table 8.212 Belgium Battery Electric Vehicle (BEV) Market Volume, Forecast 2021-2031 (Thousand Units, AGR %, CAGR %) (L Shaped Recovery)
Table 8.213 Belgium Battery Electric Vehicle (BEV) Market Revenue, Forecast 2021-2031 (US$Mn, AGR %, CAGR %) (W Shaped Recovery)
Table 8.214 Belgium Battery Electric Vehicle (BEV) Market Volume, Forecast 2021-2031 (Thousand Units, AGR %, CAGR %) (W Shaped Recovery)
Table 8.215 Portugal Battery Electric Vehicle (BEV) Market Revenue, Forecast 2021-2031 (US$Mn, AGR %, CAGR %) (Pre COVID)
Table 8.216 Portugal Battery Electric Vehicle (BEV) Market Volume, Forecast 2021-2031 (Thousand Units, AGR %, CAGR %) (Pre COVID)
Table 8.217 Portugal Battery Electric Vehicle (BEV) Market Revenue, Forecast 2021-2031 (US$Mn, AGR %, CAGR %) (V Shaped Recovery)
Table 8.218 Portugal Battery Electric Vehicle (BEV) Market Volume, Forecast 2021-2031 (Thousand Units, AGR %, CAGR %) (V Shaped Recovery)
Table 8.219 Portugal Battery Electric Vehicle (BEV) Market Revenue, Forecast 2021-2031 (US$Mn, AGR %, CAGR %) (U Shaped Recovery)
Table 8.220 Portugal Battery Electric Vehicle (BEV) Market Volume, Forecast 2021-2031 (Thousand Units, AGR %, CAGR %) (U Shaped Recovery)
Table 8.221 Portugal Battery Electric Vehicle (BEV) Market Revenue, Forecast 2021-2031 (US$Mn, AGR %, CAGR %) (L Shaped Recovery)
Table 8.222 Portugal Battery Electric Vehicle (BEV) Market Volume, Forecast 2021-2031 (Thousand Units, AGR %, CAGR %) (L Shaped Recovery)
Table 8.223 Portugal Battery Electric Vehicle (BEV) Market Revenue, Forecast 2021-2031 (US$Mn, AGR %, CAGR %) (W Shaped Recovery)
Table 8.224 Portugal Battery Electric Vehicle (BEV) Market Volume, Forecast 2021-2031 (Thousand Units, AGR %, CAGR %) (W Shaped Recovery)
Table 8.225 Finland Battery Electric Vehicle (BEV) Market Revenue, Forecast 2021-2031 (US$Mn, AGR %, CAGR %) (Pre COVID)
Table 8.226 Finland Battery Electric Vehicle (BEV) Market Volume, Forecast 2021-2031 (Thousand Units, AGR %, CAGR %) (Pre COVID)
Table 8.227 Finland Battery Electric Vehicle (BEV) Market Revenue, Forecast 2021-2031 (US$Mn, AGR %, CAGR %) (V Shaped Recovery)
Table 8.228 Finland Battery Electric Vehicle (BEV) Market Volume, Forecast 2021-2031 (Thousand Units, AGR %, CAGR %) (V Shaped Recovery)
Table 8.229 Finland Battery Electric Vehicle (BEV) Market Revenue, Forecast 2021-2031 (US$Mn, AGR %, CAGR %) (U Shaped Recovery)
Table 8.230 Finland Battery Electric Vehicle (BEV) Market Volume, Forecast 2021-2031 (Thousand Units, AGR %, CAGR %) (U Shaped Recovery)
Table 8.231 Finland Battery Electric Vehicle (BEV) Market Revenue, Forecast 2021-2031 (US$Mn, AGR %, CAGR %) (L Shaped Recovery)
Table 8.232 Finland Battery Electric Vehicle (BEV) Market Volume, Forecast 2021-2031 (Thousand Units, AGR %, CAGR %) (L Shaped Recovery)
Table 8.233 Finland Battery Electric Vehicle (BEV) Market Revenue, Forecast 2021-2031 (US$Mn, AGR %, CAGR %) (W Shaped Recovery)
Table 8.234 Finland Battery Electric Vehicle (BEV) Market Volume, Forecast 2021-2031 (Thousand Units, AGR %, CAGR %) (W Shaped Recovery)
Table 8.235 Denmark Battery Electric Vehicle (BEV) Market Revenue, Forecast 2021-2031 (US$Mn, AGR %, CAGR %) (Pre COVID)
Table 8.236 Denmark Battery Electric Vehicle (BEV) Market Volume, Forecast 2021-2031 (Thousand Units, AGR %, CAGR %) (Pre COVID)
Table 8.237 Denmark Battery Electric Vehicle (BEV) Market Revenue, Forecast 2021-2031 (US$Mn, AGR %, CAGR %) (V Shaped Recovery)
Table 8.238 Denmark Battery Electric Vehicle (BEV) Market Volume, Forecast 2021-2031 (Thousand Units, AGR %, CAGR %) (V Shaped Recovery)
Table 8.239 Denmark Battery Electric Vehicle (BEV) Market Revenue, Forecast 2021-2031 (US$Mn, AGR %, CAGR %) (U Shaped Recovery)
Table 8.240 Denmark Battery Electric Vehicle (BEV) Market Volume, Forecast 2021-2031 (Thousand Units, AGR %, CAGR %) (U Shaped Recovery)
Table 8.241 Denmark Battery Electric Vehicle (BEV) Market Revenue, Forecast 2021-2031 (US$Mn, AGR %, CAGR %) (L Shaped Recovery)
Table 8.242 Denmark Battery Electric Vehicle (BEV) Market Volume, Forecast 2021-2031 (Thousand Units, AGR %, CAGR %) (L Shaped Recovery)
Table 8.243 Denmark Battery Electric Vehicle (BEV) Market Revenue, Forecast 2021-2031 (US$Mn, AGR %, CAGR %) (W Shaped Recovery)
Table 8.244 Denmark Battery Electric Vehicle (BEV) Market Volume, Forecast 2021-2031 (Thousand Units, AGR %, CAGR %) (W Shaped Recovery)
Table 8.245 Ireland Battery Electric Vehicle (BEV) Market Revenue, Forecast 2021-2031 (US$Mn, AGR %, CAGR %) (Pre COVID)
Table 8.246 Ireland Battery Electric Vehicle (BEV) Market Volume, Forecast 2021-2031 (Thousand Units, AGR %, CAGR %) (Pre COVID)
Table 8.247 Ireland Battery Electric Vehicle (BEV) Market Revenue, Forecast 2021-2031 (US$Mn, AGR %, CAGR %) (V Shaped Recovery)
Table 8.248 Ireland Battery Electric Vehicle (BEV) Market Volume, Forecast 2021-2031 (Thousand Units, AGR %, CAGR %) (V Shaped Recovery)
Table 8.249 Ireland Battery Electric Vehicle (BEV) Market Revenue, Forecast 2021-2031 (US$Mn, AGR %, CAGR %) (U Shaped Recovery)
Table 8.250 Ireland Battery Electric Vehicle (BEV) Market Volume, Forecast 2021-2031 (Thousand Units, AGR %, CAGR %) (U Shaped Recovery)
Table 8.251 Ireland Battery Electric Vehicle (BEV) Market Revenue, Forecast 2021-2031 (US$Mn, AGR %, CAGR %) (L Shaped Recovery)
Table 8.252 Ireland Battery Electric Vehicle (BEV) Market Volume, Forecast 2021-2031 (Thousand Units, AGR %, CAGR %) (L Shaped Recovery)
Table 8.253 Ireland Battery Electric Vehicle (BEV) Market Revenue, Forecast 2021-2031 (US$Mn, AGR %, CAGR %) (W Shaped Recovery)
Table 8.254 Ireland Battery Electric Vehicle (BEV) Market Volume, Forecast 2021-2031 (Thousand Units, AGR %, CAGR %) (W Shaped Recovery)
Table 8.255 Hungary Battery Electric Vehicle (BEV) Market Revenue, Forecast 2021-2031 (US$Mn, AGR %, CAGR %) (Pre COVID)
Table 8.256 Hungary Battery Electric Vehicle (BEV) Market Volume, Forecast 2021-2031 (Thousand Units, AGR %, CAGR %) (Pre COVID)
Table 8.257 Hungary Battery Electric Vehicle (BEV) Market Revenue, Forecast 2021-2031 (US$Mn, AGR %, CAGR %) (V Shaped Recovery)
Table 8.258 Hungary Battery Electric Vehicle (BEV) Market Volume, Forecast 2021-2031 (Thousand Units, AGR %, CAGR %) (V Shaped Recovery)
Table 8.259 Hungary Battery Electric Vehicle (BEV) Market Revenue, Forecast 2021-2031 (US$Mn, AGR %, CAGR %) (U Shaped Recovery)
Table 8.260 Hungary Battery Electric Vehicle (BEV) Market Volume, Forecast 2021-2031 (Thousand Units, AGR %, CAGR %) (U Shaped Recovery)
Table 8.261 Hungary Battery Electric Vehicle (BEV) Market Revenue, Forecast 2021-2031 (US$Mn, AGR %, CAGR %) (L Shaped Recovery)
Table 8.262 Hungary Battery Electric Vehicle (BEV) Market Volume, Forecast 2021-2031 (Thousand Units, AGR %, CAGR %) (L Shaped Recovery)
Table 8.263 Hungary Battery Electric Vehicle (BEV) Market Revenue, Forecast 2021-2031 (US$Mn, AGR %, CAGR %) (W Shaped Recovery)
Table 8.264 Hungary Battery Electric Vehicle (BEV) Market Volume, Forecast 2021-2031 (Thousand Units, AGR %, CAGR %) (W Shaped Recovery)
Table 8.265 Poland Battery Electric Vehicle (BEV) Market Revenue, Forecast 2021-2031 (US$Mn, AGR %, CAGR %) (Pre COVID)
Table 8.266 Poland Battery Electric Vehicle (BEV) Market Volume, Forecast 2021-2031 (Thousand Units, AGR %, CAGR %) (Pre COVID)
Table 8.267 Poland Battery Electric Vehicle (BEV) Market Revenue, Forecast 2021-2031 (US$Mn, AGR %, CAGR %) (V Shaped Recovery)
Table 8.268 Poland Battery Electric Vehicle (BEV) Market Volume, Forecast 2021-2031 (Thousand Units, AGR %, CAGR %) (V Shaped Recovery)
Table 8.269 Poland Battery Electric Vehicle (BEV) Market Revenue, Forecast 2021-2031 (US$Mn, AGR %, CAGR %) (U Shaped Recovery)
Table 8.270 Poland Battery Electric Vehicle (BEV) Market Volume, Forecast 2021-2031 (Thousand Units, AGR %, CAGR %) (U Shaped Recovery)
Table 8.271 Poland Battery Electric Vehicle (BEV) Market Revenue, Forecast 2021-2031 (US$Mn, AGR %, CAGR %) (L Shaped Recovery)
Table 8.272 Poland Battery Electric Vehicle (BEV) Market Volume, Forecast 2021-2031 (Thousand Units, AGR %, CAGR %) (L Shaped Recovery)
Table 8.273 Poland Battery Electric Vehicle (BEV) Market Revenue, Forecast 2021-2031 (US$Mn, AGR %, CAGR %) (W Shaped Recovery)
Table 8.274 Poland Battery Electric Vehicle (BEV) Market Volume, Forecast 2021-2031 (Thousand Units, AGR %, CAGR %) (W Shaped Recovery)
Table 8.275 Romania Battery Electric Vehicle (BEV) Market Revenue, Forecast 2021-2031 (US$Mn, AGR %, CAGR %) (Pre COVID)
Table 8.276 Romania Battery Electric Vehicle (BEV) Market Volume, Forecast 2021-2031 (Thousand Units, AGR %, CAGR %) (Pre COVID)
Table 8.277 Romania Battery Electric Vehicle (BEV) Market Revenue, Forecast 2021-2031 (US$Mn, AGR %, CAGR %) (V Shaped Recovery)
Table 8.278 Romania Battery Electric Vehicle (BEV) Market Volume, Forecast 2021-2031 (Thousand Units, AGR %, CAGR %) (V Shaped Recovery)
Table 8.279 Romania Battery Electric Vehicle (BEV) Market Revenue, Forecast 2021-2031 (US$Mn, AGR %, CAGR %) (U Shaped Recovery)
Table 8.280 Romania Battery Electric Vehicle (BEV) Market Volume, Forecast 2021-2031 (Thousand Units, AGR %, CAGR %) (U Shaped Recovery)
Table 8.281 Romania Battery Electric Vehicle (BEV) Market Revenue, Forecast 2021-2031 (US$Mn, AGR %, CAGR %) (L Shaped Recovery)
Table 8.282 Romania Battery Electric Vehicle (BEV) Market Volume, Forecast 2021-2031 (Thousand Units, AGR %, CAGR %) (L Shaped Recovery)
Table 8.283 Romania Battery Electric Vehicle (BEV) Market Revenue, Forecast 2021-2031 (US$Mn, AGR %, CAGR %) (W Shaped Recovery)
Table 8.284 Romania Battery Electric Vehicle (BEV) Market Volume, Forecast 2021-2031 (Thousand Units, AGR %, CAGR %) (W Shaped Recovery)
Table 8.285 Luxembourg Battery Electric Vehicle (BEV) Market Revenue, Forecast 2021-2031 (US$Mn, AGR %, CAGR %) (Pre COVID)
Table 8.286 Luxembourg Battery Electric Vehicle (BEV) Market Volume, Forecast 2021-2031 (Thousand Units, AGR %, CAGR %) (Pre COVID)
Table 8.287 Luxembourg Battery Electric Vehicle (BEV) Market Revenue, Forecast 2021-2031 (US$Mn, AGR %, CAGR %) (V Shaped Recovery)
Table 8.288 Luxembourg Battery Electric Vehicle (BEV) Market Volume, Forecast 2021-2031 (Thousand Units, AGR %, CAGR %) (V Shaped Recovery)
Table 8.289 Luxembourg Battery Electric Vehicle (BEV) Market Revenue, Forecast 2021-2031 (US$Mn, AGR %, CAGR %) (U Shaped Recovery)
Table 8.290 Luxembourg Battery Electric Vehicle (BEV) Market Volume, Forecast 2021-2031 (Thousand Units, AGR %, CAGR %) (U Shaped Recovery)
Table 8.291 Luxembourg Battery Electric Vehicle (BEV) Market Revenue, Forecast 2021-2031 (US$Mn, AGR %, CAGR %) (L Shaped Recovery)
Table 8.292 Luxembourg Battery Electric Vehicle (BEV) Market Volume, Forecast 2021-2031 (Thousand Units, AGR %, CAGR %) (L Shaped Recovery)
Table 8.293 Luxembourg Battery Electric Vehicle (BEV) Market Revenue, Forecast 2021-2031 (US$Mn, AGR %, CAGR %) (W Shaped Recovery)
Table 8.294 Luxembourg Battery Electric Vehicle (BEV) Market Volume, Forecast 2021-2031 (Thousand Units, AGR %, CAGR %) (W Shaped Recovery)
Table 8.295 Iceland Battery Electric Vehicle (BEV) Market Revenue, Forecast 2021-2031 (US$Mn, AGR %, CAGR %) (Pre COVID)
Table 8.296 Iceland Battery Electric Vehicle (BEV) Market Volume, Forecast 2021-2031 (Thousand Units, AGR %, CAGR %) (Pre COVID)
Table 8.297 Iceland Battery Electric Vehicle (BEV) Market Revenue, Forecast 2021-2031 (US$Mn, AGR %, CAGR %) (V Shaped Recovery)
Table 8.298 Iceland Battery Electric Vehicle (BEV) Market Volume, Forecast 2021-2031 (Thousand Units, AGR %, CAGR %) (V Shaped Recovery)
Table 8.299 Iceland Battery Electric Vehicle (BEV) Market Revenue, Forecast 2021-2031 (US$Mn, AGR %, CAGR %) (U Shaped Recovery)
Table 8.300 Iceland Battery Electric Vehicle (BEV) Market Volume, Forecast 2021-2031 (Thousand Units, AGR %, CAGR %) (U Shaped Recovery)
Table 8.301 Iceland Battery Electric Vehicle (BEV) Market Revenue, Forecast 2021-2031 (US$Mn, AGR %, CAGR %) (L Shaped Recovery)
Table 8.302 Iceland Battery Electric Vehicle (BEV) Market Volume, Forecast 2021-2031 (Thousand Units, AGR %, CAGR %) (L Shaped Recovery)
Table 8.303 Iceland Battery Electric Vehicle (BEV) Market Revenue, Forecast 2021-2031 (US$Mn, AGR %, CAGR %) (W Shaped Recovery)
Table 8.304 Iceland Battery Electric Vehicle (BEV) Market Volume, Forecast 2021-2031 (Thousand Units, AGR %, CAGR %) (W Shaped Recovery)
Table 8.305 Czech Republic Battery Electric Vehicle (BEV) Market Revenue, Forecast 2021-2031 (US$Mn, AGR %, CAGR %) (Pre COVID)
Table 8.306 Czech Republic Battery Electric Vehicle (BEV) Market Volume, Forecast 2021-2031 (Thousand Units, AGR %, CAGR %) (Pre COVID)
Table 8.307 Czech Republic Battery Electric Vehicle (BEV) Market Revenue, Forecast 2021-2031 (US$Mn, AGR %, CAGR %) (V Shaped Recovery)
Table 8.308 Czech Republic Battery Electric Vehicle (BEV) Market Volume, Forecast 2021-2031 (Thousand Units, AGR %, CAGR %) (V Shaped Recovery)
Table 8.309 Czech Republic Battery Electric Vehicle (BEV) Market Revenue, Forecast 2021-2031 (US$Mn, AGR %, CAGR %) (U Shaped Recovery)
Table 8.310 Czech Republic Battery Electric Vehicle (BEV) Market Volume, Forecast 2021-2031 (Thousand Units, AGR %, CAGR %) (U Shaped Recovery)
Table 8.311 Czech Republic Battery Electric Vehicle (BEV) Market Revenue, Forecast 2021-2031 (US$Mn, AGR %, CAGR %) (L Shaped Recovery)
Table 8.312 Czech Republic Battery Electric Vehicle (BEV) Market Volume, Forecast 2021-2031 (Thousand Units, AGR %, CAGR %) (L Shaped Recovery)
Table 8.313 Czech Republic Battery Electric Vehicle (BEV) Market Revenue, Forecast 2021-2031 (US$Mn, AGR %, CAGR %) (W Shaped Recovery)
Table 8.314 Czech Republic Battery Electric Vehicle (BEV) Market Volume, Forecast 2021-2031 (Thousand Units, AGR %, CAGR %) (W Shaped Recovery)
Table 8.315 Slovenia Battery Electric Vehicle (BEV) Market Revenue, Forecast 2021-2031 (US$Mn, AGR %, CAGR %) (Pre COVID)
Table 8.316 Slovenia Battery Electric Vehicle (BEV) Market Volume, Forecast 2021-2031 (Thousand Units, AGR %, CAGR %) (Pre COVID)
Table 8.317 Slovenia Battery Electric Vehicle (BEV) Market Revenue, Forecast 2021-2031 (US$Mn, AGR %, CAGR %) (V Shaped Recovery)
Table 8.318 Slovenia Battery Electric Vehicle (BEV) Market Volume, Forecast 2021-2031 (Thousand Units, AGR %, CAGR %) (V Shaped Recovery)
Table 8.319 Slovenia Battery Electric Vehicle (BEV) Market Revenue, Forecast 2021-2031 (US$Mn, AGR %, CAGR %) (U Shaped Recovery)
Table 8.320 Slovenia Battery Electric Vehicle (BEV) Market Volume, Forecast 2021-2031 (Thousand Units, AGR %, CAGR %) (U Shaped Recovery)
Table 8.321 Slovenia Battery Electric Vehicle (BEV) Market Revenue, Forecast 2021-2031 (US$Mn, AGR %, CAGR %) (L Shaped Recovery)
Table 8.322 Slovenia Battery Electric Vehicle (BEV) Market Volume, Forecast 2021-2031 (Thousand Units, AGR %, CAGR %) (L Shaped Recovery)
Table 8.323 Slovenia Battery Electric Vehicle (BEV) Market Revenue, Forecast 2021-2031 (US$Mn, AGR %, CAGR %) (W Shaped Recovery)
Table 8.324 Slovenia Battery Electric Vehicle (BEV) Market Volume, Forecast 2021-2031 (Thousand Units, AGR %, CAGR %) (W Shaped Recovery)
Table 8.325 Bulgaria Battery Electric Vehicle (BEV) Market Revenue, Forecast 2021-2031 (US$Mn, AGR %, CAGR %) (Pre COVID)
Table 8.326 Bulgaria Battery Electric Vehicle (BEV) Market Volume, Forecast 2021-2031 (Thousand Units, AGR %, CAGR %) (Pre COVID)
Table 8.327 Bulgaria Battery Electric Vehicle (BEV) Market Revenue, Forecast 2021-2031 (US$Mn, AGR %, CAGR %) (V Shaped Recovery)
Table 8.328 Bulgaria Battery Electric Vehicle (BEV) Market Volume, Forecast 2021-2031 (Thousand Units, AGR %, CAGR %) (V Shaped Recovery)
Table 8.329 Bulgaria Battery Electric Vehicle (BEV) Market Revenue, Forecast 2021-2031 (US$Mn, AGR %, CAGR %) (U Shaped Recovery)
Table 8.330 Bulgaria Battery Electric Vehicle (BEV) Market Volume, Forecast 2021-2031 (Thousand Units, AGR %, CAGR %) (U Shaped Recovery)
Table 8.331 Bulgaria Battery Electric Vehicle (BEV) Market Revenue, Forecast 2021-2031 (US$Mn, AGR %, CAGR %) (L Shaped Recovery)
Table 8.332 Bulgaria Battery Electric Vehicle (BEV) Market Volume, Forecast 2021-2031 (Thousand Units, AGR %, CAGR %) (L Shaped Recovery)
Table 8.333 Bulgaria Battery Electric Vehicle (BEV) Market Revenue, Forecast 2021-2031 (US$Mn, AGR %, CAGR %) (W Shaped Recovery)
Table 8.334 Bulgaria Battery Electric Vehicle (BEV) Market Volume, Forecast 2021-2031 (Thousand Units, AGR %, CAGR %) (W Shaped Recovery)
Table 8.335 Malta Battery Electric Vehicle (BEV) Market Revenue, Forecast 2021-2031 (US$Mn, AGR %, CAGR %) (Pre COVID)
Table 8.336 Malta Battery Electric Vehicle (BEV) Market Volume, Forecast 2021-2031 (Thousand Units, AGR %, CAGR %) (Pre COVID)
Table 8.337 Malta Battery Electric Vehicle (BEV) Market Revenue, Forecast 2021-2031 (US$Mn, AGR %, CAGR %) (V Shaped Recovery)
Table 8.338 Malta Battery Electric Vehicle (BEV) Market Volume, Forecast 2021-2031 (Thousand Units, AGR %, CAGR %) (V Shaped Recovery)
Table 8.339 Malta Battery Electric Vehicle (BEV) Market Revenue, Forecast 2021-2031 (US$Mn, AGR %, CAGR %) (U Shaped Recovery)
Table 8.340 Malta Battery Electric Vehicle (BEV) Market Volume, Forecast 2021-2031 (Thousand Units, AGR %, CAGR %) (U Shaped Recovery)
Table 8.341 Malta Battery Electric Vehicle (BEV) Market Revenue, Forecast 2021-2031 (US$Mn, AGR %, CAGR %) (L Shaped Recovery)
Table 8.342 Malta Battery Electric Vehicle (BEV) Market Volume, Forecast 2021-2031 (Thousand Units, AGR %, CAGR %) (L Shaped Recovery)
Table 8.343 Malta Battery Electric Vehicle (BEV) Market Revenue, Forecast 2021-2031 (US$Mn, AGR %, CAGR %) (W Shaped Recovery)
Table 8.344 Malta Battery Electric Vehicle (BEV) Market Volume, Forecast 2021-2031 (Thousand Units, AGR %, CAGR %) (W Shaped Recovery)
Table 8.345 Greece Battery Electric Vehicle (BEV) Market Revenue, Forecast 2021-2031 (US$Mn, AGR %, CAGR %) (Pre COVID)
Table 8.346 Greece Battery Electric Vehicle (BEV) Market Volume, Forecast 2021-2031 (Thousand Units, AGR %, CAGR %) (Pre COVID)
Table 8.347 Greece Battery Electric Vehicle (BEV) Market Revenue, Forecast 2021-2031 (US$Mn, AGR %, CAGR %) (V Shaped Recovery)
Table 8.348 Greece Battery Electric Vehicle (BEV) Market Volume, Forecast 2021-2031 (Thousand Units, AGR %, CAGR %) (V Shaped Recovery)
Table 8.349 Greece Battery Electric Vehicle (BEV) Market Revenue, Forecast 2021-2031 (US$Mn, AGR %, CAGR %) (U Shaped Recovery)
Table 8.350 Greece Battery Electric Vehicle (BEV) Market Volume, Forecast 2021-2031 (Thousand Units, AGR %, CAGR %) (U Shaped Recovery)
Table 8.351 Greece Battery Electric Vehicle (BEV) Market Revenue, Forecast 2021-2031 (US$Mn, AGR %, CAGR %) (L Shaped Recovery)
Table 8.352 Greece Battery Electric Vehicle (BEV) Market Volume, Forecast 2021-2031 (Thousand Units, AGR %, CAGR %) (L Shaped Recovery)
Table 8.353 Greece Battery Electric Vehicle (BEV) Market Revenue, Forecast 2021-2031 (US$Mn, AGR %, CAGR %) (W Shaped Recovery)
Table 8.354 Greece Battery Electric Vehicle (BEV) Market Volume, Forecast 2021-2031 (Thousand Units, AGR %, CAGR %) (W Shaped Recovery)
Table 8.355 Slovakia Battery Electric Vehicle (BEV) Market Revenue, Forecast 2021-2031 (US$Mn, AGR %, CAGR %) (Pre COVID)
Table 8.356 Slovakia Battery Electric Vehicle (BEV) Market Volume, Forecast 2021-2031 (Thousand Units, AGR %, CAGR %) (Pre COVID)
Table 8.357 Slovakia Battery Electric Vehicle (BEV) Market Revenue, Forecast 2021-2031 (US$Mn, AGR %, CAGR %) (V Shaped Recovery)
Table 8.358 Slovakia Battery Electric Vehicle (BEV) Market Volume, Forecast 2021-2031 (Thousand Units, AGR %, CAGR %) (V Shaped Recovery)
Table 8.359 Slovakia Battery Electric Vehicle (BEV) Market Revenue, Forecast 2021-2031 (US$Mn, AGR %, CAGR %) (U Shaped Recovery)
Table 8.360 Slovakia Battery Electric Vehicle (BEV) Market Volume, Forecast 2021-2031 (Thousand Units, AGR %, CAGR %) (U Shaped Recovery)
Table 8.361 Slovakia Battery Electric Vehicle (BEV) Market Revenue, Forecast 2021-2031 (US$Mn, AGR %, CAGR %) (L Shaped Recovery)
Table 8.362 Slovakia Battery Electric Vehicle (BEV) Market Volume, Forecast 2021-2031 (Thousand Units, AGR %, CAGR %) (L Shaped Recovery)
Table 8.363 Slovakia Battery Electric Vehicle (BEV) Market Revenue, Forecast 2021-2031 (US$Mn, AGR %, CAGR %) (W Shaped Recovery)
Table 8.364 Slovakia Battery Electric Vehicle (BEV) Market Volume, Forecast 2021-2031 (Thousand Units, AGR %, CAGR %) (W Shaped Recovery)
Table 8.365 Rest of Europe Battery Electric Vehicle (BEV) Market Revenue, Forecast 2021-2031 (US$Mn, AGR %, CAGR %) (Pre COVID)
Table 8.366 Rest of Europe Battery Electric Vehicle (BEV) Market Volume, Forecast 2021-2031 (Thousand Units, AGR %, CAGR %) (Pre COVID)
Table 8.367 Rest of Europe Battery Electric Vehicle (BEV) Market Revenue, Forecast 2021-2031 (US$Mn, AGR %, CAGR %) (V Shaped Recovery)
Table 8.368 Rest of Europe Battery Electric Vehicle (BEV) Market Volume, Forecast 2021-2031 (Thousand Units, AGR %, CAGR %) (V Shaped Recovery)
Table 8.369 Rest of Europe Battery Electric Vehicle (BEV) Market Revenue, Forecast 2021-2031 (US$Mn, AGR %, CAGR %) (U Shaped Recovery)
Table 8.370 Rest of Europe Battery Electric Vehicle (BEV) Market Volume, Forecast 2021-2031 (Thousand Units, AGR %, CAGR %) (U Shaped Recovery)
Table 8.371 Rest of Europe Battery Electric Vehicle (BEV) Market Revenue, Forecast 2021-2031 (US$Mn, AGR %, CAGR %) (L Shaped Recovery)
Table 8.372 Rest of Europe Battery Electric Vehicle (BEV) Market Volume, Forecast 2021-2031 (Thousand Units, AGR %, CAGR %) (L Shaped Recovery)
Table 8.373 Rest of Europe Battery Electric Vehicle (BEV) Market Revenue, Forecast 2021-2031 (US$Mn, AGR %, CAGR %) (W Shaped Recovery)
Table 8.374 Rest of Europe Battery Electric Vehicle (BEV) Market Volume, Forecast 2021-2031 (Thousand Units, AGR %, CAGR %) (W Shaped Recovery)
Table 8.375 APAC Battery Electric Vehicle (BEV) Market Revenue, Forecast 2021-2031 (US$Mn, AGR %, CAGR %) (Pre COVID)
Table 8.376 APAC Battery Electric Vehicle (BEV) Market Volume, Forecast 2021-2031 (Thousand Units, AGR %, CAGR %) (Pre COVID)
Table 8.377 APAC Battery Electric Vehicle (BEV) Market Revenue, Forecast 2021-2031 (US$Mn, AGR %, CAGR %) (V Shaped Recovery)
Table 8.378 APAC Battery Electric Vehicle (BEV) Market Volume, Forecast 2021-2031 (Thousand Units, AGR %, CAGR %) (V Shaped Recovery)
Table 8.379 APAC Battery Electric Vehicle (BEV) Market Revenue, Forecast 2021-2031 (US$Mn, AGR %, CAGR %) (U Shaped Recovery)
Table 8.380 APAC Battery Electric Vehicle (BEV) Market Volume, Forecast 2021-2031 (Thousand Units, AGR %, CAGR %) (U Shaped Recovery)
Table 8.381 APAC Battery Electric Vehicle (BEV) Market Revenue, Forecast 2021-2031 (US$Mn, AGR %, CAGR %) (L Shaped Recovery)
Table 8.382 APAC Battery Electric Vehicle (BEV) Market Volume, Forecast 2021-2031 (Thousand Units, AGR %, CAGR %) (L Shaped Recovery)
Table 8.383 APAC Battery Electric Vehicle (BEV) Market Revenue, Forecast 2021-2031 (US$Mn, AGR %, CAGR %) (W Shaped Recovery)
Table 8.384 APAC Battery Electric Vehicle (BEV) Market Volume, Forecast 2021-2031 (Thousand Units, AGR %, CAGR %) (W Shaped Recovery)
Table 8.385 APAC Battery Electric Vehicle (BEV) Market Revenue by Vehicle Type, Forecast 2021-2031 (US$Mn, AGR %, CAGR %) (Pre COVID)
Table 8.386 APAC Battery Electric Vehicle (BEV) Market Volume by Vehicle Type, Forecast 2021-2031 (Thousand Units, AGR %, CAGR %) (Pre COVID)
Table 8.387 APAC Battery Electric Vehicle (BEV) Market Revenue by Vehicle Type, Forecast 2021-2031 (US$Mn, AGR %, CAGR %) (V Shaped Recovery)
Table 8.388 APAC Battery Electric Vehicle (BEV) Market Volume by Vehicle Type, Forecast 2021-2031 (Thousand Units, AGR %, CAGR %) (V Shaped Recovery)
Table 8.389 APAC Battery Electric Vehicle (BEV) Market Revenue by Vehicle Type, Forecast 2021-2031 (US$Mn, AGR %, CAGR %) (U Shaped Recovery)
Table 8.390 APAC Battery Electric Vehicle (BEV) Market Volume by Vehicle Type, Forecast 2021-2031 (Thousand Units, AGR %, CAGR %) (U Shaped Recovery)
Table 8.391 APAC Battery Electric Vehicle (BEV) Market Revenue by Vehicle Type, Forecast 2021-2031 (US$Mn, AGR %, CAGR %) (L Shaped Recovery)
Table 8.392 APAC Battery Electric Vehicle (BEV) Market Volume by Vehicle Type, Forecast 2021-2031 (Thousand Units, AGR %, CAGR %) (L Shaped Recovery)
Table 8.393 APAC Battery Electric Vehicle (BEV) Market Revenue by Vehicle Type, Forecast 2021-2031 (US$Mn, AGR %, CAGR %) (W Shaped Recovery)
Table 8.394 APAC Battery Electric Vehicle (BEV) Market Volume by Vehicle Type, Forecast 2021-2031 (Thousand Units, AGR %, CAGR %) (W Shaped Recovery)
Table 8.395 APAC Battery Electric Vehicle (BEV) Market Revenue by Battery Type, Forecast 2021-2031 (US$Mn, AGR %, CAGR %) (Pre COVID)
Table 8.396 APAC Battery Electric Vehicle (BEV) Market Revenue by Battery Type, Forecast 2021-2031 (US$Mn, AGR %, CAGR %) (V Shaped Recovery)
Table 8.397 APAC Battery Electric Vehicle (BEV) Market Revenue by Battery Type, Forecast 2021-2031 (US$Mn, AGR %, CAGR %) (U Shaped Recovery)
Table 8.398 APAC Battery Electric Vehicle (BEV) Market Revenue by Battery Type, Forecast 2021-2031 (US$Mn, AGR %, CAGR %) (L Shaped Recovery)
Table 8.399 APAC Battery Electric Vehicle (BEV) Market Revenue by Battery Type, Forecast 2021-2031 (US$Mn, AGR %, CAGR %) (W Shaped Recovery)
Table 8.400 APAC Battery Electric Vehicle (BEV) Market Revenue by Country, Forecast 2021-2031 (US$Mn, AGR %, CAGR %) (Pre COVID)
Table 8.401 APAC Battery Electric Vehicle (BEV) Market Volume by Country, Forecast 2021-2031 (Thousand Units, AGR %, CAGR %) (Pre COVID)
Table 8.402 APAC Battery Electric Vehicle (BEV) Market Revenue by Country, Forecast 2021-2031 (US$Mn, AGR %, CAGR %) (V Shaped Recovery)
Table 8.403 APAC Battery Electric Vehicle (BEV) Market Volume by Country, Forecast 2021-2031 (Thousand Units, AGR %, CAGR %) (V Shaped Recovery)
Table 8.404 APAC Battery Electric Vehicle (BEV) Market Revenue by Country, Forecast 2021-2031 (US$Mn, AGR %, CAGR %) (U Shaped Recovery)
Table 8.405 APAC Battery Electric Vehicle (BEV) Market Volume by Country, Forecast 2021-2031 (Thousand Units, AGR %, CAGR %) (U Shaped Recovery)
Table 8.406 APAC Battery Electric Vehicle (BEV) Market Revenue by Country, Forecast 2021-2031 (US$Mn, AGR %, CAGR %) (L Shaped Recovery)
Table 8.407 APAC Battery Electric Vehicle (BEV) Market Volume by Country, Forecast 2021-2031 (Thousand Units, AGR %, CAGR %) (L Shaped Recovery)
Table 8.408 APAC Battery Electric Vehicle (BEV) Market Revenue by Country, Forecast 2021-2031 (US$Mn, AGR %, CAGR %) (W Shaped Recovery)
Table 8.409 APAC Battery Electric Vehicle (BEV) Market Volume by Country, Forecast 2021-2031 (Thousand Units, AGR %, CAGR %) (W Shaped Recovery)
Table 8.410 China Battery Electric Vehicle (BEV) Market Revenue by Vehicle Type, Forecast 2021-2031 (US$Mn, AGR %, CAGR %) (Pre COVID)
Table 8.411 China Battery Electric Vehicle (BEV) Market Volume by Vehicle Type, Forecast 2021-2031 (Thousand Units, AGR %, CAGR %) (Pre COVID)
Table 8.412 China Battery Electric Vehicle (BEV) Market Revenue by Vehicle Type, Forecast 2021-2031 (US$Mn, AGR %, CAGR %) (V Shaped Recovery)
Table 8.413 China Battery Electric Vehicle (BEV) Market Volume by Vehicle Type, Forecast 2021-2031 (Thousand Units, AGR %, CAGR %) (V Shaped Recovery)
Table 8.414 China Battery Electric Vehicle (BEV) Market Revenue by Vehicle Type, Forecast 2021-2031 (US$Mn, AGR %, CAGR %) (U Shaped Recovery)
Table 8.415 China Battery Electric Vehicle (BEV) Market Volume by Vehicle Type, Forecast 2021-2031 (Thousand Units, AGR %, CAGR %) (U Shaped Recovery)
Table 8.416 China Battery Electric Vehicle (BEV) Market Revenue by Vehicle Type, Forecast 2021-2031 (US$Mn, AGR %, CAGR %) (L Shaped Recovery)
Table 8.417 China Battery Electric Vehicle (BEV) Market Volume by Vehicle Type, Forecast 2021-2031 (Thousand Units, AGR %, CAGR %) (L Shaped Recovery)
Table 8.418 China Battery Electric Vehicle (BEV) Market Revenue by Vehicle Type, Forecast 2021-2031 (US$Mn, AGR %, CAGR %) (W Shaped Recovery)
Table 8.419 China Battery Electric Vehicle (BEV) Market Volume by Vehicle Type, Forecast 2021-2031 (Thousand Units, AGR %, CAGR %) (W Shaped Recovery)
Table 8.420 China Battery Electric Vehicle (BEV) Market Revenue by Battery Type, Forecast 2021-2031 (US$Mn, AGR %, CAGR %) (Pre COVID)
Table 8.421 China Battery Electric Vehicle (BEV) Market Revenue by Battery Type, Forecast 2021-2031 (US$Mn, AGR %, CAGR %) (V Shaped Recovery)
Table 8.422 China Battery Electric Vehicle (BEV) Market Revenue by Battery Type, Forecast 2021-2031 (US$Mn, AGR %, CAGR %) (U Shaped Recovery)
Table 8.423 China Battery Electric Vehicle (BEV) Market Revenue by Battery Type, Forecast 2021-2031 (US$Mn, AGR %, CAGR %) (L Shaped Recovery)
Table 8.424 China Battery Electric Vehicle (BEV) Market Revenue by Battery Type, Forecast 2021-2031 (US$Mn, AGR %, CAGR %) (W Shaped Recovery)
Table 8.425 Japan Battery Electric Vehicle (BEV) Market Revenue by Vehicle Type, Forecast 2021-2031 (US$Mn, AGR %, CAGR %) (Pre COVID)
Table 8.426 Japan Battery Electric Vehicle (BEV) Market Volume by Vehicle Type, Forecast 2021-2031 (Thousand Units, AGR %, CAGR %) (Pre COVID)
Table 8.427 Japan Battery Electric Vehicle (BEV) Market Revenue by Vehicle Type, Forecast 2021-2031 (US$Mn, AGR %, CAGR %) (V Shaped Recovery)
Table 8.428 Japan Battery Electric Vehicle (BEV) Market Volume by Vehicle Type, Forecast 2021-2031 (Thousand Units, AGR %, CAGR %) (V Shaped Recovery)
Table 8.429 Japan Battery Electric Vehicle (BEV) Market Revenue by Vehicle Type, Forecast 2021-2031 (US$Mn, AGR %, CAGR %) (U Shaped Recovery)
Table 8.430 Japan Battery Electric Vehicle (BEV) Market Volume by Vehicle Type, Forecast 2021-2031 (Thousand Units, AGR %, CAGR %) (U Shaped Recovery)
Table 8.431 Japan Battery Electric Vehicle (BEV) Market Revenue by Vehicle Type, Forecast 2021-2031 (US$Mn, AGR %, CAGR %) (L Shaped Recovery)
Table 8.432 Japan Battery Electric Vehicle (BEV) Market Volume by Vehicle Type, Forecast 2021-2031 (Thousand Units, AGR %, CAGR %) (L Shaped Recovery)
Table 8.433 Japan Battery Electric Vehicle (BEV) Market Revenue by Vehicle Type, Forecast 2021-2031 (US$Mn, AGR %, CAGR %) (W Shaped Recovery)
Table 8.434 Japan Battery Electric Vehicle (BEV) Market Volume by Vehicle Type, Forecast 2021-2031 (Thousand Units, AGR %, CAGR %) (W Shaped Recovery)
Table 8.435 Japan Battery Electric Vehicle (BEV) Market Revenue by Battery Type, Forecast 2021-2031 (US$Mn, AGR %, CAGR %) (Pre COVID)
Table 8.436 Japan Battery Electric Vehicle (BEV) Market Revenue by Battery Type, Forecast 2021-2031 (US$Mn, AGR %, CAGR %) (V Shaped Recovery)
Table 8.437 Japan Battery Electric Vehicle (BEV) Market Revenue by Battery Type, Forecast 2021-2031 (US$Mn, AGR %, CAGR %) (U Shaped Recovery)
Table 8.438 Japan Battery Electric Vehicle (BEV) Market Revenue by Battery Type, Forecast 2021-2031 (US$Mn, AGR %, CAGR %) (L Shaped Recovery)
Table 8.439 Japan Battery Electric Vehicle (BEV) Market Revenue by Battery Type, Forecast 2021-2031 (US$Mn, AGR %, CAGR %) (W Shaped Recovery)
Table 8.440 India Battery Electric Vehicle (BEV) Market Revenue by Vehicle Type, Forecast 2021-2031 (US$Mn, AGR %, CAGR %) (Pre COVID)
Table 8.441 India Battery Electric Vehicle (BEV) Market Volume by Vehicle Type, Forecast 2021-2031 (Thousand Units, AGR %, CAGR %) (Pre COVID)
Table 8.442 India Battery Electric Vehicle (BEV) Market Revenue by Vehicle Type, Forecast 2021-2031 (US$Mn, AGR %, CAGR %) (V Shaped Recovery)
Table 8.443 India Battery Electric Vehicle (BEV) Market Volume by Vehicle Type, Forecast 2021-2031 (Thousand Units, AGR %, CAGR %) (V Shaped Recovery)
Table 8.444 India Battery Electric Vehicle (BEV) Market Revenue by Vehicle Type, Forecast 2021-2031 (US$Mn, AGR %, CAGR %) (U Shaped Recovery)
Table 8.445 India Battery Electric Vehicle (BEV) Market Volume by Vehicle Type, Forecast 2021-2031 (Thousand Units, AGR %, CAGR %) (U Shaped Recovery)
Table 8.446 India Battery Electric Vehicle (BEV) Market Revenue by Vehicle Type, Forecast 2021-2031 (US$Mn, AGR %, CAGR %) (L Shaped Recovery)
Table 8.447 India Battery Electric Vehicle (BEV) Market Volume by Vehicle Type, Forecast 2021-2031 (Thousand Units, AGR %, CAGR %) (L Shaped Recovery)
Table 8.448 India Battery Electric Vehicle (BEV) Market Revenue by Vehicle Type, Forecast 2021-2031 (US$Mn, AGR %, CAGR %) (W Shaped Recovery)
Table 8.449 India Battery Electric Vehicle (BEV) Market Volume by Vehicle Type, Forecast 2021-2031 (Thousand Units, AGR %, CAGR %) (W Shaped Recovery)
Table 8.450 South Korea Battery Electric Vehicle (BEV) Market Revenue by Vehicle Type, Forecast 2021-2031 (US$Mn, AGR %, CAGR %) (Pre COVID)
Table 8.451 South Korea Battery Electric Vehicle (BEV) Market Volume by Vehicle Type, Forecast 2021-2031 (Thousand Units, AGR %, CAGR %) (Pre COVID)
Table 8.452 South Korea Battery Electric Vehicle (BEV) Market Revenue by Vehicle Type, Forecast 2021-2031 (US$Mn, AGR %, CAGR %) (V Shaped Recovery)
Table 8.453 South Korea Battery Electric Vehicle (BEV) Market Volume by Vehicle Type, Forecast 2021-2031 (Thousand Units, AGR %, CAGR %) (V Shaped Recovery)
Table 8.454 South Korea Battery Electric Vehicle (BEV) Market Revenue by Vehicle Type, Forecast 2021-2031 (US$Mn, AGR %, CAGR %) (U Shaped Recovery)
Table 8.455 South Korea Battery Electric Vehicle (BEV) Market Volume by Vehicle Type, Forecast 2021-2031 (Thousand Units, AGR %, CAGR %) (U Shaped Recovery)
Table 8.456 South Korea Battery Electric Vehicle (BEV) Market Revenue by Vehicle Type, Forecast 2021-2031 (US$Mn, AGR %, CAGR %) (L Shaped Recovery)
Table 8.457 South Korea Battery Electric Vehicle (BEV) Market Volume by Vehicle Type, Forecast 2021-2031 (Thousand Units, AGR %, CAGR %) (L Shaped Recovery)
Table 8.458 South Korea Battery Electric Vehicle (BEV) Market Revenue by Vehicle Type, Forecast 2021-2031 (US$Mn, AGR %, CAGR %) (W Shaped Recovery)
Table 8.459 South Korea Battery Electric Vehicle (BEV) Market Volume by Vehicle Type, Forecast 2021-2031 (Thousand Units, AGR %, CAGR %) (W Shaped Recovery)
Table 8.460 Australia Battery Electric Vehicle (BEV) Market Revenue by Vehicle Type, Forecast 2021-2031 (US$Mn, AGR %, CAGR %) (Pre COVID)
Table 8.461 Australia Battery Electric Vehicle (BEV) Market Volume by Vehicle Type, Forecast 2021-2031 (Thousand Units, AGR %, CAGR %) (Pre COVID)
Table 8.462 Australia Battery Electric Vehicle (BEV) Market Revenue by Vehicle Type, Forecast 2021-2031 (US$Mn, AGR %, CAGR %) (V Shaped Recovery)
Table 8.463 Australia Battery Electric Vehicle (BEV) Market Volume by Vehicle Type, Forecast 2021-2031 (Thousand Units, AGR %, CAGR %) (V Shaped Recovery)
Table 8.464 Australia Battery Electric Vehicle (BEV) Market Revenue by Vehicle Type, Forecast 2021-2031 (US$Mn, AGR %, CAGR %) (U Shaped Recovery)
Table 8.465 Australia Battery Electric Vehicle (BEV) Market Volume by Vehicle Type, Forecast 2021-2031 (Thousand Units, AGR %, CAGR %) (U Shaped Recovery)
Table 8.466 Australia Battery Electric Vehicle (BEV) Market Revenue by Vehicle Type, Forecast 2021-2031 (US$Mn, AGR %, CAGR %) (L Shaped Recovery)
Table 8.467 Australia Battery Electric Vehicle (BEV) Market Volume by Vehicle Type, Forecast 2021-2031 (Thousand Units, AGR %, CAGR %) (L Shaped Recovery)
Table 8.468 Australia Battery Electric Vehicle (BEV) Market Revenue by Vehicle Type, Forecast 2021-2031 (US$Mn, AGR %, CAGR %) (W Shaped Recovery)
Table 8.469 Australia Battery Electric Vehicle (BEV) Market Volume by Vehicle Type, Forecast 2021-2031 (Thousand Units, AGR %, CAGR %) (W Shaped Recovery)
Table 8.470 Rest of APAC Battery Electric Vehicle (BEV) Market Revenue, Forecast 2021-2031 (US$Mn, AGR %, CAGR %) (Pre COVID)
Table 8.471 Rest of APAC Battery Electric Vehicle (BEV) Market Volume, Forecast 2021-2031 (Thousand Units, AGR %, CAGR %) (Pre COVID)
Table 8.472 Rest of APAC Battery Electric Vehicle (BEV) Market Revenue, Forecast 2021-2031 (US$Mn, AGR %, CAGR %) (V Shaped Recovery)
Table 8.473 APAC Battery Electric Vehicle (BEV) Market Volume, Forecast 2021-2031 (Thousand Units, AGR %, CAGR %) (V Shaped Recovery)
Table 8.474 Rest of APAC Battery Electric Vehicle (BEV) Market Revenue, Forecast 2021-2031 (US$Mn, AGR %, CAGR %) (U Shaped Recovery)
Table 8.475 Rest of APAC Battery Electric Vehicle (BEV) Market Volume, Forecast 2021-2031 (Thousand Units, AGR %, CAGR %) (U Shaped Recovery)
Table 8.476 Rest of APAC Battery Electric Vehicle (BEV) Market Revenue, Forecast 2021-2031 (US$Mn, AGR %, CAGR %) (L Shaped Recovery)
Table 8.477 Rest of APAC Battery Electric Vehicle (BEV) Market Volume, Forecast 2021-2031 (Thousand Units, AGR %, CAGR %) (L Shaped Recovery)
Table 8.478 Rest of APAC Battery Electric Vehicle (BEV) Market Revenue, Forecast 2021-2031 (US$Mn, AGR %, CAGR %) (W Shaped Recovery)
Table 8.479 Rest of APAC Battery Electric Vehicle (BEV) Market Volume, Forecast 2021-2031 (Thousand Units, AGR %, CAGR %) (W Shaped Recovery)
Table 8.480 RoW Battery Electric Vehicle (BEV) Market Revenue, Forecast 2021-2031 (US$Mn, AGR %, CAGR %) (Pre COVID)
Table 8.481 RoW Battery Electric Vehicle (BEV) Market Volume, Forecast 2021-2031 (Thousand Units, AGR %, CAGR %) (Pre COVID)
Table 8.482 RoW Battery Electric Vehicle (BEV) Market Revenue, Forecast 2021-2031 (US$Mn, AGR %, CAGR %) (V Shaped Recovery)
Table 8.483 RoW Battery Electric Vehicle (BEV) Market Volume, Forecast 2021-2031 (Thousand Units, AGR %, CAGR %) (V Shaped Recovery)
Table 8.484 RoW Battery Electric Vehicle (BEV) Market Revenue, Forecast 2021-2031 (US$Mn, AGR %, CAGR %) (U Shaped Recovery)
Table 8.485 RoW Battery Electric Vehicle (BEV) Market Volume, Forecast 2021-2031 (Thousand Units, AGR %, CAGR %) (U Shaped Recovery)
Table 8.486 RoW Battery Electric Vehicle (BEV) Market Revenue, Forecast 2021-2031 (US$Mn, AGR %, CAGR %) (L Shaped Recovery)
Table 8.487 RoW Battery Electric Vehicle (BEV) Market Volume, Forecast 2021-2031 (Thousand Units, AGR %, CAGR %) (L Shaped Recovery)
Table 8.488 RoW Battery Electric Vehicle (BEV) Market Revenue, Forecast 2021-2031 (US$Mn, AGR %, CAGR %) (W Shaped Recovery)
Table 8.489 RoW Battery Electric Vehicle (BEV) Market Volume, Forecast 2021-2031 (Thousand Units, AGR %, CAGR %) (W Shaped Recovery)
Table 8.490 RoW Battery Electric Vehicle (BEV) Market Revenue by Vehicle Type, Forecast 2021-2031 (US$Mn, AGR %, CAGR %) (Pre COVID)
Table 8.491 RoW Battery Electric Vehicle (BEV) Market Volume by Vehicle Type, Forecast 2021-2031 (Thousand Units, AGR %, CAGR %) (Pre COVID)
Table 8.492 RoW Battery Electric Vehicle (BEV) Market Revenue by Vehicle Type, Forecast 2021-2031 (US$Mn, AGR %, CAGR %) (V Shaped Recovery)
Table 8.493 RoW Battery Electric Vehicle (BEV) Market Volume by Vehicle Type, Forecast 2021-2031 (Thousand Units, AGR %, CAGR %) (V Shaped Recovery)
Table 8.494 RoW Battery Electric Vehicle (BEV) Market Revenue by Vehicle Type, Forecast 2021-2031 (US$Mn, AGR %, CAGR %) (U Shaped Recovery)
Table 8.495 RoW Battery Electric Vehicle (BEV) Market Volume by Vehicle Type, Forecast 2021-2031 (Thousand Units, AGR %, CAGR %) (U Shaped Recovery)
Table 8.496 RoW Battery Electric Vehicle (BEV) Market Revenue by Vehicle Type, Forecast 2021-2031 (US$Mn, AGR %, CAGR %) (L Shaped Recovery)
Table 8.497 RoW Battery Electric Vehicle (BEV) Market Volume by Vehicle Type, Forecast 2021-2031 (Thousand Units, AGR %, CAGR %) (L Shaped Recovery)
Table 8.498 RoW Battery Electric Vehicle (BEV) Market Revenue by Vehicle Type, Forecast 2021-2031 (US$Mn, AGR %, CAGR %) (W Shaped Recovery)
Table 8.499 RoW Battery Electric Vehicle (BEV) Market Volume by Vehicle Type, Forecast 2021-2031 (Thousand Units, AGR %, CAGR %) (W Shaped Recovery)
Table 8.500 RoW Battery Electric Vehicle (BEV) Market Revenue by Battery Type, Forecast 2021-2031 (US$Mn, AGR %, CAGR %) (Pre COVID)
Table 8.501 RoW Battery Electric Vehicle (BEV) Market Revenue by Battery Type, Forecast 2021-2031 (US$Mn, AGR %, CAGR %) (V Shaped Recovery)
Table 8.502 RoW Battery Electric Vehicle (BEV) Market Revenue by Battery Type, Forecast 2021-2031 (US$Mn, AGR %, CAGR %) (U Shaped Recovery)
Table 8.503 RoW Battery Electric Vehicle (BEV) Market Revenue by Battery Type, Forecast 2021-2031 (US$Mn, AGR %, CAGR %) (L Shaped Recovery)
Table 8.504 RoW Battery Electric Vehicle (BEV) Market Revenue by Battery Type, Forecast 2021-2031 (US$Mn, AGR %, CAGR %) (W Shaped Recovery)
Table 8.505 RoW Battery Electric Vehicle (BEV) Market Revenue by Country, Forecast 2021-2031 (US$Mn, AGR %, CAGR %) (Pre COVID)
Table 8.506 RoW Battery Electric Vehicle (BEV) Market Volume by Country, Forecast 2021-2031 (Thousand Units, AGR %, CAGR %) (Pre COVID)
Table 8.507 RoW Battery Electric Vehicle (BEV) Market Revenue by Country, Forecast 2021-2031 (US$Mn, AGR %, CAGR %) (V Shaped Recovery)
Table 8.508 RoW Battery Electric Vehicle (BEV) Market Volume by Country, Forecast 2021-2031 (Thousand Units, AGR %, CAGR %) (V Shaped Recovery)
Table 8.509 RoW Battery Electric Vehicle (BEV) Market Revenue by Country, Forecast 2021-2031 (US$Mn, AGR %, CAGR %) (U Shaped Recovery)
Table 8.510 RoW Battery Electric Vehicle (BEV) Market Volume by Country, Forecast 2021-2031 (Thousand Units, AGR %, CAGR %) (U Shaped Recovery)
Table 8.511 RoW Battery Electric Vehicle (BEV) Market Revenue by Country, Forecast 2021-2031 (US$Mn, AGR %, CAGR %) (L Shaped Recovery)
Table 8.512 RoW Battery Electric Vehicle (BEV) Market Volume by Country, Forecast 2021-2031 (Thousand Units, AGR %, CAGR %) (L Shaped Recovery)
Table 8.513 RoW Battery Electric Vehicle (BEV) Market Revenue by Country, Forecast 2021-2031 (US$Mn, AGR %, CAGR %) (W Shaped Recovery)
Table 8.514 RoW Battery Electric Vehicle (BEV) Market Volume by Country, Forecast 2021-2031 (Thousand Units, AGR %, CAGR %) (W Shaped Recovery)
Table 8.515 South America Battery Electric Vehicle (BEV) Market Revenue by Country, Forecast 2021-2031 (US$Mn, AGR %, CAGR %) (Pre COVID)
Table 8.516 South America Battery Electric Vehicle (BEV) Market Volume by Country, Forecast 2021-2031 (Thousand Units, AGR %, CAGR %) (Pre COVID)
Table 8.517 South America Battery Electric Vehicle (BEV) Market Revenue by Country, Forecast 2021-2031 (US$Mn, AGR %, CAGR %) (V Shaped Recovery)
Table 8.518 South America Battery Electric Vehicle (BEV) Market Volume by Country, Forecast 2021-2031 (Thousand Units, AGR %, CAGR %) (V Shaped Recovery)
Table 8.519 South America Battery Electric Vehicle (BEV) Market Revenue by Country, Forecast 2021-2031 (US$Mn, AGR %, CAGR %) (U Shaped Recovery)
Table 8.520 South America Battery Electric Vehicle (BEV) Market Volume by Country, Forecast 2021-2031 (Thousand Units, AGR %, CAGR %) (U Shaped Recovery)
Table 8.521 South America Battery Electric Vehicle (BEV) Market Revenue by Country, Forecast 2021-2031 (US$Mn, AGR %, CAGR %) (L Shaped Recovery)
Table 8.522 South America Battery Electric Vehicle (BEV) Market Volume by Country, Forecast 2021-2031 (Thousand Units, AGR %, CAGR %) (L Shaped Recovery)
Table 8.523 South America Battery Electric Vehicle (BEV) Market Revenue by Country, Forecast 2021-2031 (US$Mn, AGR %, CAGR %) (W Shaped Recovery)
Table 8.524 South America Battery Electric Vehicle (BEV) Market Volume by Country, Forecast 2021-2031 (Thousand Units, AGR %, CAGR %) (W Shaped Recovery)
Table 8.525 Middle East Battery Electric Vehicle (BEV) Market Revenue by Country, Forecast 2021-2031 (US$Mn, AGR %, CAGR %) (Pre COVID)
Table 8.526 Middle East Battery Electric Vehicle (BEV) Market Volume by Country, Forecast 2021-2031 (Thousand Units, AGR %, CAGR %) (Pre COVID)
Table 8.527 Middle East Battery Electric Vehicle (BEV) Market Revenue by Country, Forecast 2021-2031 (US$Mn, AGR %, CAGR %) (V Shaped Recovery)
Table 8.528 Middle East Battery Electric Vehicle (BEV) Market Volume by Country, Forecast 2021-2031 (Thousand Units, AGR %, CAGR %) (V Shaped Recovery)
Table 8.529 Middle East Battery Electric Vehicle (BEV) Market Revenue by Country, Forecast 2021-2031 (US$Mn, AGR %, CAGR %) (U Shaped Recovery)
Table 8.530 Middle East Battery Electric Vehicle (BEV) Market Volume by Country, Forecast 2021-2031 (Thousand Units, AGR %, CAGR %) (U Shaped Recovery)
Table 8.531 Middle East Battery Electric Vehicle (BEV) Market Revenue by Country, Forecast 2021-2031 (US$Mn, AGR %, CAGR %) (L Shaped Recovery)
Table 8.532 Middle East Battery Electric Vehicle (BEV) Market Volume by Country, Forecast 2021-2031 (Thousand Units, AGR %, CAGR %) (L Shaped Recovery)
Table 8.533 Middle East Battery Electric Vehicle (BEV) Market Revenue by Country, Forecast 2021-2031 (US$Mn, AGR %, CAGR %) (W Shaped Recovery)
Table 8.534 Middle East Battery Electric Vehicle (BEV) Market Volume by Country, Forecast 2021-2031 (Thousand Units, AGR %, CAGR %) (W Shaped Recovery)
Table 8.535 Africa Battery Electric Vehicle (BEV) Market Revenue by Country, Forecast 2021-2031 (US$Mn, AGR %, CAGR %) (Pre COVID)
Table 8.536 Africa Battery Electric Vehicle (BEV) Market Volume by Country, Forecast 2021-2031 (Thousand Units, AGR %, CAGR %) (Pre COVID)
Table 8.537 Africa Battery Electric Vehicle (BEV) Market Revenue by Country, Forecast 2021-2031 (US$Mn, AGR %, CAGR %) (V Shaped Recovery)
Table 8.538 Africa Battery Electric Vehicle (BEV) Market Volume by Country, Forecast 2021-2031 (Thousand Units, AGR %, CAGR %) (V Shaped Recovery)
Table 8.539 Africa Battery Electric Vehicle (BEV) Market Revenue by Country, Forecast 2021-2031 (US$Mn, AGR %, CAGR %) (U Shaped Recovery)
Table 8.540 Africa Battery Electric Vehicle (BEV) Market Volume by Country, Forecast 2021-2031 (Thousand Units, AGR %, CAGR %) (U Shaped Recovery)
Table 8.541 Africa Battery Electric Vehicle (BEV) Market Revenue by Country, Forecast 2021-2031 (US$Mn, AGR %, CAGR %) (L Shaped Recovery)
Table 8.542 Africa Battery Electric Vehicle (BEV) Market Volume by Country, Forecast 2021-2031 (Thousand Units, AGR %, CAGR %) (L Shaped Recovery)
Table 8.543 Africa Battery Electric Vehicle (BEV) Market Revenue by Country, Forecast 2021-2031 (US$Mn, AGR %, CAGR %) (W Shaped Recovery)
Table 8.544 Africa Battery Electric Vehicle (BEV) Market Volume by Country, Forecast 2021-2031 (Thousand Units, AGR %, CAGR %) (W Shaped Recovery)
Table 9.1 Tesla, Inc. (Company Details)
Table 9.2 Tesla, Inc. Battery Electric Vehicle (BEV) Product Portfolio
Table 9.3 Tesla, Inc. Revenue and AGR, 2016 - 2019 (USD Million & %)
Table 9.4 Nissan Motor Corporation (Company Details)
Table 9.5 Nissan Motor Corporation Battery Electric Vehicle (BEV) Product Portfolio
Table 9.6 Nissan Motor Corporation Revenue and AGR, 2016 - 2019 (USD Million & %)
Table 9.7 Renault S.A. (Company Details)
Table 9.8 Renault S.A. Battery Electric Vehicle (BEV) Product Portfolio
Table 9.9 Renault S.A. Revenue and AGR, 2016 - 2019 (USD Million & %)
Table 9.10 Bayerische Motoren Werke AG (Company Details)
Table 9.11 Bayerische Motoren Werke AG Battery Electric Vehicle (BEV) Product Portfolio
Table 9.12 Bayerische Motoren Werke AG Revenue and AGR, 2017 - 2019 (USD Million & %)
Table 9.13 Beijing Automotive Industry Holding Co., Ltd. (Company Details)
Table 9.14 Beijing Automotive Industry Holding Co., Ltd. Battery Electric Vehicle (BEV) Product Portfolio
Table 9.15 Beijing Automotive Industry Holding Co., Ltd. Revenue and AGR, 2016 - 2019 (USD Million & %)
Table 9.16 Chery Automobile Co., Ltd. (Company Details)
Table 9.17 Chery Automobile Co., Ltd. Battery Electric Vehicle (BEV) Product Portfolio
Table 9.18 Volkswagen AG (Company Details)
Table 9.19 Volkswagen AG Battery Electric Vehicle (BEV) Product Portfolio
Table 9.20 Volkswagen AG Revenue and AGR, 2016 - 2019 (USD Million & %)
Table 9.21 SAIC Motor Corporation Limited (Company Details)
Table 9.22 SAIC Motor Corporation Limited Battery Electric Vehicle (BEV) Product Portfolio
Table 9.23 SAIC Motor Corporation Limited Revenue and AGR, 2016 - 2019 (USD Million & %)
Table 9.24 BYD Company Ltd. (Company Details)
Table 9.25 BYD Company Ltd. Battery Electric Vehicle (BEV) Product Portfolio
Table 9.26 BYD Company Ltd. Revenue and AGR, 2016 - 2019 (USD Million & %)
Table 9.27 Zhejiang Geely Holding Group Co., Ltd. (Company Details)
Table 9.28 Zhejiang Geely Holding Group Co., Ltd. Battery Electric Vehicle (BEV) Product Portfolio
Table 9.29 Zhejiang Geely Holding Group Co., Ltd. Revenue and AGR, 2016 - 2019 (USD Million & %)
Table 9.30 Blue Bird Corporation (Company Details)
Table 9.31 Blue Bird Corporation Battery Electric Vehicle (BEV) Product Portfolio
Table 9.32 Blue Bird Corporation Revenue and AGR, 2016 - 2020 (USD Million & %)
Table 9.33 Volvo Car Corporation (Company Details)
Table 9.34 Volvo Car Corporation Battery Electric Vehicle (BEV) Product Portfolio
Table 9.35 Volvo Car Corporation Revenue and AGR, 2016 - 2019 (USD Million & %)
Table 9.36 Volvo Car Corporation (Company Details)
Table 9.37 Kia Corporation Battery Electric Vehicle (BEV) Product Portfolio
Table 9.38 Kia Corporation Revenue and AGR, 2016 - 2019 (USD Million & %)
Table 9.39 General Motors Company (Company Details)
Table 9.40 General Motors Company Battery Electric Vehicle (BEV) Product Portfolio
Table 9.41 General Motors Company Revenue and AGR, 2016 - 2019 (USD Million & %)
Table 9.42 Audi AG (Company Details)
Table 9.43 Audi AG Battery Electric Vehicle (BEV) Product Portfolio
Table 9.44 Audi AG Revenue and AGR, 2016 - 2019 (USD Million & %)
Table 9.45 Hyundai Motor Company (Company Details)
Table 9.46 Hyundai Motor Company Battery Electric Vehicle (BEV) Product Portfolio
Table 9.47 Hyundai Motor Company Revenue and AGR, 2016 - 2019 (USD Million & %)
Table 9.48 Tata Motors Limited (Company Details)
Table 9.49 Tata Motors Limited Battery Electric Vehicle (BEV) Product Portfolio
Table 9.50 Tata Motors Limited Revenue and AGR, 2016 - 2019 (USD Million & %)
Table 9.51 Porsche AG (Company Details)
Table 9.52 Porsche AG Battery Electric Vehicle (BEV) Product Portfolio
Table 9.53 Porsche AG Revenue and AGR, 2016 - 2019 (USD Million & %)
Table 9.54 Ford Motor Company (Company Details)
Table 9.55 Ford Motor Company Battery Electric Vehicle (BEV) Product Portfolio
Table 9.56 Ford Motor Company Revenue and AGR, 2016 - 2019 (USD Million & %)
Table 9.57 Polestar AB (Company Details)
Table 9.58 Polestar AB Battery Electric Vehicle (BEV) Product Portfolio
List of Figures
Figure 2.1 Market Segmentation of Global Battery Electric Vehicle (BEV) Market
Figure 3.1 How Do BEVs Work?
Figure 3.2 The Three Stages of Electric Vehicle Battery Production
Figure 3.3 Global Battery Electric Vehicle (BEV) Market – Value Chain Analysis
Figure: 3.4 Volume-weighted Average Price of Battery Packs for Electric Vehicles ($/kWh)
Figure: 3.5 EV Battery Cost Breakdown (Total Costs)
Figure: 3.6 EV Battery Cost Breakdown (Materials Breakdown)
Figure 4.1 Global Battery Electric Vehicle (BEV) Market Revenue Analysis & Forecast 2021-2031, (US$Mn, AGR %) (Pre COVID)
Figure 4.2 Global Battery Electric Vehicle (BEV) Market Volume Analysis & Forecast 2021-2031, (Thousand Units, AGR %) (Pre COVID)
Figure 4.3 Global Battery Electric Vehicle (BEV) Market Revenue Analysis & Forecast 2021-2031, (US$Mn, AGR %) (V Shaped Recovery)
Figure 4.4 Global Battery Electric Vehicle (BEV) Market Volume Analysis & Forecast 2021-2031, (Thousand Units, AGR %) (V Shaped Recovery)
Figure 4.5 Global Battery Electric Vehicle (BEV) Market Revenue Analysis & Forecast 2021-2031, (US$Mn, AGR %) (U Shaped Recovery)
Figure 4.6 Global Battery Electric Vehicle (BEV) Market Volume Analysis & Forecast 2021-2031, (Thousand Units, AGR %) (U Shaped Recovery)
Figure 4.7 Global Battery Electric Vehicle (BEV) Market Revenue Analysis & Forecast 2021-2031, (US$Mn, AGR %) (L Shaped Recovery)
Figure 4.8 Global Battery Electric Vehicle (BEV) Market Volume Analysis & Forecast 2021-2031, (Thousand Units, AGR %) (L Shaped Recovery)
Figure 4.9 Global Battery Electric Vehicle (BEV) Market Revenue Analysis & Forecast 2021-2031, (US$Mn, AGR %) (W Shaped Recovery)
Figure 4.10 Global Battery Electric Vehicle (BEV) Market Volume Analysis & Forecast 2021-2031, (Thousand Units, AGR %) (W Shaped Recovery)
Figure 5.1 Global Battery Electric Vehicle (BEV) Market Drivers & Restraints 2021
Figure 5.2 Five Forces Analysis of Global Battery Electric Vehicle (BEV) Market 2021-2031
Figure 6.1 Global Battery Electric Vehicle (BEV) Market Revenue by Vehicle Type Forecast 2021-2031, (US$Mn, AGR %) (Pre COVID)
Figure 6.2 Global Battery Electric Vehicle (BEV) Market by Vehicle Type Revenue Share Forecast 2020, 2026, 2031 (%) (Pre COVID)
Figure 6.3 Global Battery Electric Vehicle (BEV) Market Volume by Vehicle Type Forecast 2021-2031, (Thousand Units, AGR %) (Pre COVID)
Figure 6.4 Global Battery Electric Vehicle (BEV) Market by Vehicle Type Volume Share Forecast 2020, 2026, 2031 (%) (Pre COVID)
Figure 6.5 Global Battery Electric Vehicle (BEV) Market Revenue by Vehicle Type Forecast 2021-2031, (US$Mn, AGR %) (V Shaped Recovery)
Figure 6.6 Global Battery Electric Vehicle (BEV) Market Volume by Vehicle Type Forecast 2021-2031, (Thousand Units, AGR %) (V Shaped Recovery)
Figure 6.7 Global Battery Electric Vehicle (BEV) Market Revenue by Vehicle Type Forecast 2021-2031, (US$Mn, AGR %) (U Shaped Recovery)
Figure 6.8 Global Battery Electric Vehicle (BEV) Market Volume by Vehicle Type Forecast 2021-2031, (Thousand Units, AGR %) (U Shaped Recovery)
Figure 6.9 Global Battery Electric Vehicle (BEV) Market Revenue by Vehicle Type Forecast 2021-2031, (US$Mn, AGR %) (L Shaped Recovery)
Figure 6.10 Global Battery Electric Vehicle (BEV) Market Volume by Vehicle Type Forecast 2021-2031, (Thousand Units, AGR %) (L Shaped Recovery)
Figure 6.11 Global Battery Electric Vehicle (BEV) Market Revenue by Vehicle Type Forecast 2021-2031, (US$Mn, AGR %) (W Shaped Recovery)
Figure 6.12 Global Battery Electric Vehicle (BEV) Market Volume by Vehicle Type Forecast 2021-2031, (Thousand Units, AGR %) (W Shaped Recovery)
Figure 6.13 Global Battery Electric Passenger Vehicles Market Revenue by Region Forecast 2021-2031, (US$Mn, AGR %) (Pre COVID)
Figure 6.14 Global Battery Electric Passenger Vehicles Market by Region Revenue Share Forecast 2020, 2026, 2031 (%) (Pre COVID)
Figure 6.15 Global Battery Electric Passenger Vehicles Market Volume by Region Forecast 2021-2031, (Thousand Units, AGR %) (Pre COVID)
Figure 6.16 Global Battery Electric Passenger Vehicles Market by Region Volume Share Forecast 2020, 2026, 2031 (%) (Pre COVID)
Figure 6.17 Global Battery Electric Passenger Vehicles Market Revenue by Region Forecast 2021-2031, (US$Mn, AGR %) (V Shaped Recovery)
Figure 6.18 Global Battery Electric Passenger Vehicles Market Volume by Region Forecast 2021-2031, (Thousand Units, AGR %) (V Shaped Recovery)
Figure 6.19 Global Battery Electric Passenger Vehicles Market Revenue by Region Forecast 2021-2031, (US$Mn, AGR %) (U Shaped Recovery)
Figure 6.20 Global Battery Electric Passenger Vehicles Market Volume by Region Forecast 2021-2031, (Thousand Units, AGR %) (U Shaped Recovery)
Figure 6.21 Global Battery Electric Passenger Vehicles Market Revenue by Region Forecast 2021-2031, (US$Mn, AGR %) (L Shaped Recovery)
Figure 6.22 Global Battery Electric Passenger Vehicles Market Volume by Region Forecast 2021-2031, (Thousand Units, AGR %) (L Shaped Recovery)
Figure 6.23 Global Battery Electric Passenger Vehicles Market Revenue by Region Forecast 2021-2031, (US$Mn, AGR %) (W Shaped Recovery)
Figure 6.24 Global Battery Electric Passenger Vehicles Market Volume by Region Forecast 2021-2031, (Thousand Units, AGR %) (W Shaped Recovery)
Figure 6.25 Global Battery Electric Light Commercial Vehicles Market Revenue by Region Forecast 2021-2031, (US$Mn, AGR %) (Pre COVID)
Figure 6.26 Global Battery Electric Light Commercial Vehicles Market by Region Revenue Share Forecast 2020, 2026, 2031 (%) (Pre COVID)
Figure 6.27 Global Battery Electric Light Commercial Vehicles Market Volume by Region Forecast 2021-2031, (Thousand Units, AGR %) (Pre COVID)
Figure 6.28 Global Battery Electric Light Commercial Vehicles Market by Region Volume Share Forecast 2020, 2026, 2031 (%) (Pre COVID)
Figure 6.29 Global Battery Electric Light Commercial Vehicles Market Revenue by Region Forecast 2021-2031, (US$Mn, AGR %) (V Shaped Recovery)
Figure 6.30 Global Battery Electric Light Commercial Vehicles Market Volume by Region Forecast 2021-2031, (Thousand Units, AGR %) (V Shaped Recovery)
Figure 6.31 Global Battery Electric Light Commercial Vehicles Market Revenue by Region Forecast 2021-2031, (US$Mn, AGR %) (U Shaped Recovery)
Figure 6.32 Global Battery Electric Light Commercial Vehicles Market Volume by Region Forecast 2021-2031, (Thousand Units, AGR %) (U Shaped Recovery)
Figure 6.33 Global Battery Electric Light Commercial Vehicles Market Revenue by Region Forecast 2021-2031, (US$Mn, AGR %) (L Shaped Recovery)
Figure 6.34 Global Battery Electric Light Commercial Vehicles Market Volume by Region Forecast 2021-2031, (Thousand Units, AGR %) (L Shaped Recovery)
Figure 6.35 Global Battery Electric Light Commercial Vehicles Market Revenue by Region Forecast 2021-2031, (US$Mn, AGR %) (W Shaped Recovery)
Figure 6.36 Global Battery Electric Light Commercial Vehicles Market Volume by Region Forecast 2021-2031, (Thousand Units, AGR %) (W Shaped Recovery)
Figure 6.37 Global Battery Electric Heavy Commercial Vehicles Market Revenue by Region Forecast 2021-2031, (US$Mn, AGR %) (Pre COVID)
Figure 6.38 Global Battery Electric Heavy Commercial Vehicles Market by Region Revenue Share Forecast 2020, 2026, 2031 (%) (Pre COVID)
Figure 6.39 Global Battery Electric Heavy Commercial Vehicles Market Volume by Region Forecast 2021-2031, (Thousand Units, AGR %) (Pre COVID)
Figure 6.40 Global Battery Electric Heavy Commercial Vehicles Market by Region Volume Share Forecast 2020, 2026, 2031 (%) (Pre COVID)
Figure 6.41 Global Battery Electric Heavy Commercial Vehicles Market Revenue by Region Forecast 2021-2031, (US$Mn, AGR %) (V Shaped Recovery)
Figure 6.42 Global Battery Electric Heavy Commercial Vehicles Market Volume by Region Forecast 2021-2031, (Thousand Units, AGR %) (V Shaped Recovery)
Figure 6.43 Global Battery Electric Heavy Commercial Vehicles Market Revenue by Region Forecast 2021-2031, (US$Mn, AGR %) (U Shaped Recovery)
Figure 6.44 Global Battery Electric Heavy Commercial Vehicles Market Volume by Region Forecast 2021-2031, (Thousand Units, AGR %) (U Shaped Recovery)
Figure 6.45 Global Battery Electric Heavy Commercial Vehicles Market Revenue by Region Forecast 2021-2031, (US$Mn, AGR %) (L Shaped Recovery)
Figure 6.46 Global Battery Electric Heavy Commercial Vehicles Market Volume by Region Forecast 2021-2031, (Thousand Units, AGR %) (L Shaped Recovery)
Figure 6.47 Global Battery Electric Heavy Commercial Vehicles Market Revenue by Region Forecast 2021-2031, (US$Mn, AGR %) (W Shaped Recovery)
Figure 6.48 Global Battery Electric Heavy Commercial Vehicles Market Volume by Region Forecast 2021-2031, (Thousand Units, AGR %) (W Shaped Recovery)
Figure 7.1 Global Battery Electric Vehicle (BEV) Market Revenue by Battery Type Forecast 2021-2031, (US$Mn, AGR %) (Pre COVID)
Figure 7.2 Global Battery Electric Vehicle (BEV) Market by Battery Type Revenue Share Forecast 2020, 2026, 2031 (%) (Pre COVID)
Figure 7.3 Global Battery Electric Vehicle (BEV) Market Revenue by Battery Type Forecast 2021-2031, (US$Mn, AGR %) (V Shaped Recovery)
Figure 7.4 Global Battery Electric Vehicle (BEV) Market Revenue by Battery Type Forecast 2021-2031, (US$Mn, AGR %) (U Shaped Recovery)
Figure 7.5 Global Battery Electric Vehicle (BEV) Market Revenue by Battery Type Forecast 2021-2031, (US$Mn, AGR %) (L Shaped Recovery)
Figure 7.6 Global Battery Electric Vehicle (BEV) Market Revenue by Battery Type Forecast 2021-2031, (US$Mn, AGR %) (W Shaped Recovery)
Figure 8.1 Global Battery Electric Vehicle (BEV) Market Revenue by Region Forecast 2021-2031, (US$Mn, AGR %) (Pre COVID)
Figure 8.2 Global Battery Electric Vehicle (BEV) Market by Region Revenue Share Forecast 2020, 2026, 2031 (%) (Pre COVID)
Figure 8.3 Global Battery Electric Vehicle (BEV) Market Volume by Region Forecast 2021-2031, (Thousand Units, AGR %) (Pre COVID)
Figure 8.4 Global Battery Electric Vehicle (BEV) Market by Region Volume Share Forecast 2020, 2026, 2031 (%) (Pre COVID)
Figure 8.5 North America Battery Electric Vehicle (BEV) Market Revenue, Forecast 2021-2031 (US$Mn, AGR %) (Pre COVID)
Figure 8.6 North America Battery Electric Vehicle (BEV) Market Volume, Forecast 2021-2031 (Thousand Units, AGR %) (Pre COVID)
Figure 8.7 North America Battery Electric Vehicle (BEV) Market Revenue, Forecast 2021-2031 (US$Mn, AGR %) (V Shaped Recovery)
Figure 8.8 North America Battery Electric Vehicle (BEV) Market Volume, Forecast 2021-2031 (Thousand Units, AGR %) (V Shaped Recovery)
Figure 8.9 North America Battery Electric Vehicle (BEV) Market Revenue, Forecast 2021-2031 (US$Mn, AGR %) (U Shaped Recovery)
Figure 8.10 North America Battery Electric Vehicle (BEV) Market Volume, Forecast 2021-2031 (Thousand Units, AGR %) (U Shaped Recovery)
Figure 8.11 North America Battery Electric Vehicle (BEV) Market Revenue, Forecast 2021-2031 (US$Mn, AGR %) (L Shaped Recovery)
Figure 8.12 North America Battery Electric Vehicle (BEV) Market Volume, Forecast 2021-2031 (Thousand Units, AGR %) (L Shaped Recovery)
Figure 8.13 North America Battery Electric Vehicle (BEV) Market Revenue, Forecast 2021-2031 (US$Mn, AGR %) (W Shaped Recovery)
Figure 8.14 North America Battery Electric Vehicle (BEV) Market Volume, Forecast 2021-2031 (Thousand Units, AGR %) (W Shaped Recovery)
Figure 8.15 North America Battery Electric Vehicle (BEV) Market Revenue by Vehicle Type Forecast 2021-2031, (US$Mn, AGR %) (Pre COVID)
Figure 8.16 North America Battery Electric Vehicle (BEV) Market by Vehicle Type Revenue Share Forecast 2020, 2026, 2031 (%) (Pre COVID)
Figure 8.17 North America Battery Electric Vehicle (BEV) Market Volume by Vehicle Type Forecast 2021-2031, (Thousand Units, AGR %) (Pre COVID)
Figure 8.18 North America Battery Electric Vehicle (BEV) Market by Vehicle Type Volume Share Forecast 2020, 2026, 2031 (%) (Pre COVID)
Figure 8.19 North America Battery Electric Vehicle (BEV) Market Revenue by Vehicle Type Forecast 2021-2031, (US$Mn, AGR %) (V Shaped Recovery)
Figure 8.20 North America Battery Electric Vehicle (BEV) Market Volume by Vehicle Type Forecast 2021-2031, (Thousand Units, AGR %) (V Shaped Recovery)
Figure 8.21 North America Battery Electric Vehicle (BEV) Market Revenue by Vehicle Type Forecast 2021-2031, (US$Mn, AGR %) (U Shaped Recovery)
Figure 8.22 North America Battery Electric Vehicle (BEV) Market Volume by Vehicle Type Forecast 2021-2031, (Thousand Units, AGR %) (U Shaped Recovery)
Figure 8.23 North America Battery Electric Vehicle (BEV) Market Revenue by Vehicle Type Forecast 2021-2031, (US$Mn, AGR %) (L Shaped Recovery)
Figure 8.24 North America Battery Electric Vehicle (BEV) Market Volume by Vehicle Type Forecast 2021-2031, (Thousand Units, AGR %) (L Shaped Recovery)
Figure 8.25 North America Battery Electric Vehicle (BEV) Market Revenue by Vehicle Type Forecast 2021-2031, (US$Mn, AGR %) (W Shaped Recovery)
Figure 8.26 North America Battery Electric Vehicle (BEV) Market Volume by Vehicle Type Forecast 2021-2031, (Thousand Units, AGR %) (L Shaped Recovery)
Figure 8.27 North America Battery Electric Vehicle (BEV) Market Revenue by Battery Type Forecast 2021-2031, (US$Mn, AGR %) (Pre COVID)
Figure 8.28 North America Battery Electric Vehicle (BEV) Market by Battery Type Revenue Share Forecast 2020, 2026, 2031 (%) (Pre COVID)
Figure 8.29 North America Battery Electric Vehicle (BEV) Market Revenue by Battery Type Forecast 2021-2031, (US$Mn, AGR %) (V Shaped Recovery)
Figure 8.30 North America Battery Electric Vehicle (BEV) Market Revenue by Battery Type Forecast 2021-2031, (US$Mn, AGR %) (U Shaped Recovery)
Figure 8.31 North America Battery Electric Vehicle (BEV) Market Revenue by Battery Type Forecast 2021-2031, (US$Mn, AGR %) (L Shaped Recovery)
Figure 8.32 North America Battery Electric Vehicle (BEV) Market Revenue by Battery Type Forecast 2021-2031, (US$Mn, AGR %) (W Shaped Recovery)
Figure 8.33 North America Battery Electric Vehicle (BEV) Market Revenue by Country Forecast 2021-2031, (US$Mn, AGR %) (Pre COVID)
Figure 8.34 North America Battery Electric Vehicle (BEV) Market by Country Revenue Share Forecast 2020, 2026, 2031 (%) (Pre COVID)
Figure 8.35 North America Battery Electric Vehicle (BEV) Market Volume by Country Forecast 2021-2031, (Thousand Units, AGR %) (Pre COVID)
Figure 8.36 North America Battery Electric Vehicle (BEV) Market by Country Volume Share Forecast 2020, 2026, 2031 (%) (Pre COVID)
Figure 8.37 North America Battery Electric Vehicle (BEV) Market Revenue by Country Forecast 2021-2031, (US$Mn, AGR %) (V Shaped Recovery)
Figure 8.38 North America Battery Electric Vehicle (BEV) Market Volume by Country Forecast 2021-2031, (Thousand Units, AGR %) (V Shaped Recovery)
Figure 8.39 North America Battery Electric Vehicle (BEV) Market Revenue by Country Forecast 2021-2031, (US$Mn, AGR %) (U Shaped Recovery)
Figure 8.40 North America Battery Electric Vehicle (BEV) Market Volume by Country Forecast 2021-2031, (Thousand Units, AGR %) (U Shaped Recovery)
Figure 8.41 North America Battery Electric Vehicle (BEV) Market Revenue by Country Forecast 2021-2031, (US$Mn, AGR %) (L Shaped Recovery)
Figure 8.42 North America Battery Electric Vehicle (BEV) Market Volume by Country Forecast 2021-2031, (Thousand Units, AGR %) (U Shaped Recovery)
Figure 8.43 North America Battery Electric Vehicle (BEV) Market Revenue by Country Forecast 2021-2031, (US$Mn, AGR %) (W Shaped Recovery)
Figure 8.44 North America Battery Electric Vehicle (BEV) Market Volume by Country Forecast 2021-2031, (Thousand Units, AGR %) (W Shaped Recovery)
Figure 8.45 US Private and Public Electric Vehicle Chargers, 2019
Figure 8.46 US Battery Electric Vehicle (BEV) Market Revenue by Vehicle Type Forecast 2021-2031, (US$Mn, AGR %) (Pre COVID)
Figure 8.47 US Battery Electric Vehicle (BEV) Market Volume by Vehicle Type Forecast 2021-2031, (Thousand Units, AGR %) (Pre COVID)
Figure 8.48 US Battery Electric Vehicle (BEV) Market Revenue by Vehicle Type Forecast 2021-2031, (US$Mn, AGR %) (V Shaped Recovery)
Figure 8.49 US Battery Electric Vehicle (BEV) Market Volume by Vehicle Type Forecast 2021-2031, (Thousand Units, AGR %) (V Shaped Recovery)
Figure 8.50 US Battery Electric Vehicle (BEV) Market Revenue by Vehicle Type Forecast 2021-2031, (US$Mn, AGR %) (U Shaped Recovery)
Figure 8.51 US Battery Electric Vehicle (BEV) Market Volume by Vehicle Type Forecast 2021-2031, (Thousand Units, AGR %) (U Shaped Recovery)
Figure 8.52 US Battery Electric Vehicle (BEV) Market Revenue by Vehicle Type Forecast 2021-2031, (US$Mn, AGR %) (L Shaped Recovery)
Figure 8.53 US Battery Electric Vehicle (BEV) Market Volume by Vehicle Type Forecast 2021-2031, (Thousand Units, AGR %) (L Shaped Recovery)
Figure 8.54 US Battery Electric Vehicle (BEV) Market Revenue by Vehicle Type Forecast 2021-2031, (US$Mn, AGR %) (W Shaped Recovery)
Figure 8.55 US Battery Electric Vehicle (BEV) Market Volume by Vehicle Type Forecast 2021-2031, (Thousand Units, AGR %) (W Shaped Recovery)
Figure 8.56 US Battery Electric Vehicle (BEV) Market Revenue by Battery Type Forecast 2021-2031, (US$Mn, AGR %) (Pre COVID)
Figure 8.57 US Battery Electric Vehicle (BEV) Market Revenue by Battery Type Forecast 2021-2031, (US$Mn, AGR %) (V Shaped Recovery)
Figure 8.58 US Battery Electric Vehicle (BEV) Market Revenue by Battery Type Forecast 2021-2031, (US$Mn, AGR %) (U Shaped Recovery)
Figure 8.59 US Battery Electric Vehicle (BEV) Market Revenue by Battery Type Forecast 2021-2031, (US$Mn, AGR %) (L Shaped Recovery)
Figure 8.60 US Battery Electric Vehicle (BEV) Market Revenue by Battery Type Forecast 2021-2031, (US$Mn, AGR %) (W Shaped Recovery)
Figure 8.61 Canada Battery Electric Vehicle (BEV) Market Revenue by Vehicle Type Forecast 2021-2031, (US$Mn, AGR %) (Pre COVID)
Figure 8.62 Canada Battery Electric Vehicle (BEV) Market Volume by Vehicle Type Forecast 2021-2031, (Thousand Units, AGR %) (Pre COVID)
Figure 8.63 Canada Battery Electric Vehicle (BEV) Market Revenue by Vehicle Type Forecast 2021-2031, (US$Mn, AGR %) (V Shaped Recovery)
Figure 8.64 Canada Battery Electric Vehicle (BEV) Market Volume by Vehicle Type Forecast 2021-2031, (Thousand Units, AGR %) (V Shaped Recovery)
Figure 8.65 Canada Battery Electric Vehicle (BEV) Market Revenue by Vehicle Type Forecast 2021-2031, (US$Mn, AGR %) (U Shaped Recovery)
Figure 8.66 Canada Battery Electric Vehicle (BEV) Market Volume by Vehicle Type Forecast 2021-2031, (Thousand Units, AGR %) (U Shaped Recovery)
Figure 8.67 Canada Battery Electric Vehicle (BEV) Market Revenue by Vehicle Type Forecast 2021-2031, (US$Mn, AGR %) (L Shaped Recovery)
Figure 8.68 Canada Battery Electric Vehicle (BEV) Market Volume by Vehicle Type Forecast 2021-2031, (Thousand Units, AGR %) (L Shaped Recovery)
Figure 8.69 Canada Battery Electric Vehicle (BEV) Market Revenue by Vehicle Type Forecast 2021-2031, (US$Mn, AGR %) (W Shaped Recovery)
Figure 8.70 Canada Battery Electric Vehicle (BEV) Market Volume by Vehicle Type Forecast 2021-2031, (Thousand Units, AGR %) (W Shaped Recovery)
Figure 8.71 Canada Battery Electric Vehicle (BEV) Market Revenue by Battery Type Forecast 2021-2031, (US$Mn, AGR %) (Pre COVID)
Figure 8.72 Canada Battery Electric Vehicle (BEV) Market Revenue by Battery Type Forecast 2021-2031, (US$Mn, AGR %) (V Shaped Recovery)
Figure 8.73 Canada Battery Electric Vehicle (BEV) Market Revenue by Battery Type Forecast 2021-2031, (US$Mn, AGR %) (U Shaped Recovery)
Figure 8.74 Canada Battery Electric Vehicle (BEV) Market Revenue by Battery Type Forecast 2021-2031, (US$Mn, AGR %) (L Shaped Recovery)
Figure 8.75 Canada Battery Electric Vehicle (BEV) Market Revenue by Battery Type Forecast 2021-2031, (US$Mn, AGR %) (W Shaped Recovery)
Figure 8.76 Mexico Battery Electric Vehicle (BEV) Market Revenue by Vehicle Type Forecast 2021-2031, (US$Mn, AGR %) (Pre COVID)
Figure 8.77 Mexico Battery Electric Vehicle (BEV) Market Volume by Vehicle Type Forecast 2021-2031, (Thousand Units, AGR %) (Pre COVID)
Figure 8.78 Mexico Battery Electric Vehicle (BEV) Market Revenue by Vehicle Type Forecast 2021-2031, (US$Mn, AGR %) (V Shaped Recovery)
Figure 8.79 Mexico Battery Electric Vehicle (BEV) Market Volume by Vehicle Type Forecast 2021-2031, (Thousand Units, AGR %) (V Shaped Recovery)
Figure 8.80 Mexico Battery Electric Vehicle (BEV) Market Revenue by Vehicle Type Forecast 2021-2031, (US$Mn, AGR %) (U Shaped Recovery)
Figure 8.81 Mexico Battery Electric Vehicle (BEV) Market Volume by Vehicle Type Forecast 2021-2031, (Thousand Units, AGR %) (U Shaped Recovery)
Figure 8.82 Mexico Battery Electric Vehicle (BEV) Market Revenue by Vehicle Type Forecast 2021-2031, (US$Mn, AGR %) (L Shaped Recovery)
Figure 8.83 Mexico Battery Electric Vehicle (BEV) Market Volume by Vehicle Type Forecast 2021-2031, (Thousand Units, AGR %) (L Shaped Recovery)
Figure 8.84 Mexico Battery Electric Vehicle (BEV) Market Revenue by Vehicle Type Forecast 2021-2031, (US$Mn, AGR %) (W Shaped Recovery)
Figure 8.85 Mexico Battery Electric Vehicle (BEV) Market Volume by Vehicle Type Forecast 2021-2031, (Thousand Units, AGR %) (W Shaped Recovery)
Figure 8.86 Europe Battery Electric Vehicle (BEV) Market Revenue, Forecast 2021-2031 (US$Mn, AGR %) (Pre COVID)
Figure 8.87 Europe Battery Electric Vehicle (BEV) Market Volume, Forecast 2021-2031 (Thousand Units, AGR %) (Pre COVID)
Figure 8.88 Europe Battery Electric Vehicle (BEV) Market Revenue, Forecast 2021-2031 (US$Mn, AGR %) (V Shaped Recovery)
Figure 8.89 Europe Battery Electric Vehicle (BEV) Market Volume, Forecast 2021-2031 (Thousand Units, AGR %) (V Shaped Recovery)
Figure 8.90 Europe Battery Electric Vehicle (BEV) Market Revenue, Forecast 2021-2031 (US$Mn, AGR %) (U Shaped Recovery)
Figure 8.91 Europe Battery Electric Vehicle (BEV) Market Volume, Forecast 2021-2031 (Thousand Units, AGR %) (U Shaped Recovery)
Figure 8.92 Europe Battery Electric Vehicle (BEV) Market Revenue, Forecast 2021-2031 (US$Mn, AGR %) (L Shaped Recovery)
Figure 8.93 Europe Battery Electric Vehicle (BEV) Market Volume, Forecast 2021-2031 (Thousand Units, AGR %) (L Shaped Recovery)
Figure 8.94 Europe Battery Electric Vehicle (BEV) Market Revenue, Forecast 2021-2031 (US$Mn, AGR %) (W Shaped Recovery)
Figure 8.95 Europe Battery Electric Vehicle (BEV) Market Volume, Forecast 2021-2031 (Thousand Units, AGR %) (W Shaped Recovery)
Figure 8.96 Europe Battery Electric Vehicle (BEV) Market Revenue by Vehicle Type Forecast 2021-2031, (US$Mn, AGR %) (Pre COVID)
Figure 8.97 Europe Battery Electric Vehicle (BEV) Market by Vehicle Type Revenue Share Forecast 2020, 2026, 2031 (%) (Pre COVID)
Figure 8.98 Europe Battery Electric Vehicle (BEV) Market Volume by Vehicle Type Forecast 2021-2031, (Thousand Units, AGR %) (Pre COVID)
Figure 8.99 Europe Battery Electric Vehicle (BEV) Market by Vehicle Type Volume Share Forecast 2020, 2026, 2031 (%) (Pre COVID)
Figure 8.100 Europe Battery Electric Vehicle (BEV) Market Revenue by Vehicle Type Forecast 2021-2031, (US$Mn, AGR %) (V Shaped Recovery)
Figure 8.101 Europe Battery Electric Vehicle (BEV) Market Volume by Vehicle Type Forecast 2021-2031, (Thousand Units, AGR %) (V Shaped Recovery)
Figure 8.102 Europe Battery Electric Vehicle (BEV) Market Revenue by Vehicle Type Forecast 2021-2031, (US$Mn, AGR %) (U Shaped Recovery)
Figure 8.103 Europe Battery Electric Vehicle (BEV) Market Volume by Vehicle Type Forecast 2021-2031, (Thousand Units, AGR %) (U Shaped Recovery)
Figure 8.104 Europe Battery Electric Vehicle (BEV) Market Revenue by Vehicle Type Forecast 2021-2031, (US$Mn, AGR %) (L Shaped Recovery)
Figure 8.105 Europe Battery Electric Vehicle (BEV) Market Volume by Vehicle Type Forecast 2021-2031, (Thousand Units, AGR %) (L Shaped Recovery)
Figure 8.106 Europe Battery Electric Vehicle (BEV) Market Revenue by Vehicle Type Forecast 2021-2031, (US$Mn, AGR %) (W Shaped Recovery)
Figure 8.107 Europe Battery Electric Vehicle (BEV) Market Volume by Vehicle Type Forecast 2021-2031, (Thousand Units, AGR %) (W Shaped Recovery)
Figure 8.108 Europe Battery Electric Vehicle (BEV) Market Revenue by Battery Type Forecast 2021-2031, (US$Mn, AGR %) (Pre COVID)
Figure 8.109 Europe Battery Electric Vehicle (BEV) Market by Battery Type Revenue Share Forecast 2020, 2026, 2031 (%) (Pre COVID)
Figure 8.110 Europe Battery Electric Vehicle (BEV) Market Revenue by Battery Type Forecast 2021-2031, (US$Mn, AGR %) (V Shaped Recovery)
Figure 8.111 Europe Battery Electric Vehicle (BEV) Market Revenue by Battery Type Forecast 2021-2031, (US$Mn, AGR %) (U Shaped Recovery)
Figure 8.112 Europe Battery Electric Vehicle (BEV) Market Revenue by Battery Type Forecast 2021-2031, (US$Mn, AGR %) (L Shaped Recovery)
Figure 8.113 Europe Battery Electric Vehicle (BEV) Market Revenue by Battery Type Forecast 2021-2031, (US$Mn, AGR %) (W Shaped Recovery)
Figure 8.114 Europe Battery Electric Vehicle (BEV) Market Revenue by Country Forecast 2021-2031, (US$Mn, AGR %) (Pre COVID)
Figure 8.115 Europe Battery Electric Vehicle (BEV) Market by Country Revenue Share Forecast 2020, 2026, 2031 (%) (Pre COVID)
Figure 8.116 Europe Battery Electric Vehicle (BEV) Market Volume by Country Forecast 2021-2031, (Thousand Units, AGR %) (Pre COVID)
Figure 8.117 Europe Battery Electric Vehicle (BEV) Market by Country Volume Share Forecast 2020, 2026, 2031 (%) (Pre COVID)
Figure 8.118 Germany Battery Electric Vehicle (BEV) Market Revenue by Vehicle Type Forecast 2021-2031, (US$Mn, AGR %) (Pre COVID)
Figure 8.119 Germany Battery Electric Vehicle (BEV) Market Volume by Vehicle Type Forecast 2021-2031, (Thousand Units, AGR %) (Pre COVID)
Figure 8.120 Germany Battery Electric Vehicle (BEV) Market
Revenue by Vehicle Type Forecast 2021-2031, (US$Mn, AGR %) (V Shaped Recovery)
Figure 8.121 Germany Battery Electric Vehicle (BEV) Market Volume by Vehicle Type Forecast 2021-2031, (Thousand Units, AGR %) (V Shaped Recovery)
Figure 8.122 Germany Battery Electric Vehicle (BEV) Market Revenue by Vehicle Type Forecast 2021-2031, (US$Mn, AGR %) (U Shaped Recovery)
Figure 8.123 Germany Battery Electric Vehicle (BEV) Market Volume by Vehicle Type Forecast 2021-2031, (Thousand Units, AGR %) (U Shaped Recovery)
Figure 8.124 Germany Battery Electric Vehicle (BEV) Market Revenue by Vehicle Type Forecast 2021-2031, (US$Mn, AGR %) (L Shaped Recovery)
Figure 8.125 Germany Battery Electric Vehicle (BEV) Market Volume by Vehicle Type Forecast 2021-2031, (Thousand Units, AGR %) (L Shaped Recovery)
Figure 8.126 Germany Battery Electric Vehicle (BEV) Market Revenue by Vehicle Type Forecast 2021-2031, (US$Mn, AGR %) (W Shaped Recovery)
Figure 8.127 Germany Battery Electric Vehicle (BEV) Market Volume by Vehicle Type Forecast 2021-2031, (Thousand Units, AGR %) (W Shaped Recovery)
Figure 8.128 Norway Battery Electric Cars New Registrations, January 2018 – December 2019 (Units)
Figure 8.129 Norway Battery Electric Vehicle (BEV) Market Revenue by Vehicle Type Forecast 2021-2031, (US$Mn, AGR %) (Pre COVID)
Figure 8.130 Norway Battery Electric Vehicle (BEV) Market Volume by Vehicle Type Forecast 2021-2031, (Thousand Units, AGR %) (Pre COVID)
Figure 8.131 Norway Battery Electric Vehicle (BEV) Market Revenue by Vehicle Type Forecast 2021-2031, (US$Mn, AGR %) (V Shaped Recovery)
Figure 8.132 Norway Battery Electric Vehicle (BEV) Market Volume by Vehicle Type Forecast 2021-2031, (Thousand Units, AGR %) (V Shaped Recovery)
Figure 8.133 Norway Battery Electric Vehicle (BEV) Market Revenue by Vehicle Type Forecast 2021-2031, (US$Mn, AGR %) (U Shaped Recovery)
Figure 8.134 Norway Battery Electric Vehicle (BEV) Market Volume by Vehicle Type Forecast 2021-2031, (Thousand Units, AGR %) (U Shaped Recovery)
Figure 8.135 Norway Battery Electric Vehicle (BEV) Market Revenue by Vehicle Type Forecast 2021-2031, (US$Mn, AGR %) (L Shaped Recovery)
Figure 8.136 Norway Battery Electric Vehicle (BEV) Market Volume by Vehicle Type Forecast 2021-2031, (Thousand Units, AGR %) (L Shaped Recovery)
Figure 8.137 Norway Battery Electric Vehicle (BEV) Market Revenue by Vehicle Type Forecast 2021-2031, (US$Mn, AGR %) (W Shaped Recovery)
Figure 8.138 Norway Battery Electric Vehicle (BEV) Market Volume by Vehicle Type Forecast 2021-2031, (Thousand Units, AGR %) (W Shaped Recovery)
Figure 8.139 Four-year private vehicle ownership costs in the Netherlands.
Figure 8.139 Netherlands Battery Electric Vehicle (BEV) Market Revenue by Vehicle Type Forecast 2021-2031, (US$Mn, AGR %) (Pre COVID)
Figure 8.140 Netherlands Battery Electric Vehicle (BEV) Market Volume by Vehicle Type Forecast 2021-2031, (Thousand Units, AGR %) (Pre COVID)
Figure 8.141 Netherlands Battery Electric Vehicle (BEV) Market Revenue by Vehicle Type Forecast 2021-2031, (US$Mn, AGR %) (V Shaped Recovery)
Figure 8.142 Netherlands Battery Electric Vehicle (BEV) Market Volume by Vehicle Type Forecast 2021-2031, (Thousand Units, AGR %) (V Shaped Recovery)
Figure 8.143 Netherlands Battery Electric Vehicle (BEV) Market Revenue by Vehicle Type Forecast 2021-2031, (US$Mn, AGR %) (U Shaped Recovery)
Figure 8.144 Netherlands Battery Electric Vehicle (BEV) Market Volume by Vehicle Type Forecast 2021-2031, (Thousand Units, AGR %) (U Shaped Recovery)
Figure 8.145 Netherlands Battery Electric Vehicle (BEV) Market Revenue by Vehicle Type Forecast 2021-2031, (US$Mn, AGR %) (L Shaped Recovery)
Figure 8.146 Netherlands Battery Electric Vehicle (BEV) Market Volume by Vehicle Type Forecast 2021-2031, (Thousand Units, AGR %) (L Shaped Recovery)
Figure 8.147 Netherlands Battery Electric Vehicle (BEV) Market Revenue by Vehicle Type Forecast 2021-2031, (US$Mn, AGR %) (W Shaped Recovery)
Figure 8.148 Netherlands Battery Electric Vehicle (BEV) Market Volume by Vehicle Type Forecast 2021-2031, (Thousand Units, AGR %) (W Shaped Recovery)
Figure 8.149 France Battery Electric Vehicle (BEV) Market Revenue by Vehicle Type Forecast 2021-2031, (US$Mn, AGR %) (Pre COVID)
Figure 8.150 France Battery Electric Vehicle (BEV) Market Volume by Vehicle Type Forecast 2021-2031, (Thousand Units, AGR %) (Pre COVID)
Figure 8.151 France Battery Electric Vehicle (BEV) Market Revenue by Vehicle Type Forecast 2021-2031, (US$Mn, AGR %) (V Shaped Recovery)
Figure 8.152 France Battery Electric Vehicle (BEV) Market Volume by Vehicle Type Forecast 2021-2031, (Thousand Units, AGR %) (V Shaped Recovery)
Figure 8.153 France Battery Electric Vehicle (BEV) Market Revenue by Vehicle Type Forecast 2021-2031, (US$Mn, AGR %) (U Shaped Recovery)
Figure 8.154 France Battery Electric Vehicle (BEV) Market Volume by Vehicle Type Forecast 2021-2031, (Thousand Units, AGR %) (U Shaped Recovery)
Figure 8.155 France Battery Electric Vehicle (BEV) Market Revenue by Vehicle Type Forecast 2021-2031, (US$Mn, AGR %) (L Shaped Recovery)
Figure 8.156 France Battery Electric Vehicle (BEV) Market Volume by Vehicle Type Forecast 2021-2031, (Thousand Units, AGR %) (L Shaped Recovery)
Figure 8.157 France Battery Electric Vehicle (BEV) Market Revenue by Vehicle Type Forecast 2021-2031, (US$Mn, AGR %) (W Shaped Recovery)
Figure 8.158 France Battery Electric Vehicle (BEV) Market Volume by Vehicle Type Forecast 2021-2031, (Thousand Units, AGR %) (W Shaped Recovery)
Figure 8.159 UK Battery Electric Vehicle (BEV) Market Revenue by Vehicle Type Forecast 2021-2031, (US$Mn, AGR %) (Pre COVID)
Figure 8.160 UK Battery Electric Vehicle (BEV) Market Volume by Vehicle Type Forecast 2021-2031, (Thousand Units, AGR %) (Pre COVID)
Figure 8.161 UK Battery Electric Vehicle (BEV) Market Revenue by Vehicle Type Forecast 2021-2031, (US$Mn, AGR %) (V Shaped Recovery)
Figure 8.162 UK Battery Electric Vehicle (BEV) Market Volume by Vehicle Type Forecast 2021-2031, (Thousand Units, AGR %) (V Shaped Recovery)
Figure 8.163 UK Battery Electric Vehicle (BEV) Market Revenue by Vehicle Type Forecast 2021-2031, (US$Mn, AGR %) (U Shaped Recovery)
Figure 8.164 UK Battery Electric Vehicle (BEV) Market Volume by Vehicle Type Forecast 2021-2031, (Thousand Units, AGR %) (U Shaped Recovery)
Figure 8.165 UK Battery Electric Vehicle (BEV) Market Revenue by Vehicle Type Forecast 2021-2031, (US$Mn, AGR %) (L Shaped Recovery)
Figure 8.166 UK Battery Electric Vehicle (BEV) Market Volume by Vehicle Type Forecast 2021-2031, (Thousand Units, AGR %) (L Shaped Recovery)
Figure 8.167 UK Battery Electric Vehicle (BEV) Market Revenue by Vehicle Type Forecast 2021-2031, (US$Mn, AGR %) (W Shaped Recovery)
Figure 8.168 UK Battery Electric Vehicle (BEV) Market Volume by Vehicle Type Forecast 2021-2031, (Thousand Units, AGR %) (W Shaped Recovery)
Figure 8.169 Sweden Battery Electric Vehicle (BEV) Market Revenue by Vehicle Type Forecast 2021-2031, (US$Mn, AGR %) (Pre COVID)
Figure 8.170 Sweden Battery Electric Vehicle (BEV) Market Volume by Vehicle Type Forecast 2021-2031, (Thousand Units, AGR %) (Pre COVID)
Figure 8.171 Sweden Battery Electric Vehicle (BEV) Market Revenue by Vehicle Type Forecast 2021-2031, (US$Mn, AGR %) (V Shaped Recovery)
Figure 8.172 Sweden Battery Electric Vehicle (BEV) Market Volume by Vehicle Type Forecast 2021-2031, (Thousand Units, AGR %) (V Shaped Recovery)
Figure 8.173 Sweden Battery Electric Vehicle (BEV) Market Revenue by Vehicle Type Forecast 2021-2031, (US$Mn, AGR %) (U Shaped Recovery)
Figure 8.174 Sweden Battery Electric Vehicle (BEV) Market Volume by Vehicle Type Forecast 2021-2031, (Thousand Units, AGR %) (U Shaped Recovery)
Figure 8.175 Sweden Battery Electric Vehicle (BEV) Market Revenue by Vehicle Type Forecast 2021-2031, (US$Mn, AGR %) (L Shaped Recovery)
Figure 8.176 Sweden Battery Electric Vehicle (BEV) Market Volume by Vehicle Type Forecast 2021-2031, (Thousand Units, AGR %) (L Shaped Recovery)
Figure 8.177 Sweden Battery Electric Vehicle (BEV) Market Revenue by Vehicle Type Forecast 2021-2031, (US$Mn, AGR %) (W Shaped Recovery)
Figure 8.178 Sweden Battery Electric Vehicle (BEV) Market Volume by Vehicle Type Forecast 2021-2031, (Thousand Units, AGR %) (W Shaped Recovery)
Figure 8.179 Switzerland Battery Electric Vehicle (BEV) Market Revenue by Vehicle Type Forecast 2021-2031, (US$Mn, AGR %) (Pre COVID)
Figure 8.180 Switzerland Battery Electric Vehicle (BEV) Market Volume by Vehicle Type Forecast 2021-2031, (Thousand Units, AGR %) (Pre COVID)
Figure 8.181 Switzerland Battery Electric Vehicle (BEV) Market Revenue by Vehicle Type Forecast 2021-2031, (US$Mn, AGR %) (V Shaped Recovery)
Figure 8.182 Switzerland Battery Electric Vehicle (BEV) Market Volume by Vehicle Type Forecast 2021-2031, (Thousand Units, AGR %) (V Shaped Recovery)
Figure 8.183 Switzerland Battery Electric Vehicle (BEV) Market Revenue by Vehicle Type Forecast 2021-2031, (US$Mn, AGR %) (U Shaped Recovery)
Figure 8.184 Switzerland Battery Electric Vehicle (BEV) Market Volume by Vehicle Type Forecast 2021-2031, (Thousand Units, AGR %) (U Shaped Recovery)
Figure 8.185 Switzerland Battery Electric Vehicle (BEV) Market Revenue by Vehicle Type Forecast 2021-2031, (US$Mn, AGR %) (L Shaped Recovery)
Figure 8.186 Switzerland Battery Electric Vehicle (BEV) Market Volume by Vehicle Type Forecast 2021-2031, (Thousand Units, AGR %) (L Shaped Recovery)
Figure 8.187 Switzerland Battery Electric Vehicle (BEV) Market Revenue by Vehicle Type Forecast 2021-2031, (US$Mn, AGR %) (W Shaped Recovery)
Figure 8.188 Switzerland Battery Electric Vehicle (BEV) Market Volume by Vehicle Type Forecast 2021-2031, (Thousand Units, AGR %) (W Shaped Recovery)
Figure 8.189 Italy Battery Electric Vehicle (BEV) Market Revenue by Vehicle Type Forecast 2021-2031, (US$Mn, AGR %) (Pre COVID)
Figure 8.190 Italy Battery Electric Vehicle (BEV) Market Volume by Vehicle Type Forecast 2021-2031, (Thousand Units, AGR %) (Pre COVID)
Figure 8.191 Italy Battery Electric Vehicle (BEV) Market Revenue by Vehicle Type Forecast 2021-2031, (US$Mn, AGR %) (V Shaped Recovery)
Figure 8.192 Italy Battery Electric Vehicle (BEV) Market Volume by Vehicle Type Forecast 2021-2031, (Thousand Units, AGR %) (V Shaped Recovery)
Figure 8.193 Italy Battery Electric Vehicle (BEV) Market Revenue by Vehicle Type Forecast 2021-2031, (US$Mn, AGR %) (U Shaped Recovery)
Figure 8.194 Italy Battery Electric Vehicle (BEV) Market Volume by Vehicle Type Forecast 2021-2031, (Thousand Units, AGR %) (U Shaped Recovery)
Figure 8.195 Italy Battery Electric Vehicle (BEV) Market Revenue by Vehicle Type Forecast 2021-2031, (US$Mn, AGR %) (L Shaped Recovery)
Figure 8.196 Italy Battery Electric Vehicle (BEV) Market Volume by Vehicle Type Forecast 2021-2031, (Thousand Units, AGR %) (L Shaped Recovery)
Figure 8.197 Italy Battery Electric Vehicle (BEV) Market Revenue by Vehicle Type Forecast 2021-2031, (US$Mn, AGR %) (W Shaped Recovery)
Figure 8.198 Italy Battery Electric Vehicle (BEV) Market Volume by Vehicle Type Forecast 2021-2031, (Thousand Units, AGR %) (W Shaped Recovery)
Figure 8.199 Spain Battery Electric Vehicle (BEV) Market Revenue by Vehicle Type Forecast 2021-2031, (US$Mn, AGR %) (Pre COVID)
Figure 8.200 Spain Battery Electric Vehicle (BEV) Market Volume by Vehicle Type Forecast 2021-2031, (Thousand Units, AGR %) (Pre COVID)
Figure 8.201 Spain Battery Electric Vehicle (BEV) Market Revenue by Vehicle Type Forecast 2021-2031, (US$Mn, AGR %) (V Shaped Recovery)
Figure 8.202 Spain Battery Electric Vehicle (BEV) Market Volume by Vehicle Type Forecast 2021-2031, (Thousand Units, AGR %) (V Shaped Recovery)
Figure 8.203 Spain Battery Electric Vehicle (BEV) Market Revenue by Vehicle Type Forecast 2021-2031, (US$Mn, AGR %) (U Shaped Recovery)
Figure 8.204 Spain Battery Electric Vehicle (BEV) Market Volume by Vehicle Type Forecast 2021-2031, (Thousand Units, AGR %) (V Shaped Recovery)
Figure 8.205 Spain Battery Electric Vehicle (BEV) Market Revenue by Vehicle Type Forecast 2021-2031, (US$Mn, AGR %) (L Shaped Recovery)
Figure 8.206 Spain Battery Electric Vehicle (BEV) Market Volume by Vehicle Type Forecast 2021-2031, (Thousand Units, AGR %) (L Shaped Recovery)
Figure 8.207 Spain Battery Electric Vehicle (BEV) Market Revenue by Vehicle Type Forecast 2021-2031, (US$Mn, AGR %) (W Shaped Recovery)
Figure 8.208 Spain Battery Electric Vehicle (BEV) Market Volume by Vehicle Type Forecast 2021-2031, (Thousand Units, AGR %) (W Shaped Recovery)
Figure 8.209 Austria Battery Electric Vehicle (BEV) Market Revenue by Vehicle Type Forecast 2021-2031, (US$Mn, AGR %) (Pre COVID)
Figure 8.210 Austria Battery Electric Vehicle (BEV) Market Volume by Vehicle Type Forecast 2021-2031, (Thousand Units, AGR %) (Pre COVID)
Figure 8.211 Austria Battery Electric Vehicle (BEV) Market Revenue by Vehicle Type Forecast 2021-2031, (US$Mn, AGR %) (V Shaped Recovery)
Figure 8.212 Austria Battery Electric Vehicle (BEV) Market Volume by Vehicle Type Forecast 2021-2031, (Thousand Units, AGR %) (V Shaped Recovery)
Figure 8.213 Austria Battery Electric Vehicle (BEV) Market Revenue by Vehicle Type Forecast 2021-2031, (US$Mn, AGR %) (U Shaped Recovery)
Figure 8.214 Austria Battery Electric Vehicle (BEV) Market Volume by Vehicle Type Forecast 2021-2031, (Thousand Units, AGR %) (U Shaped Recovery)
Figure 8.215 Austria Battery Electric Vehicle (BEV) Market Revenue by Vehicle Type Forecast 2021-2031, (US$Mn, AGR %) (L Shaped Recovery)
Figure 8.216 Austria Battery Electric Vehicle (BEV) Market Volume by Vehicle Type Forecast 2021-2031, (Thousand Units, AGR %) (L Shaped Recovery)
Figure 8.217 Austria Battery Electric Vehicle (BEV) Market Revenue by Vehicle Type Forecast 2021-2031, (US$Mn, AGR %) (W Shaped Recovery)
Figure 8.218 Austria Battery Electric Vehicle (BEV) Market Volume by Vehicle Type Forecast 2021-2031, (Thousand Units, AGR %) (W Shaped Recovery)
Figure 8.219 Belgium Battery Electric Vehicle (BEV) Market Revenue, Forecast 2021-2031 (US$Mn, AGR %) (Pre COVID)
Figure 8.220 Belgium Battery Electric Vehicle (BEV) Market Volume, Forecast 2021-2031 (Thousand Units, AGR %) (Pre COVID)
Figure 8.221 Belgium Battery Electric Vehicle (BEV) Market Revenue, Forecast 2021-2031 (US$Mn, AGR %) (V Shaped Recovery)
Figure 8.222 Belgium Battery Electric Vehicle (BEV) Market Volume, Forecast 2021-2031 (Thousand Units, AGR %) (V Shaped Recovery)
Figure 8.223 Belgium Battery Electric Vehicle (BEV) Market Revenue, Forecast 2021-2031 (US$Mn, AGR %) (U Shaped Recovery)
Figure 8.224 Belgium Battery Electric Vehicle (BEV) Market Volume, Forecast 2021-2031 (Thousand Units, AGR %) (U Shaped Recovery)
Figure 8.225 Belgium Battery Electric Vehicle (BEV) Market Revenue, Forecast 2021-2031 (US$Mn, AGR %) (L Shaped Recovery)
Figure 8.226 Belgium Battery Electric Vehicle (BEV) Market Volume, Forecast 2021-2031 (Thousand Units, AGR %) (L Shaped Recovery)
Figure 8.227 Belgium Battery Electric Vehicle (BEV) Market Revenue, Forecast 2021-2031 (US$Mn, AGR %) (W Shaped Recovery)
Figure 8.228 Belgium Battery Electric Vehicle (BEV) Market Volume, Forecast 2021-2031 (Thousand Units, AGR %) (W Shaped Recovery)
Figure 8.229 Portugal Battery Electric Vehicle (BEV) Market Revenue, Forecast 2021-2031 (US$Mn, AGR %) (Pre COVID)
Figure 8.230 Portugal Battery Electric Vehicle (BEV) Market Volume, Forecast 2021-2031 (Thousand Units, AGR %) (Pre COVID)
Figure 8.231 Portugal Battery Electric Vehicle (BEV) Market Revenue, Forecast 2021-2031 (US$Mn, AGR %) (V Shaped Recovery)
Figure 8.232 Portugal Battery Electric Vehicle (BEV) Market Volume, Forecast 2021-2031 (Thousand Units, AGR %) (V Shaped Recovery)
Figure 8.233 Portugal Battery Electric Vehicle (BEV) Market Revenue, Forecast 2021-2031 (US$Mn, AGR %) (U Shaped Recovery)
Figure 8.234 Portugal Battery Electric Vehicle (BEV) Market Volume, Forecast 2021-2031 (Thousand Units, AGR %) (U Shaped Recovery)
Figure 8.235 Portugal Battery Electric Vehicle (BEV) Market Revenue, Forecast 2021-2031 (US$Mn, AGR %) (L Shaped Recovery)
Figure 8.236 Portugal Battery Electric Vehicle (BEV) Market Volume, Forecast 2021-2031 (Thousand Units, AGR %) (L Shaped Recovery)
Figure 8.237 Portugal Battery Electric Vehicle (BEV) Market Revenue, Forecast 2021-2031 (US$Mn, AGR %) (W Shaped Recovery)
Figure 8.238 Portugal Battery Electric Vehicle (BEV) Market Volume, Forecast 2021-2031 (Thousand Units, AGR %) (W Shaped Recovery)
Figure 8.239 Finland Battery Electric Vehicle (BEV) Market Revenue, Forecast 2021-2031 (US$Mn, AGR %) (Pre COVID)
Figure 8.240 Finland Battery Electric Vehicle (BEV) Market Volume, Forecast 2021-2031 (Thousand Units, AGR %) (Pre COVID)
Figure 8.241 Finland Battery Electric Vehicle (BEV) Market Revenue, Forecast 2021-2031 (US$Mn, AGR %) (V Shaped Recovery)
Figure 8.242 Finland Battery Electric Vehicle (BEV) Market Volume, Forecast 2021-2031 (Thousand Units, AGR %) (V Shaped Recovery)
Figure 8.243 Finland Battery Electric Vehicle (BEV) Market Revenue, Forecast 2021-2031 (US$Mn, AGR %) (U Shaped Recovery)
Figure 8.244 Finland Battery Electric Vehicle (BEV) Market Volume, Forecast 2021-2031 (Thousand Units, AGR %) (U Shaped Recovery)
Figure 8.245 Finland Battery Electric Vehicle (BEV) Market Revenue, Forecast 2021-2031 (US$Mn, AGR %) (L Shaped Recovery)
Figure 8.246 Finland Battery Electric Vehicle (BEV) Market Volume, Forecast 2021-2031 (Thousand Units, AGR %) (L Shaped Recovery)
Figure 8.247 Finland Battery Electric Vehicle (BEV) Market Revenue, Forecast 2021-2031 (US$Mn, AGR %) (W Shaped Recovery)
Figure 8.248 Finland Battery Electric Vehicle (BEV) Market Volume, Forecast 2021-2031 (Thousand Units, AGR %) (W Shaped Recovery)
Figure 8.249 Denmark Battery Electric Vehicle (BEV) Market Revenue, Forecast 2021-2031 (US$Mn, AGR %) (Pre COVID)
Figure 8.250 Denmark Battery Electric Vehicle (BEV) Market Volume, Forecast 2021-2031 (Thousand Units, AGR %) (Pre COVID)
Figure 8.251 Denmark Battery Electric Vehicle (BEV) Market Revenue, Forecast 2021-2031 (US$Mn, AGR %) (V Shaped Recovery)
Figure 8.252 Denmark Battery Electric Vehicle (BEV) Market Volume, Forecast 2021-2031 (Thousand Units, AGR %) (V Shaped Recovery)
Figure 8.253 Denmark Battery Electric Vehicle (BEV) Market Revenue, Forecast 2021-2031 (US$Mn, AGR %) (U Shaped Recovery)
Figure 8.254 Denmark Battery Electric Vehicle (BEV) Market Volume, Forecast 2021-2031 (Thousand Units, AGR %) (U Shaped Recovery)
Figure 8.255 Denmark Battery Electric Vehicle (BEV) Market Revenue, Forecast 2021-2031 (US$Mn, AGR %) (L Shaped Recovery)
Figure 8.256 Denmark Battery Electric Vehicle (BEV) Market Volume, Forecast 2021-2031 (Thousand Units, AGR %) (L Shaped Recovery)
Figure 8.257 Denmark Battery Electric Vehicle (BEV) Market Revenue, Forecast 2021-2031 (US$Mn, AGR %) (W Shaped Recovery)
Figure 8.258 Denmark Battery Electric Vehicle (BEV) Market Volume, Forecast 2021-2031 (Thousand Units, AGR %) (W Shaped Recovery)
Figure 8.259 Ireland Battery Electric Vehicle (BEV) Market Revenue, Forecast 2021-2031 (US$Mn, AGR %) (Pre COVID)
Figure 8.260 Ireland Battery Electric Vehicle (BEV) Market Volume, Forecast 2021-2031 (Thousand Units, AGR %) (Pre COVID)
Figure 2.261 Ireland Battery Electric Vehicle (BEV) Market Revenue, Forecast 2021-2031 (US$Mn, AGR %) (V Shaped Recovery)
Figure 8.262 Ireland Battery Electric Vehicle (BEV) Market Volume, Forecast 2021-2031 (Thousand Units, AGR %) (V Shaped Recovery)
Figure 8.263 Ireland Battery Electric Vehicle (BEV) Market Revenue, Forecast 2021-2031 (US$Mn, AGR %) (U Shaped Recovery)
Figure 8.264 Ireland Battery Electric Vehicle (BEV) Market Volume, Forecast 2021-2031 (Thousand Units, AGR %) (U Shaped Recovery)
Figure 8.265 Ireland Battery Electric Vehicle (BEV) Market Revenue, Forecast 2021-2031 (US$Mn, AGR %) (L Shaped Recovery)
Figure 8.266 Ireland Battery Electric Vehicle (BEV) Market Volume, Forecast 2021-2031 (Thousand Units, AGR %) (L Shaped Recovery)
Figure 8.267 Ireland Battery Electric Vehicle (BEV) Market Revenue, Forecast 2021-2031 (US$Mn, AGR %) (W Shaped Recovery)
Figure 8.268 Ireland Battery Electric Vehicle (BEV) Market Volume, Forecast 2021-2031 (Thousand Units, AGR %) (W Shaped Recovery)
Figure 8.269 Hungary Battery Electric Vehicle (BEV) Market Revenue, Forecast 2021-2031 (US$Mn, AGR %) (Pre COVID)
Figure 8.270 Hungary Battery Electric Vehicle (BEV) Market Volume, Forecast 2021-2031 (Thousand Units, AGR %) (Pre COVID)
Figure 8.271 Hungary Battery Electric Vehicle (BEV) Market Revenue, Forecast 2021-2031 (US$Mn, AGR %) (V Shaped Recovery)
Figure 8.272 Hungary Battery Electric Vehicle (BEV) Market Volume, Forecast 2021-2031 (Thousand Units, AGR %) (V Shaped Recovery)
Figure 8.273 Hungary Battery Electric Vehicle (BEV) Market Revenue, Forecast 2021-2031 (US$Mn, AGR %) (U Shaped Recovery)
Figure 8.274 Hungary Battery Electric Vehicle (BEV) Market Volume, Forecast 2021-2031 (Thousand Units, AGR %) (U Shaped Recovery)
Figure 8.275 Hungary Battery Electric Vehicle (BEV) Market Revenue, Forecast 2021-2031 (US$Mn, AGR %) (L Shaped Recovery)
Figure 8.276 Hungary Battery Electric Vehicle (BEV) Market Volume, Forecast 2021-2031 (Thousand Units, AGR %) (L Shaped Recovery)
Figure 8.277 Hungary Battery Electric Vehicle (BEV) Market Revenue, Forecast 2021-2031 (US$Mn, AGR %) (W Shaped Recovery)
Figure 8.278 Hungary Battery Electric Vehicle (BEV) Market Volume, Forecast 2021-2031 (Thousand Units, AGR %) (W Shaped Recovery)
Figure 8.279 Poland Battery Electric Vehicle (BEV) Market Revenue, Forecast 2021-2031 (US$Mn, AGR %) (Pre COVID)
Figure 8.280 Poland Battery Electric Vehicle (BEV) Market Volume, Forecast 2021-2031 (Thousand Units, AGR %) (Pre COVID)
Figure 8.281 Poland Battery Electric Vehicle (BEV) Market Revenue, Forecast 2021-2031 (US$Mn, AGR %) (V Shaped Recovery)
Figure 8.282 Poland Battery Electric Vehicle (BEV) Market Volume, Forecast 2021-2031 (Thousand Units, AGR %) (V Shaped Recovery)
Figure 8.283 Poland Battery Electric Vehicle (BEV) Market Revenue, Forecast 2021-2031 (US$Mn, AGR %) (U Shaped Recovery)
Figure 8.284 Poland Battery Electric Vehicle (BEV) Market Volume, Forecast 2021-2031 (Thousand Units, AGR %) (U Shaped Recovery)
Figure 8.285 Poland Battery Electric Vehicle (BEV) Market Revenue, Forecast 2021-2031 (US$Mn, AGR %) (L Shaped Recovery)
Figure 8.286 Poland Battery Electric Vehicle (BEV) Market Volume, Forecast 2021-2031 (Thousand Units, AGR %) (L Shaped Recovery)
Figure 8.287 Poland Battery Electric Vehicle (BEV) Market Revenue, Forecast 2021-2031 (US$Mn, AGR %) (W Shaped Recovery)
Figure 8.288 Poland Battery Electric Vehicle (BEV) Market Volume, Forecast 2021-2031 (Thousand Units, AGR %) (W Shaped Recovery)
Figure 8.289 Romania Battery Electric Vehicle (BEV) Market Revenue, Forecast 2021-2031 (US$Mn, AGR %) (Pre COVID)
Figure 8.290 Romania Battery Electric Vehicle (BEV) Market Volume, Forecast 2021-2031 (Thousand Units, AGR %) (Pre COVID)
Figure 8.291 Romania Battery Electric Vehicle (BEV) Market Revenue, Forecast 2021-2031 (US$Mn, AGR %) (V Shaped Recovery)
Figure 8.292 Romania Battery Electric Vehicle (BEV) Market Volume, Forecast 2021-2031 (Thousand Units, AGR %) (V Shaped Recovery)
Figure 8.293 Romania Battery Electric Vehicle (BEV) Market Revenue, Forecast 2021-2031 (US$Mn, AGR %) (U Shaped Recovery)
Figure 8.294 Romania Battery Electric Vehicle (BEV) Market Volume, Forecast 2021-2031 (Thousand Units, AGR %) (U Shaped Recovery)
Figure 8.295 Romania Battery Electric Vehicle (BEV) Market Revenue, Forecast 2021-2031 (US$Mn, AGR %) (L Shaped Recovery)
Figure 8.296 Romania Battery Electric Vehicle (BEV) Market Volume, Forecast 2021-2031 (Thousand Units, AGR %) (L Shaped Recovery)
Figure 297 Romania Battery Electric Vehicle (BEV) Market Revenue, Forecast 2021-2031 (US$Mn, AGR %) (W Shaped Recovery)
Figure 8.298 Romania Battery Electric Vehicle (BEV) Market Volume, Forecast 2021-2031 (Thousand Units, AGR %) (W Shaped Recovery)
Figure 8.299 Luxembourg Battery Electric Vehicle (BEV) Market Revenue, Forecast 2021-2031 (US$Mn, AGR %) (Pre COVID)
Figure 8.300 Luxembourg Battery Electric Vehicle (BEV) Market Volume, Forecast 2021-2031 (Thousand Units, AGR %) (Pre COVID)
Figure 8.301 Luxembourg Battery Electric Vehicle (BEV) Market Revenue, Forecast 2021-2031 (US$Mn, AGR %) (V Shaped Recovery)
Figure 8.302 Luxembourg Battery Electric Vehicle (BEV) Market Volume, Forecast 2021-2031 (Thousand Units, AGR %) (V Shaped Recovery)
Figure 8.303 Luxembourg Battery Electric Vehicle (BEV) Market Revenue, Forecast 2021-2031 (US$Mn, AGR %) (U Shaped Recovery)
Figure 8.304 Luxembourg Battery Electric Vehicle (BEV) Market Volume, Forecast 2021-2031 (Thousand Units, AGR %) (U Shaped Recovery)
Figure 8.305 Luxembourg Battery Electric Vehicle (BEV) Market Revenue, Forecast 2021-2031 (US$Mn, AGR %) (L Shaped Recovery)
Figure 8.306 Luxembourg Battery Electric Vehicle (BEV) Market Volume, Forecast 2021-2031 (Thousand Units, AGR %) (L Shaped Recovery)
Figure 8.307 Luxembourg Battery Electric Vehicle (BEV) Market Revenue, Forecast 2021-2031 (US$Mn, AGR %) (W Shaped Recovery)
Figure 8.308 Luxembourg Battery Electric Vehicle (BEV) Market Volume, Forecast 2021-2031 (Thousand Units, AGR %) (W Shaped Recovery)
Figure 8.309 Iceland Battery Electric Vehicle (BEV) Market Revenue, Forecast 2021-2031 (US$Mn, AGR %) (Pre COVID)
Figure 8.310 Iceland Battery Electric Vehicle (BEV) Market Volume, Forecast 2021-2031 (Thousand Units, AGR %) (Pre COVID)
Figure 8.311 Iceland Battery Electric Vehicle (BEV) Market Revenue, Forecast 2021-2031 (US$Mn, AGR %) (V Shaped Recovery)
Figure 8.312 Iceland Battery Electric Vehicle (BEV) Market Volume, Forecast 2021-2031 (Thousand Units, AGR %) (V Shaped Recovery)
Figure 8.313 Iceland Battery Electric Vehicle (BEV) Market Revenue, Forecast 2021-2031 (US$Mn, AGR %) (U Shaped Recovery)
Figure 8.314 Iceland Battery Electric Vehicle (BEV) Market Volume, Forecast 2021-2031 (Thousand Units, AGR %) (U Shaped Recovery)
Figure 8.315 Iceland Battery Electric Vehicle (BEV) Market Revenue, Forecast 2021-2031 (US$Mn, AGR %) (L Shaped Recovery)
Figure 8.316 Iceland Battery Electric Vehicle (BEV) Market Volume, Forecast 2021-2031 (Thousand Units, AGR %) (L Shaped Recovery)
Figure 8.317 Iceland Battery Electric Vehicle (BEV) Market Revenue, Forecast 2021-2031 (US$Mn, AGR %) (W Shaped Recovery)
Figure 8.318 Iceland Battery Electric Vehicle (BEV) Market Volume, Forecast 2021-2031 (Thousand Units, AGR %) (W Shaped Recovery)
Figure 8.319 Czech Republic Battery Electric Vehicle (BEV) Market Revenue, Forecast 2021-2031 (US$Mn, AGR %) (Pre COVID)
Figure 8.320 Czech Republic Battery Electric Vehicle (BEV) Market Volume, Forecast 2021-2031 (Thousand Units, AGR %) (Pre COVID)
Figure 8.321 Czech Republic Battery Electric Vehicle (BEV) Market Revenue, Forecast 2021-2031 (US$Mn, AGR %) (V Shaped Recovery)
Figure 8.322 Czech Republic Battery Electric Vehicle (BEV) Market Volume, Forecast 2021-2031 (Thousand Units, AGR %) (V Shaped Recovery)
Figure 8.323 Czech Republic Battery Electric Vehicle (BEV) Market Revenue, Forecast 2021-2031 (US$Mn, AGR %) (U Shaped Recovery)
Figure 8.324 Czech Republic Battery Electric Vehicle (BEV) Market Volume, Forecast 2021-2031 (Thousand Units, AGR %) (U Shaped Recovery)
Figure 8.325 Czech Republic Battery Electric Vehicle (BEV) Market Revenue, Forecast 2021-2031 (US$Mn, AGR %) (L Shaped Recovery)
Figure 8.326 Czech Republic Battery Electric Vehicle (BEV) Market Volume, Forecast 2021-2031 (Thousand Units, AGR %) (L Shaped Recovery)
Figure 8.327 Czech Republic Battery Electric Vehicle (BEV) Market Revenue, Forecast 2021-2031 (US$Mn, AGR %) (W Shaped Recovery)
Figure 8.328 Czech Republic Battery Electric Vehicle (BEV) Market Volume, Forecast 2021-2031 (Thousand Units, AGR %) (W Shaped Recovery)
Figure 8.329 Slovenia Battery Electric Vehicle (BEV) Market Revenue, Forecast 2021-2031 (US$Mn, AGR %) (Pre COVID)
Figure 8.330 Slovenia Battery Electric Vehicle (BEV) Market Volume, Forecast 2021-2031 (Thousand Units, AGR %) (Pre COVID)
Figure 8.331 Slovenia Battery Electric Vehicle (BEV) Market Revenue, Forecast 2021-2031 (US$Mn, AGR %) (V Shaped Recovery)
Figure 8.332 Slovenia Battery Electric Vehicle (BEV) Market Volume, Forecast 2021-2031 (Thousand Units, AGR %) (V Shaped Recovery)
Figure 8.333 Slovenia Battery Electric Vehicle (BEV) Market Revenue, Forecast 2021-2031 (US$Mn, AGR %) (U Shaped Recovery)
Figure 8.334 Slovenia Battery Electric Vehicle (BEV) Market Volume, Forecast 2021-2031 (Thousand Units, AGR %) (U Shaped Recovery)
Figure 8.335 Slovenia Battery Electric Vehicle (BEV) Market Revenue, Forecast 2021-2031 (US$Mn, AGR %) (L Shaped Recovery)
Figure 8.336 Slovenia Battery Electric Vehicle (BEV) Market Volume, Forecast 2021-2031 (Thousand Units, AGR %) (L Shaped Recovery)
Figure 8.337 Slovenia Battery Electric Vehicle (BEV) Market Revenue, Forecast 2021-2031 (US$Mn, AGR %) (W Shaped Recovery)
Figure 8.338 Slovenia Battery Electric Vehicle (BEV) Market Volume, Forecast 2021-2031 (Thousand Units, AGR %) (W Shaped Recovery)
Figure 8.339 Bulgaria Battery Electric Vehicle (BEV) Market Revenue, Forecast 2021-2031 (US$Mn, AGR %) (Pre COVID)
Figure 8.340 Bulgaria Battery Electric Vehicle (BEV) Market Volume, Forecast 2021-2031 (Thousand Units, AGR %) (Pre COVID)
Figure 8.341 Bulgaria Battery Electric Vehicle (BEV) Market Revenue, Forecast 2021-2031 (US$Mn, AGR %) (V Shaped Recovery)
Figure 8.342 Bulgaria Battery Electric Vehicle (BEV) Market Volume, Forecast 2021-2031 (Thousand Units, AGR %) (V Shaped Recovery)
Figure 8.343 Bulgaria Battery Electric Vehicle (BEV) Market Revenue, Forecast 2021-2031 (US$Mn, AGR %) (U Shaped Recovery)
Figure 8.344 Bulgaria Battery Electric Vehicle (BEV) Market Volume, Forecast 2021-2031 (Thousand Units, AGR %) (U Shaped Recovery)
Figure 8.345 Bulgaria Battery Electric Vehicle (BEV) Market Revenue, Forecast 2021-2031 (US$Mn, AGR %) (L Shaped Recovery)
Figure 8.346 Bulgaria Battery Electric Vehicle (BEV) Market Volume, Forecast 2021-2031 (Thousand Units, AGR %) (L Shaped Recovery)
Figure 8.347 Bulgaria Battery Electric Vehicle (BEV) Market Revenue, Forecast 2021-2031 (US$Mn, AGR %) (W Shaped Recovery)
Figure 8.348 Bulgaria Battery Electric Vehicle (BEV) Market Volume, Forecast 2021-2031 (Thousand Units, AGR %) (W Shaped Recovery)
Figure 8.349 Malta Battery Electric Vehicle (BEV) Market Revenue, Forecast 2021-2031 (US$Mn, AGR %) (Pre COVID)
Figure 8.350 Malta Battery Electric Vehicle (BEV) Market Volume, Forecast 2021-2031 (Thousand Units, AGR %) (Pre COVID)
Figure 8.351 Malta Battery Electric Vehicle (BEV) Market Revenue, Forecast 2021-2031 (US$Mn, AGR %) (V Shaped Recovery)
Figure 8.352 Malta Battery Electric Vehicle (BEV) Market Volume, Forecast 2021-2031 (Thousand Units, AGR %) (V Shaped Recovery)
Figure 8.353 Malta Battery Electric Vehicle (BEV) Market Revenue, Forecast 2021-2031 (US$Mn, AGR %) (U Shaped Recovery)
Figure 8.354 Malta Battery Electric Vehicle (BEV) Market Volume, Forecast 2021-2031 (Thousand Units, AGR %) (U Shaped Recovery)
Figure 8.355 Malta Battery Electric Vehicle (BEV) Market Revenue, Forecast 2021-2031 (US$Mn, AGR %) (L Shaped Recovery)
Figure 8.356 Malta Battery Electric Vehicle (BEV) Market Volume, Forecast 2021-2031 (Thousand Units, AGR %) (L Shaped Recovery)
Figure 8.357 Malta Battery Electric Vehicle (BEV) Market Revenue, Forecast 2021-2031 (US$Mn, AGR %) (W Shaped Recovery)
Figure 8.358 Malta Battery Electric Vehicle (BEV) Market Volume, Forecast 2021-2031 (Thousand Units, AGR %) (W Shaped Recovery)
Figure 8.359 Greece Battery Electric Vehicle (BEV) Market Revenue, Forecast 2021-2031 (US$Mn, AGR %) (Pre COVID)
Figure 8.360 Greece Battery Electric Vehicle (BEV) Market Volume, Forecast 2021-2031 (Thousand Units, AGR %) (Pre COVID)
Figure 8.361 Greece Battery Electric Vehicle (BEV) Market Revenue, Forecast 2021-2031 (US$Mn, AGR %) (V Shaped Recovery)
Figure 8.362 Greece Battery Electric Vehicle (BEV) Market Volume, Forecast 2021-2031 (Thousand Units, AGR %) (V Shaped Recovery)
Figure 8.363 Greece Battery Electric Vehicle (BEV) Market Revenue, Forecast 2021-2031 (US$Mn, AGR %) (U Shaped Recovery)
Figure 8.364 Greece Battery Electric Vehicle (BEV) Market Volume, Forecast 2021-2031 (Thousand Units, AGR %) (U Shaped Recovery)
Figure 8.365 Greece Battery Electric Vehicle (BEV) Market Revenue, Forecast 2021-2031 (US$Mn, AGR %) (L Shaped Recovery)
Figure 8.366 Greece Battery Electric Vehicle (BEV) Market Volume, Forecast 2021-2031 (Thousand Units, AGR %) (L Shaped Recovery)
Figure 8.367 Greece Battery Electric Vehicle (BEV) Market Revenue, Forecast 2021-2031 (US$Mn, AGR %) (W Shaped Recovery)
Figure 8.368 Greece Battery Electric Vehicle (BEV) Market Volume, Forecast 2021-2031 (Thousand Units, AGR %) (W Shaped Recovery)
Figure 8.369 Slovakia Battery Electric Vehicle (BEV) Market Revenue, Forecast 2021-2031 (US$Mn, AGR %) (Pre COVID)
Figure 8.370 Slovakia Battery Electric Vehicle (BEV) Market Volume, Forecast 2021-2031 (Thousand Units, AGR %) (Pre COVID)
Figure 8.371 Slovakia Battery Electric Vehicle (BEV) Market Revenue, Forecast 2021-2031 (US$Mn, AGR %) (V Shaped Recovery)
Figure 8.372 Slovakia Battery Electric Vehicle (BEV) Market Volume, Forecast 2021-2031 (Thousand Units, AGR %) (V Shaped Recovery)
Figure 8.373 Slovakia Battery Electric Vehicle (BEV) Market Revenue, Forecast 2021-2031 (US$Mn, AGR %) (U Shaped Recovery)
Figure 8.374 Slovakia Battery Electric Vehicle (BEV) Market Volume, Forecast 2021-2031 (Thousand Units, AGR %) (U Shaped Recovery)
Figure 8.375 Slovakia Battery Electric Vehicle (BEV) Market Revenue, Forecast 2021-2031 (US$Mn, AGR %) (L Shaped Recovery)
Figure 8.376 Slovakia Battery Electric Vehicle (BEV) Market Volume, Forecast 2021-2031 (Thousand Units, AGR %) (L Shaped Recovery)
Figure 8.377 Slovakia Battery Electric Vehicle (BEV) Market Revenue, Forecast 2021-2031 (US$Mn, AGR %) (W Shaped Recovery)
Figure 8.378 Slovakia Battery Electric Vehicle (BEV) Market Volume, Forecast 2021-2031 (Thousand Units, AGR %) (W Shaped Recovery)
Figure 8.379 Rest of Europe Battery Electric Vehicle (BEV) Market Revenue, Forecast 2021-2031 (US$Mn, AGR %) (Pre COVID)
Figure 8.380 Rest of Europe Battery Electric Vehicle (BEV) Market Volume, Forecast 2021-2031 (Thousand Units, AGR %) (Pre COVID)
Figure 8.381 Rest of Europe Battery Electric Vehicle (BEV) Market Revenue, Forecast 2021-2031 (US$Mn, AGR %) (V Shaped Recovery)
Figure 8.382 Rest of Europe Battery Electric Vehicle (BEV) Market Volume, Forecast 2021-2031 (Thousand Units, AGR %) (V Shaped Recovery)
Figure 8.383 Rest of Europe Battery Electric Vehicle (BEV) Market Revenue, Forecast 2021-2031 (US$Mn, AGR %) (U Shaped Recovery)
Figure 8.384 Rest of Europe Battery Electric Vehicle (BEV) Market Volume, Forecast 2021-2031 (Thousand Units, AGR %) (U Shaped Recovery)
Figure 8.385 Rest of Europe Battery Electric Vehicle (BEV) Market Revenue, Forecast 2021-2031 (US$Mn, AGR %) (L Shaped Recovery)
Figure 8.386 Rest of Europe Battery Electric Vehicle (BEV) Market Volume, Forecast 2021-2031 (Thousand Units, AGR %) (L Shaped Recovery)
Figure 8.387 Rest of Europe Battery Electric Vehicle (BEV) Market Revenue, Forecast 2021-2031 (US$Mn, AGR %) (W Shaped Recovery)
Figure 8.388 Rest of Europe Battery Electric Vehicle (BEV) Market Volume, Forecast 2021-2031 (Thousand Units, AGR %) (W Shaped Recovery)
Figure 8.389 APAC Battery Electric Vehicle (BEV) Market Revenue, Forecast 2021-2031 (US$Mn, AGR %) (Pre COVID)
Figure 8.390 APAC Battery Electric Vehicle (BEV) Market Volume, Forecast 2021-2031 (Thousand Units, AGR %) (Pre COVID)
Figure 8.391 APAC Battery Electric Vehicle (BEV) Market Revenue, Forecast 2021-2031 (US$Mn, AGR %) (V Shaped Recovery)
Figure 8.392 APAC Battery Electric Vehicle (BEV) Market Volume, Forecast 2021-2031 (Thousand Units, AGR %) (V Shaped Recovery)
Figure 8.393 APAC Battery Electric Vehicle (BEV) Market Revenue, Forecast 2021-2031 (US$Mn, AGR %) (U Shaped Recovery)
Figure 8.394 APAC Battery Electric Vehicle (BEV) Market Volume, Forecast 2021-2031 (Thousand Units, AGR %) (U Shaped Recovery)
Figure 8.395 APAC Battery Electric Vehicle (BEV) Market Revenue, Forecast 2021-2031 (US$Mn, AGR %) (L Shaped Recovery)
Figure 8.396 APAC Battery Electric Vehicle (BEV) Market Volume, Forecast 2021-2031 (Thousand Units, AGR %) (L Shaped Recovery)
Figure 8.397 APAC Battery Electric Vehicle (BEV) Market Revenue, Forecast 2021-2031 (US$Mn, AGR %) (W Shaped Recovery)
Figure 8.398 APAC Battery Electric Vehicle (BEV) Market Volume, Forecast 2021-2031 (Thousand Units, AGR %) (W Shaped Recovery)
Figure 8.399 APAC Battery Electric Vehicle (BEV) Market Revenue by Vehicle Type Forecast 2021-2031, (US$Mn, AGR %) (Pre COVID)
Figure 8.400 APAC Battery Electric Vehicle (BEV) Market by Vehicle Type Revenue Share Forecast 2020, 2026, 2031 (%) (Pre COVID)
Figure 8.401 APAC Battery Electric Vehicle (BEV) Market Volume by Vehicle Type Forecast 2021-2031, (Thousand Units, AGR %) (Pre COVID)
Figure 8.402 APAC Battery Electric Vehicle (BEV) Market by Vehicle Type Volume Share Forecast 2020, 2026, 2031 (%) (Pre COVID)
Figure 8.403 APAC Battery Electric Vehicle (BEV) Market Revenue by Vehicle Type Forecast 2021-2031, (US$Mn, AGR %) (V Shaped Recovery)
Figure 8.404 APAC Battery Electric Vehicle (BEV) Market Volume by Vehicle Type Forecast 2021-2031, (Thousand Units, AGR %) (V Shaped Recovery)
Figure 8.405 APAC Battery Electric Vehicle (BEV) Market Revenue by Vehicle Type Forecast 2021-2031, (US$Mn, AGR %) (U Shaped Recovery)
Figure 8.406 APAC Battery Electric Vehicle (BEV) Market Volume by Vehicle Type Forecast 2021-2031, (Thousand Units, AGR %) (U Shaped Recovery)
Figure 8.407 APAC Battery Electric Vehicle (BEV) Market Revenue by Vehicle Type Forecast 2021-2031, (US$Mn, AGR %) (L Shaped Recovery)
Figure 8.408 APAC Battery Electric Vehicle (BEV) Market Volume by Vehicle Type Forecast 2021-2031, (Thousand Units, AGR %) (L Shaped Recovery)
Figure 8.409 APAC Battery Electric Vehicle (BEV) Market Revenue by Vehicle Type Forecast 2021-2031, (US$Mn, AGR %) (W Shaped Recovery)
Figure 8.410 APAC Battery Electric Vehicle (BEV) Market Volume by Vehicle Type Forecast 2021-2031, (Thousand Units, AGR %) (W Shaped Recovery)
Figure 8.411 APAC Battery Electric Vehicle (BEV) Market Revenue by Battery Type Forecast 2021-2031, (US$Mn, AGR %) (Pre COVID)
Figure 8.412 APAC Battery Electric Vehicle (BEV) Market by Battery Type Revenue Share Forecast 2020, 2026, 2031 (%) (Pre COVID)
Figure 8.413 APAC Battery Electric Vehicle (BEV) Market Revenue by Battery Type Forecast 2021-2031, (US$Mn, AGR %) (V Shaped Recovery)
Figure 8.414 APAC Battery Electric Vehicle (BEV) Market Revenue by Battery Type Forecast 2021-2031, (US$Mn, AGR %) (U Shaped Recovery)
Figure 8.415 APAC Battery Electric Vehicle (BEV) Market Revenue by Battery Type Forecast 2021-2031, (US$Mn, AGR %) (L Shaped Recovery)
Figure 8.416 APAC Battery Electric Vehicle (BEV) Market Revenue by Battery Type Forecast 2021-2031, (US$Mn, AGR %) (W Shaped Recovery)
Figure 8.417 APAC Battery Electric Vehicle (BEV) Market Revenue by Country Forecast 2021-2031, (US$Mn, AGR %) (Pre COVID)
Figure 8.418 APAC Battery Electric Vehicle (BEV) Market by Country Revenue Share Forecast 2020, 2026, 2031 (%) (Pre COVID)
Figure 8.419 APAC Battery Electric Vehicle (BEV) Market Volume by Country Forecast 2021-2031, (Thousand Units, AGR %) (Pre COVID)
Figure 8.420 APAC Battery Electric Vehicle (BEV) Market by Country Volume Share Forecast 2020, 2026, 2031 (%) (Pre COVID)
Figure 8.421 APAC Battery Electric Vehicle (BEV) Market Revenue by Country Forecast 2021-2031, (US$Mn, AGR %) (V Shaped Recovery)
Figure 8.422 APAC Battery Electric Vehicle (BEV) Market Volume by Country Forecast 2021-2031, (Thousand Units, AGR %) (V Shaped Recovery)
Figure 8.423 APAC Battery Electric Vehicle (BEV) Market Revenue by Country Forecast 2021-2031, (US$Mn, AGR %) (U Shaped Recovery)
Figure 8.424 APAC Battery Electric Vehicle (BEV) Market Volume by Country Forecast 2021-2031, (Thousand Units, AGR %) (U Shaped Recovery)
Figure 8.425 APAC Battery Electric Vehicle (BEV) Market Revenue by Country Forecast 2021-2031, (US$Mn, AGR %) (L Shaped Recovery)
Figure 8.426 APAC Battery Electric Vehicle (BEV) Market Volume by Country Forecast 2021-2031, (Thousand Units, AGR %) (L Shaped Recovery)
Figure 8.427 APAC Battery Electric Vehicle (BEV) Market Revenue by Country Forecast 2021-2031, (US$Mn, AGR %) (W Shaped Recovery)
Figure 8.428 APAC Battery Electric Vehicle (BEV) Market Volume by Country Forecast 2021-2031, (Thousand Units, AGR %) (W Shaped Recovery)
Figure 8.429 China Battery Electric Vehicle (BEV) Market Revenue by Vehicle Type Forecast 2021-2031, (US$Mn, AGR %) (Pre COVID)
Figure 8.430 China Battery Electric Vehicle (BEV) Market Volume by Vehicle Type Forecast 2021-2031, (Thousand Units, AGR %) (Pre COVID)
Figure 8.431 China Battery Electric Vehicle (BEV) Market Revenue by Vehicle Type Forecast 2021-2031, (US$Mn, AGR %) (V Shaped Recovery)
Figure 8.432 China Battery Electric Vehicle (BEV) Market Volume by Vehicle Type Forecast 2021-2031, (Thousand Units, AGR %) (V Shaped Recovery)
Figure 8.433 China Battery Electric Vehicle (BEV) Market Revenue by Vehicle Type Forecast 2021-2031, (US$Mn, AGR %) (U Shaped Recovery)
Figure 8.434 China Battery Electric Vehicle (BEV) Market Volume by Vehicle Type Forecast 2021-2031, (Thousand Units, AGR %) (U Shaped Recovery)
Figure 8.435 China Battery Electric Vehicle (BEV) Market Revenue by Vehicle Type Forecast 2021-2031, (US$Mn, AGR %) (L Shaped Recovery)
Figure 8.436 China Battery Electric Vehicle (BEV) Market Volume by Vehicle Type Forecast 2021-2031, (Thousand Units, AGR %) (L Shaped Recovery)
Figure 8.437 China Battery Electric Vehicle (BEV) Market Revenue by Vehicle Type Forecast 2021-2031, (US$Mn, AGR %) (W Shaped Recovery)
Figure 8.438 China Battery Electric Vehicle (BEV) Market Volume by Vehicle Type Forecast 2021-2031, (Thousand Units, AGR %) (W Shaped Recovery)
Figure 8.439 China Battery Electric Vehicle (BEV) Market Revenue by Battery Type Forecast 2021-2031, (US$Mn, AGR %) (Pre COVID)
Figure 8.440 China Battery Electric Vehicle (BEV) Market Revenue by Battery Type Forecast 2021-2031, (US$Mn, AGR %) (V Shaped Recovery)
Figure 8.441 China Battery Electric Vehicle (BEV) Market Revenue by Battery Type Forecast 2021-2031, (US$Mn, AGR %) (U Shaped Recovery)
Figure 8.442 China Battery Electric Vehicle (BEV) Market Revenue by Battery Type Forecast 2021-2031, (US$Mn, AGR %) (L Shaped Recovery)
Figure 8.443 China Battery Electric Vehicle (BEV) Market Revenue by Battery Type Forecast 2021-2031, (US$Mn, AGR %) (W Shaped Recovery)
Figure 8.444 Japan Battery Electric Vehicle (BEV) Market Revenue by Vehicle Type Forecast 2021-2031, (US$Mn, AGR %) (Pre COVID)
Figure 8.445 China Battery Electric Vehicle (BEV) Market Volume by Vehicle Type Forecast 2021-2031, (Thousand Units, AGR %) (Pre COVID)
Figure 8.446 Japan Battery Electric Vehicle (BEV) Market Revenue by Vehicle Type Forecast 2021-2031, (US$Mn, AGR %) (V Shaped Recovery)
Figure 8.447 Japan Battery Electric Vehicle (BEV) Market Volume by Vehicle Type Forecast 2021-2031, (Thousand Units, AGR %) (V Shaped Recovery)
Figure 8.448 Japan Battery Electric Vehicle (BEV) Market Revenue by Vehicle Type Forecast 2021-2031, (US$Mn, AGR %) (U Shaped Recovery)
Figure 8.449 Japan Battery Electric Vehicle (BEV) Market Volume by Vehicle Type Forecast 2021-2031, (Thousand Units, AGR %) (U Shaped Recovery)
Figure 8.450 Japan Battery Electric Vehicle (BEV) Market Revenue by Vehicle Type Forecast 2021-2031, (US$Mn, AGR %) (L Shaped Recovery)
Figure 8.451 Japan Battery Electric Vehicle (BEV) Market Volume by Vehicle Type Forecast 2021-2031, (Thousand Units, AGR %) (L Shaped Recovery)
Figure 8.452 Japan Battery Electric Vehicle (BEV) Market Revenue by Vehicle Type Forecast 2021-2031, (US$Mn, AGR %) (W Shaped Recovery)
Figure 8.453 Japan Battery Electric Vehicle (BEV) Market Volume by Vehicle Type Forecast 2021-2031, (Thousand Units, AGR %) (W Shaped Recovery)
Figure 8.454 Japan Battery Electric Vehicle (BEV) Market Revenue by Battery Type Forecast 2021-2031, (US$Mn, AGR %) (Pre COVID)
Figure 8.455 Japan Battery Electric Vehicle (BEV) Market Revenue by Battery Type Forecast 2021-2031, (US$Mn, AGR %) (V Shaped Recovery)
Figure 8.456 Japan Battery Electric Vehicle (BEV) Market Revenue by Battery Type Forecast 2021-2031, (US$Mn, AGR %) (U Shaped Recovery)
Figure 8.457 Japan Battery Electric Vehicle (BEV) Market Revenue by Battery Type Forecast 2021-2031, (US$Mn, AGR %) (L Shaped Recovery)
Figure 8.458 Japan Battery Electric Vehicle (BEV) Market Revenue by Battery Type Forecast 2021-2031, (US$Mn, AGR %) (W Shaped Recovery)
Figure 8.459 India Battery Electric Vehicle (BEV) Market Revenue by Vehicle Type Forecast 2021-2031, (US$Mn, AGR %) (Pre COVID)
Figure 8.460 India Battery Electric Vehicle (BEV) Market Volume by Vehicle Type Forecast 2021-2031, (Thousand Units, AGR %) (Pre COVID)
Figure 8.461 India Battery Electric Vehicle (BEV) Market Revenue by Vehicle Type Forecast 2021-2031, (US$Mn, AGR %) (V Shaped Recovery)
Figure 8.462 India Battery Electric Vehicle (BEV) Market Volume by Vehicle Type Forecast 2021-2031, (Thousand Units, AGR %) (V Shaped Recovery)
Figure 8.463 India Battery Electric Vehicle (BEV) Market Revenue by Vehicle Type Forecast 2021-2031, (US$Mn, AGR %) (U Shaped Recovery)
Figure 8.464 India Battery Electric Vehicle (BEV) Market Volume by Vehicle Type Forecast 2021-2031, (Thousand Units, AGR %) (U Shaped Recovery)
Figure 8.465 India Battery Electric Vehicle (BEV) Market Revenue by Vehicle Type Forecast 2021-2031, (US$Mn, AGR %) (L Shaped Recovery)
Figure 8.466 India Battery Electric Vehicle (BEV) Market Volume by Vehicle Type Forecast 2021-2031, (Thousand Units, AGR %) (L Shaped Recovery)
Figure 8.467 India Battery Electric Vehicle (BEV) Market Revenue by Vehicle Type Forecast 2021-2031, (US$Mn, AGR %) (W Shaped Recovery)
Figure 8.468 India Battery Electric Vehicle (BEV) Market Volume by Vehicle Type Forecast 2021-2031, (Thousand Units, AGR %) (W Shaped Recovery)
Figure 8.469 South Korea Battery Electric Vehicle (BEV) Market Revenue by Vehicle Type Forecast 2021-2031, (US$Mn, AGR %) (Pre COVID)
Figure 8.470 South Korea Battery Electric Vehicle (BEV) Market Volume by Vehicle Type Forecast 2021-2031, (Thousand Units, AGR %) (Pre COVID)
Figure 8.471 South Korea Battery Electric Vehicle (BEV) Market Revenue by Vehicle Type Forecast 2021-2031, (US$Mn, AGR %) (V Shaped Recovery)
Figure 8.472 South Korea Battery Electric Vehicle (BEV) Market Volume by Vehicle Type Forecast 2021-2031, (Thousand Units, AGR %) (V Shaped Recovery)
Figure 8.473 South Korea Battery Electric Vehicle (BEV) Market Revenue by Vehicle Type Forecast 2021-2031, (US$Mn, AGR %) (U Shaped Recovery)
Figure 8.474 South Korea Battery Electric Vehicle (BEV) Market Volume by Vehicle Type Forecast 2021-2031, (Thousand Units, AGR %) (U Shaped Recovery)
Figure 8.475 South Korea Battery Electric Vehicle (BEV) Market Revenue by Vehicle Type Forecast 2021-2031, (US$Mn, AGR %) (L Shaped Recovery)
Figure 8.476 South Korea Battery Electric Vehicle (BEV) Market Volume by Vehicle Type Forecast 2021-2031, (Thousand Units, AGR %) (L Shaped Recovery)
Figure 8.477 South Korea Battery Electric Vehicle (BEV) Market Revenue by Vehicle Type Forecast 2021-2031, (US$Mn, AGR %) (W Shaped Recovery)
Figure 8.478 South Korea Battery Electric Vehicle (BEV) Market Volume by Vehicle Type Forecast 2021-2031, (Thousand Units, AGR %) (W Shaped Recovery)
Figure 8.479 Australia Battery Electric Vehicle (BEV) Market Revenue by Vehicle Type Forecast 2021-2031, (US$Mn, AGR %) (Pre COVID)
Figure 8.480 Australia Battery Electric Vehicle (BEV) Market Volume by Vehicle Type Forecast 2021-2031, (Thousand Units, AGR %) (Pre COVID)
Figure 8.481 Australia Battery Electric Vehicle (BEV) Market Revenue by Vehicle Type Forecast 2021-2031, (US$Mn, AGR %) (V Shaped Recovery)
Figure 8.482 Australia Battery Electric Vehicle (BEV) Market Volume by Vehicle Type Forecast 2021-2031, (Thousand Units, AGR %) (V Shaped Recovery)
Figure 8.483 Australia Battery Electric Vehicle (BEV) Market Revenue by Vehicle Type Forecast 2021-2031, (US$Mn, AGR %) (U Shaped Recovery)
Figure 8.484 Australia Battery Electric Vehicle (BEV) Market Volume by Vehicle Type Forecast 2021-2031, (Thousand Units, AGR %) (U Shaped Recovery)
Figure 8.485 Australia Battery Electric Vehicle (BEV) Market Revenue by Vehicle Type Forecast 2021-2031, (US$Mn, AGR %) (L Shaped Recovery)
Figure 8.486 Australia Battery Electric Vehicle (BEV) Market Volume by Vehicle Type Forecast 2021-2031, (Thousand Units, AGR %) (L Shaped Recovery)
Figure 8.487 Australia Battery Electric Vehicle (BEV) Market Revenue by Vehicle Type Forecast 2021-2031, (US$Mn, AGR %) (W Shaped Recovery)
Figure 8.488 Australia Battery Electric Vehicle (BEV) Market Volume by Vehicle Type Forecast 2021-2031, (Thousand Units, AGR %) (W Shaped Recovery)
Figure 8.489 Rest of APAC Battery Electric Vehicle (BEV) Market Revenue, Forecast 2021-2031 (US$Mn, AGR %) (Pre COVID)
Figure 8.490 Rest of APAC Battery Electric Vehicle (BEV) Market Volume, Forecast 2021-2031 (Thousand Units, AGR %) (Pre COVID)
Figure 8.491 Rest of APAC Battery Electric Vehicle (BEV) Market Revenue, Forecast 2021-2031 (US$Mn, AGR %) (V Shaped Recovery)
Figure 8.492 Rest of APAC Battery Electric Vehicle (BEV) Market Volume, Forecast 2021-2031 (Thousand Units, AGR %) (V Shaped Recovery)
Figure 8.493 Rest of APAC Battery Electric Vehicle (BEV) Market Revenue, Forecast 2021-2031 (US$Mn, AGR %) (U Shaped Recovery)
Figure 8.494 Rest of APAC Battery Electric Vehicle (BEV) Market Volume, Forecast 2021-2031 (Thousand Units, AGR %) (U Shaped Recovery)
Figure 8.495 Rest of APAC Battery Electric Vehicle (BEV) Market Revenue, Forecast 2021-2031 (US$Mn, AGR %) (L Shaped Recovery)
Figure 8.496 Rest of APAC Battery Electric Vehicle (BEV) Market Volume, Forecast 2021-2031 (Thousand Units, AGR %) (L Shaped Recovery)
Figure 8.497 Rest of APAC Battery Electric Vehicle (BEV) Market Revenue, Forecast 2021-2031 (US$Mn, AGR %) (W Shaped Recovery)
Figure 8.498 Rest of APAC Battery Electric Vehicle (BEV) Market Volume, Forecast 2021-2031 (Thousand Units, AGR %) (L Shaped Recovery)
Figure 8.499 RoW Battery Electric Vehicle (BEV) Market Revenue, Forecast 2021-2031 (US$Mn, AGR %) (Pre COVID)
Figure 8.500 RoW Battery Electric Vehicle (BEV) Market Volume, Forecast 2021-2031 (Thousand Units, AGR %) (Pre COVID)
Figure 8.501 RoW Battery Electric Vehicle (BEV) Market Revenue, Forecast 2021-2031 (US$Mn, AGR %) (V Shaped Recovery)
Figure 8.502 RoW Battery Electric Vehicle (BEV) Market Volume, Forecast 2021-2031 (Thousand Units, AGR %) (V Shaped Recovery)
Figure 8.503 RoW Battery Electric Vehicle (BEV) Market Revenue, Forecast 2021-2031 (US$Mn, AGR %) (U Shaped Recovery)
Figure 8.504 RoW Battery Electric Vehicle (BEV) Market Volume, Forecast 2021-2031 (Thousand Units, AGR %) (U Shaped Recovery)
Figure 8.505 RoW Battery Electric Vehicle (BEV) Market Revenue, Forecast 2021-2031 (US$Mn, AGR %) (L Shaped Recovery)
Figure 8.506 RoW Battery Electric Vehicle (BEV) Market Volume, Forecast 2021-2031 (Thousand Units, AGR %) (L Shaped Recovery)
Figure 8.507 RoW Battery Electric Vehicle (BEV) Market Revenue, Forecast 2021-2031 (US$Mn, AGR %) (W Shaped Recovery)
Figure 8.508 RoW Battery Electric Vehicle (BEV) Market Volume, Forecast 2021-2031 (Thousand Units, AGR %) (W Shaped Recovery)
Figure 8.509 RoW Battery Electric Vehicle (BEV) Market Revenue by Vehicle Type Forecast 2021-2031, (US$Mn, AGR %) (Pre COVID)
Figure 8.510 RoW Battery Electric Vehicle (BEV) Market by Vehicle Type Revenue Share Forecast 2020, 2026, 2031 (%) (Pre COVID)
Figure 8.511 RoW Battery Electric Vehicle (BEV) Market Volume by Vehicle Type Forecast 2021-2031, (Thousand Units, AGR %) (Pre COVID)
Figure 8.512 RoW Battery Electric Vehicle (BEV) Market by Vehicle Type Volume Share Forecast 2020, 2026, 2031 (%) (Pre COVID)
Figure 8.513 RoW Battery Electric Vehicle (BEV) Market Revenue by Vehicle Type Forecast 2021-2031, (US$Mn, AGR %) (V Shaped Recovery)
Figure 8.514 RoW Battery Electric Vehicle (BEV) Market Volume by Vehicle Type Forecast 2021-2031, (Thousand Units, AGR %) (V Shaped Recovery)
Figure 8.515 RoW Battery Electric Vehicle (BEV) Market Revenue by Vehicle Type Forecast 2021-2031, (US$Mn, AGR %) (U Shaped Recovery)
Figure 8.516 RoW Battery Electric Vehicle (BEV) Market Volume by Vehicle Type Forecast 2021-2031, (Thousand Units, AGR %) (U Shaped Recovery)
Figure 8.517 RoW Battery Electric Vehicle (BEV) Market Revenue by Vehicle Type Forecast 2021-2031, (US$Mn, AGR %) (L Shaped Recovery)
Figure 8.518 RoW Battery Electric Vehicle (BEV) Market Volume by Vehicle Type Forecast 2021-2031, (Thousand Units, AGR %) (L Shaped Recovery)
Figure 8.519 RoW Battery Electric Vehicle (BEV) Market Revenue by Vehicle Type Forecast 2021-2031, (US$Mn, AGR %) (W Shaped Recovery)
Figure 8.520 RoW Battery Electric Vehicle (BEV) Market Volume by Vehicle Type Forecast 2021-2031, (Thousand Units, AGR %) (W Shaped Recovery)
Figure 8.521 RoW Battery Electric Vehicle (BEV) Market Revenue by Battery Type Forecast 2021-2031, (US$Mn, AGR %) (Pre COVID)
Figure 8.522 RoW Battery Electric Vehicle (BEV) Market by Battery Type Revenue Share Forecast 2020, 2026, 2031 (%) (Pre COVID)
Figure 8.523 RoW Battery Electric Vehicle (BEV) Market Revenue by Battery Type Forecast 2021-2031, (US$Mn, AGR %) (V Shaped Recovery)
Figure 8.524 RoW Battery Electric Vehicle (BEV) Market Revenue by Battery Type Forecast 2021-2031, (US$Mn, AGR %) (U Shaped Recovery)
Figure 8.525 RoW Battery Electric Vehicle (BEV) Market Revenue by Battery Type Forecast 2021-2031, (US$Mn, AGR %) (L Shaped Recovery)
Figure 8.526 RoW Battery Electric Vehicle (BEV) Market Revenue by Battery Type Forecast 2021-2031, (US$Mn, AGR %) (W Shaped Recovery)
Figure 8.527 RoW Battery Electric Vehicle (BEV) Market Revenue by Country Forecast 2021-2031, (US$Mn, AGR %) (Pre COVID)
Figure 8.528 RoW Battery Electric Vehicle (BEV) Market by Country Revenue Share Forecast 2020, 2026, 2031 (%) (Pre COVID)
Figure 8.529 RoW Battery Electric Vehicle (BEV) Market Volume by Country Forecast 2021-2031, (Thousand Units, AGR %) (Pre COVID)
Figure 8.530 RoW Battery Electric Vehicle (BEV) Market by Country Volume Share Forecast 2020, 2026, 2031 (%) (Pre COVID)
Figure 8.531 RoW Battery Electric Vehicle (BEV) Market Revenue by Country Forecast 2021-2031, (US$Mn, AGR %) (V Shaped Recovery)
Figure 8.532 RoW Battery Electric Vehicle (BEV) Market Volume by Country Forecast 2021-2031, (Thousand Units, AGR %) (V Shaped Recovery)
Figure 8.533 RoW Battery Electric Vehicle (BEV) Market Revenue by Country Forecast 2021-2031, (US$Mn, AGR %) (U Shaped Recovery)
Figure 8.534 RoW Battery Electric Vehicle (BEV) Market Volume by Country Forecast 2021-2031, (Thousand Units, AGR %) (U Shaped Recovery)
Figure 8.535 RoW Battery Electric Vehicle (BEV) Market Revenue by Country Forecast 2021-2031, (US$Mn, AGR %) (L Shaped Recovery)
Figure 8.536 RoW Battery Electric Vehicle (BEV) Market Volume by Country Forecast 2021-2031, (Thousand Units, AGR %) (L Shaped Recovery)
Figure 8.537 RoW Battery Electric Vehicle (BEV) Market Revenue by Country Forecast 2021-2031, (US$Mn, AGR %) (W Shaped Recovery)
Figure 8.538 RoW Battery Electric Vehicle (BEV) Market Volume by Country Forecast 2021-2031, (Thousand Units, AGR %) (W Shaped Recovery)
Figure 8.539 South America Battery Electric Vehicle (BEV) Market Revenue by Country Forecast 2021-2031, (US$Mn, AGR %) (Pre COVID)
Figure 8.540 South America Battery Electric Vehicle (BEV) Market by Country Revenue Share Forecast 2020, 2026, 2031 (%) (Pre COVID)
Figure 8.541 South America Battery Electric Vehicle (BEV) Market Volume by Country Forecast 2021-2031, (Thousand Units, AGR %) (Pre COVID)
Figure 8.542 South America Battery Electric Vehicle (BEV) Market by Country Volume Share Forecast 2020, 2026, 2031 (%) (Pre COVID)
Figure 8.543 South America Battery Electric Vehicle (BEV) Market Revenue by Country Forecast 2021-2031, (US$Mn, AGR %) (V Shaped Recovery)
Figure 8.544 South America Battery Electric Vehicle (BEV) Market Volume by Country Forecast 2021-2031, (Thousand Units, AGR %) (V Shaped Recovery)
Figure 8.545 South America Battery Electric Vehicle (BEV) Market Revenue by Country Forecast 2021-2031, (US$Mn, AGR %) (U Shaped Recovery)
Figure 8.546 South America Battery Electric Vehicle (BEV) Market Volume by Country Forecast 2021-2031, (Thousand Units, AGR %) (U Shaped Recovery)
Figure 8.547 South America Battery Electric Vehicle (BEV) Market Revenue by Country Forecast 2021-2031, (US$Mn, AGR %) (L Shaped Recovery)
Figure 8.548 South America Battery Electric Vehicle (BEV) Market Volume by Country Forecast 2021-2031, (Thousand Units, AGR %) (L Shaped Recovery)
Figure 8.549 South America Battery Electric Vehicle (BEV) Market Revenue by Country Forecast 2021-2031, (US$Mn, AGR %) (W Shaped Recovery)
Figure 8.550 South America Battery Electric Vehicle (BEV) Market Volume by Country Forecast 2021-2031, (Thousand Units, AGR %) (W Shaped Recovery)
Figure 8.551 Middle East Battery Electric Vehicle (BEV) Market Revenue by Country Forecast 2021-2031, (US$Mn, AGR %) (Pre COVID)
Figure 8.552 Middle East Battery Electric Vehicle (BEV) Market by Country Revenue Share Forecast 2020, 2026, 2031 (%) (Pre COVID)
Figure 8.553 Middle East Battery Electric Vehicle (BEV) Market Volume by Country Forecast 2021-2031, (Thousand Units, AGR %) (Pre COVID)
Figure 8.554 Middle East Battery Electric Vehicle (BEV) Market by Country Volume Share Forecast 2020, 2026, 2031 (%) (Pre COVID)
Figure 8.555 Middle East Battery Electric Vehicle (BEV) Market Revenue by Country Forecast 2021-2031, (US$Mn, AGR %) (V Shaped Recovery)
Figure 8.556 Middle East Battery Electric Vehicle (BEV) Market Volume by Country Forecast 2021-2031, (Thousand Units, AGR %) (V Shaped Recovery)
Figure 8.557 Middle East Battery Electric Vehicle (BEV) Market Revenue by Country Forecast 2021-2031, (US$Mn, AGR %) (U Shaped Recovery)
Figure 8.558 Middle East Battery Electric Vehicle (BEV) Market Volume by Country Forecast 2021-2031, (Thousand Units, AGR %) (U Shaped Recovery)
Figure 8.559 Middle East Battery Electric Vehicle (BEV) Market Revenue by Country Forecast 2021-2031, (US$Mn, AGR %) (L Shaped Recovery)
Figure 8.560 Middle East Battery Electric Vehicle (BEV) Market Volume by Country Forecast 2021-2031, (Thousand Units, AGR %) (L Shaped Recovery)
Figure 8.561 Middle East Battery Electric Vehicle (BEV) Market Revenue by Country Forecast 2021-2031, (US$Mn, AGR %) (W Shaped Recovery)
Figure 8.562 Middle East Battery Electric Vehicle (BEV) Market Volume by Country Forecast 2021-2031, (Thousand Units, AGR %) (W Shaped Recovery)
Figure 8.563 Africa Battery Electric Vehicle (BEV) Market Revenue, Forecast 2021-2031 (US$Mn, AGR %) (Pre COVID)
Figure 8.564 Africa Battery Electric Vehicle (BEV) Market Volume, Forecast 2021-2031 (Thousand Units, AGR %) (Pre COVID)
Figure 8.565 Africa Battery Electric Vehicle (BEV) Market Revenue, Forecast 2021-2031 (US$Mn, AGR %) (V Shaped Recovery)
Figure 8.566 Africa Battery Electric Vehicle (BEV) Market Volume, Forecast 2021-2031 (Thousand Units, AGR %) (V Shaped Recovery)
Figure 5.867 Africa Battery Electric Vehicle (BEV) Market Revenue, Forecast 2021-2031 (US$Mn, AGR %) (U Shaped Recovery)
Figure 8.568 Africa Battery Electric Vehicle (BEV) Market Volume, Forecast 2021-2031 (Thousand Units, AGR %) (U Shaped Recovery)
Figure 8.569 Africa Battery Electric Vehicle (BEV) Market Revenue, Forecast 2021-2031 (US$Mn, AGR %) (L Shaped Recovery)
Figure 8.570 Africa Battery Electric Vehicle (BEV) Market Volume, Forecast 2021-2031 (Thousand Units, AGR %) (L Shaped Recovery)
Figure 8.571 Africa Battery Electric Vehicle (BEV) Market Revenue, Forecast 2021-2031 (US$Mn, AGR %) (W Shaped Recovery)
Figure 8.572 Africa Battery Electric Vehicle (BEV) Market Volume, Forecast 2021-2031 (Thousand Units, AGR %) (W Shaped Recovery)
Figure 9.1 Leading Companies in the Global Battery Electric Vehicle (BEV) Market Share 2019 (%)
Figure 9.2 Tesla, Inc. Revenue and AGR, 2016 - 2019 (USD Million & %)
Figure 9.3 Tesla, Inc. Revenue Share, by Segment, 2018 and 2019 (%)
Figure 9.4 Tesla, Inc. Revenue Share, by Region, 2018 and 2019 (%)
Figure 9.5 Tesla, Inc. Vehicle Deliveries, 2019-Q1 – 2020-Q3 (Units)
Figure 9.6 Nissan Motor Corporation Revenue and AGR, 2016 - 2019 (USD Million & %)
Figure 9.7 Nissan Motor Corporation Revenue Share, by Segment, 2018 and 2019 (%)
Figure 9.8 Nissan Motor Corporation Revenue Share, by Region, 2018 and 2019 (%)
Figure 9.9 Renault S.A. Revenue and AGR, 2016 - 2019 (USD Million & %)
Figure 9.10 Renault S.A. Revenue Share, by Region, 2018 and 2019 (%)
Figure 9.11 Renault S.A. Electric Vehicle Sales, 2018 and 2019 (Units)
Figure 9.12 Bayerische Motoren Werke AG Revenue and AGR, 2016 - 2019 (USD Million & %)
Figure 9.13 Bayerische Motoren Werke AG Revenue Share, by Region, 2018 and 2019 (%)
Figure 9.14 Bayerische Motoren Werke AG Revenue Share, by Segment, 2018 and 2019 (%)
Figure 9.15 Beijing Automotive Industry Holding Co., Ltd. Revenue and AGR, 2016 - 2019 (USD Million & %)
Figure 9.16 Beijing Automotive Industry Holding Co., Ltd. Revenue Share, by Segment, 2018 and 2019 (%)
Figure 9.17 Volkswagen AG Revenue and AGR, 2016 - 2019 (USD Million & %)
Figure 9.18 Volkswagen AG Revenue Share, by Region, 2018 and 2019 (%)
Figure 9.19 Volkswagen AG Revenue Share, by Segment, 2018 and 2019 (%)
Figure 9.20 SAIC Motor Corporation Limited Revenue and AGR, 2016 - 2019 (USD Million & %)
Figure 9.21 SAIC Motor Corporation Limited Revenue Share, by Region, 2018 and 2019 (%)
Figure 9.22 SAIC Motor Corporation Limited Revenue Share, by Segment, 2018 and 2019 (%)
Figure 9.23 BYD Company Ltd. Revenue and AGR, 2016 - 2019 (USD Million & %)
Figure 9.24 BYD Company Ltd. Revenue Share, by Region, 2018 and 2019 (%)
Figure 9.25 BYD Company Ltd. Revenue Share, by Segment, 2018 and 2019 (%)
Figure 9.26 Zhejiang Geely Holding Group Co., Ltd. Revenue and AGR, 2016 - 2019 (USD Million & %)
Figure 9.27 Zhejiang Geely Holding Group Co., Ltd. Revenue Share, by Region, 2018 and 2019 (%)
Figure 9.28 Blue Bird Corporation Revenue and AGR, 2016 - 2020 (USD Million & %)
Figure 9.29 Blue Bird Corporation Revenue Share, by Region, 2019 and 2020 (%)
Figure 9.30 Blue Bird Corporation Revenue Share, by Segment, 2019 and 2020 (%)
Figure 9.31 Volvo Car Corporation Revenue and AGR, 2016 - 2019 (USD Million & %)
Figure 9.32 Volvo Car Corporation Revenue Share, by Region, 2018 and 2019 (%)
Figure 9.33 Volvo Car Corporation Revenue Share, by Segment, 2018 and 2019 (%)
Figure 9.34 Kia Corporation Revenue and AGR, 2016 - 2019 (USD Million & %)
Figure 9.35 General Motors Company Revenue and AGR, 2016 - 2019 (USD Million & %)
Figure 9.36 General Motors Company Revenue Share, by Region, 2018 and 2019 (%)
Figure 9.37 General Motors Company Revenue Share, by Segment, 2018 and 2019 (%)
Figure 9.38 Audi AG Revenue and AGR, 2016 - 2019 (USD Million & %)
Figure 9.39 Audi AG Revenue Share, by Region, 2018 and 2019 (%)
Figure 9.40 Audi AG Revenue Share, by Segment, 2018 and 2019 (%)
Figure 9.41 Hyundai Motor Company Revenue and AGR, 2016 - 2019 (USD Million & %)
Figure 9.42 Hyundai Motor Company Revenue Share, by Region, 2018 and 2019 (%)
Figure 9.43 Hyundai Motor Company Revenue Share, by Segment, 2018 and 2019 (%)
Figure 9.44 Tata Motors Limited Revenue and AGR, 2016 - 2019 (USD Million & %)
Figure 9.45 Porsche AG Revenue and AGR, 2016 - 2019 (USD Million & %)
Figure 9.46 Ford Motor Company Revenue and AGR, 2016 - 2019 (USD Million & %)
Figure 9.47 Ford Motor Company Revenue Share, by Region, 2018 and 2019 (%)
Figure 9.48 Ford Motor Company Revenue Share, by Segment, 2018 and 2019 (%)
Companies Profiled in the Report:
Audi AG
Bayerische Motoren Werke AG
Beijing Automotive Industry Holding Co., Ltd.
Blue Bird Corporation
BYD Company Ltd.
Chery Automobile Co., Ltd.
Ford Motor Company
General Motors Company
Hyundai Motor Company
Kia Corporation
Nissan Motor Corporation
Polestar AB
Porsche AG
Renault S.A.
SAIC Motor Corporation Limited
Tata Motors
Tesla, Inc.
Volkswagen AG
Volvo Cars
Zhejiang Geely Holding Group Co., Ltd
List of Companies Mentioned in the Report:
Acura
Advanced Battery Technologies Inc.
Ajanta Manufacturing Ltd.
Alpine
Ampere Vehicles Pvt Ltd (AMPVL)
Arrival Ltd
Atelier Girfalco Limited
Aurica Motors, LLC
Autocar
Autoexpress.com
Autolib
Automobile Dacia
Avon Cycles Limited
Bently Motors Ltd
BharatBenz
Blitz Electric Motors
Blue Bird
Boulder Electric Vehicle
Bugatti
Buick
Cadillac
Campagna Motors
Car2go
Chanje
Chevrolet
Chris Motors
Chrysler
COBUS Industries
Collins Bus Corp.
Complete Coach Works
Continental AG
Core Power (Fujian) New Energy Automobile Co., Ltd.
Crane Carrier
D'leteren
Daimler AG
Daimler Truck Financial
Deutsche Post
Dodge
Dongfeng Motor Group Co., Ltd (DFG)
Dubuc Motors
Ducati
E-Ride Industries
E-volution Elektromobilitätskonzepte GmbH
Eagle Electric Vehicle Manufacturing Co., Ltd
eBus
Ecocruise Electric Transportation, Inc.
EEBC (European Electrical Bus Company) GmbH
eGT New Energy Automotive Co., Ltd
Electric Vehicles Pty. Ltd.
Electrify America LLC
Electrotherm
Elgin
ENC
Energica Motor Company S.p.A.
EnVironmental Transportation Solutions
Estrima S.r.l.
Ferrari
Fiat Chrysler Automobiles
FINE mobile GmbH
Fisker Automotive
Ford Motor Company
Ford-Werke GmbH
Freightliner Group
FUSO
General Motors Company
Gillig
Global
GMC
Greenkraft
GreenPower Bus
Hangzhou Hangpai Electric Vehicle Co., Ltd
Heil Environmental
Hermes Group
Hero Electric Vehicles
Hino
Hitachi Automotive Systems
Hometown Coach
Hometown Trolley
Honda Motor (China) Investment co Ltd
Honda Motor Company
Hyundai Motor Company
IC Bus
Infineon Technologies AG
ISE
Isuzu
JAC Motors
Jaguar
Jeep
Jingzhou Xinwei Electric Vehicle Co., Ltd.
Johammer e-mobility GmbH
Joyor Scooter
Kaiser Permanente
Kalmar
Kandi Technologies Group, Inc.
Kantanka Car (Ghana)
Karma
Kenworth
Kia Motors Corporation
Kiira Motors (Uganda)
LADA
Lamborghini
Land Rover
Lexus
Lifan Industry (Group) Co., Ltd.
Lightning Car Company
Lightning Motorcycles
Lincoln
Lion Electric
Lohia Auto Industries
Mack
Mahindra & Mahindra Limited
Mahindra Electric Mobility Limited
Manufacturer - Med & Heavy-Duty
Maruti Suzuki India Ltd
MCI
McNeilus
Melex Ltd.
Mercedes-Benz
MINI
Mitsubishi Fuso Truck and Bus Corporation (FUSO)
Mitsubishi Motor Corporation
moovel GmbH
Morgan Motor Company
Motrec International Inc
Mytaxi
New Flyer
Ninghai Zhidou Electric Vehicles Company Limited
Nissan Motor Co Ltd
Nitehawk
Nova Bus
Orange EV
Peterbilt
Phoenix Cars LLC.
Polestar Automotive USA
Porsche AG
Power Vehicle Innovation (PVI)
Proterra
Qingdao Green.Tec Electric Technology Co., Ltd
RAM
Renault Samsung Motors
Renault-Nissan Mitsubishi Alliance
Robert Bosch GmbH
Rolls-Royce Motor Cars
Schwarze Industries
Setra
Shockwave Motors, Inc.
Skoda Auto
smart
Smith Electric Vehicles
Starcraft
Stevens Vehicles Ltd
StreetScooter GmbH
Subaru
Tazzari Group
Terra Motors Corporation
Thomas Built Buses
TICO
Toyata Kirloskar Motor
Toyota Motor Corporation
Turtle Top
TYMCO
US Hybrid
Vectrix
Victory Motorcycles
Western Star Trucks
Workhorse
X-Treme Scooters Brand
YangZhou Dawn Electric Vehicle Co., Ltd
Z Electric Vehicle Corporation
Zero Motorcycles
ZeroTruck
Zhuhai Firefox Electric Vehicle Co., Ltd.
Zotye Automobile Co Ltd.
List of Organizations Mentioned in the Report:
Association des Constructeurs Européens d'Automobiles (ACEA)
AVERE The European Association for Electromobility
Electric Drive Transportation Association (EDTA)
Electric Vehicle Association of Asia Pacific (EVAAP)
European Commission
European or United Nations Economic Commission for Europe (“UN-ECE”)
European Union (EU)
International Council on Clean Transportation
International Energy Agency (IEA)
International Organization for Standardization (ISO)
Japan Automobile Research Institute
National Highway Traffic Safety Administration (“NHTSA”)
Netherlands Enterprise Agency
Organization Internationale des Constructeurs d'Automobiles (OICA)
Sustainable Energy Authority of Ireland
The Association for Renewable Energy & Clean Technology
U.S. Department of Energy
U.S. Department of Energy's Office of Energy Efficiency and Renewable Energy
United States International Trade Commission (USITC)
World Electric Vehicle Association (WEVA)
Download sample pages
Complete the form below to download your free sample pages for Battery Electric Vehicle (BEV) Market Report 2021-2031Related reports
-

Fuel Cell Electric Vehicle (FCEV) Market Report 2022-2032
The worldwide fuel cell market is rising due to rising demand for portable devices and growing manufacturing capacity of hydrogen...Full DetailsPublished: 02 March 2022 -

Flexible Battery Storage Market Report 2021-2031
The proliferation of the internet and smartphones around the world, as well as increased focus on medical device R&D and...Full DetailsPublished: 10 September 2021 -

Automotive Composites Market Report 2020-2030
This report evaluates the current levels of global investment in the Automotive Composites market. Over the next decade, this industry...
Full DetailsPublished: 01 May 2020 -

Automotive Bushing Market Report 2020-2030
The automotive bushing market is about to enter a period of phenomenal growth and innovation. The next ten years will...
Full DetailsPublished: 01 January 1970 -
Wireless Electric Vehicle Charging (WEVC) Market Report 2019-2029
The increase in the price of petrol and diesel over the years across the globe has increased the demand for...Full DetailsPublished: 23 August 2019 -

Lithium-Ion Battery Market Report 2021-2031
Enormous growth in the production of lithium-ion batteries is driven by its demand in automobile, industrial, and commercial applications. Big...Full DetailsPublished: 15 March 2021 -

Auto Electrification Market Report 2022-2032
The auto electrification market was valued at US$82.7 billion in 2021 and is projected to grow at a CAGR of...Full DetailsPublished: 30 September 2022 -

EV On-Board Battery Charger Market Report 2022-2032
The global EV On-board Battery Charger market was valued at US$12.2 billion in 2021 and is projected to grow at...Full DetailsPublished: 19 July 2022 -

Electric Vehicle Market Report to 2031
Growing demand of safety and easy commute, government regulations and subsidies and initiative to develop charging stations will open the...Full DetailsPublished: 01 January 1970 -

Hybrid Vehicle Market Report to 2031
The market is anticipated to witness positive growth over the forecast period, despite the disruptions created by COVID-19 in the...Full DetailsPublished: 01 January 1970
Download sample pages
Complete the form below to download your free sample pages for Battery Electric Vehicle (BEV) Market Report 2021-2031Do you have any custom requirements we can help you with?
Any specific country, geo region, market segment or specific company information?
Email us today, we can discuss your needs and see how we can help: jamie.roberts@visiongain.com
Would you like a free report overview of the report of your choice?
If so, please drop an email to Jamie Roberts stating your chosen report title to jamie.roberts@visiongain.com
Visiongain automotive reports are compiled using a broad and rich mixture of both primary and secondary information to produce an overall industry outlook. In order to provide our clients with the best product possible product, we do not rely on any one single source of information. Visiongain analysts reach out to market-leading vendors and automotive industry experts but also review a wealth of financial data and product information from a vast range of sources. To find out more about our reports methodology please email jamie.roberts@visiongain.com
Would you like to get the latest Visiongain automotive reports catalogue?
What are the dynamic growth sectors? where are the regional business opportunities?
Which technologies will prevail and who are the leading companies succeeding in these sectors and why?
If you want definitive answers to business critical questions, discover Visiongain’s full range of business intelligence reports.
If so, please email Jamie Roberts on jamie.roberts@visiongain.com or call her today on +44 207 336 6100
Alliance of Automobile Manufacturers (USA)
Association of Russian Automakers
Audio Video Bridging (AVB)
China Association Of Automoblie Manufacturers
European Association of Automotive Suppliers
European Automobile Manufacturers’ Association
European Council for Automotive Research and Development
Former Society of Automotive Engineers
German Association of the Automotive Industry
International Organization of Motor Vehicle Manufacturers
In-Vehicle Infotainment (IVI)
Italian Association of the Automotive Industry
Japan Automobile Manufacturers Association
One-Pair Ether-Net
Society of Indian Automobile Manufacturers (SIAM)
Society of Motor Manufacturers and Traders
The International Council For Clean Transport
US National Highway Traffic Safety Administration
Don’t Miss Out!
Latest Automotive news
Hydrogen Vehicle Market
The global Hydrogen Vehicle market was valued at US$23.34 billion in 2023 and is projected to grow at a CAGR of 22.7% during the forecast period 2024-2034.
17 May 2024
Autonomous Vehicle Market
The global Autonomous Vehicle market was valued at US$35.4 billion in 2023 and is projected to grow at a CAGR of 22.7% during the forecast period 2024-2034.
16 May 2024
Automotive Infotainment Market
The global Automotive Infotainment market is estimated at US$20.2 billion in 2023 and is projected to grow at a CAGR of 6.3% during the forecast period 2024-2034.
14 May 2024
Automotive Cyber Security Market
The global Automotive Cyber Security market was valued at US$2,991.6 million in 2024 and is projected to grow at a CAGR of 19.4% during the forecast period 2024-2034.
13 May 2024


