This latest report by business intelligence provider Visiongain assesses that the global Smart Ports market is expected to grow at a lucrative rate during the forecast period.
Ports around the world forms considerable revenue share of the nation’s GDP are moving forward to become move attractive and competitive. This factor is mainly driving the port authorities to integrate smart solutions across the port. Technologies such as artificial intelligence, the Internet of Things (IoT), big data and other technological solutions all allow ports to become more intelligent in terms of flow, situation and customer management. The technology is still infancy, however the most recent example of the development of smart port are port in Hamburg and Amsterdam. In collaboration with Cisco, Hamburg has integrated sensors, camera systems and smart lights on roads in order to monitor traffic, anticipate the lifting of a bridge or clear a road after an accident, facilitate the movement of barges when the traffic is saturated, etc. This type of “smart” innovation is particularly relevant because it addresses all critical aspects of port activities. For instance, it allows the improvement of the overall productivity of terminals and port complexes, mitigates the effects of pre- and post-routing movements on the population while reducing contamination, and even decreases the number of accidents.
Smart Ports have been segmented on the basis of Technology which includes IoT, Blockchain, Process Automation, and Artificial Intelligence. Adoption of smart port technology is mainly dependent to an overall business strategy, prioritized problems, available options in order to maximize return on investment. Many facilities have adopted one smart-port technology or another, but leading ports, such as Hamburg, have tied multiple individual systems into a single interconnected port-wide platform. This type of platform integrates data from such sources as sensors, mobile devices, and various stakeholders’ databases.
Smart Ports encompasses three discrete sub segments
Global Smart Ports market is segmented by Port Type, Components, Technology, and Throughput Capacity.
Based on the Port Type the global Smart Ports market is segmented as Seaport, and Inland Port.
Based on the Components the global Smart Ports market is segmented into Terminal Automation & cargo handling, traffic management systems, smart safety and security, port community systems, and smart port infrastructure.
Based on the throughput capacity the global Smart Ports market is segmented into extensively busy smart ports, moderately busy ports, and scarcely busy smart ports.
Based on the geographic penetration the global Smart Ports market is segmented as North America, Europe, Asia-Pacific, MEA and Latin America.
The 213 page report provides clear, detailed insight into the global Smart Ports market. Discover the key drivers and challenges affecting the market.
Report Scope
The report delivers considerable added value by revealing:
• 190 tables, charts and graphs are analysing and revealing the growth prospects and outlook for the Smart Ports market.
• Global Smart Ports market forecasts and analysis from 2020-2030.
• Smart Ports market provides CAPEX forecasts and analysis from 2020-2030 for the Smart Ports submarkets:
Top 5 prominent Countries in the Smart Ports market
UK
India
Australia
South Korea
China
Top 5 companies in the Smart Ports market
Siemens AG
General Electric
IBM
Telephonica SA
Cisco Systems, Inc.
IBM announced partnership with Europe largest port. Using their IBM Internet of Things (IoT) technologies and IBM Cloud, the company will create a digital twin of the port – an exact digital replica of our operations that will mirror all resources at the port of Rotterdam, tracking ship movements, infrastructure, weather, geographical and water depth data with 100% accuracy.
General Electric announced partnership with Port of Los Angeles on a six-month pilot project to make logistics run more efficiently. The port has installed GE software to pull together data about the locations and arrivals of ships, and the availability of trucks and rail cars needed to carry the cargo away. Further, the two are working with terminal operators, shipping lines, cargo interests, truckers, and railroads on a pilot project to gather as much information as possible on shipments, and to funnel that data through a single electronic window, or portal.
Awake.AI and Silo.AI together announced the launch of machine learning based cargo ship arrival prediction system, which can be used to provide forecasts of estimated times of arrival and departure for vessel port calls. Further, the two also announced plans to develop computer vision based system that analyses and monitors cargo and vehicles in a port in real time, providing data that can be used to improve the efficiency of cargo logistics planning while also improving the detection of anomalous situations as they happen.
Accenture announced the acquisition of product design and innovation agency VanBerlo to help clients to help clients build smart connected solutions. The acquisition will strengthen Accenture’s capabilities to help clients benefit from the merging of physical products and digital services
The report provides detailed profiles of key companies operating within the Smart Ports market:
• Siemens AG
• General Electric
• IBM
• Telephonica SA
• Cisco Systems, Inc.
• Accenture Plc
• ABB Ltd.
• Wipro Limited
• Trelleborg AB
• Royal Haskoning
• Traxen
• Awake.AI
as well as key analysis and assessment of other important players
This independent, 213 page report guarantees you will remain better informed than your competition. With more than 122 tables and figures examining the Smart Ports market space, the report gives you a visual, one-stop breakdown of your market. PLUS, capital expenditure forecasts, as well as analysis, from 2020-2030 keeps your knowledge that one step ahead that you require to succeed.
This report is essential reading for you or anyone in the transportation sector with an interest in Smart Ports. Purchasing this report today will help you to recognise those important market opportunities and understand the possibilities there. I look forward to receiving your order.
Buy our report today Smart Ports Market Research: Forecasts by Technology (IoT, Blockchain, Process Automation, Artificial Intelligence) & by Component (Terminal Automation & Cargo Handling, Traffic Management Systems, Smart Safety & Security, Port Community Systems and Smart Port Infrastructure), Analysis of Technological Advancements Driving the Market. Avoid missing out by staying informed – order our report now.
Visiongain is a trading partner with the US Federal Government
CCR Ref number: KD4R6
Do you have any custom requirements we can help you with? Any need for specific country, geo region, market segment or specific company information? Contact us today, we can discuss your needs and see how we can help: sara.peerun@visiongain.com
1. Report Overview
1.1 Smart Ports Market Overview
1.2 Why You Should Read This Report
1.3 How This Report Delivers
1.4 Key Questions Answered by this Analytical Report include
1.5 Who is This Report for?
1.6 Methodology
1.6.1 Secondary Research
1.6.2 Market Evaluation & Forecasting Methodology
1.7 Frequently Asked Questions (FAQ)
1.8 Associated Visiongain Reports
1.9 About Visiongain
2. Introduction to the Smart Ports Market
2.1 Smart Ports Market Structure in 2020
2.2 Smart Ports Market Definition
2.3 Smart Ports Technology Submarkets Definitions
2.3.1 IoT
2.3.2 Blockchain
2.3.3 Process Automation
2.3.4 Artificial Intelligence
2.4 Smart Ports Components Submarkets Definitions
2.4.1 Traffic Management Systems
2.4.2 Terminal Automation & Cargo Handling
2.4.3 Smart Safety & Security
2.4.4 Port Community Systems
2.5 Smart Ports Throughput Capacity Submarkets Definitions
2.5.1 Extensively Busy Ports
2.5.2 Moderately Busy Ports
2.5.3 Scarcely Busy Smart Ports
2.6 Smart Ports Port Type Submarkets Definitions
2.6.1 Seaports
2.6.2 Inland Ports
3. Smart Ports Market 2020-2030
3.1 Smart Ports Market Forecast 2020-2030
3.2 Smart Ports Drivers & Restraints
3.2.1 Smart Ports Market Drivers 2020
3.2.2 Smart Ports Market Restraints 2020
3.2.3 Trends in the Smart Ports 2020
3.2.4 Smart Ports Market Opportunities 2020
3.2.5 Smart Ports Market – Major Initiatives
4. Smart Ports Submarket Forecast 2020-2030
4.1 Smart Ports Technology Forecast 2020-2030
4.1.1 IoT Forecast by Region 2020-2030
4.1.2 Blockchain Forecast by Region 2020-2030
4.1.3 Process Automation Forecast by Region 2020-2030
4.1.4 Artificial Intelligence Forecast by Region 2020-2030
4.2 Smart Ports Components Forecast 2020-2030
4.2.1 Terminal Automation & Cargo Handling Smart Ports Forecast 2020-2030
4.2.2 Traffic Management Systems Smart Ports Forecast 2020-2030
4.2.3 Smart Safety & Security Smart Ports Forecast 2020-2030
4.2.4 Port Community Systems Smart Ports Forecast 2020-2030
4.2.5 Smart Port Infrastructure Smart Ports Forecast 2020-2030
4.3 Smart Ports Throughput Capacity Forecast 2020-2030
4.3.1 Extensively Busy Ports Forecast by Region 2020-2030
4.3.2 Moderately Busy Smart Ports Forecast by Region 2020-2030
4.3.3 Scarcely Busy Smart Ports Forecast by Region 2020-2030
4.4 Smart Ports Port Type Forecast 2020-2030
4.4.1 Seaport Forecast by Region 2020-2030
4.4.2 Inland ports Forecast by Region 2020-2030
5. Leading Regional Smart Ports Markets Forecast 2020-2030
5.1 Overview of Regional Smart Ports Market Forecast
5.2 North America Smart Ports Market Forecast 2020-2030
5.2.1 North America Smart Ports Technology Forecast 2020-2030
5.2.2 North America Smart Ports Components Forecast 2020-2030
5.2.3 North America Smart Ports Throughput Capacity Forecast 2020-2030
5.2.4 North America Smart Ports Port Type Forecast 2020-2030
5.2.5 North America Smart Ports Market Country Forecast 2020-2030
5.2.5.1 US Smart Ports Market Forecast 2020-2030
5.2.5.2 Canada Smart Ports Market Forecast 2020-2030
5.3 Europe Smart Ports Market Forecast 2020-2030
5.3.1 Europe Smart Ports Technology Forecast 2020-2030
5.3.2 Europe Smart Ports Components Forecast 2020-2030
5.3.3 Europe Smart Ports Throughput Capacity Forecast 2020-2030
5.3.4 Europe Smart Ports Port Type Forecast 2020-2030
5.3.5 Europe Smart Ports Market Country Forecast 2020-2030
5.3.5.1 UK Smart Ports Market Forecast 2020-2030
5.3.5.2 Russia Smart Ports Market Forecast 2020-2030
5.3.5.3 France Smart Ports Market Forecast 2020-2030
5.3.5.4 Germany Smart Ports Market Forecast 2020-2030
5.3.5.5 Italy Smart Ports Market Forecast 2020-2030
5.3.5.6 Netherlands Smart Ports Market Forecast 2020-2030
5.4 Asia-Pacific Smart Ports Market Forecast 2020-2030
5.4.1 Asia-Pacific Smart Ports Technology Forecast 2020-2030
5.4.2 Asia-Pacific Smart Ports Components Forecast 2020-2030
5.4.3 Asia Pacific Smart Ports Throughput Capacity Forecast 2020-2030
5.4.4 Asia Pacific Smart Ports Port Type Forecast 2020-2030
5.4.5 Asia-Pacific Smart Ports Market Country Forecast 2020-2030
5.4.5.1 China Smart Ports Market Forecast 2020-2030
5.4.5.2 Japan Smart Ports Market Forecast 2020-2030
5.4.5.3 India Smart Ports Market Forecast 2020-2030
5.4.5.4 South Korea Smart Ports Market Forecast 2020-2030
5.4.5.5 Australia Smart Ports Market Forecast 2020-2030
5.5 MEA Smart Ports Market Forecast 2020-2030
5.5.1 MEA Smart Ports Technology Forecast 2020-2030
5.5.2 MEA Smart Ports Components Forecast 2020-2030
5.5.3 MEA Smart Ports Throughput Capacity Forecast 2020-2030
5.5.4 MEA Smart Ports Port Type Forecast 2020-2030
5.5.5 MEA Smart Ports Market Country Forecast 2020-2030
5.5.5.1 Saudi Arabia Smart Ports Market Forecast 2020-2030
5.5.5.2 UAE Smart Ports Market Forecast 2020-2030
5.5.5.3 South Africa Smart Ports Market Forecast 2020-2030
5.6 Latin America Smart Ports Market Forecast 2020-2030
5.6.1 Latin America Smart Ports Technology Forecast 2020-2030
5.6.2 Latin America Smart Ports Components Forecast 2020-2030
6. SWOT Analysis of the Global Smart Ports Market 2020-2030
7. Five Forces Analysis of the Global Smart Ports Market 2020-2030
8. Competitive Landscape - 13 Smart Ports Companies
8.1 Comparative Analysis of 13 Leading Smart Ports Companies 2020
8.2 ABB LTD.
8.2.1 Introduction
8.2.2 ABB LTD. Total Company Sales 2015-2019
8.2.3 ABB LTD. Total Company Sales Share (%) by Business Segment 2019
8.2.4 ABB Ltd. Sales Share (%) by Region 2019
8.2.5 ABB Ltd. Selected Recent Acquisitions, Contracts, and New Product Launches 2018
8.2.6 ABB Ltd.: Strategic Overview of the Smart Ports Market
8.2.7 ABB Ltd. Primary Market Competitors 2020
8.3 Accenture Plc
8.3.1 Introduction
8.3.2 Accenture Plc Total Company Sales 2015-2019
8.3.3 Accenture Plc Total Company Sales Share (%) by Business Segment 2019
8.3.4 Accenture Plc Sales Share (%) By Region 2019
8.3.5 Accenture Plc Selected Recent Acquisitions, Contracts, and New Product Launches 2017-2020
8.3.6 Accenture Plc: Strategic Overview of the Smart Ports Market
8.3.7 Accenture Plc Primary Market Competitors 2020
8.4 Awake.AI
8.4.1 Introduction
8.4.2 Awake.AI Selected Recent Acquisitions, Contracts, and New Product Launches 2020
8.4.3 Awake.AI: Strategic Overview of the Smart Ports Market
8.4.4 Awake.AI Primary Market Competitors 2020
8.5 Cisco Systems, Inc.
8.5.1 Introduction
8.5.2 Cisco Systems, Inc. Total Company Sales 2015-2019
8.5.3 Cisco Systems, Inc. Total Company Sales by Business Segment 2019
8.5.4 Cisco Systems, Inc. By Region (%) 2019
8.5.5 Cisco Systems, Inc.: Strategic Overview of the Smart Ports Market
8.5.6 Cisco Systems, Inc. Primary Market Competitors 2020
8.6 General Electric
8.6.1 Introduction
8.6.2 General Electric Total Company Sales 2014-2019
8.6.3 General Electric Total Company Sales Share (%) by Business Segment 2019
8.6.4 General Electric Sales Share (%) By Region 2019
8.6.5 General Electric Selected Recent Acquisitions, Contracts, and New Product Launches 2018
8.6.6 General Electric: Products & Service Overview in the Smart Ports Market
8.6.7 General Electric Primary Market Competitors 2020
8.7 15.6 IBM
8.7.1 Introduction
8.7.2 IBM Total Company Sales 2015-2019
8.7.3 IBM Total Company Sales by Business Segment 2019
8.7.4 IBM Revenue By Region 2019
8.7.5 IBM Selected Recent Acquisitions, Contracts, and New Product Launches 2017-2019
8.7.6 IBM: Strategic Overview in the global Smart Port Market
8.7.7 IBM Primary Market Competitors 2020
8.8 Port Automation
8.8.1 Introduction
8.8.2 Port Automation Selected Recent Acquisitions, Contracts, and New Product Launches 2018-2019
8.8.3 Port Automation Primary Market Competitors 2020
8.9 Royal Haskoning
8.9.1 Introduction
8.9.2 Royal Haskoning Selected Recent Acquisitions, Contracts, and New Product Launches 2018-2019
8.9.3 Royal Haskoning: Strategic Overview of the Smart Ports Market
8.9.4 Royal Haskoning Primary Market Competitors 2020
8.10 Siemens AG
8.10.1 Introduction
8.10.2 Siemens AG Total Company Sales 2015-2019
8.10.3 Siemens AG Total Company Sales Share (%) by Business Segment 2019
8.10.4 Siemens AG Sales Share (%) By Region 2019
8.10.5 Siemens AG Selected Recent Acquisitions, Contracts, and New Product Launches 2017-2018
8.10.6 Siemens AG: Strategic Overview of the Smart Ports Market
8.10.7 Siemens AG Primary Market Competitors 2020
8.11 Telefonica SA
8.11.1 Introduction
8.11.2 Telefonica SA Total Company Sales 2015-2019
8.11.3 Telefonica SA Total Company Sales by Business Segment 2019
8.11.4 Telefonica SA Revenue Share By Region 2019
8.11.5 Telefonica SA Selected Recent Acquisitions, Contracts, and New Product Launches 2018-2019
8.11.6 Telefonica SA: Strategic Overview of the Smart Port Market
8.11.7 Telefonica SA Primary Market Competitors 2020
8.12 Traxen
8.12.1 Introduction
8.12.2 Traxen Selected Recent Acquisitions, Contracts, and New Product Launches 2018-2020
8.12.3 Traxen: Strategic Overview of the Smart Ports Market
8.12.4 Traxen Primary Market Competitors 2020
8.13 Trelleborg AB
8.13.1 Introduction
8.13.2 Trelleborg AB Total Company Sales 2015-2019
8.13.3 Trelleborg AB Total Company Sales Share (%) by Business Segment 2019
8.13.4 Trelleborg AB Sales Share (%) By Region 2019
8.13.5 Trelleborg AB Selected Recent Acquisitions, Contracts, and New Product Launches 2017-2019
8.13.6 Trelleborg AB Primary Market Competitors 2020
8.14 Wipro Limited
8.14.1 Introduction
8.14.2 Wipro Limited Total Company Sales 2015-2019
8.14.3 Wipro Limited Total Company Sales Share (%) by Business Segment 2019
8.14.4 Wipro Limited Sales Share (%) By Region 2019
8.14.5 Wipro Limited Selected Recent Acquisitions, Contracts, and New Product Launches 2019
8.14.6 Wipro Limited Primary Market Competitors 2020
8.15 Other Companies in Smart Ports Market
9. Conclusions and Recommendations
10. Awake AI Interview – Question and Answers
11. Glossary
12. Associated Visiongain Reports
13. Visiongain Report Sales Order Form
14. Appendix A
14.1 About Visiongain
15. Appendix B
15.1 Visiongain report evaluation form
List of Tables
Table 3.1 Smart Ports Market Forecast 2020-2030 (US$ million, AGR %, CAGR %, Cumulative)
Table 3.2 Smart Ports Market Drivers, Restraints, Trends and Opportunities 2020
Table 3.3 Port Type, Key Strategic Issues and Available solutions
Table 3.4: Smart Port Major Initiatives, 2020
Table 4.1 Smart Ports End Submarket Forecast 2020-2030 (US$ million, AGR %, Cumulative)
Table 4.2 IoT Submarket by Regional Market Forecast 2020-2030 (US$ million, AGR %, CAGR %, Cumulative)
Table 4.3 Blockchain Submarket by Regional Market Forecast 2020-2030 (US$ million, AGR %, CAGR %, Cumulative)
Table 4.4 Process Automation Submarket by Regional Market Forecast 2020-2030 (US$ million, AGR %, CAGR %, Cumulative)
Table 4.5 Artificial Intelligence Submarket by Regional Market Forecast 2020-2030 (US$ million, AGR %, CAGR %, Cumulative)
Table 4.6 Smart Ports Components Submarket Forecast 2020-2030 (US$ million, AGR %, CAGR %, Cumulative)
Table 4.7 Terminal Automation & Cargo Handling Submarket by Regional Market Forecast 2020-2030 (US$ million, AGR %, CAGR %, Cumulative)
Table 4.8 Traffic Management Systems Submarket by Regional Market Forecast 2020-2030 (US$ million, AGR %, CAGR %, Cumulative)
Table 4.9 Smart Safety & Security Submarket by Regional Market Forecast 2020-2030 (US$ million, AGR %, CAGR %, Cumulative)
Table 4.10 Port Community Systems Submarket by Regional Market Forecast 2020-2030 (US$ million, AGR %, CAGR %, Cumulative)
Table 4.11 Smart Port Infrastructure Submarket by Regional Market Forecast 2020-2030 (US$ million, AGR %, CAGR %, Cumulative)
Table 4.12 Smart Ports Throughput Capacity Submarket Forecast 2020-2030 (US$ million, AGR %, Cumulative)
Table 4.13 Extensively Busy Ports Submarket by Regional Market Forecast 2020-2030 (US$ million, AGR %, CAGR %, Cumulative)
Table 4.14 Moderately Busy Smart Ports Submarket by Regional Market Forecast 2020-2030 (US$ million, AGR %, CAGR %, Cumulative)
Table 4.15 Scarcely Busy Smart Ports Submarket by Regional Market Forecast 2020-2030 (US$ million, AGR %, CAGR %, Cumulative)
Table 4.16 Smart Ports Port Type Submarket Forecast 2020-2030 (US$ million, AGR %, Cumulative)
Table 10.2 Seaport Submarket by Regional Market Forecast 2020-2030 (US$ million, AGR %, CAGR %, Cumulative)
Table 4.17 Inland ports Submarket by Regional Market Forecast 2020-2030 (US$ million, AGR %, CAGR %, Cumulative)
Table 5.1 Leading Regional Smart Ports Markets by Submarket Forecast 2020-2030 (US$ million, Global AGR %, Cumulative)
Table 5.3 North America Smart Ports Market Forecast by Technology 2020-2030 (US$ million, Cumulative)
Table 5.4 North America Smart Ports Market Forecast by Components 2020-2030 (US$ million, Cumulative)
Table 5.5 North America Smart Ports Market Forecast by Throughput Capacity 2020-2030 (US$ million, Cumulative)
Table 5.6 North America Smart Ports Market Forecast by Port Type 2020-2030 (US$ million, Cumulative)
Table 5.7 North America Smart Ports Market Forecast by Country 2020-2030 (US$ million, AGR %, Cumulative)
Table 5.11 Europe Smart Ports Market Forecast by Technology 2020-2030 (US$ million, Cumulative)
Table 5.12 Europe Smart Ports Market Forecast by Components 2020-2030 (US$ million, Cumulative)
Table 5.13 Europe Smart Ports Market Forecast by Throughput Capacity 2020-2030 (US$ million, Cumulative)
Table 5.14 Europe Smart Ports Market Forecast by Port Type 2020-2030 (US$ million, Cumulative)
Table 5.15 Europe Smart Ports Market Forecast by Country 2020-2030 (US$ million, AGR %, CAGR %, Cumulative)
Table 5.23 Asia-Pacific Smart Ports Market Forecast by Technology 2020-2030 (US$ million, CAGR %)
Table 5.24 Asia-Pacific Smart Ports Market Forecast by Components 2020-2030 (US$ million, Cumulative)
Table 5.25 Asia Pacific Smart Ports Market Forecast by Throughput Capacity 2020-2030 (US$ million, Cumulative)
Table 5.26 Asia Pacific Smart Ports Market Forecast by Port Type 2020-2030 (US$ million, Cumulative)
Table 5.34 MEA Smart Ports Market Forecast by Technology 2020-2030 (US$ million, Cumulative)
Table 5.35 MEA Smart Ports Market Forecast by Components 2020-2030 (US$ million, Cumulative)
Table 5.36 MEA Smart Ports Market Forecast by Throughput Capacity 2020-2030 (US$ million, Cumulative)
Table 5.37 MEA Smart Ports Market Forecast by Port Type 2020-2030 (US$ million, Cumulative)
Table 5.43 Latin America Smart Ports Market Forecast by Technology 2020-2030 (US$ million, Cumulative)
Table 5.44 Latin America Smart Ports Market Forecast by Components 2020-2030 (US$ million, Cumulative)
Table 8.1 Leading 13 Smart Ports Companies (Company, FY 2019 Total Company Sales US $m*Latest, HQ)
Table 8.2 ABB LTD. Profile 2019 (CEO, Total Company Sales US$mn, HQ, Founded, No. of Employees, Website)
Table 8.3 ABB LTD. Total Company Sales 2015-2019 (US$ million, AGR%)
Table 8.4 ABB Ltd. Selected Recent Acquisitions, Contracts, and New Product Launches 2018 (Date, Programme Type, Details)
Table 8.5 Accenture Plc Profile 2019 (CEO, Total Company Sales US$mn, HQ, Founded, No. of Employees, Website)
Table 8.6 Accenture Plc Total Company Sales 2015-2019 (US$ million, AGR%)
Table 8.7 Accenture Plc Selected Recent Acquisitions, Contracts, and New Product Launches 2017-2020 (Date, Programme Type, Details)
Table 8.8 Awake.AI Profile 2019 (CEO, HQ, Founded, Website)
Table 8.9 Awake.AI Selected Recent Acquisitions, Contracts, and New Product Launches 2020 (Date, Programme Type, Details)
Table 8.10 Cisco Systems, Inc. Profile 2019 (CEO, Total Company Sales US$Mn, HQ, Founded, No. of Employees, Website)
Table 8.12 General Electric Profile 2019 (CEO, Total Company Sales US$mn, HQ, Founded, No. of Employees, Website)
Table 8.13 General Electric Total Company Sales 2015-2019 (US$ million, AGR%)
Table 8.14 General Electric Selected Recent Acquisitions, Contracts, and New Product Launches 2018 (Date, Programme Type, Details)
Table 8.15 IBM Profile 2019 (CEO, Total Company Sales US$bn, HQ, Founded, No. of Employees, Website)
Table 8.16 IBM Total Company Sales 2015-2019 (US$ million, AGR%)
Table 8.17 IBM Selected Recent Acquisitions, Contracts, and New Product Launches 2017-2019 (Date, Programme Type, Details)
Table 8.18 Port Automation Profile 2019 (CEO, HQ, Founded, No. of Employees, Website)
Table 8.19 Port Automation Selected Recent Acquisitions, Contracts, and New Product Launches 2018-2019 (Date, Programme Type, Details)
Table 8.20 Royal Haskoning Profile 2019 (Director, HQ, Founded, No. of Employees, Website)
Table 8.21 Royal Haskoning Selected Recent Acquisitions, Contracts, and New Product Launches 2018-2019 (Date, Programme Type, Details)
Table 8.22 Siemens AG Profile 2019 (CEO, Total Company Sales US$mn, HQ, Founded, No. of Employees, Website)
Figure 8.24 Siemens AG Total Company Sales 2015-2019 (US$ million, AGR%)
Table 8.24 Siemens AG Selected Recent Acquisitions, Contracts, and New Product Launches 2017-2018 (Date, Programme Type, Details)
Table 8.25 Telefonica SA Profile 2019 (CEO, Total Company Sales US$mn, HQ, Founded, No. of Employees, Website)
Figure 8.28 Telefonica SA Total Company Sales 2015-2019 (US$ million, AGR%)
Table 8.27 Telefonica SA Selected Recent Acquisitions, Contracts, and New Product Launches 2018-2019 (Date, Programme Type, Details)
Table 8.28 Traxen Profile 2019 (CEO, Total Company Sales US$mn, HQ, Founded, No. of Employees, Website)
Table 8.29 Traxen Selected Recent Acquisitions, Contracts, and New Product Launches 2018-2020 (Date, Programme Type, Details)
Table 8.30 Trelleborg AB Profile 2019 (CEO, Total Company Sales US$mn, HQ, Founded, No. of Employees, Website)
Table 8.31 Trelleborg AB Total Company Sales 2015-2019 (US$ million, AGR%)
Table 8.32 Trelleborg AB Selected Recent Acquisitions, Contracts, and New Product Launches 2017-2019 (Date, Programme Type, Details)
Table 8.33 Wipro Limited Profile 2019 (CEO, Total Company Sales US$mn, HQ, Founded, No. of Employees, Website)
Table 8.34 Wipro Limited Total Company Sales 2015-2019 (US$ million, AGR%)
Table 8.35 Wipro Limited Selected Recent Acquisitions, Contracts, and New Product Launches 2019 (Date, Programme Type, Details)
Table 8.36 Other Companies in the Smart Ports Market
List of Figures
Figure 2.1 Smart Ports Market Segmentation Overview
Figure 2.2 Smart Ports Market Segmentation Overview
Figure 3.1 Smart Ports Market Forecast 2020-2030 (US$ million, Global AGR %)
Figure 4.1 Smart Ports End Submarket AGR Forecast 2020-2030 (AGR %)
Figure 4.2 Smart Ports Application Market Forecast 2020-2030 (US$ million, Global AGR %)
Figure 4.3 Smart Ports Component Submarket Shares Forecast 2020, 2025, 2030 (% Share)
Figure 4.4 IoT Submarket Forecast by Regional Market 2020-2030 (US$ million)
Figure 4.5 IoT Share by Region 2020, 2025, 2030 (% Share)
Figure 4.6 Blockchain Submarket Forecast by Regional Market 2020-2030 (US$ million)
Figure 4.7 Blockchain Market Share by Region 2020, 2025, 2030 (% Share)
Figure 4.8 Process Automation Submarket Forecast by Regional Market 2020-2030 (US$ million)
Figure 4.9 Process Automation Share by Region 2020, 2025, 2030 (% Share)
Figure 4.10 Artificial Intelligence Submarket Forecast by Regional Market 2020-2030 (US$ million)
Figure 4.11 Artificial Intelligence Share by Region 2020, 2025, 2030 (% Share)
Figure 4.12 Smart Ports Components Submarket AGR Forecast 2020-2030 (AGR %)
Figure 4.13 Smart Ports Components Forecast 2020-2030 (US$ million, Global AGR %)
Figure 4.14 Smart Ports Components Shares 2020, 2025, 2030 (% Share)
Figure 4.15 Terminal Automation & Cargo Handling Submarket Forecast by Regional Market 2020-2030 (US$ million)
Figure 4.16 Terminal Automation & Cargo Handling Share by Region 2020, 2025, 2030 (% Share)
Figure 4.17 Traffic Management Systems Submarket Forecast by Regional Market 2020-2030 (US$ million)
Figure 4.18 Traffic Management Systems Share by Region 2020, 2025, 2030 (% Share)
Figure 4.19 Smart Safety & Security Submarket Forecast by Regional Market 2020-2030 (US$ million)
Figure 4.20 Smart Safety & Security Share by Region 2020, 2025, 2030 (% Share)
Figure 4.21 Port Community Systems Submarket Forecast by Regional Market 2020-2030 (US$ million)
Figure 4.22 Port Community Systems Share by Region 2020, 2025, 2030 (% Share)
Figure 4.23 Smart Port Infrastructure Submarket Forecast by Regional Market 2019-2030 (US$ million)
Figure 4.24 Smart Port Infrastructure Share by Region 2020, 2025, 2030 (% Share)
Figure 4.25 Smart Ports Throughput Capacity Submarket AGR Forecast 2020-2030 (AGR %)
Figure 4.26 Smart Ports Throughput Capacity Market Forecast 2020-2030 (US$ million, Global AGR %)
Figure 4.27 Smart Ports Throughput Capacity Submarket Shares Forecast 2020, 2025, 2030 (% Share)
Figure 4.28 Extensively Busy Ports Submarket Forecast by Regional Market 2020-2030 (US$ million)
Figure 4.29 Extensively Busy Ports Share by Region 2020, 2025, 2030 (% Share)
Figure 4.30 Moderately Busy Smart Ports Submarket Forecast by Regional Market 2020-2030 (US$ million)
Figure 4.31 Moderately Busy Smart Ports Market Share by Region 2020, 2025, 2030 (% Share)
Figure 4.32 Scarcely Busy Smart Ports Submarket Forecast by Regional Market 2020-2030 (US$ million)
Figure 4.33 Scarcely Busy Smart Ports Share by Region 2020, 2025, 2030 (% Share)
Figure 4.34 Smart Ports Port Type Submarket AGR Forecast 2020-2030 (AGR %)
Figure 4.35 Smart Ports Port Type Market Forecast 2020-2030 (US$ million, Global AGR %)
Figure 4.36 Smart Ports Port Type Submarket Shares Forecast 2020, 2025, 2030 (% Share)
Figure 4.37 Seaport Submarket Forecast by Regional Market 2020-2030 (US$ million)
Figure 4.38 Seaport Share by Region 2020, 2025, 2030 (% Share)
Figure 4.39 Inland ports Submarket Forecast by Regional Market 2020-2030 (US$ million)
Figure 4.40 Inland ports Market Share by Region 2020, 2025, 2030 (% Share)
Figure 5.1 Leading Regional Smart Ports Markets Forecast 2020-2030 (US$ million, Global AGR %)
Figure 5.2 Leading Regional Smart Ports Markets Forecast 2020-2030(Sales US$ million, Global AGR %)
Figure 5.3 Leading Regional Smart Ports Market Share by Region 2020, 2025, 2030 (% Share)
Figure 5.4 North America Smart Ports Market Forecast 2020-2030 (US$ million, AGR %)
Figure 5.5 North America Smart Ports Market Forecast by Technology 2020-2030 (US$ million)
Figure 5.6 North America Smart Ports Market Forecast by Components 2020-2030 (US$ million)
Figure 5.7 North America Smart Ports Market Forecast by Throughput Capacity 2020-2030 (US$ million)
Figure 5.8 North America Smart Ports Market Forecast by Port Type 2020-2030 (US$ million)
Figure 5.9 North America Smart Ports Market Forecast by Country 2020-2030 (US$ million, Global AGR %)
Figure 5.10 US Smart Ports Market Forecast 2020-2030 (US$ million, AGR %)
Figure 5.11 Canada Smart Ports Market Forecast 2020-2030 (US$ million, AGR %)
Figure 5.12 Europe Smart Ports Market Forecast 2020-2030 (US$ million, AGR %)
Figure 5.13 Europe Smart Ports Market Forecast by Technology 2020-2030 (US$ million)
Figure 5.14 Europe Smart Ports Market Forecast by Components 2020-2030 (US$ million)
Figure 5.15 Europe Smart Ports Market Forecast by Throughput Capacity 2020-2030 (US$ million)
Figure 5.16 Europe Smart Ports Market Forecast by Port Type 2020-2030 (US$ million)
Figure 5.17 Europe Smart Ports Market Forecast by Country 2020-2030 (US$ million, Global AGR %)
Figure 5.18 UK Smart Ports Market Forecast 2020-2030 (US$ million, AGR %)
Figure 5.19 Russia Smart Ports Market Forecast 2020-2030 (US$ million, AGR %)
Figure 5.2 France Smart Ports Market Forecast 2020-2030 (US$ million, AGR %)
Figure 5.21 Germany Smart Ports Market Forecast 2020-2030 (US$ million, AGR %)
Figure 5.22 Italy Smart Ports Market Forecast 2020-2030 (US$ million, AGR %)
Figure 5.23 Netherlands Smart Ports Market Forecast 2020-2030 (US$ million, AGR %)
Figure 5.24 Asia Pacific Smart Ports Market Forecast 2020-2030 (US$ million, AGR %)
Figure 5.25 Asia-Pacific Smart Ports Market Forecast by Technology 2020-2030 (US$ million)
Figure 5.26 Asia-Pacific Smart Ports Market Forecast by Components 2020-2030 (US$ million)
Figure 5.27 Asia Pacific Smart Ports Market Forecast by Throughput Capacity 2020-2030 (US$ million)
Figure 5.28 Asia Pacific Smart Ports Market Forecast by Port Type 2020-2030 (US$ million)
Figure 5.29 Asia-Pacific Smart Ports Market Forecast by Country Market 2020-2030 (US$ million, Global AGR %)
Figure 5.3 China Smart Ports Market Forecast 2020-2030 (US$ million, AGR %)
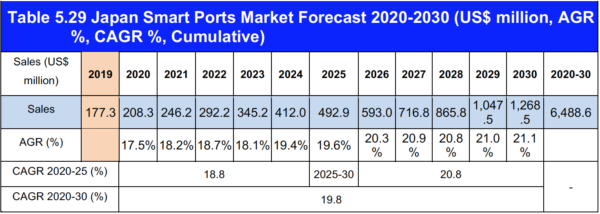
Figure 5.31 Japan Smart Ports Market Forecast 2020-2030 (US$ million, AGR %)
Figure 5.32 India Smart Ports Market Forecast 2020-2030 (US$ million, AGR %)
Figure 5.33 South Korea Smart Ports Market Forecast 2020-2030 (US$ million, AGR %)
Figure 5.34 Australia Smart Ports Market Forecast 2020-2030 (US$ million, AGR %)
Figure 5.35 MEA Smart Ports Market Forecast 2020-2030 (US$ million, AGR %)
Figure 5.36 MEA Smart Ports Market Forecast by Technology 2020-2030 (US$ million)
Figure 5.37 MEA Smart Ports Market Forecast by Components 2020-2030 (US$ million)
Figure 5.38 MEA Smart Ports Market Forecast by Throughput Capacity 2020-2030 (US$ million)
Figure 5.39 MEA Smart Ports Market Forecast by Port Type 2020-2030 (US$ million)
Figure 5.40 MEA Smart Ports Market Forecast by Country Market 2020-2030 (US$ million, Global AGR %)
Figure 5.41 Saudi Arabia Smart Ports Market Forecast 2020-2030 (US$ million, AGR %)
Figure 5.42 UAE Smart Ports Market Forecast 2020-2030 (US$ million, AGR %)
Figure 5.43 South Africa Smart Ports Market Forecast 2020-2030 (US$ million, AGR %)
Figure 5.44 Latin America Smart Ports Market Forecast 2020-2030 (US$ million, AGR %)
Figure 5.45 Latin America Smart Ports Market Forecast by Technology 2020-2030 (US$ million)
Figure 5.46 Latin America Smart Ports Market Forecast by Components 2020-2030 (US$ million)
Figure 7.1 Five Force Analysis of the Global Smart Ports Market 2020-2030
Figure 8.1 ABB LTD. Total Company Sales 2015-2019 (US$ million, AGR%)
Table 8.3 ABB LTD. Total Company Sales 2015-2019 (US$ million, AGR%)
Figure 8.2 ABB LTD. Sales Share (%) by Business Segment, 2019
Figure 8.3 ABB Ltd. Sales Share (%) by Region, 2019
Figure 8.4 ABB Ltd. Primary Market Competitors 2020
Figure 8.5 Accenture Plc Total Company Sales 2015-2019 (US$ million, AGR%)
Figure 8.6 Accenture Plc Sales Share (%) By Business Segment, 2019
Figure 8.7 Accenture Plc Sales Share (%) By Region, 2019
Figure 8.8 Accenture Plc Primary Market Competitors 2020
Figure 8.9 Awake.AI Primary Market Competitors 2020
Figure 8.10 Cisco Systems, Inc. Total Company Sales 2015-2019 (US$ million, AGR%)
Figure 8.11 Cisco Systems, Inc. By Business Segment, 2019
Figure 8.12 Cisco Systems, Inc. By Region (%), 2019
Figure 8.13 Cisco Systems, Inc. Primary Market Competitors 2020
Figure 8.14 General Electric Total Company Sales 2015-2019 (US$ million, AGR%)
Figure 8.15 General Electric Sales Share (%) By Business Segment, 2019
Figure 8.16 General Electric Sales Share (%) By Region, 2019
Figure 8.17 General Electric Primary Market Competitors 2020
Figure 8.18 IBM Total Company Sales 2015-2019 (US$ million, AGR%)
Figure 8.19 IBM By Business Segment, 2019
Figure 8.20 IBM Revenue By Region, 2019
Figure 8.21 IBM Primary Market Competitors 2020
Figure 8.22 Port Automation Primary Market Competitors 2020
Figure 8.23 Royal Haskoning Primary Market Competitors 2020
Figure 8.24 Siemens AG Total Company Sales 2015-2019 (US$ million, AGR%)
Figure 8.25 Siemens AG Sales Share (%) By Business Segment, 2019
Figure 8.26 Siemens AG Sales Share (%) By Region, 2019
Figure 8.27 Siemens AG Primary Market Competitors 2020
Figure 8.28 Telefonica SA Total Company Sales 2015-2019 (US$ million, AGR%)
Figure 8.29 Telefonica SA By Business Segment, 2019
Figure 8.30 Telefonica SA Revenue Share By Region, 2019
Figure 8.31 Telefonica SA Primary Market Competitors 2020
Figure 8.32 Traxen Primary Market Competitors 2020
Figure 8.33 Trelleborg AB Total Company Sales 2015-2019 (US$ million, AGR%)
Figure 8.34 Trelleborg AB Sales Share (%) By Business Segment, 2019
Figure 8.35 Trelleborg AB Sales Share (%) By Region, 2019
Figure 8.36 Trelleborg AB Primary Market Competitors 2020
Figure 8.37 Wipro Limited Total Company Sales 2015-2019 (US$ million, AGR%)
Figure 8.38 Wipro Limited Sales Share (%) By Business Segment, 2019
Figure 8.39 Wipro Limited Sales Share (%) By Region, 2019
Figure 8.40 Wipro Limited Primary Market Competitors 2020
Figure 9.1 Smart Ports Market Forecast 2020-2030 (US$ million, Global AGR %)