Industries > Construction > Smart Glass and Smart Windows Market Report 2021-2031

Smart Glass and Smart Windows Market Report 2021-2031
Forecasts by Technology (Active (Electrochromic, PDCL, SPD, Others), Passive), by Application (Architectural, Automotive, Aircraft, Consumer Electronics, Others) AND Regional and Leading National Market Analysis PLUS Analysis of Leading Smart Glass and Smart Windows Companies AND COVID-19 Recovery Scenarios
Discover how to stay ahead
Our 424-page report provides 534 tables and charts/graphs. Read on to discover the most lucrative areas in the industry and the future market prospects. Our new study lets you assess forecasted sales at overall world market and regional level. See financial results, trends, opportunities, and revenue predictions. Much opportunity remains in this growing Smart Glass and Window market. See how to exploit the opportunities.
Forecasts to 2031 and other analyses reveal the commercial prospects
• In addition to revenue forecasting to 2031, our new study provides you with recent results, growth rates, and market shares.
• You find original analyses, with business outlooks and developments.
Discover qualitative analyses (including market dynamics, drivers, opportunities, restraints and challenges), product profiles and commercial developments
Smart glass and window has ability to control the amount of light transmitted. Automotive manufactures are installing smart glass and window in their vehicle for controlling light and heat in vehicle. It also blocks infrared and ultra violet rays. It also minimizes air conditioner usage by blocking heat. Due to these benefits associated with smart glass and windows, automotive manufactures have started to adopt smart glasses in their vehicle. This factor is expected to drive global smart glass and window market. Government’s regulatory bodies and framework across different countries have positive and negative impact on the global smart glass and window market. Government rules and regulation for fuel optimization, green building or energy efficient is expected create significant opportunity in future.
This report includes data analysis and invaluable insight into how COVID-19 will affect your industry. Access this report today.
To access the data contained in this document please email contactus@visiongain.com
Discover sales predictions for the world market and submarkets
By Type
• Active
– Electrochromic
– PDCL
– SPD
– Others
• Passive
By Application
• Architectural
• Automotive
• Aircraft
• Consumer Electronics
• Others

In addition to the revenue predictions for the overall world market and segments, you will also find revenue forecasts for 5 regional and 21 leading national markets:
• North America
– U.S.
– Canada
• Europe
– United Kingdom
– Germany
– France
– Italy
– Spain
– Rest of Europe
• Asia Pacific
– China
– Japan
– Australia
– India
– South Korea
– Southeast Asia
– Rest of Asia Pacific
• Latin America
– Brazil
– Mexico
– Rest of Latin America
• Middle East and Africa
– GCC Countries
– South Africa
– Rest of Middle East and Africa
Need industry data? Please contact us today.
The report also includes profiles and for some of the leading companies in the Smart Glass and Window market, with a focus on this segment of these companies’ operations.
Leading companies and the potential for market growth
Overall world revenue for Smart Glass and Window Market will surpass $xx million in 2021, our work calculates. We predict strong revenue growth through to 2031. Our work identifies which organizations hold the greatest potential. Discover their capabilities, progress, and commercial prospects, helping you stay ahead.
How the Smart Glass and Window Market report helps you
In summary, our 420+ page report provides you with the following knowledge:
• Revenue forecasts to 2031 for Smart Glass and Window market, with forecasts for Technology and Application, each forecasted at a global and regional level– discover the industry’s prospects, finding the most lucrative places for investments and revenues
• Revenue forecasts to 2031 for 5 regional and 21 key national markets – See forecasts for the Smart Glass and Window market in North America, Europe, Asia-Pacific, Latin America and Rest of the World. Also forecasted is the market in the US, Canada, UK, Germany, France, Italy, Spain, China, India, Japan, Brazil, Mexico, South Africa, GCC Countries among other prominent economies.
• Prospects for established firms and those seeking to enter the market– including company profiles for 15 of the major companies involved in the Smart Glass and Window market. Some of the company’s profiled in this report include Saint Gobain S.A., Gentex Corporation, AGC Inc, Gerresheimer AG, Pleotint LLC (Suntuitive Glass), View Inc., Vision Systems, Raven Brick LLC, Smart Glass International Ltd., Asahi India Glass Limited, ChromoGenics, Corning Incorporated, e-Chromic Technologies, Polytronix, Inc., and Unite Glass.
Find quantitative and qualitative analyses with independent predictions. Receive information that only our report contains, staying informed with this invaluable business intelligence.
Information found nowhere else
With our newly report title, you are less likely to fall behind in knowledge or miss out on opportunities. See how our work could benefit your research, analyses, and decisions.
Visiongain’s study is for everybody needing commercial analyses for the Smart Glass and Window market and leading companies. You will find data, trends and predictions.
To access the data contained in this document please email contactus@visiongain.com
Buy our report today Smart Glass and Smart Windows Market Report 2021-2031: Forecasts by Technology (Active (Electrochromic, PDCL, SPD, Others), Passive), by Application (Architectural, Automotive, Aircraft, Consumer Electronics, Others) AND Regional and Leading National Market Analysis PLUS Analysis of Leading Smart Glass and Smart Windows Companies AND COVID-19 Recovery Scenarios. Avoid missing out by staying informed – order our report now.
Visiongain is a trading partner with the US Federal Government
CCR Ref number: KD4R6
Do you have any custom requirements we can help you with? Any need for a specific country, geo region, market segment or specific company information? Contact us today, we can discuss your needs and see how we can help: sara.peerun@visiongain.com
1.1 Introduction
1.2 Market Segmentation
1.3 Why You Should Read This Report
1.4 What This Report Delivers
1.5 Key Questions Answered by This Analytical Report Include:
1.6 Who is This Report For?
1.7 Methodology
1.7.1 COVID-19 Impact: Recovery Scenarios
1.7.2 Market Evaluation & Forecasting Methodology
1.7.3 Market Size Estimation
1.8 Frequently Asked Questions (FAQ)
1.9 Associated Visiongain Reports
1.10 About visiongain
2 Executive Summary
3 Global Smart Glass and Smart Window Market Dynamics
3.1 Drivers
3.1.1 Rise in adoption of smart glass in automotive sector
3.1.2 Increase in demand of smart glass in commercial and residential building
3.2 Restraint
3.2.1 High cost of smart glass hinders the market growth
3.3 Opportunities
3.3.1 Innovation and new product launches creates new opportunities in smart glass and windows market
3.4 Porter’s Analysis
3.4.1 Bargaining power of Buyers (Moderate to high)
3.4.2 Bargaining power of Suppliers (Low to Moderate)
3.4.3 Threat of New Entrants (Low to Moderate)
3.4.4 Threat of Substitute Products (Low to Moderate)
3.4.5 Rivalry among existing competitors (Moderate to High)
3.5 PEST
3.5.1 Political
3.5.2 Economic
3.5.3 Sociological
3.5.4 Technological
3.6 SWOT Analysis
3.6.1 Strength
3.6.2 Weakness
3.6.3 Opportunity
3.6.4 Threat
4 Global Smart Glass and Smart Window Market Size Forecast 2021-2031 by Technology
4.1 Active Glass Segment: Revenue Forecast 2021-2031
4.1.1 Recovery Scenarios (V, U, W, L): Active Glass Segment Revenue Forecast, 2021-2031
4.2 Passive Glass Segment: Revenue Forecast 2021-2031
4.2.1 Recovery Scenarios (V, U, W, L): Passive Glass Segment Revenue Forecast, 2021-2031
5 Global Smart Glass and Smart Window Market Size Forecast 2021-2031 by Application
5.1 Architectural Segment: Revenue Forecast 2021-2031
5.1.1 Rising adoption of Smart Glass in Commercial Spaces
5.1.2 Recovery Scenarios (V, U, W, L): Architectural Segment Revenue Forecast, 2021-2031
5.2 Automotive Segment: Revenue Forecast 2021-2031
5.2.1 Rising Awareness Regarding Benefits of Smart Glass and Smart Window Among Automotive Consumers
5.2.2 Recovery Scenarios (V, U, W, L): Automotive Segment Revenue Forecast, 2021-2031
5.3 Aircraft Segment: Revenue Forecast 2021-2031
5.3.1 Advantages Associated with SPD-Smart EDWs
5.3.2 Recovery Scenarios (V, U, W, L): Aircraft Segment Revenue Forecast, 2021-2031
5.4 Consumer Electronics Segment: Revenue Forecast 2021-2031
5.4.1 Consumer Electronics to Witness Significant Growth
5.4.2 Recovery Scenarios (V, U, W, L): Consumer Electronics Segment Revenue Forecast, 2021-2031
5.5 Others Segment: Revenue Forecast 2021-2031
5.5.1 High Adoption from Several Industries Such as Transportation and Retail
5.5.2 Recovery Scenarios (V, U, W, L): Others Segment Revenue Forecast, 2021-2031
6 Regional and Leading National Smart Glass and Smart Window Market Forecasts, 2021-2031
6.1 Global Smart Glass and Smart Window Market by National Market Forecast 2021-2031
6.1.1 North America is Anticipated to Hold Largest Market Share
6.1.2 Recovery Scenarios (V, U, W, L): Regional Revenue Forecast, 2021-2031
7 North America Smart Glass and Smart Window Market Analysis and Forecast, 2021-2031
7.1 North America Smart Glass and Smart Window Market Forecast by Technology, 2021-2031 (US$ million, AGR%)
7.1.1 Active Glass Submarket to Dominate Hold Maximum Share
7.1.2 North America Recovery Scenarios (V, U, W, L): Technology Segment Revenue Forecast, 2021-2031
7.2 North America Smart Glass and Smart Window Market Forecast by Application, 2021-2031 (US$ million, AGR%)
7.2.1 Architectural application has been accounted for the highest market share
7.2.2 North America Recovery Scenarios (V, U, W, L): Application Segment Revenue Forecast, 2021-2031
7.3 U.S. Smart Glass and Smart Window Market Forecast 2021-2031
7.3.1 Presence of big companies operating in the country increases adoption of smart glass and windows across end user
7.3.2 Recovery Scenarios (V, U, W, L): U.S. Revenue Forecast, 2021-2031
7.4 Canada Smart Glass and Smart Window Market Forecast 2021-2031
7.4.1 Increase in installations of smart glass and windows for residential buildings
7.4.2 Recovery Scenarios (V, U, W, L): Canada Revenue Forecast, 2021-2031
8 Europe Smart Glass and Smart Window Market Analysis and Forecast, 2021-2031
8.1 Europe Smart Glass and Smart Window Market Forecast by Technology, 2021-2031 (US$ million, AGR%)
8.1.1 Active Glass Submarket to Dominate Hold Maximum Share
8.1.2 Europe Recovery Scenarios (V, U, W, L): Technology Segment Revenue Forecast, 2021-2031
8.2 Europe Smart Glass and Smart Window Market Forecast by Application, 2021-2031 (US$ million, AGR%)
8.2.1 Automotive to Witness Fastest Growth
8.2.2 Europe Recovery Scenarios (V, U, W, L): Application Segment Revenue Forecast, 2021-2031
8.3 U.K. Smart Glass and Smart Window Market Forecast 2021-2031
8.3.1 Increase in adoption smart glass and windows in commercial buildings
8.3.2 Recovery Scenarios (V, U, W, L): U.K. Revenue Forecast, 2021-2031
8.4 Germany Smart Glass and Smart Window Market Forecast 2021-2031
8.4.1 Presence of established players and expansion of smart glass and windows manufactures in Germany fuels the market growth
8.4.2 Recovery Scenarios (V, U, W, L): Germany Revenue Forecast, 2021-2031
8.5 France Smart Glass and Smart Window Market Forecast 2021-2031
8.5.1 Increased focused of industries to offer pleasant atmosphere in commercial buildings
8.5.2 Recovery Scenarios (V, U, W, L): France Revenue Forecast, 2021-2031
8.6 Italy Smart Glass and Smart Window Market Forecast 2021-2031
8.6.1 Increased implementation of sustainable solutions in the architectural and automotive sectors is driving the market growth
8.6.2 Recovery Scenarios (V, U, W, L): Italy Revenue Forecast, 2021-2031
8.7 Spain Smart Glass and Smart Window Market Forecast 2021-2031
8.7.1 Rise in adoption of smart glass and windows in automotive sector
8.7.2 Recovery Scenarios (V, U, W, L): Spain Revenue Forecast, 2021-2031
8.8 Rest of Europe Smart Glass and Smart Window Market Forecast 2021-2031
8.8.1 Increase in demand of smart glass in commercial and residential building
8.8.2 Recovery Scenarios (V, U, W, L): Rest of Europe Revenue Forecast, 2021-2031
9 Asia Pacific Smart Glass and Smart Window Market Analysis and Forecast, 2021-2031
9.1 Asia Pacific Smart Glass and Smart Window Market Forecast by Technology, 2021-2031 (US$ million, AGR%)
9.1.1 Active Glass Submarket to Dominate Hold Maximum Share
9.1.2 Asia Pacific Recovery Scenarios (V, U, W, L): Technology Segment Revenue Forecast, 2021-2031
9.2 Asia Pacific Smart Glass and Smart Window Market Forecast by Application, 2021-2031 (US$ million, AGR%)
9.2.1 Growing Smart City Development Projects Across the Region
9.2.2 Asia Pacific Recovery Scenarios (V, U, W, L): Application Segment Revenue Forecast, 2021-2031
9.3 China Smart Glass and Smart Window Market Forecast 2021-2031
9.3.1 Availability of raw material and increasing in export of products. Increase in initiative for energy saving further boost the demand
9.3.2 Recovery Scenarios (V, U, W, L): China Revenue Forecast, 2021-2031
9.4 Japan Smart Glass and Smart Window Market Forecast 2021-2031
9.4.1 Developed infrastructure and high investment on technology drives the smart glass and smart window market
9.4.2 Recovery Scenarios (V, U, W, L): Japan Revenue Forecast, 2021-2031
9.5 Australia Smart Glass and Smart Window Market Forecast 2021-2031
9.5.1 Rising Initiatives of government and commercial buildings for energy saving
9.5.2 Recovery Scenarios (V, U, W, L): Australia Segment Revenue Forecast, 2021-2031
9.6 India Smart Glass and Smart Window Market Forecast 2021-2031
9.6.1 Rising adoption of smart glass and smart windows across automotive and consumer electronics
9.6.2 Recovery Scenarios (V, U, W, L): India Segment Revenue Forecast, 2021-2031
9.7 South Korea Smart Glass and Smart Window Market Forecast 2021-2031
9.7.1 Rising investment and rising partnership across the country increases demand for the product
9.7.2 Recovery Scenarios (V, U, W, L): South Korea Segment Revenue Forecast, 2021-2031
9.8 Southeast Asia Smart Glass and Smart Window Market Forecast 2021-2031
9.8.1 Increase in demand of smart glass in commercial and residential building
9.8.2 Recovery Scenarios (V, U, W, L): Southeast Asia Segment Revenue Forecast, 2021-2031
9.9 Rest of APAC Smart Glass and Smart Window Market Forecast 2021-2031
9.9.1 Rise in adoption of smart glass in automotive sector drives the smart glass and window market in rest of APAC
9.9.2 Recovery Scenarios (V, U, W, L): Rest of APAC Segment Revenue Forecast, 2021-2031
10 Latin America Smart Glass and Smart Window Market Analysis and Forecast, 2021-2031
10.1 Latin America Smart Glass and Smart Window Market Forecast by Technology, 2021-2031 (US$ million, AGR%)
10.1.1 Active Glass Submarket to Dominate Hold Maximum Share
10.1.2 Latin America Recovery Scenarios (V, U, W, L): Technology Segment Revenue Forecast, 2021-2031
10.2 Latin America Smart Glass and Smart Window Market Forecast by Application, 2021-2031 (US$ million, AGR%)
10.2.1 Automotive to Witness Fastest Growth
10.2.2 Latin America Recovery Scenarios (V, U, W, L): Application Segment Revenue Forecast, 2021-2031
10.3 Brazil Smart Glass and Smart Window Market Forecast 2021-2031
10.3.1 Expansion of international business in smart glass and window market across Brazil creates significant opportunities
10.3.2 Recovery Scenarios (V, U, W, L): Brazil Revenue Forecast, 2021-2031
10.4 Mexico Smart Glass and Smart Window Market Forecast 2021-2031
10.4.1 Developed automotive industries increase the demand of smart glass and windows
10.4.2 Recovery Scenarios (V, U, W, L): Mexico Revenue Forecast, 2021-2031
10.5 Rest of Latin America Smart Glass and Smart Window Market Forecast 2021-2031
10.5.1 Building owners have started to adopt smart windows due to benefits associated with it
10.5.2 Recovery Scenarios (V, U, W, L): Rest of Latin America Revenue Forecast, 2021-2031
11 MEA Smart Glass and Smart Window Market Analysis and Forecast, 2021-2031
11.1 MEA Smart Glass and Smart Window Market Forecast by Technology, 2021-2031 (US$ million, AGR%)
11.1.1 Active Glass Submarket to Dominate Hold Maximum Share
11.1.2 MEA Recovery Scenarios (V, U, W, L): Technology Segment Revenue Forecast, 2021-2031
11.2 MEA Smart Glass and Smart Window Market Forecast by Application, 2021-2031 (US$ million, AGR%)
11.2.1 Technological Innovation and Architectural Advancements in Switchable Glasses
11.2.2 MEA Recovery Scenarios (V, U, W, L): Application Segment Revenue Forecast, 2021-2031
11.3 GCC Countries Smart Glass and Smart Window Market Forecast 2021-2031
11.3.1 Increase in adoption of smart glass and windows in hospitality industries drives the market
11.3.2 Recovery Scenarios (V, U, W, L): GCC Countries Revenue Forecast, 2021-2031
11.4 South Africa Smart Glass and Smart Window Market Forecast 2021-2031
11.4.1 Rise in focus of energy efficient product across all the application creates opportunities for smart glass and windows
11.4.2 Recovery Scenarios (V, U, W, L): South Africa Revenue Forecast, 2021-2031
11.5 Rest of MEA Smart Glass and Smart Window Market Forecast 2021-2031
11.5.1 Smart glass and windows are used as they are capable of save heating rate, environment or weather adaptive building shells, and air-conditioning
11.5.2 Recovery Scenarios (V, U, W, L): Rest of MEA Revenue Forecast, 2021-2031
12 Company Profiles
12.1 Saint Gobain S.A.
12.1.1 Company Snapshot
12.1.2 Company Overview
12.1.3 Financial Snapshot, 2015-2019
12.1.4 Products & Services
12.1.5 Recent Developments
12.1.6 Future Outlook
12.2 Gentex Corporation
12.2.1 Company Snapshot
12.2.2 Company Overview
12.2.3 Financial Snapshot, 2015-2019
12.2.4 Products & Services
12.2.5 Recent Developments
12.2.6 Future Outlook
12.3 AGC Inc
12.3.1 Company Snapshot
12.3.2 Company Overview
12.3.3 Financial Snapshot, 2015-2019
12.3.4 Products & Services
12.3.5 Recent Developments
12.3.6 Future Outlook
12.4 Gerresheimer AG
12.4.1 Company Snapshot
12.4.2 Company Overview
12.4.3 Products & Services
12.4.4 Recent Developments
12.4.5 Future Outlook
12.5 Asahi India Glass Limited
12.5.1 Company Snapshot
12.5.2 Company Overview
12.5.3 Financial Snapshot, 2015-2019
12.5.4 Products & Services
12.5.5 Recent Developments
12.5.6 Future Outlook
12.6 ChromoGenics
12.6.1 Company Snapshot
12.6.2 Company Overview
12.6.3 Financial Snapshot, 2015-2019
12.6.4 Products & Services
12.6.5 Recent Developments
12.6.6 Future Outlook
12.7 Corning Incorporated
12.7.1 Company Snapshot
12.7.2 Company Overview
12.7.3 Financial Snapshot, 2015-2019
12.7.4 Products & Services
12.7.5 Recent Developments
12.7.6 Future Outlook
12.8 e-Chromic Technologies
12.8.1 Company Snapshot
12.8.2 Company Overview
12.8.3 Products & Services
12.8.4 Recent Developments
12.8.5 Future Outlook
12.9 Polytronix, Inc.
12.9.1 Company Snapshot
12.9.2 Company Overview
12.9.3 Products & Services
12.9.4 Recent Developments
12.9.5 Future Outlook
12.10 Unite Glass
12.10.1 Company Snapshot
12.10.2 Company Overview
12.10.3 Products & Services
12.10.4 Recent Developments
12.10.5 Future Outlook
12.11 Pleotint LLC (Suntuitive Glass)
12.11.1 Company Snapshot
12.11.2 Company Overview
12.11.3 Product & Services
12.11.4 Recent Developments
12.11.5 Future Outlook
12.12 View Inc.
12.12.1 Company Snapshot
12.12.2 Company Overview
12.12.3 Product & Services
12.12.4 Recent Developments
12.12.5 Future Outlook
12.13 Vision Systems
12.13.1 Company Snapshot
12.13.2 Company Overview
12.13.3 Product & Services
12.13.4 Recent Developments
12.13.5 Future Outlook
12.14 Raven Brick LLC
12.14.1 Company Snapshot
12.14.2 Company Overview
12.14.3 Product & Services
12.14.4 Recent Developments
12.14.5 Future Outlook
12.15 Smart Glass International Ltd.
12.15.1 Company Snapshot
12.15.2 Company Overview
12.15.3 Product & Services
12.15.4 Recent Developments
12.15.5 Future Outlook
12.16 List of Other Notable Players
13 Conclusions and Recommendations
13.1 Concluding Remarks
13.2 Recommendations
List of Tables
Table1: Global Smart Glass and Smart Window Market, 2021-2031 (US$ million, CAGR %)
Table 2: Global Smart Glass and Smart Window Market Forecast by Technology, 2021-2031 (US$ million, AGR %, CAGR %)
Table 03: Global Smart Glass and Smart Window Market for Active Glass Segment: Revenue Forecast 2021-2031 (US$ million, AGR%, CAGR%)
Table 04: Smart Glass and Smart Window Market for Active Glass, 2021-2031 (US$ Mn, AGR%, CAGR%) (V-shaped Recovery)
Table 05: Smart Glass and Smart Window Market for Active Glass, 2021-2031 (US$ Mn, AGR%, CAGR%) (U-shaped Recovery)
Table 06: Smart Glass and Smart Window Market for Active Glass, 2021-2031 (US$ Mn, AGR%, CAGR%) (L-shaped Recovery)
Table 07: Smart Glass and Smart Window Market for Active Glass, 2021-2031 (US$ Mn, AGR%, CAGR%) (W-shaped Recovery)
Table 08: Global Smart Glass and Smart Window Market for Passive Glass Segment: Revenue Forecast 2021-2031 (US$ million, AGR%, CAGR%)
Table 09: Smart Glass and Smart Window Market for Passive Glass, 2021-2031 (US$ Mn, AGR%, CAGR%) (V-shaped Recovery)
Table 10: Smart Glass and Smart Window Market for Passive Glass, 2021-2031 (US$ Mn, AGR%, CAGR%) (U-shaped Recovery)
Table 11: Smart Glass and Smart Window Market for Passive Glass, 2021-2031 (US$ Mn, AGR%, CAGR%) (L-shaped Recovery)
Table 12: Smart Glass and Smart Window Market for Passive Glass, 2021-2031 (US$ Mn, AGR%, CAGR%) (W-shaped Recovery)
Table 13: Global Smart Glass and Smart Window Market Forecast by Application, 2021-2031 (US$ million, AGR %, CAGR %)
Table 14: Global Smart Glass and Smart Window Market for Architectural Segment: Revenue Forecast 2021-2031 (US$ million, AGR%, CAGR%)
Table 15: Smart Glass and Smart Window Market for Architectural, 2021-2031 (US$ Mn, AGR%, CAGR%) (V-shaped Recovery)
Table 16: Smart Glass and Smart Window Market for Architectural, 2021-2031 (US$ Mn, AGR%, CAGR%) (U-shaped Recovery)
Table 17: Smart Glass and Smart Window Market for Architectural, 2021-2031 (US$ Mn, AGR%, CAGR%) (L-shaped Recovery)
Table 18: Smart Glass and Smart Window Market for Architectural, 2021-2031 (US$ Mn, AGR%, CAGR%) (W-shaped Recovery)
Table 19: Global Smart Glass and Smart Window Market for Automotive Segment: Revenue Forecast 2021-2031 (US$ million, AGR%, CAGR%)
Table 20: Smart Glass and Smart Window Market for Automotive, 2021-2031 (US$ Mn, AGR%, CAGR%) (V-shaped Recovery)
Table 21: Smart Glass and Smart Window Market for Automotive, 2021-2031 (US$ Mn, AGR%, CAGR%) (U-shaped Recovery)
Table 22: Smart Glass and Smart Window Market for Automotive, 2021-2031 (US$ Mn, AGR%, CAGR%) (L-shaped Recovery)
Table 23: Smart Glass and Smart Window Market for Automotive, 2021-2031 (US$ Mn, AGR%, CAGR%) (W-shaped Recovery)
Table 24: Global Smart Glass and Smart Window Market for Aircraft Segment: Revenue Forecast 2021-2031 (US$ million, AGR%, CAGR%)
Table 25: Smart Glass and Smart Window Market for Aircraft, 2021-2031 (US$ Mn, AGR%, CAGR%) (V-shaped Recovery)
Table 26: Smart Glass and Smart Window Market for Aircraft, 2021-2031 (US$ Mn, AGR%, CAGR%) (U-shaped Recovery)
Table 27: Smart Glass and Smart Window Market for Aircraft, 2021-2031 (US$ Mn, AGR%, CAGR%) (L-shaped Recovery)
Table 28: Smart Glass and Smart Window Market for Aircraft, 2021-2031 (US$ Mn, AGR%, CAGR%) (W-shaped Recovery)
Table 29: Global Smart Glass and Smart Window Market for Consumer Electronics Segment: Revenue Forecast 2021-2031 (US$ million, AGR%, CAGR%)
Table 30: Smart Glass and Smart Window Market for Consumer Electronics, 2021-2031 (US$ Mn, AGR%, CAGR%) (V-shaped Recovery)
Table 31: Smart Glass and Smart Window Market for Consumer Electronics, 2021-2031 (US$ Mn, AGR%, CAGR%) (U-shaped Recovery)
Table 32: Smart Glass and Smart Window Market for Consumer Electronics, 2021-2031 (US$ Mn, AGR%, CAGR%) (L-shaped Recovery)
Table 33: Smart Glass and Smart Window Market for Consumer Electronics, 2021-2031 (US$ Mn, AGR%, CAGR%) (W-shaped Recovery)
Table 34: Global Smart Glass and Smart Window Market for Others Segment: Revenue Forecast 2021-2031 (US$ million, AGR%, CAGR%)
Table 35: Smart Glass and Smart Window Market for Others, 2021-2031 (US$ Mn, AGR%, CAGR%) (V-shaped Recovery)
Table 36: Smart Glass and Smart Window Market for Others, 2021-2031 (US$ Mn, AGR%, CAGR%) (U-shaped Recovery)
Table 37: Smart Glass and Smart Window Market for Others, 2021-2031 (US$ Mn, AGR%, CAGR%) (L-shaped Recovery)
Table 38: Smart Glass and Smart Window Market for Others, 2021-2031 (US$ Mn, AGR%, CAGR%) (W-shaped Recovery)
Table 39: Global Smart Glass and Smart Window Market Forecast by Region, 2021-2031 (US$ million, AGR %)
Table 40: “V” Shaped Recovery: Global Smart Glass and Smart Window Market Forecast by Region, 2021-2031 (US$ million, AGR %)
Table 41: “U” Shaped Recovery: Global Smart Glass and Smart Window Market Forecast by Region, 2021-2031 (US$ million, AGR %)
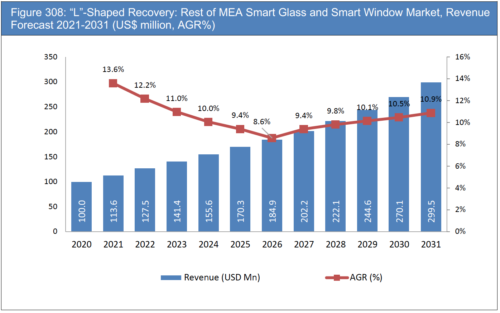
Table 42: “L” Shaped Recovery: Global Smart Glass and Smart Window Market Forecast by Region, 2021-2031 (US$ million, AGR %)
Table 43: “W” Shaped Recovery: Global Smart Glass and Smart Window Market Forecast by Region, 2021-2031 (US$ million, AGR %)
Table 44: North America Smart Glass and Smart Window Market Forecast by Technology, 2021-2031 (US$ million, AGR %)
Table 45: North America Smart Glass and Smart Window Market by Technology, 2021-2031 (US$ Mn, AGR%) (V-shaped Recovery)
Table 46: North America Smart Glass and Smart Window Market by Technology, 2021-2031 (US$ Mn, AGR%) (U-shaped Recovery)
Table 47: North America Smart Glass and Smart Window Market by Technology, 2021-2031 (US$ Mn, AGR%) (L-shaped Recovery)
Table 48: North America Smart Glass and Smart Window Market by Technology, 2021-2031 (US$ Mn, AGR%) (W-shaped Recovery)
Table 49: North America Smart Glass and Smart Window Market Forecast by Application, 2021-2031 (US$ million, AGR %)
Table 50: North America Smart Glass and Smart Window Market by Application, 2021-2031 (US$ Mn, AGR%) (V-shaped Recovery)
Table 51: North America Smart Glass and Smart Window Market by Application, 2021-2031 (US$ Mn, AGR%) (U-shaped Recovery)
Table 52: North America Smart Glass and Smart Window Market by Application, 2021-2031 (US$ Mn, AGR%) (L-shaped Recovery)
Table 53: North America Smart Glass and Smart Window Market by Application, 2021-2031 (US$ Mn, AGR%) (W-shaped Recovery)
Table 54: U.S. Smart Glass and Smart Window Market Forecast 2021-2031 (US$ million, AGR %, CAGR %)
Table 55: U.S. Smart Glass and Smart Window Market, Revenue Forecast 2021-2031 (US$ million, AGR%, CAGR%): V-Shaped Recovery
Table 56: U.S. Smart Glass and Smart Window Market, Revenue Forecast 2021-2031 (US$ million, AGR%, CAGR%): U-Shaped Recovery
Table 57: U.S. Smart Glass and Smart Window Market, Revenue Forecast 2021-2031 (US$ million, AGR%, CAGR%): L-Shaped Recovery
Table 58: U.S. Smart Glass and Smart Window Market, Revenue Forecast 2021-2031 (US$ million, AGR%, CAGR%): W-Shaped Recovery
Table 59: Canada Smart Glass and Smart Window Market Forecast 2021-2031 (US$ million, AGR %, CAGR %)
Table 60: Canada Smart Glass and Smart Window Market, Revenue Forecast 2021-2031 (US$ million, AGR%, CAGR%): V-Shaped Recovery
Table 61: Canada Smart Glass and Smart Window Market, Revenue Forecast 2021-2031 (US$ million, AGR%, CAGR%): U-Shaped Recovery
Table 62: Canada Smart Glass and Smart Window Market, Revenue Forecast 2021-2031 (US$ million, AGR%, CAGR%): L-Shaped Recovery
Table 63: Canada Smart Glass and Smart Window Market, Revenue Forecast 2021-2031 (US$ million, AGR%, CAGR%): W-Shaped Recovery
Table 64: Europe Smart Glass and Smart Window Market Forecast by Technology, 2021-2031 (US$ million, AGR %)
Table 65: Europe Smart Glass and Smart Window Market by Technology, 2021-2031 (US$ Mn, AGR%) (V-shaped Recovery)
Table 66: Europe Smart Glass and Smart Window Market by Technology, 2021-2031 (US$ Mn, AGR%) (U-shaped Recovery)
Table 67: Europe Smart Glass and Smart Window Market by Technology, 2021-2031 (US$ Mn, AGR%) (L-shaped Recovery)
Table 68: Europe Smart Glass and Smart Window Market by Technology, 2021-2031 (US$ Mn, AGR%) (W-shaped Recovery)
Table 69: Europe Smart Glass and Smart Window Market Forecast by Application, 2021-2031 (US$ million, AGR %)
Table 70: Europe Smart Glass and Smart Window Market by Application, 2021-2031 (US$ Mn, AGR%) (V-shaped Recovery)
Table 71: Europe Smart Glass and Smart Window Market by Application, 2021-2031 (US$ Mn, AGR%) (U-shaped Recovery)
Table 72: Europe Smart Glass and Smart Window Market by Application, 2021-2031 (US$ Mn, AGR%) (L-shaped Recovery)
Table 73: Europe Smart Glass and Smart Window Market by Application, 2021-2031 (US$ Mn, AGR%) (W-shaped Recovery)
Table 74: U.K. Smart Glass and Smart Window Market Forecast 2021-2031 (US$ million, AGR %, CAGR %)
Table 75: U.K. Smart Glass and Smart Window Market, Revenue Forecast 2021-2031 (US$ million, AGR%, CAGR%): V-Shaped Recovery
Table 76: U.K. Smart Glass and Smart Window Market, Revenue Forecast 2021-2031 (US$ million, AGR%, CAGR%): U-Shaped Recovery
Table 77: U.K. Smart Glass and Smart Window Market, Revenue Forecast 2021-2031 (US$ million, AGR%, CAGR%): L-Shaped Recovery
Table 78: U.K. Smart Glass and Smart Window Market, Revenue Forecast 2021-2031 (US$ million, AGR%, CAGR%): W-Shaped Recovery
Table 79: Germany Smart Glass and Smart Window Market Forecast 2021-2031 (US$ million, AGR %, CAGR %)
Table 80: Germany Smart Glass and Smart Window Market, Revenue Forecast 2021-2031 (US$ million, AGR%, CAGR%): V-Shaped Recovery
Table 81: Germany Smart Glass and Smart Window Market, Revenue Forecast 2021-2031 (US$ million, AGR%, CAGR%): U-Shaped Recovery
Table 82: Germany Smart Glass and Smart Window Market, Revenue Forecast 2021-2031 (US$ million, AGR%, CAGR%): L-Shaped Recovery
Table 83: Germany Smart Glass and Smart Window Market, Revenue Forecast 2021-2031 (US$ million, AGR%, CAGR%): W-Shaped Recovery
Table 84: France Smart Glass and Smart Window Market Forecast 2021-2031 (US$ million, AGR %, CAGR %)
Table 85: France Smart Glass and Smart Window Market, Revenue Forecast 2021-2031 (US$ million, AGR%, CAGR%): V-Shaped Recovery
Table 86: France Smart Glass and Smart Window Market, Revenue Forecast 2021-2031 (US$ million, AGR%, CAGR%): U-Shaped Recovery
Table 87: France Smart Glass and Smart Window Market, Revenue Forecast 2021-2031 (US$ million, AGR%, CAGR%): L-Shaped Recovery
Table 88: France Smart Glass and Smart Window Market, Revenue Forecast 2021-2031 (US$ million, AGR%, CAGR%): W-Shaped Recovery
Table 89: Italy Smart Glass and Smart Window Market Forecast 2021-2031 (US$ million, AGR %, CAGR %)
Table 90: Italy Smart Glass and Smart Window Market, Revenue Forecast 2021-2031 (US$ million, AGR%, CAGR%): V-Shaped Recovery
Table 91: Italy Smart Glass and Smart Window Market, Revenue Forecast 2021-2031 (US$ million, AGR%, CAGR%): U-Shaped Recovery
Table 92: Italy Smart Glass and Smart Window Market, Revenue Forecast 2021-2031 (US$ million, AGR%, CAGR%): L-Shaped Recovery
Table 93: Italy Smart Glass and Smart Window Market, Revenue Forecast 2021-2031 (US$ million, AGR%, CAGR%): W-Shaped Recovery
Table 94: Spain Smart Glass and Smart Window Market Forecast 2021-2031 (US$ million, AGR %, CAGR %)
Table 95: Spain Smart Glass and Smart Window Market, Revenue Forecast 2021-2031 (US$ million, AGR%, CAGR%): V-Shaped Recovery
Table 96: Spain Smart Glass and Smart Window Market, Revenue Forecast 2021-2031 (US$ million, AGR%, CAGR%): U-Shaped Recovery
Table 97: Spain Smart Glass and Smart Window Market, Revenue Forecast 2021-2031 (US$ million, AGR%, CAGR%): L-Shaped Recovery
Table 98: Spain Smart Glass and Smart Window Market, Revenue Forecast 2021-2031 (US$ million, AGR%, CAGR%): W-Shaped Recovery
Table 99: Rest of Europe Smart Glass and Smart Window Market Forecast 2021-2031 (US$ million, AGR %, CAGR %)
Table 100: Rest of Europe Smart Glass and Smart Window Market, Revenue Forecast 2021-2031 (US$ million, AGR%, CAGR%): V-Shaped Recovery
Table 101: Rest of Europe Smart Glass and Smart Window Market, Revenue Forecast 2021-2031 (US$ million, AGR%, CAGR%): U-Shaped Recovery
Table 102: Rest of Europe Smart Glass and Smart Window Market, Revenue Forecast 2021-2031 (US$ million, AGR%, CAGR%): L-Shaped Recovery
Table 103: Rest of Europe Smart Glass and Smart Window Market, Revenue Forecast 2021-2031 (US$ million, AGR%, CAGR%): W-Shaped Recovery
Table 104: Asia Pacific Smart Glass and Smart Window Market Forecast by Technology, 2021-2031 (US$ million, AGR %)
Table 105: Asia Pacific Smart Glass and Smart Window Market by Technology, 2021-2031 (US$ Mn, AGR%) (V-shaped Recovery)
Table 106: Asia Pacific Smart Glass and Smart Window Market by Technology, 2021-2031 (US$ Mn, AGR%) (U-shaped Recovery)
Table 107: Asia Pacific Smart Glass and Smart Window Market by Technology, 2021-2031 (US$ Mn, AGR%) (L-shaped Recovery)
Table 108: Asia Pacific Smart Glass and Smart Window Market by Technology, 2021-2031 (US$ Mn, AGR%) (W-shaped Recovery)
Table 109: Asia Pacific Smart Glass and Smart Window Market Forecast by Application, 2021-2031 (US$ million, AGR %)
Table 110: Asia Pacific Smart Glass and Smart Window Market by Application, 2021-2031 (US$ Mn, AGR%) (V-shaped Recovery)
Table 111: Asia Pacific Smart Glass and Smart Window Market by Application, 2021-2031 (US$ Mn, AGR%) (U-shaped Recovery)
Table 112: Asia Pacific Smart Glass and Smart Window Market by Application, 2021-2031 (US$ Mn, AGR%) (L-shaped Recovery)
Table 113: Asia Pacific Smart Glass and Smart Window Market by Application, 2021-2031 (US$ Mn, AGR%) (W-shaped Recovery)
Table 114: China Smart Glass and Smart Window Market Forecast 2021-2031 (US$ million, AGR %, CAGR %)
Table 115: China Smart Glass and Smart Window Market, Revenue Forecast 2021-2031 (US$ million, AGR%, CAGR%): V-Shaped Recovery
Table 116: China Smart Glass and Smart Window Market, Revenue Forecast 2021-2031 (US$ million, AGR%, CAGR%): U-Shaped Recovery
Table 117: China Smart Glass and Smart Window Market, Revenue Forecast 2021-2031 (US$ million, AGR%, CAGR%): L-Shaped Recovery
Table 118: China Smart Glass and Smart Window Market, Revenue Forecast 2021-2031 (US$ million, AGR%, CAGR%): W-Shaped Recovery
Table 119: Japan Smart Glass and Smart Window Market Forecast 2021-2031 (US$ million, AGR %, CAGR %)
Table 130: Japan Smart Glass and Smart Window Market, Revenue Forecast 2021-2031 (US$ million, AGR%, CAGR%): V-Shaped Recovery
Table 131: Japan Smart Glass and Smart Window Market, Revenue Forecast 2021-2031 (US$ million, AGR%, CAGR%): U-Shaped Recovery
Table 132: Japan Smart Glass and Smart Window Market, Revenue Forecast 2021-2031 (US$ million, AGR%, CAGR%): L-Shaped Recovery
Table 133: Japan Smart Glass and Smart Window Market, Revenue Forecast 2021-2031 (US$ million, AGR%, CAGR%): W-Shaped Recovery
Table 134: Australia Smart Glass and Smart Window Market Forecast 2021-2031 (US$ million, AGR %, CAGR %)
Table 135: Australia Smart Glass and Smart Window Market, Revenue Forecast 2021-2031 (US$ million, AGR%, CAGR%): V-Shaped Recovery
Table 136: Australia Smart Glass and Smart Window Market, Revenue Forecast 2021-2031 (US$ million, AGR%, CAGR%): U-Shaped Recovery
Table 137: Australia Smart Glass and Smart Window Market, Revenue Forecast 2021-2031 (US$ million, AGR%, CAGR%): L-Shaped Recovery
Table 138: Australia Smart Glass and Smart Window Market, Revenue Forecast 2021-2031 (US$ million, AGR%, CAGR%): W-Shaped Recovery
Table 139: India Smart Glass and Smart Window Market Forecast 2021-2031 (US$ million, AGR %, CAGR %)
Table 140: India Smart Glass and Smart Window Market, Revenue Forecast 2021-2031 (US$ million, AGR%, CAGR%): V-Shaped Recovery
Table 141: India Smart Glass and Smart Window Market, Revenue Forecast 2021-2031 (US$ million, AGR%, CAGR%): U-Shaped Recovery
Table 142: India Smart Glass and Smart Window Market, Revenue Forecast 2021-2031 (US$ million, AGR%, CAGR%): L-Shaped Recovery
Table 143: India Smart Glass and Smart Window Market, Revenue Forecast 2021-2031 (US$ million, AGR%, CAGR%): W-Shaped Recovery
Table 144: South Korea Smart Glass and Smart Window Market Forecast 2021-2031 (US$ million, AGR %, CAGR %)
Table 145: South Korea Smart Glass and Smart Window Market, Revenue Forecast 2021-2031 (US$ million, AGR%, CAGR%): V-Shaped Recovery
Table 146: South Korea Smart Glass and Smart Window Market, Revenue Forecast 2021-2031 (US$ million, AGR%, CAGR%): U-Shaped Recovery
Table 147: South Korea Smart Glass and Smart Window Market, Revenue Forecast 2021-2031 (US$ million, AGR%, CAGR%): L-Shaped Recovery
Table 148: India Smart Glass and Smart Window Market, Revenue Forecast 2021-2031 (US$ million, AGR%, CAGR%): W-Shaped Recovery
Table 149: Southeast Asia Smart Glass and Smart Window Market Forecast 2021-2031 (US$ million, AGR %, CAGR %)
Table 150: Southeast Asia Smart Glass and Smart Window Market, Revenue Forecast 2021-2031 (US$ million, AGR%, CAGR%): V-Shaped Recovery
Table 151: Southeast Asia Smart Glass and Smart Window Market, Revenue Forecast 2021-2031 (US$ million, AGR%, CAGR%): U-Shaped Recovery
Table 152: Southeast Asia Smart Glass and Smart Window Market, Revenue Forecast 2021-2031 (US$ million, AGR%, CAGR%): L-Shaped Recovery
Table 153: Southeast Asia Smart Glass and Smart Window Market, Revenue Forecast 2021-2031 (US$ million, AGR%, CAGR%): W-Shaped Recovery
Table 154: Rest of APAC Smart Glass and Smart Window Market Forecast 2021-2031 (US$ million, AGR %, CAGR %)
Table 155: Rest of APAC Smart Glass and Smart Window Market, Revenue Forecast 2021-2031 (US$ million, AGR%, CAGR%): V-Shaped Recovery
Table 156: Rest of APAC Smart Glass and Smart Window Market, Revenue Forecast 2021-2031 (US$ million, AGR%, CAGR%): U-Shaped Recovery
Table 157: Rest of APAC Smart Glass and Smart Window Market, Revenue Forecast 2021-2031 (US$ million, AGR%, CAGR%): L-Shaped Recovery
Table 158: Rest of APAC Smart Glass and Smart Window Market, Revenue Forecast 2021-2031 (US$ million, AGR%, CAGR%): W-Shaped Recovery
Table 159: Latin America Smart Glass and Smart Window Market Forecast by Technology, 2021-2031 (US$ million, AGR %)
Table 160: Latin America Smart Glass and Smart Window Market by Technology, 2021-2031 (US$ Mn, AGR%) (V-shaped Recovery)
Table 161: Latin America Smart Glass and Smart Window Market by Technology, 2021-2031 (US$ Mn, AGR%) (U-shaped Recovery)
Table 162: Latin America Smart Glass and Smart Window Market by Technology, 2021-2031 (US$ Mn, AGR%) (L-shaped Recovery)
Table 163: Latin America Smart Glass and Smart Window Market by Technology, 2021-2031 (US$ Mn, AGR%) (W-shaped Recovery)
Table 164: Latin America Smart Glass and Smart Window Market Forecast by Application, 2021-2031 (US$ million, AGR %)
Table 165: Latin America Smart Glass and Smart Window Market by Application, 2021-2031 (US$ Mn, AGR%) (V-shaped Recovery)
Table 166: Latin America Smart Glass and Smart Window Market by Application, 2021-2031 (US$ Mn, AGR%) (U-shaped Recovery)
Table 167: Latin America Smart Glass and Smart Window Market by Application, 2021-2031 (US$ Mn, AGR%) (L-shaped Recovery)
Table 168: Latin America Smart Glass and Smart Window Market by Application, 2021-2031 (US$ Mn, AGR%) (W-shaped Recovery)
Table 169: Brazil Smart Glass and Smart Window Market Forecast 2021-2031 (US$ million, AGR %, CAGR %)
Table 170: Brazil Smart Glass and Smart Window Market, Revenue Forecast 2021-2031 (US$ million, AGR%, CAGR%): V-Shaped Recovery
Table 171: Brazil Smart Glass and Smart Window Market, Revenue Forecast 2021-2031 (US$ million, AGR%, CAGR%): U-Shaped Recovery
Table 172: Brazil Smart Glass and Smart Window Market, Revenue Forecast 2021-2031 (US$ million, AGR%, CAGR%): L-Shaped Recovery
Table 173: Brazil Smart Glass and Smart Window Market, Revenue Forecast 2021-2031 (US$ million, AGR%, CAGR%): W-Shaped Recovery
Table 174: Mexico Smart Glass and Smart Window Market Forecast 2021-2031 (US$ million, AGR %, CAGR %)
Table 175: Mexico Smart Glass and Smart Window Market, Revenue Forecast 2021-2031 (US$ million, AGR%, CAGR%): V-Shaped Recovery
Table 176: Mexico Smart Glass and Smart Window Market, Revenue Forecast 2021-2031 (US$ million, AGR%, CAGR%): U-Shaped Recovery
Table 177: Mexico Smart Glass and Smart Window Market, Revenue Forecast 2021-2031 (US$ million, AGR%, CAGR%): L-Shaped Recovery
Table 178: Mexico Smart Glass and Smart Window Market, Revenue Forecast 2021-2031 (US$ million, AGR%, CAGR%): W-Shaped Recovery
Table 179: Rest of Latin America Smart Glass and Smart Window Market Forecast 2021-2031 (US$ million, AGR %, CAGR %)
Table 180: Rest of Latin America Smart Glass and Smart Window Market, Revenue Forecast 2021-2031 (US$ million, AGR%, CAGR%): V-Shaped Recovery
Table 181: Rest of Latin America Smart Glass and Smart Window Market, Revenue Forecast 2021-2031 (US$ million, AGR%, CAGR%): U-Shaped Recovery
Table 182: Rest of Latin America Smart Glass and Smart Window Market, Revenue Forecast 2021-2031 (US$ million, AGR%, CAGR%): L-Shaped Recovery
Table 183: Rest of Latin America Smart Glass and Smart Window Market, Revenue Forecast 2021-2031 (US$ million, AGR%, CAGR%): W-Shaped Recovery
Table 184: MEA Smart Glass and Smart Window Market Forecast by Technology, 2021-2031 (US$ million, AGR %)
Table 185: MEA Smart Glass and Smart Window Market by Technology, 2021-2031 (US$ Mn, AGR%) (V-shaped Recovery)
Table 186: MEA Smart Glass and Smart Window Market by Technology, 2021-2031 (US$ Mn, AGR%) (U-shaped Recovery)
Table 187: MEA Smart Glass and Smart Window Market by Technology, 2021-2031 (US$ Mn, AGR%) (L-shaped Recovery)
Table 188: MEA Smart Glass and Smart Window Market by Technology, 2021-2031 (US$ Mn, AGR%) (W-shaped Recovery)
Table 189: MEA Smart Glass and Smart Window Market Forecast by Application, 2021-2031 (US$ million, AGR %)
Table 190: MEA Smart Glass and Smart Window Market by Application, 2021-2031 (US$ Mn, AGR%) (V-shaped Recovery)
Table 191: MEA Smart Glass and Smart Window Market by Application, 2021-2031 (US$ Mn, AGR%) (U-shaped Recovery)
Table 192: MEA Smart Glass and Smart Window Market by Application, 2021-2031 (US$ Mn, AGR%) (L-shaped Recovery)
Table 193: MEA Smart Glass and Smart Window Market by Application, 2021-2031 (US$ Mn, AGR%) (W-shaped Recovery)
Table 194: GCC Countries Smart Glass and Smart Window Market Forecast 2021-2031 (US$ million, AGR %, CAGR %)
Table 195: GCC Countries Smart Glass and Smart Window Market, Revenue Forecast 2021-2031 (US$ million, AGR%, CAGR%): V-Shaped Recovery
Table 196: GCC Countries Smart Glass and Smart Window Market, Revenue Forecast 2021-2031 (US$ million, AGR%, CAGR%): U-Shaped Recovery
Table 197: GCC Countries Smart Glass and Smart Window Market, Revenue Forecast 2021-2031 (US$ million, AGR%, CAGR%): L-Shaped Recovery
Table 198: GCC Countries Smart Glass and Smart Window Market, Revenue Forecast 2021-2031 (US$ million, AGR%, CAGR%): W-Shaped Recovery
Table 199: South Africa Smart Glass and Smart Window Market Forecast 2021-2031 (US$ million, AGR %, CAGR %)
Table 200: South Africa Smart Glass and Smart Window Market, Revenue Forecast 2021-2031 (US$ million, AGR%, CAGR%): V-Shaped Recovery
Table 201: South Africa Smart Glass and Smart Window Market, Revenue Forecast 2021-2031 (US$ million, AGR%, CAGR%): U-Shaped Recovery
Table 202: South Africa Smart Glass and Smart Window Market, Revenue Forecast 2021-2031 (US$ million, AGR%, CAGR%): L-Shaped Recovery
Table 203: South Africa Smart Glass and Smart Window Market, Revenue Forecast 2021-2031 (US$ million, AGR%, CAGR%): W-Shaped Recovery
Table 204: Rest of MEA Smart Glass and Smart Window Market Forecast 2021-2031 (US$ million, AGR %, CAGR %)
Table 205: Rest of MEA Smart Glass and Smart Window Market, Revenue Forecast 2021-2031 (US$ million, AGR%, CAGR%): V-Shaped Recovery
Table 206: Rest of MEA Smart Glass and Smart Window Market, Revenue Forecast 2021-2031 (US$ million, AGR%, CAGR%): U-Shaped Recovery
Table 207: Rest of MEA Smart Glass and Smart Window Market, Revenue Forecast 2021-2031 (US$ million, AGR%, CAGR%): L-Shaped Recovery
Table 208: Rest of MEA Smart Glass and Smart Window Market, Revenue Forecast 2021-2031 (US$ million, AGR%, CAGR%): W-Shaped Recovery
Table 209: Saint Gobain S.A. (FY 2019)
Table 210: Saint Gobain S.A.Company Total Company Sales 2018-2019 (US$ Mn, AGR %)
Table 211: Saint Gobain Product & Services
Table 212: Saint Gobain Growth Parameters
Table 213: Gentex Corporation (FY 2019)
Table 214: Gentex Corporation Product & Services
Table 215: Gentex Corporation Growth Parameters
Table 216: AGC Inc (FY 2019)
Table 217: AGC Inc Product & Services
Table 218: AGC Inc Growth Parameters
Table 219: Gerresheimer AG (FY 2019)
Table 221: Gerresheimer AG Product & Services
Table 222: Gerresheimer AG Growth Parameters
Table 223: 1.9 Pleotint LLC (Suntuitive Glass) Profile (FY 2019)
Table 224: Pleotint LLC (Suntuitive Glass) Product & Services
Table 225: Pleotint LLC (Suntuitive Glass) Growth Parameters
Table 226: View Inc. Profile (FY 2019)
Table 227: View Inc. Product & Services
Table 228: View Inc. Growth Parameters
Table 229: Vision Systems Profile (FY 2019)
Table 230: Vision Systems Product & Services
Table 231: Vision Systems Growth Parameters
Table 232: Raven Brick LLC Profile (FY 2019)
Table 233: Raven Brick LLC Product & Services
Table 234: Raven Brick LLC Growth Parameters
Table 236: Smart Glass International Ltd. Profile (FY 2019)
Table 237: Smart Glass International Ltd. Product & Services
Table 238: Smart Glass International Ltd. Growth Parameters
List of Figures
Figure 1: Global Smart Glass and Smart Window Market Segmentation
Figure 2: Research Methodology
Figure 3: Global Smart Glass and Smart Window Market Overview
Figure 4: Porter’s Five Forces Analysis
Figure 5: PEST Analysis
Figure 6: SWOT Analysis
Figure 07: Global Smart Glass and Smart Window Market Share Forecast by Technology, 2021, 2031 (%)
Figure 08: Global Smart Glass and Smart Window Market for Active Glass Segment: Revenue Forecast 2021-2031 (US$ million, AGR%)
Figure 09: Smart Glass and Smart Window Market for Active Glass, 2021-2031 (US$ Mn, AGR%, (V-shaped Recovery)
Figure 10: Smart Glass and Smart Window Market for Active Glass, 2021-2031 (US$ Mn, AGR%, (U-shaped Recovery)
Figure 11: Smart Glass and Smart Window Market for Active Glass, 2021-2031 (US$ Mn, AGR%, (L-shaped Recovery)
Figure 12: Smart Glass and Smart Window Market for Active Glass, 2021-2031 (US$ Mn, AGR%, (W-shaped Recovery)
Figure 13: Global Smart Glass and Smart Window Market for Passive Glass Segment: Revenue Forecast 2021-2031 (US$ million, AGR%)
Figure 14: Smart Glass and Smart Window Market for Passive Glass, 2021-2031 (US$ Mn, AGR%, (V-shaped Recovery)
Figure 15: Smart Glass and Smart Window Market for Passive Glass, 2021-2031 (US$ Mn, AGR%, (U-shaped Recovery)
Figure 16: Smart Glass and Smart Window Market for Passive Glass, 2021-2031 (US$ Mn, AGR%, (L-shaped Recovery)
Figure 17: Smart Glass and Smart Window Market for Passive Glass, 2021-2031 (US$ Mn, AGR%, (W-shaped Recovery)
Figure 18: Global Smart Glass and Smart Window Market Share Forecast by Application, 2021, 2031 (%)
Figure 19: Global Smart Glass and Smart Window Market for Architectural Segment: Revenue Forecast 2021-2031 (US$ million, AGR%)
Figure 20: Smart Glass and Smart Window Market for Architectural, 2021-2031 (US$ Mn, AGR%, (V-shaped Recovery)
Figure 21: Smart Glass and Smart Window Market for Architectural, 2021-2031 (US$ Mn, AGR%, (U-shaped Recovery)
Figure 22: Smart Glass and Smart Window Market for Architectural, 2021-2031 (US$ Mn, AGR%, (L-shaped Recovery)
Figure 23: Smart Glass and Smart Window Market for Architectural, 2021-2031 (US$ Mn, AGR%, (W-shaped Recovery)
Figure 24: Global Smart Glass and Smart Window Market for Automotive Segment: Revenue Forecast 2021-2031 (US$ million, AGR%)
Figure 25: Smart Glass and Smart Window Market for Automotive, 2021-2031 (US$ Mn, AGR%, (V-shaped Recovery)
Figure 26: Smart Glass and Smart Window Market for Automotive, 2021-2031 (US$ Mn, AGR%, (U-shaped Recovery)
Figure 27: Smart Glass and Smart Window Market for Automotive, 2021-2031 (US$ Mn, AGR%, (L-shaped Recovery)
Figure 28: Smart Glass and Smart Window Market for Automotive, 2021-2031 (US$ Mn, AGR%, (W-shaped Recovery)
Figure 29: Global Smart Glass and Smart Window Market for Aircraft Segment: Revenue Forecast 2021-2031 (US$ million, AGR%)
Figure 30: Smart Glass and Smart Window Market for Aircraft, 2021-2031 (US$ Mn, AGR%, (V-shaped Recovery)
Figure 31: Smart Glass and Smart Window Market for Aircraft, 2021-2031 (US$ Mn, AGR%, (U-shaped Recovery)
Figure 32: Smart Glass and Smart Window Market for Aircraft, 2021-2031 (US$ Mn, AGR%, (L-shaped Recovery)
Figure 33: Smart Glass and Smart Window Market for Aircraft, 2021-2031 (US$ Mn, AGR%, (W-shaped Recovery)
Figure 34: Global Smart Glass and Smart Window Market for Automotive Segment: Revenue Forecast 2021-2031 (US$ million, AGR%)
Figure 35: Smart Glass and Smart Window Market for Consumer Electronics, 2021-2031 (US$ Mn, AGR%, (V-shaped Recovery)
Figure 36: Smart Glass and Smart Window Market for Consumer Electronics, 2021-2031 (US$ Mn, AGR%, (U-shaped Recovery)
Figure 37: Smart Glass and Smart Window Market for Consumer Electronics, 2021-2031 (US$ Mn, AGR%, (L-shaped Recovery)
Figure 38: Smart Glass and Smart Window Market for Consumer Electronics, 2021-2031 (US$ Mn, AGR%, (W-shaped Recovery)
Figure 39: Global Smart Glass and Smart Window Market for Others Segment: Revenue Forecast 2021-2031 (US$ million, AGR%)
Figure 40: Smart Glass and Smart Window Market for Others, 2021-2031 (US$ Mn, AGR%, (V-shaped Recovery)
Figure 41: Smart Glass and Smart Window Market for Others, 2021-2031 (US$ Mn, AGR%, (U-shaped Recovery)
Figure 42: Smart Glass and Smart Window Market for Others, 2021-2031 (US$ Mn, AGR%, (L-shaped Recovery)
Figure 43: Smart Glass and Smart Window Market for Others, 2021-2031 (US$ Mn, AGR%, (W-shaped Recovery)
Figure 44: Global Smart Glass and Smart Window Market Share Forecast by Region, 2021, 2031 (%)
Figure 45: North America Smart Glass and Smart Window Market for Active Glass, 2021-2031 (US$ Mn, AGR%, (V-shaped Recovery)
Figure 46: North America Smart Glass and Smart Window Market for Passive Glass, 2021-2031 (US$ Mn, AGR%, (V-shaped Recovery)
Figure 47: North America Smart Glass and Smart Window Market for Active Glass, 2021-2031 (US$ Mn, AGR%, (U-shaped Recovery)
Figure 48: North America Smart Glass and Smart Window Market for Passive Glass, 2021-2031 (US$ Mn, AGR%, (U-shaped Recovery)
Figure 49: North America Smart Glass and Smart Window Market for Active Glass, 2021-2031 (US$ Mn, AGR%, (L-shaped Recovery)
Figure 50: North America Smart Glass and Smart Window Market for Passive Glass, 2021-2031 (US$ Mn, AGR%, (L-shaped Recovery)
Figure 51: North America Smart Glass and Smart Window Market for Active Glass, 2021-2031 (US$ Mn, AGR%, (W-shaped Recovery)
Figure 52: North America Smart Glass and Smart Window Market for Passive Glass, 2021-2031 (US$ Mn, AGR%, (W-shaped Recovery)
Figure 53: North America Smart Glass and Smart Window Market for Architectural, 2021-2031 (US$ Mn, AGR%, (V-shaped Recovery)
Figure 54: North America Smart Glass and Smart Window Market for Automotive, 2021-2031 (US$ Mn, AGR%, (V-shaped Recovery)
Figure 55: North America Smart Glass and Smart Window Market for Aircraft, 2021-2031 (US$ Mn, AGR%, (V-shaped Recovery)
Figure 56: North America Smart Glass and Smart Window Market for Consumer Electronics, 2021-2031 (US$ Mn, AGR%, (V-shaped Recovery)
Figure 57: North America Smart Glass and Smart Window Market for Others, 2021-2031 (US$ Mn, AGR%, (V-shaped Recovery)
Figure 58: North America Smart Glass and Smart Window Market for Architectural, 2021-2031 (US$ Mn, AGR%, (U-shaped Recovery)
Figure 59: North America Smart Glass and Smart Window Market for Automotive, 2021-2031 (US$ Mn, AGR%, (U-shaped Recovery)
Figure 60: North America Smart Glass and Smart Window Market for Aircraft, 2021-2031 (US$ Mn, AGR%, (U-shaped Recovery)
Figure 61: North America Smart Glass and Smart Window Market for Consumer Electronics, 2021-2031 (US$ Mn, AGR%, (U-shaped Recovery)
Figure 62: North America Smart Glass and Smart Window Market for Others, 2021-2031 (US$ Mn, AGR%, (U-shaped Recovery)
Figure 63: North America Smart Glass and Smart Window Market for Architectural, 2021-2031 (US$ Mn, AGR%, (L-shaped Recovery)
Figure 64: North America Smart Glass and Smart Window Market for Automotive, 2021-2031 (US$ Mn, AGR%, (L-shaped Recovery)
Figure 65: North America Smart Glass and Smart Window Market for Aircraft, 2021-2031 (US$ Mn, AGR%, (L-shaped Recovery)
Figure 66: North America Smart Glass and Smart Window Market for Consumer Electronics, 2021-2031 (US$ Mn, AGR%, (L-shaped Recovery)
Figure 67: North America Smart Glass and Smart Window Market for Others, 2021-2031 (US$ Mn, AGR%, (L-shaped Recovery)
Figure 68: North America Smart Glass and Smart Window Market for Architectural, 2021-2031 (US$ Mn, AGR%, (W-shaped Recovery)
Figure 69: North America Smart Glass and Smart Window Market for Automotive, 2021-2031 (US$ Mn, AGR%, (W-shaped Recovery)
Figure 70: North America Smart Glass and Smart Window Market for Aircraft, 2021-2031 (US$ Mn, AGR%, (W-shaped Recovery)
Figure 71: North America Smart Glass and Smart Window Market for Consumer Electronics, 2021-2031 (US$ Mn, AGR%, (W-shaped Recovery)
Figure 72: North America Smart Glass and Smart Window Market for Others, 2021-2031 (US$ Mn, AGR%, (W-shaped Recovery)
Figure 73: U.S. Smart Glass and Smart Window Market Forecast 2021-2031 (US$ million, AGR %)
Figure 74: “V”-Shaped Recovery: U.S. Smart Glass and Smart Window Market, Revenue Forecast 2021-2031 (US$ million, AGR%)
Figure 75: “U”-Shaped Recovery: U.S. Smart Glass and Smart Window Market, Revenue Forecast 2021-2031 (US$ million, AGR%)
Figure 76: “L”-Shaped Recovery: U.S. Smart Glass and Smart Window Market, Revenue Forecast 2021-2031 (US$ million, AGR%)
Figure 77: “W”-Shaped Recovery: U.S. Smart Glass and Smart Window Market, Revenue Forecast 2021-2031 (US$ million, AGR%)
Figure 78: Canada Smart Glass and Smart Window Market Forecast 2021-2031 (US$ million, AGR %)
Figure 79: “V”-Shaped Recovery: Canada Smart Glass and Smart Window Market, Revenue Forecast 2021-2031 (US$ million, AGR%)
Figure 80: “U”-Shaped Recovery: Canada Smart Glass and Smart Window Market, Revenue Forecast 2021-2031 (US$ million, AGR%)
Figure 81: “L”-Shaped Recovery: Canada Smart Glass and Smart Window Market, Revenue Forecast 2021-2031 (US$ million, AGR%)
Figure 82: “W”-Shaped Recovery: Canada Smart Glass and Smart Window Market, Revenue Forecast 2021-2031 (US$ million, AGR%)
Figure 83: Europe Smart Glass and Smart Window Market for Active Glass, 2021-2031 (US$ Mn, AGR%, (V-shaped Recovery)
Figure 84: Europe Smart Glass and Smart Window Market for Passive Glass, 2021-2031 (US$ Mn, AGR%, (V-shaped Recovery)
Figure 85: Europe Smart Glass and Smart Window Market for Active Glass, 2021-2031 (US$ Mn, AGR%, (U-shaped Recovery)
Figure 86: Europe Smart Glass and Smart Window Market for Passive Glass, 2021-2031 (US$ Mn, AGR%, (U-shaped Recovery)
Figure 87: Europe Smart Glass and Smart Window Market for Active Glass, 2021-2031 (US$ Mn, AGR%, (L-shaped Recovery)
Figure 88: Europe Smart Glass and Smart Window Market for Passive Glass, 2021-2031 (US$ Mn, AGR%, (L-shaped Recovery)
Figure 89: Europe Smart Glass and Smart Window Market for Active Glass, 2021-2031 (US$ Mn, AGR%, (W-shaped Recovery)
Figure 90: Europe Smart Glass and Smart Window Market for Passive Glass, 2021-2031 (US$ Mn, AGR%, (W-shaped Recovery)
Figure 91: Europe Smart Glass and Smart Window Market for Architectural, 2021-2031 (US$ Mn, AGR%, (V-shaped Recovery)
Figure 92: Europe Smart Glass and Smart Window Market for Automotive, 2021-2031 (US$ Mn, AGR%, (V-shaped Recovery)
Figure 93: Europe Smart Glass and Smart Window Market for Aircraft, 2021-2031 (US$ Mn, AGR%, (V-shaped Recovery)
Figure 94: Europe Smart Glass and Smart Window Market for Consumer Electronics, 2021-2031 (US$ Mn, AGR%, (V-shaped Recovery)
Figure 95: Europe Smart Glass and Smart Window Market for Others, 2021-2031 (US$ Mn, AGR%, (V-shaped Recovery)
Figure 96: Europe Smart Glass and Smart Window Market for Architectural, 2021-2031 (US$ Mn, AGR%, (U-shaped Recovery)
Figure 97: Europe Smart Glass and Smart Window Market for Automotive, 2021-2031 (US$ Mn, AGR%, (U-shaped Recovery)
Figure 98: Europe Smart Glass and Smart Window Market for Aircraft, 2021-2031 (US$ Mn, AGR%, (U-shaped Recovery)
Figure 99: Europe Smart Glass and Smart Window Market for Consumer Electronics, 2021-2031 (US$ Mn, AGR%, (U-shaped Recovery)
Figure 100: Europe Smart Glass and Smart Window Market for Others, 2021-2031 (US$ Mn, AGR%, (U-shaped Recovery)
Figure 101: Europe Smart Glass and Smart Window Market for Architectural, 2021-2031 (US$ Mn, AGR%, (L-shaped Recovery)
Figure 102: Europe Smart Glass and Smart Window Market for Automotive, 2021-2031 (US$ Mn, AGR%, (L-shaped Recovery)
Figure 103: Europe Smart Glass and Smart Window Market for Aircraft, 2021-2031 (US$ Mn, AGR%, (L-shaped Recovery)
Figure 104: Europe Smart Glass and Smart Window Market for Consumer Electronics, 2021-2031 (US$ Mn, AGR%, (L-shaped Recovery)
Figure 105: Europe Smart Glass and Smart Window Market for Others, 2021-2031 (US$ Mn, AGR%, (L-shaped Recovery)
Figure 106: Europe Smart Glass and Smart Window Market for Architectural, 2021-2031 (US$ Mn, AGR%, (W-shaped Recovery)
Figure 107: Europe Smart Glass and Smart Window Market for Automotive, 2021-2031 (US$ Mn, AGR%, (W-shaped Recovery)
Figure 108: Europe Smart Glass and Smart Window Market for Aircraft, 2021-2031 (US$ Mn, AGR%, (W-shaped Recovery)
Figure 109: Europe Smart Glass and Smart Window Market for Consumer Electronics, 2021-2031 (US$ Mn, AGR%, (W-shaped Recovery)
Figure 110: Europe Smart Glass and Smart Window Market for Others, 2021-2031 (US$ Mn, AGR%, (W-shaped Recovery)
Figure 111: U.K. Smart Glass and Smart Window Market Forecast 2021-2031 (US$ million, AGR %)
Figure 112: “V”-Shaped Recovery: U.K. Smart Glass and Smart Window Market, Revenue Forecast 2021-2031 (US$ million, AGR%)
Figure 113: “U”-Shaped Recovery: U.K. Smart Glass and Smart Window Market, Revenue Forecast 2021-2031 (US$ million, AGR%)
Figure 114: “L”-Shaped Recovery: U.K. Smart Glass and Smart Window Market, Revenue Forecast 2021-2031 (US$ million, AGR%)
Figure 115: “W”-Shaped Recovery: U.K. Smart Glass and Smart Window Market, Revenue Forecast 2021-2031 (US$ million, AGR%)
Figure 116: Germany Smart Glass and Smart Window Market Forecast 2021-2031 (US$ million, AGR %)
Figure 117: Europe Smart Glass and Smart Window Market for Automotive, 2021-2031 (US$ Mn, AGR%, (V-shaped Recovery)
Figure 118: “U”-Shaped Recovery: Germany Smart Glass and Smart Window Market, Revenue Forecast 2021-2031 (US$ million, AGR%)
Figure 119: “L”-Shaped Recovery: Germany Smart Glass and Smart Window Market, Revenue Forecast 2021-2031 (US$ million, AGR%)
Figure 120: “W”-Shaped Recovery: Germany Smart Glass and Smart Window Market, Revenue Forecast 2021-2031 (US$ million, AGR%)
Figure 121: France Smart Glass and Smart Window Market Forecast 2021-2031 (US$ million, AGR %)
Figure 122: “V”-Shaped Recovery: France Smart Glass and Smart Window Market, Revenue Forecast 2021-2031 (US$ million, AGR%)
Figure 123: “U”-Shaped Recovery: France Smart Glass and Smart Window Market, Revenue Forecast 2021-2031 (US$ million, AGR%)
Figure 124: “L”-Shaped Recovery: France Smart Glass and Smart Window Market, Revenue Forecast 2021-2031 (US$ million, AGR%)
Figure 125: “W”-Shaped Recovery: France Smart Glass and Smart Window Market, Revenue Forecast 2021-2031 (US$ million, AGR%)
Figure 126: Europe Smart Glass and Smart Window Market for Automotive, 2021-2031 (US$ Mn, AGR%, (W-shaped Recovery)
Figure 127: “V”-Shaped Recovery: Italy Smart Glass and Smart Window Market, Revenue Forecast 2021-2031 (US$ million, AGR%)
Figure 128: “U”-Shaped Recovery: Italy Smart Glass and Smart Window Market, Revenue Forecast 2021-2031 (US$ million, AGR%)
Figure 129: “L”-Shaped Recovery: Italy Smart Glass and Smart Window Market, Revenue Forecast 2021-2031 (US$ million, AGR%)
Figure 130: “W”-Shaped Recovery: Italy Smart Glass and Smart Window Market, Revenue Forecast 2021-2031 (US$ million, AGR%)
Figure 131: Spain Smart Glass and Smart Window Market Forecast 2021-2031 (US$ million, AGR %)
Figure 132: “V”-Shaped Recovery: Spain Smart Glass and Smart Window Market, Revenue Forecast 2021-2031 (US$ million, AGR%)
Figure 133: “U”-Shaped Recovery: Spain Smart Glass and Smart Window Market, Revenue Forecast 2021-2031 (US$ million, AGR%)
Figure 134: “L”-Shaped Recovery: Spain Smart Glass and Smart Window Market, Revenue Forecast 2021-2031 (US$ million, AGR%)
Figure 135: “W”-Shaped Recovery: Spain Smart Glass and Smart Window Market, Revenue Forecast 2021-2031 (US$ million, AGR%)
Figure 136: Rest of Europe Smart Glass and Smart Window Market Forecast 2021-2031 (US$ million, AGR %)
Figure 137: “V”-Shaped Recovery: Rest of Europe Smart Glass and Smart Window Market, Revenue Forecast 2021-2031 (US$ million, AGR%)
Figure 138: “U”-Shaped Recovery: Rest of Europe Smart Glass and Smart Window Market, Revenue Forecast 2021-2031 (US$ million, AGR%)
Figure 139: “L”-Shaped Recovery: Rest of Europe Smart Glass and Smart Window Market, Revenue Forecast 2021-2031 (US$ million, AGR%)
Figure 140: “W”-Shaped Recovery: Rest of Europe Smart Glass and Smart Window Market, Revenue Forecast 2021-2031 (US$ million, AGR%)
Figure 141: Asia Pacific Smart Glass and Smart Window Market for Active Glass, 2021-2031 (US$ Mn, AGR%, (V-shaped Recovery)
Figure 142: Asia Pacific Smart Glass and Smart Window Market for Passive Glass, 2021-2031 (US$ Mn, AGR%, (V-shaped Recovery)
Figure 143: Asia Pacific Smart Glass and Smart Window Market for Active Glass, 2021-2031 (US$ Mn, AGR%, (U-shaped Recovery)
Figure 144: Asia Pacific Smart Glass and Smart Window Market for Passive Glass, 2021-2031 (US$ Mn, AGR%, (U-shaped Recovery)
Figure 145: Asia Pacific Smart Glass and Smart Window Market for Active Glass, 2021-2031 (US$ Mn, AGR%, (L-shaped Recovery)
Figure 146: Asia Pacific Smart Glass and Smart Window Market for Passive Glass, 2021-2031 (US$ Mn, AGR%, (L-shaped Recovery)
Figure 147: Asia Pacific Smart Glass and Smart Window Market for Active Glass, 2021-2031 (US$ Mn, AGR%, (W-shaped Recovery)
Figure 148: Asia Pacific Smart Glass and Smart Window Market for Passive Glass, 2021-2031 (US$ Mn, AGR%, (W-shaped Recovery)
Figure 149: Asia Pacific Smart Glass and Smart Window Market for Architectural, 2021-2031 (US$ Mn, AGR%, (V-shaped Recovery)
Figure 150: Asia Pacific Smart Glass and Smart Window Market for Automotive, 2021-2031 (US$ Mn, AGR%, (V-shaped Recovery)
Figure 151: Asia Pacific Smart Glass and Smart Window Market for Aircraft, 2021-2031 (US$ Mn, AGR%, (V-shaped Recovery)
Figure 152: Asia Pacific Smart Glass and Smart Window Market for Consumer Electronics, 2021-2031 (US$ Mn, AGR%, (V-shaped Recovery)
Figure 153: Asia Pacific Smart Glass and Smart Window Market for Others, 2021-2031 (US$ Mn, AGR%, (V-shaped Recovery)
Figure 154: Asia Pacific Smart Glass and Smart Window Market for Architectural, 2021-2031 (US$ Mn, AGR%, (U-shaped Recovery)
Figure 155: Asia Pacific Smart Glass and Smart Window Market for Automotive, 2021-2031 (US$ Mn, AGR%, (U-shaped Recovery)
Figure 156: Asia Pacific Smart Glass and Smart Window Market for Aircraft, 2021-2031 (US$ Mn, AGR%, (U-shaped Recovery)
Figure 157: Asia Pacific Smart Glass and Smart Window Market for Consumer Electronics, 2021-2031 (US$ Mn, AGR%, (U-shaped Recovery)
Figure 158: Asia Pacific Smart Glass and Smart Window Market for Others, 2021-2031 (US$ Mn, AGR%, (U-shaped Recovery)
Figure 159: Asia Pacific Smart Glass and Smart Window Market for Architectural, 2021-2031 (US$ Mn, AGR%, (L-shaped Recovery)
Figure 160: Asia Pacific Smart Glass and Smart Window Market for Automotive, 2021-2031 (US$ Mn, AGR%, (L-shaped Recovery)
Figure 161: Asia Pacific Smart Glass and Smart Window Market for Aircraft, 2021-2031 (US$ Mn, AGR%, (L-shaped Recovery)
Figure 162: Asia Pacific Smart Glass and Smart Window Market for Consumer Electronics, 2021-2031 (US$ Mn, AGR%, (L-shaped Recovery)
Figure 163: Asia Pacific Smart Glass and Smart Window Market for Others, 2021-2031 (US$ Mn, AGR%, (L-shaped Recovery)
Figure 164: Asia Pacific Smart Glass and Smart Window Market for Architectural, 2021-2031 (US$ Mn, AGR%, (W-shaped Recovery)
Figure 165: Asia Pacific Smart Glass and Smart Window Market for Automotive, 2021-2031 (US$ Mn, AGR%, (W-shaped Recovery)
Figure 166: Asia Pacific Smart Glass and Smart Window Market for Aircraft, 2021-2031 (US$ Mn, AGR%, (W-shaped Recovery)
Figure 167: Asia Pacific Smart Glass and Smart Window Market for Consumer Electronics, 2021-2031 (US$ Mn, AGR%, (W-shaped Recovery)
Figure 168: Asia Pacific Smart Glass and Smart Window Market for Others, 2021-2031 (US$ Mn, AGR%, (W-shaped Recovery)
Figure 169: China Smart Glass and Smart Window Market Forecast 2021-2031 (US$ million, AGR %)
Figure 170: “V”-Shaped Recovery: China Smart Glass and Smart Window Market, Revenue Forecast 2021-2031 (US$ million, AGR%)
Figure 171: “U”-Shaped Recovery: China Smart Glass and Smart Window Market, Revenue Forecast 2021-2031 (US$ million, AGR%)
Figure 172: “L”-Shaped Recovery: China Smart Glass and Smart Window Market, Revenue Forecast 2021-2031 (US$ million, AGR%)
Figure 173: “W”-Shaped Recovery: China Smart Glass and Smart Window Market, Revenue Forecast 2021-2031 (US$ million, AGR%)
Figure 174: Japan Smart Glass and Smart Window Market Forecast 2021-2031 (US$ million, AGR %)
Figure 175: “V”-Shaped Recovery: Japan Smart Glass and Smart Window Market, Revenue Forecast 2021-2031 (US$ million, AGR%)
Figure 176: “U”-Shaped Recovery: Japan Smart Glass and Smart Window Market, Revenue Forecast 2021-2031 (US$ million, AGR%)
Figure 177: “L”-Shaped Recovery: Japan Smart Glass and Smart Window Market, Revenue Forecast 2021-2031 (US$ million, AGR%)
Figure 178: “W”-Shaped Recovery: Japan Smart Glass and Smart Window Market, Revenue Forecast 2021-2031 (US$ million, AGR%)
Figure 179: Australia Smart Glass and Smart Window Market Forecast 2021-2031 (US$ million, AGR %)
Figure 180: “V”-Shaped Recovery: Australia Smart Glass and Smart Window Market, Revenue Forecast 2021-2031 (US$ million, AGR%)
Figure 181: “U”-Shaped Recovery: Australia Smart Glass and Smart Window Market, Revenue Forecast 2021-2031 (US$ million, AGR%)
Figure 182: “L”-Shaped Recovery: Australia Smart Glass and Smart Window Market, Revenue Forecast 2021-2031 (US$ million, AGR%)
Figure 183: “W”-Shaped Recovery: Australia Smart Glass and Smart Window Market, Revenue Forecast 2021-2031 (US$ million, AGR%)
Figure 184: India Smart Glass and Smart Window Market Forecast 2021-2031 (US$ million, AGR %)
Figure 185: “V”-Shaped Recovery: India Smart Glass and Smart Window Market, Revenue Forecast 2021-2031 (US$ million, AGR%)
Figure 186: “U”-Shaped Recovery: India Smart Glass and Smart Window Market, Revenue Forecast 2021-2031 (US$ million, AGR%)
Figure 187: “L”-Shaped Recovery: India Smart Glass and Smart Window Market, Revenue Forecast 2021-2031 (US$ million, AGR%)
Figure 188: “W”-Shaped Recovery: India Smart Glass and Smart Window Market, Revenue Forecast 2021-2031 (US$ million, AGR%)
Figure 189: South Korea Smart Glass and Smart Window Market Forecast 2021-2031 (US$ million, AGR %)
Figure 190: “V”-Shaped Recovery: South Korea Smart Glass and Smart Window Market, Revenue Forecast 2021-2031 (US$ million, AGR%)
Figure 191: “U”-Shaped Recovery: South Korea Smart Glass and Smart Window Market, Revenue Forecast 2021-2031 (US$ million, AGR%)
Figure 192: “L”-Shaped Recovery: South Korea Smart Glass and Smart Window Market, Revenue Forecast 2021-2031 (US$ million, AGR%)
Figure 193: “W”-Shaped Recovery: South Korea Smart Glass and Smart Window Market, Revenue Forecast 2021-2031 (US$ million, AGR%)
Figure 194: Southeast Asia Smart Glass and Smart Window Market Forecast 2021-2031 (US$ million, AGR %)
Figure 195: “V”-Shaped Recovery: Southeast Asia Smart Glass and Smart Window Market, Revenue Forecast 2021-2031 (US$ million, AGR%)
Figure 196: “U”-Shaped Recovery: Southeast Asia Smart Glass and Smart Window Market, Revenue Forecast 2021-2031 (US$ million, AGR%)
Figure 197: “L”-Shaped Recovery: Southeast Asia Smart Glass and Smart Window Market, Revenue Forecast 2021-2031 (US$ million, AGR%)
Figure 198: “W”-Shaped Recovery: Southeast Asia Smart Glass and Smart Window Market, Revenue Forecast 2021-2031 (US$ million, AGR%)
Figure 199: Rest of APAC Smart Glass and Smart Window Market Forecast 2021-2031 (US$ million, AGR %)
Figure 200: “V”-Shaped Recovery: Rest of APAC Smart Glass and Smart Window Market, Revenue Forecast 2021-2031 (US$ million, AGR%)
Figure 201: “U”-Shaped Recovery: Rest of APAC Smart Glass and Smart Window Market, Revenue Forecast 2021-2031 (US$ million, AGR%)
Figure 202: “L”-Shaped Recovery: Rest of APAC Smart Glass and Smart Window Market, Revenue Forecast 2021-2031 (US$ million, AGR%)
Figure 203: “W”-Shaped Recovery: Rest of APAC Smart Glass and Smart Window Market, Revenue Forecast 2021-2031 (US$ million, AGR%)
Figure 204: Latin America Smart Glass and Smart Window Market for Active Glass, 2021-2031 (US$ Mn, AGR%, (V-shaped Recovery)
Figure 205: Latin America Smart Glass and Smart Window Market for Passive Glass, 2021-2031 (US$ Mn, AGR%, (V-shaped Recovery)
Figure 206: Latin America Smart Glass and Smart Window Market for Active Glass, 2021-2031 (US$ Mn, AGR%, (U-shaped Recovery)
Figure 207: Latin America Smart Glass and Smart Window Market for Passive Glass, 2021-2031 (US$ Mn, AGR%, (U-shaped Recovery)
Figure 208: Latin America Smart Glass and Smart Window Market for Active Glass, 2021-2031 (US$ Mn, AGR%, (L-shaped Recovery)
Figure 209: Latin America Smart Glass and Smart Window Market for Passive Glass, 2021-2031 (US$ Mn, AGR%, (L-shaped Recovery)
Figure 210: Latin America Smart Glass and Smart Window Market for Active Glass, 2021-2031 (US$ Mn, AGR%, (W-shaped Recovery)
Figure 211: Latin America Smart Glass and Smart Window Market for Passive Glass, 2021-2031 (US$ Mn, AGR%, (W-shaped Recovery)
Figure 212: Latin America Smart Glass and Smart Window Market for Architectural, 2021-2031 (US$ Mn, AGR%, (V-shaped Recovery)
Figure 213: Latin America Smart Glass and Smart Window Market for Automotive, 2021-2031 (US$ Mn, AGR%, (V-shaped Recovery)
Figure 214: Latin America Smart Glass and Smart Window Market for Aircraft, 2021-2031 (US$ Mn, AGR%, (V-shaped Recovery)
Figure 215: Latin America Smart Glass and Smart Window Market for Consumer Electronics, 2021-2031 (US$ Mn, AGR%, (V-shaped Recovery)
Figure 216: Latin America Smart Glass and Smart Window Market for Others, 2021-2031 (US$ Mn, AGR%, (V-shaped Recovery)
Figure 217: Latin America Smart Glass and Smart Window Market for Architectural, 2021-2031 (US$ Mn, AGR%, (U-shaped Recovery)
Figure 218: Latin America Smart Glass and Smart Window Market for Automotive, 2021-2031 (US$ Mn, AGR%, (U-shaped Recovery)
Figure 219: Latin America Smart Glass and Smart Window Market for Aircraft, 2021-2031 (US$ Mn, AGR%, (U-shaped Recovery)
Figure 220: Latin America Smart Glass and Smart Window Market for Consumer Electronics, 2021-2031 (US$ Mn, AGR%, (U-shaped Recovery)
Figure 221: Latin America Smart Glass and Smart Window Market for Others, 2021-2031 (US$ Mn, AGR%, (U-shaped Recovery)
Figure 222: Latin America Smart Glass and Smart Window Market for Architectural, 2021-2031 (US$ Mn, AGR%, (L-shaped Recovery)
Figure 223: Latin America Smart Glass and Smart Window Market for Automotive, 2021-2031 (US$ Mn, AGR%, (L-shaped Recovery)
Figure 224: Latin America Smart Glass and Smart Window Market for Aircraft, 2021-2031 (US$ Mn, AGR%, (L-shaped Recovery)
Figure 225: Latin America Smart Glass and Smart Window Market for Consumer Electronics, 2021-2031 (US$ Mn, AGR%, (L-shaped Recovery)
Figure 226: Latin America Smart Glass and Smart Window Market for Others, 2021-2031 (US$ Mn, AGR%, (L-shaped Recovery)
Figure 227: Latin America Smart Glass and Smart Window Market for Architectural, 2021-2031 (US$ Mn, AGR%, (W-shaped Recovery)
Figure 228: Latin America Smart Glass and Smart Window Market for Automotive, 2021-2031 (US$ Mn, AGR%, (W-shaped Recovery)
Figure 229: Latin America Smart Glass and Smart Window Market for Aircraft, 2021-2031 (US$ Mn, AGR%, (W-shaped Recovery)
Figure 230: Latin America Smart Glass and Smart Window Market for Consumer Electronics, 2021-2031 (US$ Mn, AGR%, (W-shaped Recovery)
Figure 231: Latin America Smart Glass and Smart Window Market for Others, 2021-2031 (US$ Mn, AGR%, (W-shaped Recovery)
Figure 232: Brazil Smart Glass and Smart Window Market Forecast 2021-2031 (US$ million, AGR %)
Figure 233: “V”-Shaped Recovery: Brazil Smart Glass and Smart Window Market, Revenue Forecast 2021-2031 (US$ million, AGR%)
Figure 234: “U”-Shaped Recovery: Brazil Smart Glass and Smart Window Market, Revenue Forecast 2021-2031 (US$ million, AGR%)
Figure 235: “L”-Shaped Recovery: Brazil Smart Glass and Smart Window Market, Revenue Forecast 2021-2031 (US$ million, AGR%)
Figure 236: “W”-Shaped Recovery: Brazil Smart Glass and Smart Window Market, Revenue Forecast 2021-2031 (US$ million, AGR%)
Figure 237: Mexico Smart Glass and Smart Window Market Forecast 2021-2031 (US$ million, AGR %)
Figure 238: “V”-Shaped Recovery: Mexico Smart Glass and Smart Window Market, Revenue Forecast 2021-2031 (US$ million, AGR%)
Figure 239: “U”-Shaped Recovery: Mexico Smart Glass and Smart Window Market, Revenue Forecast 2021-2031 (US$ million, AGR%)
Figure 240: “L”-Shaped Recovery: Mexico Smart Glass and Smart Window Market, Revenue Forecast 2021-2031 (US$ million, AGR%)
Figure 241: “W”-Shaped Recovery: Mexico Smart Glass and Smart Window Market, Revenue Forecast 2021-2031 (US$ million, AGR%)
Figure 242: Rest of Latin America Smart Glass and Smart Window Market Forecast 2021-2031 (US$ million, AGR %)
Figure 243: “V”-Shaped Recovery: Rest of Latin America Smart Glass and Smart Window Market, Revenue Forecast 2021-2031 (US$ million, AGR%)
Figure 244: “U”-Shaped Recovery: Rest of Latin America Smart Glass and Smart Window Market, Revenue Forecast 2021-2031 (US$ million, AGR%)
Figure 245: “L”-Shaped Recovery: Rest of Latin America Smart Glass and Smart Window Market, Revenue Forecast 2021-2031 (US$ million, AGR%)
Figure 246: “W”-Shaped Recovery: Rest of Latin America Smart Glass and Smart Window Market, Revenue Forecast 2021-2031 (US$ million, AGR%)
Figure 247: MEA Smart Glass and Smart Window Market for Active Glass, 2021-2031 (US$ Mn, AGR%, (V-shaped Recovery)
Figure 248: MEA Smart Glass and Smart Window Market for Passive Glass, 2021-2031 (US$ Mn, AGR%, (V-shaped Recovery)
Figure 249: MEA Smart Glass and Smart Window Market for Active Glass, 2021-2031 (US$ Mn, AGR%, (U-shaped Recovery)
Figure 250: MEA Smart Glass and Smart Window Market for Passive Glass, 2021-2031 (US$ Mn, AGR%, (U-shaped Recovery)
Figure 251: MEA Smart Glass and Smart Window Market for Active Glass, 2021-2031 (US$ Mn, AGR%, (L-shaped Recovery)
Figure 252: MEA Smart Glass and Smart Window Market for Passive Glass, 2021-2031 (US$ Mn, AGR%, (L-shaped Recovery)
Figure 253: MEA Smart Glass and Smart Window Market for Active Glass, 2021-2031 (US$ Mn, AGR%, (W-shaped Recovery)
Figure 254: MEA Smart Glass and Smart Window Market for Passive Glass, 2021-2031 (US$ Mn, AGR%, (W-shaped Recovery)
Figure 255: MEA Smart Glass and Smart Window Market for Architectural, 2021-2031 (US$ Mn, AGR%, (V-shaped Recovery)
Figure 256: MEA Smart Glass and Smart Window Market for Automotive, 2021-2031 (US$ Mn, AGR%, (V-shaped Recovery)
Figure 257: MEA Smart Glass and Smart Window Market for Aircraft, 2021-2031 (US$ Mn, AGR%, (V-shaped Recovery)
Figure 258: MEA Smart Glass and Smart Window Market for Consumer Electronics, 2021-2031 (US$ Mn, AGR%, (V-shaped Recovery)
Figure 259: MEA Smart Glass and Smart Window Market for Others, 2021-2031 (US$ Mn, AGR%, (V-shaped Recovery)
Figure 260: MEA Smart Glass and Smart Window Market for Architectural, 2021-2031 (US$ Mn, AGR%, (U-shaped Recovery)
Figure 261: MEA Smart Glass and Smart Window Market for Automotive, 2021-2031 (US$ Mn, AGR%, (U-shaped Recovery)
Figure 262: MEA Smart Glass and Smart Window Market for Aircraft, 2021-2031 (US$ Mn, AGR%, (U-shaped Recovery)
Figure 263: MEA Smart Glass and Smart Window Market for Consumer Electronics, 2021-2031 (US$ Mn, AGR%, (U-shaped Recovery)
Figure 264: MEA Smart Glass and Smart Window Market for Others, 2021-2031 (US$ Mn, AGR%, (U-shaped Recovery)
Figure 265: MEA Smart Glass and Smart Window Market for Architectural, 2021-2031 (US$ Mn, AGR%, (L-shaped Recovery)
Figure 266: MEA Smart Glass and Smart Window Market for Automotive, 2021-2031 (US$ Mn, AGR%, (L-shaped Recovery)
Figure 267: MEA Smart Glass and Smart Window Market for Aircraft, 2021-2031 (US$ Mn, AGR%, (L-shaped Recovery)
Figure 268: MEA Smart Glass and Smart Window Market for Consumer Electronics, 2021-2031 (US$ Mn, AGR%, (L-shaped Recovery)
Figure 269: MEA Smart Glass and Smart Window Market for Others, 2021-2031 (US$ Mn, AGR%, (L-shaped Recovery)
Figure 270: MEA Smart Glass and Smart Window Market for Architectural, 2021-2031 (US$ Mn, AGR%, (W-shaped Recovery)
Figure 271: MEA Smart Glass and Smart Window Market for Automotive, 2021-2031 (US$ Mn, AGR%, (W-shaped Recovery)
Figure 272: MEA Smart Glass and Smart Window Market for Aircraft, 2021-2031 (US$ Mn, AGR%, (W-shaped Recovery)
Figure 273: MEA Smart Glass and Smart Window Market for Consumer Electronics, 2021-2031 (US$ Mn, AGR%, (W-shaped Recovery)
Figure 274: MEA Smart Glass and Smart Window Market for Others, 2021-2031 (US$ Mn, AGR%, (W-shaped Recovery)
Figure 275: GCC Countries Smart Glass and Smart Window Market Forecast 2021-2031 (US$ million, AGR %)
Figure 276: “V”-Shaped Recovery: GCC Countries Smart Glass and Smart Window Market, Revenue Forecast 2021-2031 (US$ million, AGR%)
Figure 277: “U”-Shaped Recovery: GCC Countries Smart Glass and Smart Window Market, Revenue Forecast 2021-2031 (US$ million, AGR%)
Figure 278: “L”-Shaped Recovery: GCC Countries Smart Glass and Smart Window Market, Revenue Forecast 2021-2031 (US$ million, AGR%)
Figure 279: “W”-Shaped Recovery: GCC Countries Smart Glass and Smart Window Market, Revenue Forecast 2021-2031 (US$ million, AGR%)
Figure 280: South Africa Smart Glass and Smart Window Market Forecast 2021-2031 (US$ million, AGR %)
Figure 281: “V”-Shaped Recovery: South Africa Smart Glass and Smart Window Market, Revenue Forecast 2021-2031 (US$ million, AGR%)
Figure 282: “U”-Shaped Recovery: South Africa Smart Glass and Smart Window Market, Revenue Forecast 2021-2031 (US$ million, AGR%)
Figure 283: “L”-Shaped Recovery: South Africa Smart Glass and Smart Window Market, Revenue Forecast 2021-2031 (US$ million, AGR%)
Figure 284: “W”-Shaped Recovery: South Africa Smart Glass and Smart Window Market, Revenue Forecast 2021-2031 (US$ million, AGR%)
Figure 285: Rest of MEA Smart Glass and Smart Window Market Forecast 2021-2031 (US$ million, AGR %)
Figure 286: “V”-Shaped Recovery: Rest of MEA Smart Glass and Smart Window Market, Revenue Forecast 2021-2031 (US$ million, AGR%)
Figure 287: “U”-Shaped Recovery: Rest of MEA Smart Glass and Smart Window Market, Revenue Forecast 2021-2031 (US$ million, AGR%)
Figure 288: “L”-Shaped Recovery: Rest of MEA Smart Glass and Smart Window Market, Revenue Forecast 2021-2031 (US$ million, AGR%)
Figure 289: “W”-Shaped Recovery: Rest of MEA Smart Glass and Smart Window Market, Revenue Forecast 2021-2031 (US$ million, AGR%)
Figure 290: Saint Gobain S.A. Company Total Company Sales 2018-2019 (US$ Mn)
Figure 291: Gentex Corporation Total Company Sales 2017-2019 (US$ Mn)
Figure 292: AGC Inc Company Total Company Sales 2017-2019 (US$ Mn)
Figure 293: AGC Inc Company Total Company Sales 2017-2019, By Region (US$ Mn)
Figure 294: Gerresheimer AG Total Company Sales 2015-2019 (US$ Mn)
Figure 295: Gerresheimer AG Employees 2016-2019 (US$ Mn)
Figure 296: IBM Company Total Company Sales 2015-2019, By Region (US$ Mn)
AGC Inc
Asahi Glass Co. LTD.
ChromoGenics
Corning Incorporated
e-Chromic Technologies
Gentex Corporation
Gerresheimer AG
Pleotint LLC (Suntuitive Glass)
Polytronix
Raven Brick LLC
Saint Gobain S.A.
Smart Glass International Ltd.
Unite Glass
View Inc.
Vision Systems
List of Companies Mentioned in the Report
Acconeer
Active Glass Technologies
Aero Glass
AGP America
Ambio Film
Applied Materials, Inc.
Audio Analytic
Avalon Glass
BlueCat Networks
Bodle Technologies
Brite Solar
Central Glass
Chiefway Optronics Co. Ltd.
ChromoGenics
Chromogenics AB
Citala Corp.
Dream Glass Group
EB Glass
ebankIT
Eight19 Limited
ÉireComposites
FlatFrog Laboratories
Flexenable
Formator Ltd.
Fuyao Glass
Gauzy LTD
GlasNovations Ltd.
Glass Apps, LLC
Glass Inox
Grabit
iGlass Pty Ltd
InnoGlass Technology (Qingdao) Co.,Ltd
Innovative Glass Corp.
Irlbacher blickpunkt glas gmbh
ISORG
iTiZZiMO GmbH
Kinestral Technologies
N3N
NSG Group
NuEyes Technologies
Optinvent
Optotune GmbH
P2i
PGW Auto Glass
Physee
Plastic Logic
PrivacyVue
Pubinno
Ravenwindow
Reflex Glass
Research Frontiers
Saint Gobain
Schott AG
Scienstry
Scienstry, Inc.
Semprius, Inc
SmartBin
Smartint, Inc.
Soma
SPD Control Systems
Steklo tekhnologii, ooo
Taiwanglass Group
The LTI Group
Ubiquitous Energy Inc
Uniteglass
Vanlong Technology Co.,Limited
WaveOptics
Xinology Co., Ltd.
Xinyi Glass
Yantai Rushui Optoelectronics Technology Co., Ltd
Zhiyuan Building Materials Co., Ltd
List of Organizations Mentioned in the Report
Association of American Railroad (AAR)
Auto Glass Association (AGA)
Auto Glass Safety Council
Automotive Component Manufacturers Association (ACMA)
Department of Public Safety
Division of Motor Vehicles (DMV)
Driver and Vehicle Standards Agency (DVSA)
FLHSMV
Glass Association of North America
Gulf Cooperation Council
Independent Glass Association
Industrial Development Corporation (IDC)
International Automotive Glass Federation
ISO
Massachusetts Institute of Technology (MIT)
Motor Vehicle Commission (MVC)
National Glass Association (NGA)
National Renewable Energy Lab (NREL)
Puerto Rico Department of Transportation (DOT)
Safety Glazing Certification Council (SGCC)
Wyoming Department of Transportation (WYDOT)
Download sample pages
Complete the form below to download your free sample pages for Smart Glass and Smart Windows Market Report 2021-2031Related reports
-

Smart Airport Technologies Market Report 2020-2030
The recent contracts in Smart airport technologies market, has led Visiongain to publish this timely report. The $3,569.6 million Smart...
Full DetailsPublished: 14 May 2020 -

Smart Ports Market Report 2020-2030
Increasing expenditure in IoT and process automation systems across shipping industry is expected to drive significant revenue growth in the...
Full DetailsPublished: 06 April 2020 -
Connected Street Lights Market Report 2020-2030
- Drivers impacting the growth of the industry
- Increasing Demand for Energy-efficient Systems
- Growing Popularity of Smart City...Full DetailsPublished: 01 January 1970 -

Automotive Smart Parking Systems Market Report 2018-2028
Visiongain values the global smart parking systems market as worth $3.26bn in 2018.
...Full DetailsPublished: 03 July 2018 -

Automotive Smart Glass Market Report 2019-2029
Visiongain’s comprehensive new 207 page report reveals that the automotive smart glass market will achieve revenues of $798.9m in 2019....Full DetailsPublished: 20 May 2019
Download sample pages
Complete the form below to download your free sample pages for Smart Glass and Smart Windows Market Report 2021-2031Do you have any custom requirements we can help you with?
Any specific country, geo region, market segment or specific company information?
Email us today, we can discuss your needs and see how we can help: jamie.roberts@visiongain.com
Would you like a free report overview of the report of your choice?
If so, please drop an email to Jamie Roberts stating your chosen report title to jamie.roberts@visiongain.com
Visiongain construction reports are compiled using a broad and rich mixture of both primary and secondary information to produce an overall industry outlook. In order to provide our clients with the best product possible product, we do not rely on any one single source of information. Visiongain analysts reach out to market-leading vendors and automotive industry experts but also review a wealth of financial data and product information from a vast range of sources. To find out more about our reports methodology please email jamie.roberts@visiongain.com
Would you like to get the latest Visiongain construction reports catalogue?
What are the dynamic growth sectors? where are the regional business opportunities?
Which technologies will prevail and who are the leading companies succeeding in these sectors and why?
If you want definitive answers to business critical questions, discover Visiongain’s full range of business intelligence reports.
If so, please email Jamie Roberts on jamie.roberts@visiongain.com or call her today on +44 207 336 6100
Latest Construction news
Rolled Copper Products Market
The global Rolled Copper Products market was valued at US$24.87 billion in 2023 and is projected to grow at a CAGR of 5.7% during the forecast period 2024-2034.
15 May 2024
Green Cement Market
The global Green Cement market was valued at US$18.3 billion in 2024 and is expected to reach US$38.4 billion by 2034 at a CAGR of 7.7% during the forecast period 2024-2034.
01 May 2024
Visiongain Publishes Carbon Fibre Reinforced Plastic (CFRP) Composites Market Report 2024-2034
The global Carbon Fibre Reinforced Plastic (CFRP) Composites market was valued at US$23.88 billion in 2024 and is projected to grow at a CAGR of 9.9% during the forecast period 2024-2034.
27 November 2023
Visiongain Publishes Magnesium Alloys Market Report 2023-2033
The global Magnesium Alloys market was valued at US$1,550.6 million in 2022 and is projected to grow at a CAGR of 7.3% during the forecast period 2023-2033
25 May 2023


