The Radome Market Report 2022-2032: This report will prove invaluable to leading firms striving for new revenue pockets if they wish to better understand the industry and its underlying dynamics. It will be useful for companies that would like to expand into different industries or to expand their existing operations in a new region.
Increasing Radome Demand for Unmanned aerial vehicles (UAVs)
Unmanned aerial vehicles (UAVs), sometimes known as drones, have long been a common sight in military applications, particularly surveillance, and the spectrum of defence uses continues to expand as technology advances. Drone development is continuing to accelerate, owing to geopolitical considerations such as China’s ascent. In its ongoing quest to impose itself as a regional hegemon, the development of drone technology is critical. The government category, which includes military and law enforcement organizations, was the primary demand driver for drones in 2020, accounting for more than 70% of the worldwide market.
The increased demand for military drones has been a key growth driver for the worldwide radome business. Military drones are equipped with a variety of equipment, including a navigation system, airframe, contact connection, autopilot, engine, and sensor package. In addition, as military and national security threats develop, the complexity and capabilities of military airborne intelligence, surveillance, and reconnaissance (ISR) technology must grow to meet the demands. The number of channels and data types used in intelligence, surveillance, and reconnaissance (ISR) is increasing, necessitating more data processing, storage, security, and delivery. These factors are expected to open new avenues for radome market concentration over the forecast period.
What Questions Should You Ask before Buying a Market Research Report?
• How is the radome market evolving?
• What is driving and restraining the radome market?
• How will each radome submarket segment grow over the forecast period and how much revenue will these submarkets account for in 2032?
• How will the market shares for each radome submarket develops from 2022 to 2032?
• What will be the main driver for the overall market from 2022 to 2032?
• Will leading radome markets broadly follow the macroeconomic dynamics, or will individual national markets outperform others?
• How will the market shares of the national markets change by 2032 and which geographical region will lead the market in 2032?
• Who are the leading players and what are their prospects over the forecast period?
• What are the radome projects for these leading companies?
• How will the industry evolve during the period between 2020 and 2032? What are the implications of radome projects taking place now and over the next 10 years?
• Is there a greater need for product commercialisation to further scale the radome market?
• Where is the radome market heading and how can you ensure you are at the forefront of the market?
You need to discover how this will impact the radome market today, and over the next 10 years:
• Our 247-page report provides 102 tables and 137 charts/graphs exclusively to you.
• The report highlights key lucrative areas in the industry so you can target them – NOW.
• It contains in-depth analysis of global, regional and national sales and growth.
• It highlights for you the key successful trends, changes and revenue projections made by your competitors.
This report tells you TODAY how the radome market will develop in the next 10 years, and in line with the variations in COVID-19 economic recession and bounce. This market is more critical now than at any point over the last 10 years.
The report delivers exclusive COVID-19 variations and economic data specific to your market.
To access the data contained in this document please email contactus@visiongain.com
Forecasts to 2032 and other analyses reveal commercial prospects
• In addition to revenue forecasting to 2032, our new study provides you with recent results, growth rates, and market shares.
• You will find original analyses, with business outlooks and developments.
• Discover qualitative analyses (including market dynamics, drivers, opportunities, restraints and challenges), supply chain analysis, and recent developments.
This report includes data analysis and invaluable insight into how COVID-19 will affect the industry and your company. Four COVID-19 recovery patterns and their impact, namely, “V”, “L”, “W” and “U” are discussed in this report.
Segments Covered in the Report
Material Outlook
• Glass-Fibre
• PVC
• PE
• PTFE
• Quartz
• Others
• Downstream Process
Application
• Ground
– Radio Antennas
– Airborne Traffic Control (ATC)
– Others
• Airborne
– Military Aircraft
– Commercial & Business Aircraft
• Shipboard
– Military Shipboard
– Commercial Shipboard

In addition to the revenue predictions for the overall world market and segments, you will also find revenue forecasts for five regional and 18 leading national markets:
North America
• U.S.
• Canada
Europe
• Germany
• Spain
• United Kingdom
• Russia
• France
• Italy
• Rest of Europe
Asia Pacific
• China
• Japan
• India
• Australia
• South Korea
• Rest of Asia Pacific
Latin America
• Brazil
• Mexico
• Argentina
• Rest of Latin America
Middle East & Africa
• GCC
• South Africa
Need industry data? Please contact us today.
The report also includes profiles and for some of the leading companies in the Radome Market, 2022 to 2032, with a focus on this segment of these companies’ operations.
Leading companies and the potential for market growth
• Astronics Corporation
• BAE Systems
• Boeing
• Comtech Telecommunications
• CPI International
• Flir Systems
• General Dynamics Corporation
• Kitsap Composites
• Lockheed Martin
• Lufthansa Technik
• Meggitt PLC
• NORDAM Group, Inc.
• Northrop Grumman Corp.
• Saint-Gobain Performance Plastics
• Starwin Industries
Overall world revenue for Radome Market, 2022 to 2032 in terms of value the market will surpass US$1.70 billion in 2022, our work calculates. We predict strong revenue growth through to 2032. Our work identifies which organisations hold the greatest potential. Discover their capabilities, progress, and commercial prospects, helping you stay ahead.
How will the Radome Market, 2022 to 2032 Market report help you?
In summary, our 240+ page report provides you with the following knowledge:
• Revenue forecasts to 2032 for Radome Market, 2022 to 2032 Market, with forecasts for material, application, and each forecast at a global and regional level – discover the industry’s prospects, finding the most lucrative places for investments and revenues.
• Revenue forecasts to 2032 for five regional and 18 key national markets – See forecasts for the Radome Market, 2022 to 2032 market in North America, Europe, Asia-Pacific, Latin America, and Middle East & Africa. Also market size estimation and forecast is provided for US, Canada, Mexico, Brazil, Germany, France, UK, Italy, Spain, Russia, China, India, Japan, and Australia among other prominent economies.
• Prospects for established firms and those seeking to enter the market – including company profiles for 15 of the major companies involved in the Radome Market, 2022 to 2032.
Find quantitative and qualitative analyses with independent predictions. Receive information that only our report contains, staying informed with invaluable business intelligence.
Information found nowhere else
With our new report, you are less likely to fall behind in knowledge or miss out on opportunities. See how our work could benefit your research, analyses, and decisions. Visiongain’s study is for everybody needing commercial analyses for the Radome Market, 2022 to 2032, market-leading companies. You will find data, trends and predictions.
To access the data contained in this document please email contactus@visiongain.com
Buy our report today Radome Market Report 2022-2032: Forecasts by Material (Glass-Fiber, Polyvinyl Chloride, Polyethylene, Polytetrafluoroethylene, Quartz, Others), by Application (Ground (Radio Antennas, Airborne Traffic Control, Others), Airborne (Military Aircraft, Commercial & Business Aircraft), Shipboard (Military Shipboard, Commercial Shipboard)) AND Regional and Leading National Market Analysis PLUS Analysis of Leading Companies AND COVID-19 Impact Analysis and Recovery Pattern Analysis. Avoid missing out by staying informed – order our report now.
Visiongain is a trading partner with the US Federal Government
CCR Ref number: KD4R6
Do you have any custom requirements we can help you with? Any need for a specific country, geo region, market segment or specific company information? Contact us today, we can discuss your needs and see how we can help: contactus@visiongain.com
1. Report Overview
1.1 Objectives of the Study
1.2 Introduction to Radome Market
1.3 What this Report Delivers?
1.4 Why You Should Read this Report?
1.5 Key Questions Answered by this Analytical Report
1.6 Who is This Report For?
1.7 Methodology
1.7.1 Market Definitions
1.7.2 Market Evaluation & Forecasting Methodology
1.7.3 Data Validation
1.8 Frequently Asked Questions (FAQs)
1.9 Associated Visiongain Reports
1.10 About Visiongain
2 Executive Summary
3 Premium Insights
3.1 Geographical Snapshot: Global Radome Market
3.2 Material Segment: Market Attractiveness Index
3.3 Application Segment: Market Attractiveness Index
4 Market Overview
4.1 Market Dynamics
4.1.1 Market Driving Factors
4.1.2 Market Restraining Factors
4.1.3 Market Opportunities
4.2 COVID-19 Impact Analysis
4.3 Porter’s Five Forces Analysis
4.3.1 Supplier Power
4.3.2 Buyer Power
4.3.3 Competitive Rivalry
4.3.4 Threat from Substitutes
4.3.5 Threat of New Entrants
4.4 PEST Analysis
4.5 Supply Chain Analysis
4.5.1 Radome Material
4.5.2 Material Suppliers
4.5.3 Manufacturers and End Users
5 Global Radome Market Analysis by Material
5.1 Key Findings
5.2 Material Segment Growth Prospects
5.3 Global Radome Market Share by Material, 2022 & 2032
5.4 Glass-Fiber
5.4.1 Advantages of Fiberglass Radome
5.4.2 Glass-Fiber Market Forecast by Region, 2022-2032 (USD Million)
5.5 Polyvinyl Chloride (PVC)
5.5.1 PVC Market Forecast by Region, 2022-2032 (USD Million)
5.6 Polyurethanes (PE)
5.6.1 Polyurethane Foams in Radomes
5.6.2 PE Market Forecast by Region, 2022-2032 (USD Million)
5.7 Polytetrafluoroethylene (PTFE)
5.7.1 Teflon: Effective Materials Available for Radome Construction
5.7.2 PTFE Market Forecast by Region, 2022-2032 (USD Million)
5.8 Quartz
5.8.1 Quartz Fiber in Aerospace Radomes
5.8.2 Quartz Market Forecast by Region, 2022-2032 (USD Million)
5.9 Other Materials
5.9.1 Other Materials Market Forecast by Region, 2022-2032 (USD Million)
6 Global Radome Market Analysis by Application
6.1 Key Findings
6.2 Application Segment Growth Prospects
6.3 Global Radome Market Share by Application, 2022 & 2032
6.4 Ground Application
6.4.1 Sheergard (Saint-Gobain) Sandwich Radomes
6.4.2 Radome Market for Ground Application by Region, 2022-2032 (USD Million)
6.4.3 Radome Market for Ground Application by Type, 2022-2032 (USD Million)
6.5 Airborne Application
6.5.1 Radome Market for Airborne Application by Region, 2022-2032 (USD Million)
6.5.2 Radome Market for Airborne Application by Type, 2022-2032 (USD Million)
6.6 Shipboard Application
6.6.1 Radome Market for Shipboard Application by Region, 2022-2032 (USD Million)
6.6.2 Radome Market for Shipboard Application by Type, 2022-2032 (USD Million)
7 Global Radome Market Analysis by Region
7.1 Key Findings
7.2 Regional Market Size Estimation and Forecast
7.3 COVID-19 Impact Analysis: Recovery Scenarios (V, U, W, L)
8 North America Radome Market Analysis
8.1 Key Findings
8.2 North America Radome Market Attractiveness Index
8.3 North America Radome Market by Country, 2022, 2027 & 2032 (USD Million)
8.4 North America Radome Market Size Estimation and Forecast by Country
8.5 North America Radome Market Size Estimation and Forecast by Material
8.6 North America Radome Market Size Estimation and Forecast by Application
8.7 U.S. Radome Market
8.8 Canada Radome Market
9 Europe Radome Market Analysis
9.1 Key Findings
9.2 Europe Radome Market Attractiveness Index
9.3 Europe Radome Market by Country, 2022, 2027 & 2032 (USD Million)
9.4 Europe Radome Market Size Estimation and Forecast by Country
9.5 Europe Radome Market Size Estimation and Forecast by Material
9.6 Europe Radome Market Size Estimation and Forecast by Application
9.7 Germany Radome Market
9.7.1 Vincorion Supplies Radomes for the “Quadriga” Eurofighter
9.8 UK Radome Market
9.9 France Radome Market
9.9.1 France selected Indra’s radar system for three air bases
9.10 Italy Radome Market
9.11 Spain Radome Market
9.12 Russia Radome Market
9.13 Rest of Europe Radome Market
10 Asia Pacific Radome Market Analysis
10.1 Key Findings
10.2 Asia Pacific Radome Market Attractiveness Index
10.3 Asia Pacific Radome Market by Country, 2022, 2027 & 2032 (USD Million)
10.4 Asia Pacific Radome Market Size Estimation and Forecast by Country
10.5 Asia Pacific Radome Market Size Estimation and Forecast by Material
10.6 Asia Pacific Radome Market Size Estimation and Forecast by Application
10.7 China Radome Market
10.7.1 The Chinese Army is installing and upgrading its radars along the India-China border
10.7.2 Saint-Gobain completed first radome project in China
10.8 Japan Radome Market
10.8.1 Synspective Inc. and Seiren Co., Ltd signed a memorandum of understanding
10.9 India Radome Market
10.9.1 Testing of a new radome for the LCA-Tejas fleet
10.10 Australia Radome Market
10.11 South Korea Radome Market
10.12 Southeast Asia Radome Market
10.12.1 Leonardo provided radar system to Indonesian Air Force
10.12.2 Radomes in Malaysia
10.13 Rest of Asia Pacific Radome Market
10.13.1 Taiwan's Upgraded Radar to Monitor Chinese Aircraft
10.13.2 Pakistan is Strengthening its Radar System
11 Latin America Radome Market Analysis
11.1 Key Findings
11.2 Latin America Radome Market Attractiveness Index
11.3 Latin America Radome Market by Country, 2022, 2027 & 2032 (USD Million)
11.4 Latin America Radome Market Size Estimation and Forecast by Country
11.5 Latin America Radome Market Size Estimation and Forecast by Material
11.6 Latin America Radome Market Size Estimation and Forecast by Application
11.7 Brazil Radome Market
11.8 Argentina Radome Market
11.9 Mexico Radome Market
11.10 Rest of Latin America Radome Market
11.10.1 Thales to Deploy Solar-Powered Air Traffic Control Radar Station in Chile
11.10.2 Columbia Aerospace Industry
12 Middle East & Africa Radome Market Analysis
12.1 Key Findings
12.2 Middle East & Africa Radome Market Attractiveness Index
12.3 Middle East & Africa Radome Market by Country, 2022, 2027 & 2032 (USD Million)
12.4 Middle East & Africa Radome Market Size Estimation and Forecast by Country
12.5 Middle East & Africa Radome Market Size Estimation and Forecast by Material
12.6 Middle East & Africa Radome Market Size Estimation and Forecast by Application
12.7 GCC Radome Market
12.7.1 Indra deployed ATC centres in Saudi Arabia
12.8 South Africa Radome Market
12.8.1 Hensoldt SA launched new naval surveillance radar
12.9 Rest of Middle East & Africa Radome Market
13 Competitive Landscape
13.1 Company Share Analysis
13.2 Key Business Strategy Analysis
14 Company Profiles
14.1 BAE Systems
14.1.1 Company Snapshot
14.1.2 Company Overview
14.1.3 Company’s Capabilities
14.1.4 Financial Analysis
14.1.5 Product Benchmarking
14.1.6 Strategic Outlook
14.2 General Dynamics Corporation
14.2.1 Company Snapshot
14.2.2 Company Overview
14.2.3 Military Aircraft Radomes
14.2.4 Key Capabilities
14.2.5 Radome Qualification Experience:
14.2.6 Financial Analysis
14.2.7 Product Benchmarking
14.2.8 Strategic Outlook
14.3 Lockheed Martin
14.3.1 Company Snapshot
14.3.2 Company Overview
14.3.3 Aeronautics
14.3.4 Missiles and Fire Control
14.3.5 Rotary and Mission Systems
14.3.6 Space Systems
14.3.7 Financial Analysis
14.3.8 Product Benchmarking
14.3.9 Strategic Outlook
14.4 Kitsap Composites
14.4.1 Company Snapshot
14.4.2 Company Overview
14.4.3 Product Benchmarking
14.5 Meggitt PLC
14.5.1 Company Snapshot
14.5.2 Company Overview
14.5.3 Civil & Military Radomes
14.5.4 Radome Customers
14.5.5 Financial Analysis
14.5.6 Product Benchmarking
14.5.7 Strategic Outlook
14.6 NORDAM Group, Inc.
14.6.1 Company Snapshot
14.6.2 Company Overview
14.6.3 Product Benchmarking
14.6.4 Strategic Outlook
14.7 Northrop Grumman Corp.
14.7.1 Company Snapshot
14.7.2 Company Overview
14.7.3 Air EO/IR
14.7.4 Land EO/IR
14.7.5 Maritime EO/IR
14.7.6 Financial Analysis
14.7.7 Product Benchmarking
14.7.8 Strategic Outlook
14.8 Saint-Gobain Performance Plastics
14.8.1 Company Snapshot
14.8.2 Company Overview
14.8.3 Product Benchmarking
14.8.4 Strategic Outlook
14.9 Starwin Industries
14.9.1 Company Snapshot
14.9.2 Company Overview
14.9.3 Radomes
14.9.4 Radomes for Military Aircraft & Naval Systems
14.9.5 Product Benchmarking
14.9.6 Strategic Outlook
14.10 CPI International Inc.
14.10.1 Company Snapshot
14.10.2 Company Overview
14.10.3 Business Units
14.10.4 Product Benchmarking
14.10.5 Strategic Outlook
14.11 Astronics Corporation
14.11.1 Company Snapshot
14.11.2 Company Overview
14.11.3 Company’s Product Portfolio and Solutions
14.11.4 Subsidiaries
14.11.5 Financial Analysis
14.11.6 Product Benchmarking
14.11.7 Strategic Outlook
14.12 Comtech Telecommunications
14.12.1 Company Snapshot
14.12.2 Company Overview
14.12.3 Financial Analysis
14.12.4 Product Benchmarking
14.12.5 Strategic Outlook
14.13 Lufthansa Technik
14.13.1 Company Snapshot
14.13.2 Company Overview
14.13.3 Building professional OEM structures
14.13.4 Financial Analysis
14.13.5 Product Benchmarking
14.13.6 Strategic Outlook
14.14 Flir Systems
14.14.1 Company Snapshot
14.14.2 Company Overview
14.14.3 Product Benchmarking
14.14.4 Strategic Outlook
14.15 Boeing
14.15.1 Company Snapshot
14.15.2 Company Overview
14.15.3 Commercial Airplanes Segment
14.15.4 Defence, Space & Security Segment
14.15.5 Global Services Segment
14.15.6 Boeing Capital Segment
14.15.7 Boeing INEXA Solutions
14.15.8 Financial Analysis
14.15.9 Product Benchmarking
14.15.10 Strategic Outlook
15 Conclusion and Recommendations
15.1 Concluding Remarks from Visiongain
15.2 Recommendations for Market Players
15.2.1 Expansion in developing economies
15.2.2 Necessity of technology upgradation in radome structure
15.2.3 Environmental and signal challenges
Glossary
List of Tables
Table 1 Global Radome Market Snapshot, 2022 & 2032 (USD Million, CAGR %)
Table 2 Global Radome Market Size by Glass-Fiber Material, 2022-2032 (USD Million, AGR %, CAGR %)
Table 3 Global Radome Market Size by PVC Material, 2022-2032 (USD Million, AGR %, CAGR %)
Table 4 Global Radome Market Size by PE Material, 2022-2032 (USD Million, AGR %, CAGR %)
Table 5 Global Radome Market Size by PTFE Material, 2022-2032 (USD Million, AGR %, CAGR %)
Table 6 Global Radome Market Size by Quartz Material, 2022-2032 (USD Million, AGR %, CAGR %)
Table 7 Global Radome Market Size by Other Materials Material, 2022-2032 (USD Million, AGR %, CAGR %)
Table 8 Global Radome Market Size by Ground Application, 2022-2032 (USD Million, AGR %, CAGR %)
Table 9 Global Radome Market Size for Ground Application by Type, 2022-2032 (USD Million, AGR %, CAGR %)
Table 10 Global Radome Market Size by Airborne Application, 2022-2032 (USD Million, AGR %, CAGR %)
Table 11 Global Radome Market Size for Airborne Application by Type, 2022-2032 (USD Million, AGR %, CAGR %)
Table 12 Global Radome Market Size by Shipboard Application, 2022-2032 (USD Million, AGR %, CAGR %)
Table 13 Global Radome Market Size for Shipboard Application by Type, 2022-2032 (USD Million, AGR %, CAGR %)
Table 14 Global Radome Market Size for Region, 2022-2032 (USD Million, AGR %, CAGR %)
Table 15 Global Radome Market Size for Region, 2022-2032 (USD Million, AGR %, CAGR %): V-Shaped Recovery
Table 16 Global Radome Market Size for Region, 2022-2032 (USD Million, AGR %, CAGR %): U-Shaped Recovery
Table 17 Global Radome Market Size for Region, 2022-2032 (USD Million, AGR %, CAGR %): W-Shaped Recovery
Table 18 Global Radome Market Size for Region, 2022-2032 (USD Million, AGR %, CAGR %): L-Shaped Recovery
Table 19 North America Radome Market Forecast by Country, 2022-2032 (USD Million, AGR%, CAGR%)
Table 20 North America Radome Market Forecast by Material, 2022-2032 (USD Million, AGR%, CAGR%)
Table 21 North America Radome Market Forecast by Application, 2022-2032 (USD Million, AGR%, CAGR%)
Table 22 U.S. Radome Market Forecast, 2022-2032 (USD Million, AGR%, CAGR%)
Table 23 Canada Radome Market Forecast, 2022-2032 (USD Million, AGR%, CAGR%)
Table 24 Europe Radome Market Forecast by Country, 2022-2032 (USD Million, AGR%, CAGR%)
Table 25 Europe Radome Market Forecast by Material, 2022-2032 (USD Million, AGR%, CAGR%)
Table 26 Europe Radome Market Forecast by Application, 2022-2032 (USD Million, AGR%, CAGR%)
Table 27 Germany Radome Market Forecast, 2022-2032 (USD Million, AGR%, CAGR%)
Table 28 UK Radome Market Forecast, 2022-2032 (USD Million, AGR%, CAGR%)
Table 29 France Radome Market Forecast, 2022-2032 (USD Million, AGR%, CAGR%)
Table 30 Italy Radome Market Forecast, 2022-2032 (USD Million, AGR%, CAGR%)
Table 31 Spain Radome Market Forecast, 2022-2032 (USD Million, AGR%, CAGR%)
Table 32 Russia Radome Market Forecast, 2022-2032 (USD Million, AGR%, CAGR%)
Table 33 Rest of Europe Radome Market Forecast, 2022-2032 (USD Million, AGR%, CAGR%)
Table 34 Asia Pacific Radome Market Forecast by Country, 2022-2032 (USD Million, AGR%, CAGR%)
Table 35 Asia Pacific Radome Market Forecast by Material, 2022-2032 (USD Million, AGR%, CAGR%)
Table 36 Asia Pacific Radome Market Forecast by Application, 2022-2032 (USD Million, AGR%, CAGR%)
Table 37 China Radome Market Forecast, 2022-2032 (USD Million, AGR%, CAGR%)
Table 38 Japan Radome Market Forecast, 2022-2032 (USD Million, AGR%, CAGR%)
Table 39 India Radome Market Forecast, 2022-2032 (USD Million, AGR%, CAGR%)
Table 40 Australia Radome Market Forecast, 2022-2032 (USD Million, AGR%, CAGR%)
Table 41 South Korea Radome Market Forecast, 2022-2032 (USD Million, AGR%, CAGR%)
Table 42 Southeast Asia Radome Market Forecast, 2022-2032 (USD Million, AGR%, CAGR%)
Table 43 Rest of Asia Pacific Radome Market Forecast, 2022-2032 (USD Million, AGR%, CAGR%)
Table 44 Latin America Radome Market Forecast by Country, 2022-2032 (USD Million, AGR%, CAGR%)
Table 45 Latin America Radome Market Forecast by Material, 2022-2032 (USD Million, AGR%, CAGR%)
Table 46 Latin America Radome Market Forecast by Application, 2022-2032 (USD Million, AGR%, CAGR%)
Table 47 Brazil Radome Market Forecast, 2022-2032 (USD Million, AGR%, CAGR%)
Table 48 Argentina Radome Market Forecast, 2022-2032 (USD Million, AGR%, CAGR%)
Table 49 Mexico Radome Market Forecast, 2022-2032 (USD Million, AGR%, CAGR%)
Table 50 Rest of Latin America Radome Market Forecast, 2022-2032 (USD Million, AGR%, CAGR%)
Table 51 Middle East & Africa Radome Market Forecast by Country, 2022-2032 (USD Million, AGR%, CAGR%)
Table 52 Middle East & Africa Radome Market Forecast by Material, 2022-2032 (USD Million, AGR%, CAGR%)
Table 53 Middle East & Africa Radome Market Forecast by Application, 2022-2032 (USD Million, AGR%, CAGR%)
Table 54 GCC Radome Market Forecast, 2022-2032 (USD Million, AGR%, CAGR%)
Table 55 South Africa Radome Market Forecast, 2022-2032 (USD Million, AGR%, CAGR%)
Table 56 Rest of Middle East & Africa Radome Market Forecast, 2022-2032 (USD Million, AGR%, CAGR%)
Table 57 Company Ranking Analysis
Table 58 Key Business Strategies Adopted by Key Players in Global Radome Market
Table 59 BAE Systems: Key Details, (CEO, HQ, Revenue, Founded, No. of Employees, Company Type, Website, Business Segment)
Table 60 BAE Systems: Product Benchmarking
Table 61 BAE Systems: Strategic Outlook
Table 62 General Dynamics Corporation: Key Details, (CEO, HQ, Revenue, Founded, No. of Employees, Company Type, Website, Business Segment)
Table 63 General Dynamics Corporation: Product Benchmarking
Table 64 General Dynamics Corporation: Strategic Outlook
Table 65 Lockheed Martin: Key Details, (CEO, HQ, Revenue, Founded, No. of Employees, Company Type, Website, Business Segment)
Table 66 Lockheed Martin: Product Benchmarking
Table 67 Lockheed Martin: Strategic Outlook
Table 68 Kitsap Composites: Key Details, (CEO, HQ, Revenue, Founded, No. of Employees, Company Type, Website, Business Segment)
Table 69 Kitsap Composites: Product Benchmarking
Table 70 Meggitt PLC: Key Details, (CEO, HQ, Revenue, Founded, No. of Employees, Company Type, Website, Business Segment)
Table 71 Meggitt PLC: Product Benchmarking
Table 72 Meggitt PLC: Strategic Outlook
Table 73 NORDAM Group, Inc.: Key Details, (CEO, HQ, Revenue, Founded, No. of Employees, Company Type, Website, Business Segment)
Table 74 NORDAM Group, Inc.: Product Benchmarking
Table 75 NORDAM Group, Inc.: Strategic Outlook
Table 76 Northrop Grumman Corp.: Key Details, (CEO, HQ, Revenue, Founded, No. of Employees, Company Type, Website, Business Segment)
Table 77 Northrop Grumman Corp.: Product Benchmarking
Table 78 Northrop Grumman Corp.: Strategic Outlook
Table 79 Saint-Gobain Performance Plastics: Key Details, (CEO, HQ, Revenue, Founded, No. of Employees, Company Type, Website, Business Segment)
Table 80 Saint-Gobain Performance Plastics: Product Benchmarking
Table 81 Saint-Gobain Performance Plastics: Strategic Outlook
Table 82 Starwin Industries: Key Details, (CEO, HQ, Revenue, Founded, No. of Employees, Company Type, Website, Business Segment)
Table 83 Starwin Industries: Product Benchmarking
Table 84 Starwin Industries: Strategic Outlook
Table 85 CPI International Inc.: Key Details, (CEO, HQ, Revenue, Founded, No. of Employees, Company Type, Website, Business Segment)
Table 86 CPI International Inc.: Product Benchmarking
Table 87 CPI International Inc.: Strategic Outlook
Table 88 Astronics Corporation: Key Details, (CEO, HQ, Revenue, Founded, No. of Employees, Company Type, Website, Business Segment)
Table 89 Astronics Corporation: Product Benchmarking
Table 90 Astronics Corporation: Strategic Outlook
Table 91 Comtech Telecommunications: Key Details, (CEO, HQ, Revenue, Founded, No. of Employees, Company Type, Website, Business Segment)
Table 92 Comtech Telecommunications: Product Benchmarking
Table 93 Comtech Telecommunications: Strategic Outlook
Table 94 Lufthansa Technik: Key Details, (CEO, HQ, Revenue, Founded, No. of Employees, Company Type, Website, Business Segment)
Table 95 Lufthansa Technik: Product Benchmarking
Table 96 Lufthansa Technik: Strategic Outlook
Table 97 Flir Systems: Key Details, (CEO, HQ, Revenue, Founded, No. of Employees, Company Type, Website, Business Segment)
Table 98 Flir Systems: Product Benchmarking
Table 99 Flir Systems: Strategic Outlook
Table 100 Boeing: Key Details, (CEO, HQ, Revenue, Founded, No. of Employees, Company Type, Website, Business Segment)
Table 101 Boeing: Product Benchmarking
Table 102 Boeing: Strategic Outlook
List of Figures
Figure 1 Global Radome Market Segmentation
Figure 2 Global Radome Market Forecast by Region: Market Attractiveness Index
Figure 3 Global Radome Market by Material: Market Attractiveness Index
Figure 4 Global Radome Market by Application: Market Attractiveness Index
Figure 5 Global Radome Market: Market Dynamics
Figure 6 Global Radome Market: Market Dynamics
Figure 7 Global COVID Impact Analysis: Radome Market Recovery Scenarios
Figure 8 Global Radome Market: Porter’s Five Forces Analysis
Figure 9 Global Radome Market: PEST Analysis
Figure 10 Radome Industry: Supply Chain Analysis
Figure 11 Global Radome Market Forecast by Material
Figure 12 Global Radome Market Share Forecast by Material, 2022, 2032 (%)
Figure 13 Glass-Fiber Radome Market Forecast, 2022-2032 (US$ Million)
Figure 14 PVC Radome Market Forecast, 2022-2032 (US$ Million)
Figure 15 PE Radome Market Forecast, 2022-2032 (US$ Million)
Figure 16 PTFE Radome Market Forecast, 2022-2032 (US$ Million)
Figure 17 Quartz Radome Market Forecast, 2022-2032 (US$ Million)
Figure 18 Other Materials Radome Market Forecast, 2022-2032 (US$ Million)
Figure 19 Global Radome Market Forecast by Application
Figure 20 Global Radome Market Share Forecast by Application, 2022, 2032 (%)
Figure 21 Radome Market Forecast for Ground Application, 2022-2032 (US$ Million)
Figure 22 Global Radome Market Size for Ground Application by Type, 2022-2032 (US$ Million)
Figure 23 Radome Market Forecast for Airborne Application, 2022-2032 (US$ Million)
Figure 24 Global Radome Market Size for Airborne Application by Type, 2022-2032 (US$ Million)
Figure 25 Radome Market Forecast for Shipboard Application, 2022-2032 (US$ Million)
Figure 26 Global Radome Market Size for Shipboard Application by Type, 2022-2032 (US$ Million)
Figure 27 Global Radome Market Forecast by Region 2022, 2027, 2032 (Revenue, CAGR%)
Figure 28 Global Radome Market Share Forecast by Region 2022, 2027, 2032(%)
Figure 29 Global Radome Market by Region, 2022-2032 (USD Mn, AGR (%), CAGR (%))
Figure 30 Global Radome Market by Region, 2022-2032 (USD Mn, AGR (%), CAGR (%)): V-Shaped Recovery
Figure 31 Global Radome Market by Region, 2022-2032 (USD Mn, AGR (%), CAGR (%)): U-Shaped Recovery
Figure 32 Global Radome Market by Region, 2022-2032 (USD Mn, AGR (%), CAGR (%)): W-Shaped Recovery
Figure 33 Global Radome Market by Region, 2022-2032 (USD Mn, AGR (%), CAGR (%)): L-Shaped Recovery
Figure 34 North America Radome Market Attractiveness Index
Figure 35 North America Radome Market by Country, 2022, 2027 & 2032 (USD Million)
Figure 36 North America Radome Market Forecast by Country, 2022-2032 (USD Million, AGR %)
Figure 37 North America Radome Market Share Forecast by Country, 2022 & 2032 (%)
Figure 38 North America Radome Market Forecast by Material, 2022-2032 (USD Million, AGR %)
Figure 39 North America Radome Market Share Forecast by Material, 2022 & 2032 (%)
Figure 40 North America Radome Market Forecast by Application, 2022-2032 (USD Million, AGR %)
Figure 41 North America Radome Market Share Forecast by Application, 2022 & 2032 (%)
Figure 42 U.S. Radome Market Forecast, 2022-2032 (USD Million, AGR %)
Figure 43 Canada Radome Market Forecast, 2022-2032 (USD Million, AGR %)
Figure 44 Europe Radome Market Attractiveness Index
Figure 45 Europe Radome Market by Country, 2022, 2027 & 2032 (USD Million)
Figure 46 Europe Radome Market Forecast by Country, 2022-2032 (USD Million, AGR %)
Figure 47 Europe Radome Market Share Forecast by Country, 2022 & 2032 (%)
Figure 48 Europe Radome Market Forecast by Material, 2022-2032 (USD Million, AGR %)
Figure 49 Europe Radome Market Share Forecast by Material, 2022 & 2032 (%)
Figure 50 Europe Radome Market Forecast by Application, 2022-2032 (USD Million, AGR %)
Figure 51 Europe Radome Market Share Forecast by Application, 2022 & 2032 (%)
Figure 52 Germany Radome Market Forecast, 2022-2032 (USD Million, AGR %)
Figure 53 UK Radome Market Forecast, 2022-2032 (USD Million, AGR %)
Figure 54 France Radome Market Forecast, 2022-2032 (USD Million, AGR %)
Figure 55 Italy Radome Market Forecast, 2022-2032 (USD Million, AGR %)
Figure 56 Spain Radome Market Forecast, 2022-2032 (USD Million, AGR %)
Figure 57 Russia Radome Market Forecast, 2022-2032 (USD Million, AGR %)
Figure 58 Rest of Europe Radome Market Forecast, 2022-2032 (USD Million, AGR %)
Figure 59 Asia Pacific Radome Market Attractiveness Index
Figure 60 Asia Pacific Radome Market by Country, 2022, 2027 & 2032 (USD Million)
Figure 61 Asia Pacific Radome Market Forecast by Country, 2022-2032 (USD Million, AGR %)
Figure 62 Asia Pacific Radome Market Share Forecast by Country, 2022 & 2032 (%)
Figure 63 Asia Pacific Radome Market Forecast by Material, 2022-2032 (USD Million, AGR %)
Figure 64 Asia Pacific Radome Market Share Forecast by Material, 2022 & 2032 (%)
Figure 65 Asia Pacific Radome Market Forecast by Application, 2022-2032 (USD Million, AGR %)
Figure 66 Asia Pacific Radome Market Share Forecast by Application, 2022 & 2032 (%)
Figure 67 China Radome Market Forecast, 2022-2032 (USD Million, AGR %)
Figure 68 Japan Radome Market Forecast, 2022-2032 (USD Million, AGR %)
Figure 69 India Radome Market Forecast, 2022-2032 (USD Million, AGR %)
Figure 70 Australia Radome Market Forecast, 2022-2032 (USD Million, AGR %)
Figure 71 South Korea Radome Market Forecast, 2022-2032 (USD Million, AGR %)
Figure 72 Southeast Asia Radome Market Forecast, 2022-2032 (USD Million, AGR %)
Figure 73 Rest of Asia Pacific Radome Market Forecast, 2022-2032 (USD Million, AGR %)
Figure 74 Latin America Radome Market Attractiveness Index
Figure 75 Latin America Radome Market by Country, 2022, 2027 & 2032 (USD Million)
Figure 76 Latin America Radome Market Forecast by Country, 2022-2032 (USD Million, AGR %)
Figure 77 Latin America Radome Market Share Forecast by Country, 2022 & 2032 (%)
Figure 78 Latin America Radome Market Forecast by Material, 2022-2032 (USD Million, AGR %)
Figure 79 Latin America Radome Market Share Forecast by Material, 2022 & 2032 (%)
Figure 80 Latin America Radome Market Forecast by Application, 2022-2032 (USD Million, AGR %)
Figure 81 Latin America Radome Market Share Forecast by Application, 2022 & 2032 (%)
Figure 82 Brazil Radome Market Forecast, 2022-2032 (USD Million, AGR %)
Figure 83 Argentina Radome Market Forecast, 2022-2032 (USD Million, AGR %)
Figure 84 Mexico Radome Market Forecast, 2022-2032 (USD Million, AGR %)
Figure 85 Rest of Latin America Radome Market Forecast, 2022-2032 (USD Million, AGR %)
Figure 86 Middle East & Africa Radome Market Attractiveness Index
Figure 87 Middle East & Africa Radome Market by Country, 2022, 2027 & 2032 (USD Million)
Figure 88 Middle East & Africa Radome Market Forecast by Country, 2022-2032 (USD Million, AGR %)
Figure 89 Middle East & Africa Radome Market Share Forecast by Country, 2022 & 2032 (%)
Figure 90 Middle East & Africa Radome Market Forecast by Material, 2022-2032 (USD Million, AGR %)
Figure 91 Middle East & Africa Radome Market Share Forecast by Material, 2022 & 2032 (%)
Figure 92 Middle East & Africa Radome Market Forecast by Application, 2022-2032 (USD Million, AGR %)
Figure 93 Middle East & Africa Radome Market Share Forecast by Application, 2022 & 2032 (%)
Figure 94 GCC Radome Market Forecast, 2022-2032 (USD Million, AGR %)
Figure 95 South Africa Radome Market Forecast, 2022-2032 (USD Million, AGR %)
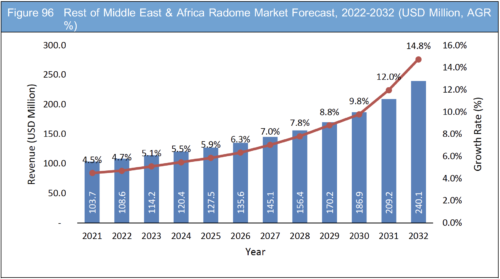
Figure 96 Rest of Middle East & Africa Radome Market Forecast, 2022-2032 (USD Million, AGR %)
Figure 97 BAE Systems: Net Revenue, 2017-2021 (US$ million, AGR%)
Figure 98 BAE Systems: Segment Market Shares, 2021
Figure 99 BAE Systems: Regional Market Shares, 2021
Figure 100 BAE Systems: Gross Profit, 2017-2021 (US$ million, AGR%)
Figure 101 BAE Systems: Operating Income, 2017-2021 (US$ million, AGR%)
Figure 102 General Dynamics Corporation: Net Revenue, 2017-2021 (US$ million, AGR%)
Figure 103 General Dynamics Corporation: Segment Market Shares, 2021
Figure 104 General Dynamics Corporation: Regional Market Shares, 2021
Figure 105 General Dynamics Corporation: Gross Profit, 2017-2021 (US$ million, AGR%)
Figure 106 General Dynamics Corporation: Operating Income, 2017-2021 (US$ million, AGR%)
Figure 107 Lockheed Martin: Net Revenue, 2017-2021 (US$ million, AGR%)
Figure 108 Lockheed Martin: Segment Market Shares, 2021
Figure 109 Lockheed Martin: Regional Market Shares, 2021
Figure 110 Lockheed Martin: Gross Profit, 2017-2021 (US$ million, AGR%)
Figure 111 Lockheed Martin: Operating Income, 2017-2021 (US$ million, AGR%)
Figure 112 Meggitt PLC: Net Revenue, 2017-2021 (US$ million, AGR%)
Figure 113 Meggitt PLC: Segment Market Shares, 2021
Figure 114 Meggitt PLC: Regional Market Shares, 2021
Figure 115 Meggitt PLC: Gross Profit, 2017-2021 (US$ million, AGR%)
Figure 116 Meggitt PLC: Operating Income, 2017-2021 (US$ million, AGR%)
Figure 117 Northrop Grumman Corp.: Net Revenue, 2017-2021 (US$ million, AGR%)
Figure 118 Northrop Grumman Corp.: Segment Market Shares, 2021
Figure 119 Northrop Grumman Corp.: Contract Type Market Shares, 2021
Figure 120 Northrop Grumman Corp.: Regional Market Shares, 2021
Figure 121 Northrop Grumman Corp.: Gross Profit, 2017-2021 (US$ million, AGR%)
Figure 122 Northrop Grumman Corp.: Operating Income, 2017-2021 (US$ million, AGR%)
Figure 123 Astronics Corporation: Net Revenue, 2017-2021 (US$ million, AGR%)
Figure 124 Astronics Corporation: Segment Market Shares, 2021
Figure 125 Astronics Corporation: Product Market Shares, 2021
Figure 126 Astronics Corporation: Regional Market Shares, 2021
Figure 127 Astronics Corporation: Gross Profit, 2017-2021 (US$ million, AGR%)
Figure 128 Astronics Corporation: Operating Income, 2017-2021 (US$ million, AGR%)
Figure 129 Comtech Telecommunications: Net Revenue, 2017-2021 (US$ million, AGR%)
Figure 130 Comtech Telecommunications: Regional Market Shares, 2021
Figure 131 Comtech Telecommunications: Gross Profit, 2017-2021 (US$ million, AGR%)
Figure 132 Comtech Telecommunications: Operating Income, 2017-2021 (US$ million, AGR%)
Figure 133 Lufthansa Technik: Net Revenue, 2017-2021 (US$ million, AGR%)
Figure 134 Lufthansa Technik: EBIT, 2017-2021 (US$ million, AGR%)
Figure 135 Boeing: Net Revenue, 2017-2021 (US$ million, AGR%)
Figure 136 Boeing: Segment Market Shares, 2021
Figure 137 Boeing: Gross Profit, 2016-2020 (US$ million, AGR%)
Companies Profiled in the Report
Astronics Corporation
BAE Systems
Boeing
Comtech Telecommunications
CPI International
Flir Systems
General Dynamics Corporation
Kitsap Composites
Lockheed Martin
Lufthansa Technik
Meggitt PLC
NORDAM Group, Inc.
Northrop Grumman Corp.
Saint-Gobain Performance Plastics
Starwin Industries
List of Companies Mentioned in the Report
Airbus
Altavian, Inc.
Bansat S.A.
Bombardier
Carlisle
Cessna
Chemring Australia Pty
Cobham SATCOM
Collins Aerospace
Communications & Power Industries (LLC)
Communications & Power Industries (LLC)
Comtech EF Data Corp.
COOPESA
DARPA
Embraer
EnCore Group
ENPPI
ETI Mission Controls LLC
Eurofigher
Eutelsat
Evergreen Aviation Technologies Corporation
GA Telesis
Gap Wireless
Gogo
Gulfstream
HAL
HyComp LLC
IntelliDesign
Jet Aviation
Kymeta
L3 ESSCO, Inc. (ESSCO)
L3Harris Technologies
Leonardo
Lufthansa Technik Shannon Ltd.
Micro Hydraulics
Milrem LCM
Mission-Critical Technologies group
Navantia
NH Industries
NORDAM Asia Limited
Northrop Grumman Australia
Panavia Aircraft
Park Electrochemical
Parker Hannifin Corporation
PECO Inc.
Porcher Industries
Providence Photonics
Raytheon Technologies Corporation
Sabena Aerospace
SATCOM Technologies
Seiren Co., Ltd
SES S.A.
Sichuan Services
Synspective Inc.
Teague
TMD Holdings Limited
TransDigm Group
UHP Networks Inc.
United Technologies Corp.
Vertex Aerospace
Xenex
List of Organizations Mentioned in the Report
Atlantic Aviation Group (AAG)
Avelo Airlines
China Airlines
Civil Aviation Administration of China (CAAC)
European Union Aviation Safety Agency
Federal Aviation Administration
International Air Transport Association (IATA)
International Airlines Group (IAG)
National Oceanic and Atmospheric Administration’s (NOAA)
National Weather Service (NWS)
Norwegian Ministry of Defence
Oslo Police
Relay Ground Station-Asia (RGS-A)
Society of Professional Engineering Employees in Aerospace (SPEEA)
The National Aeronautics and Space Administration
U.S. Department of State (DOS)
U.S. Naval Information Warfare Center (NIWC)
UK Civil Aviation Authority (CAA)