The Propylene Glycol Market Report 2023-2033: This report will prove invaluable to leading firms striving for new revenue pockets if they wish to better understand the industry and its underlying dynamics. It will be useful for companies that would like to expand into different industries or to expand their existing operations in a new region.
Increasing Demand Unsaturated Polyester Resin is Expected to Fuel Propylene Glycol Market Growth
The propylene glycol market is anticipated to witness significant growth due to the growing demand for unsaturated polyester resin (UPR). UPR is a key end-use application of propylene glycol, predominantly used in the production of composite materials, such as fiberglass-reinforced plastics. The increasing adoption of UPR in various industries, including construction, automotive, marine, and electrical, is expected to fuel the demand for propylene glycol. Moreover, the automotive industry’s growing emphasis on lightweight materials and fuel efficiency is boosting the demand for UPR in the production of automotive parts, such as body panels, interior components, and structural reinforcements. Propylene glycol acts as a crucial component in UPR formulations, providing enhanced stability, viscosity control, and curing properties. As the automotive industry continues to witness technological advancements and increasing demand for lightweight materials, the propylene glycol market is expected to experience sustained growth.
Additionally, the marine and electrical industries are significant consumers of UPR, further driving the demand for propylene glycol. UPR-based composites find extensive applications in boat manufacturing, wind turbine blades, and electrical insulation, among others. The rising focus on renewable energy sources, such as wind power, is driving the demand for UPR-based materials, consequently bolstering the propylene glycol market.
Availability & Price of Raw Materials Hampering the Industry Growth
The price and profitability of propylene glycol producers are significantly influenced by the availability and cost of raw materials derived from petroleum. These raw materials, obtained from petroleum feedstocks through refining and petrochemical processes, serve as the primary source for propylene, the key precursor in propylene glycol production. The propylene oxide is the primary source of petroleum-based propylene glycol and changing price dynamics affects the overall market prices. Fluctuations in the availability and cost of petroleum feedstocks directly impact the production costs of propylene glycol. High or volatile petroleum prices increase the procurement costs of propylene feedstock, thereby exerting upward pressure on the production costs of propylene glycol. Consequently, propylene glycol producers may encounter challenges in maintaining profitability and competitiveness.
Additionally, the availability of petroleum feedstocks can affect the supply of propylene, thereby impacting the production capacity and availability of propylene glycol. Supply disruptions or constraints in the petroleum industry can lead to propylene shortages, further exacerbating the challenges faced by propylene glycol producers.
What Questions Should You Ask before Buying a Market Research Report?
• How is the propylene glycol market evolving?
• What is driving and restraining the propylene glycol market?
• How will each propylene glycol submarket segment grow over the forecast period and how much revenue will these submarkets account for in 2033?
• How will the market shares for each propylene glycol submarket develop from 2023 to 2033?
• What will be the main driver for the overall market from 2023 to 2033?
• Will leading propylene glycol markets broadly follow the macroeconomic dynamics, or will individual national markets outperform others?
• How will the market shares of the national markets change by 2033 and which geographical region will lead the market in 2033?
• Who are the leading players and what are their prospects over the forecast period?
• What are the propylene glycol projects for these leading companies?
• How will the industry evolve during the period between 2023 and 2033? What are the implications of propylene glycol projects taking place now and over the next 10 years?
• Is there a greater need for product commercialisation to further scale the propylene glycol market?
• Where is the propylene glycol market heading and how can you ensure you are at the forefront of the market?
• What are the best investment options for new product and service lines?
• What are the key prospects for moving companies into a new growth path and C-suite?
You need to discover how this will impact the propylene glycol market today, and over the next 10 years:
• Our 366-page report provides 144 tables and 240 charts/graphs exclusively to you.
• The report highlights key lucrative areas in the industry so you can target them – NOW.
• It contains in-depth analysis of global, regional and national sales and growth.
• It highlights for you the key successful trends, changes and revenue projections made by your competitors.
This report tells you TODAY how the propylene glycol market will develop in the next 10 years, and in line with the variations in COVID-19 economic recession and bounce. This market is more critical now than at any point over the last 10 years.
Forecasts to 2033 and other analyses reveal commercial prospects
• In addition to revenue forecasting to 2033, our new study provides you with recent results, growth rates, and market shares.
• You will find original analyses, with business outlooks and developments.
• Discover qualitative analyses (including market dynamics, drivers, opportunities, restraints and challenges), cost structure, impact of rising propylene glycol prices and recent developments.
This report includes data analysis and invaluable insight into how COVID-19 will affect the industry and your company. Four COVID-19 recovery patterns and their impact, namely, “V”, “L”, “W” and “U” are discussed in this report.
Segments Covered in the Report
Source
• Petroleum-derived
• Bio-derived
Grade
• Industrial Grade
• Pharmaceutical Grade
Application
• Unsaturated Polyester Resin
• Paints and Coatings
• Antifreeze & Functional Fluids
• Liquid Detergents
• Plasticizers
• Food & Beverage
• Pharmaceuticals
• Cosmetics & Personal Care
• Others

In addition to the revenue predictions for the overall world market and segments, you will also find revenue forecasts for five regional and 16 leading national markets:
North America
• U.S.
• Canada
Europe
• Germany
• UK
• France
• Italy
• Spain
• Russia
• Rest of Europe
Asia Pacific
• China
• Japan
• India
• South Korea
• Australia
• Rest of APAC
Latin America
• Brazil
• Mexico
• Rest of Latin America
MEA
• GCC
• South Africa
• Rest of MEA
Need industry data? Please contact us today.
The report also includes profiles and for some of the leading companies in the Propylene Glycol Market, 2023 to 2033, with a focus on this segment of these companies’ operations.
Leading companies and the potential for market growth
• ADEKA Corporation
• Archer Daniels Midland (ADM)
• BASF SE
• Dow Inc.
• Global Bio-chem Technology Group Company Limited
• Indorama Ventures Public Company Limited
• Ineos Group Holdings S.A.
• LyondellBasell Industries N.V.
• Manali Petrochemicals Limited
• Monument Chemical
• Repsol S.A.
• Sadara Chemical Company (Sadara)
• Shell plc
• SKC Co., Ltd.
Overall world revenue for Propylene Glycol Market, 2023 to 2033 in terms of value the market will surpass US$5,022.9 million in 2023, our work calculates. We predict strong revenue growth through to 2033. Our work identifies which organizations hold the greatest potential. Discover their capabilities, progress, and commercial prospects, helping you stay ahead.
How will the Propylene Glycol Market, 2023 to 2033 report help you?
In summary, our 360+ page report provides you with the following knowledge:
• Revenue forecasts to 2033 for Propylene Glycol Market, 2023 to 2033 Market, with forecasts for source, grade and application, each forecast at a global and regional level – discover the industry’s prospects, finding the most lucrative places for investments and revenues.
• Revenue forecasts to 2033 for five regional and 16 key national markets – See forecasts for the Propylene Glycol Market, 2023 to 2033 market in North America, Europe, Asia-Pacific, Latin America, and MEA. Also forecasted is the market in the US, Canada, Mexico, Brazil, Germany, France, UK, Italy, China, India, Japan, and Australia among other prominent economies.
• Prospects for established firms and those seeking to enter the market – including company profiles for 14 of the major companies involved in the Propylene Glycol Market, 2023 to 2033.
Find quantitative and qualitative analyses with independent predictions. Receive information that only our report contains, staying informed with invaluable business intelligence.
Information found nowhere else
With our new report, you are less likely to fall behind in knowledge or miss out on opportunities. See how our work could benefit your research, analyses, and decisions. Visiongain’s study is for everybody needing commercial analyses for the Propylene Glycol Market, 2023 to 2033, market-leading companies. You will find data, trends and predictions.
To access the data contained in this document please email contactus@visiongain.com
Buy our report today Propylene Glycol Market Report 2023-2033: Forecasts by Source (Petroleum-derived, Bio-derived), by Grade (Industrial Grade, Pharmaceutical Grade), by Application (Unsaturated Polyester Resin, Paints and Coatings, Antifreeze & Functional Fluids, Liquid Detergents, Plasticisers, Food & Beverage, Pharmaceuticals, Cosmetics & Personal Care, Other), AND Regional and Leading National Market Analysis PLUS Analysis of Leading Companies AND COVID-19 Impact and Recovery Pattern Analysis. Avoid missing out by staying informed – order our report now.
Visiongain is a trading partner with the US Federal Government
CCR Ref number: KD4R6
Do you have any custom requirements we can help you with? Any need for a specific country, geo region, market segment or specific company information? Contact us today, we can discuss your needs and see how we can help: contactus@visiongain.com
1 Report Overview
1.1 Objectives of the Study
1.2 Introduction to Propylene Glycol Market
1.3 What This Report Delivers
1.4 Why You Should Read This Report
1.5 Key Questions Answered by This Analytical Report
1.6 Who is This Report for?
1.7 Methodology
1.7.1 Market Definitions
1.7.2 Market Evaluation & Forecasting Methodology
1.7.3 Data Validation
1.7.3.1 Primary Research
1.7.3.2 Secondary Research
1.8 Frequently Asked Questions (FAQs)
1.9 Associated Visiongain Reports
1.10 About Visiongain
2 Executive Summary
3 Market Overview
3.1 Key Findings
3.2 Market Dynamics
3.2.1 Market Driving Factors
3.2.1.1 Increasing Demand Unsaturated Polyester Resin is Expected to Fuel Propylene Glycol Market Growth
3.2.1.2 Growing Demand from Pharmaceutical and Food & Beverage Industry
3.2.1.3 Rising Automotive Industry in APAC and the Middle East & Africa
3.2.1.4 Growing Demand for Petroleum-based Propylene Glycol in APAC & the Middle East & Africa
3.2.2 Market Restraining Factors
3.2.2.1 Strict Government Regulations and the Health Concerns Related to Propylene Glycol
3.2.2.2 The Availability & Price of Raw Materials
3.2.2.3 Tough Competition from the Substitutes
3.2.3 Market Opportunities
3.2.3.1 Growing Demand for Bio-based Propylene Glycol
3.2.3.2 Development of New Applications for Propylene Glycol
3.2.3.3 Growing Demand for Antifreeze and Coolant Applications
3.3 COVID-19 Impact Analysis
3.4 Porter’s Five Forces Analysis
3.4.1 Bargaining Power of Suppliers
3.4.2 Bargaining Power of Buyers
3.4.3 Competitive Rivalry
3.4.4 Threat from Substitutes
3.4.5 Threat of New Entrants
3.5 PEST Analysis
4 Propylene Glycol Market Analysis by Source
4.1 Key Findings
4.2 Source Segment: Market Attractiveness Index
4.3 Propylene Glycol Market Size Estimation and Forecast by Source
4.4 Petroleum-derived Propylene Glycol
4.4.1 Market Size by Region, 2023-2033 (US$ Million)
4.4.2 Market Share by Region, 2023 & 2033 (%)
4.5 Bio-derived Propylene Glycol
4.5.1 Market Size by Region, 2023-2033 (US$ Million)
4.5.2 Market Share by Region, 2023 & 2033 (%)
5 Propylene Glycol Market Analysis by Grade
5.1 Key Findings
5.2 Grade Segment: Market Attractiveness Index
5.3 Propylene Glycol Market Size Estimation and Forecast by Grade
5.4 Industrial Grade Propylene Glycol
5.4.1 Market Size by Region, 2023-2033 (US$ Million)
5.4.2 Market Share by Region, 2023 & 2033 (%)
5.5 Pharmaceutical Grade Propylene Glycol
5.5.1 Market Size by Region, 2023-2033 (US$ Million)
5.5.2 Market Share by Region, 2023 & 2033 (%)
6 Propylene Glycol Market Analysis by Application
6.1 Key Findings
6.2 Application Segment: Market Attractiveness Index
6.3 Propylene Glycol Market Size Estimation and Forecast by Application
6.4 Unsaturated Polyester Resin
6.4.1 Market Size by Region, 2023-2033 (US$ Million)
6.4.2 Market Share by Region, 2023 & 2033 (%)
6.5 Paints and Coatings
6.5.1 Market Size by Region, 2023-2033 (US$ Million)
6.5.2 Market Share by Region, 2023 & 2033 (%)
6.6 Antifreeze & Functional Fluids
6.6.1 Market Size by Region, 2023-2033 (US$ Million)
6.6.2 Market Share by Region, 2023 & 2033 (%)
6.7 Liquid Detergents
6.7.1 Market Size by Region, 2023-2033 (US$ Million)
6.7.2 Market Share by Region, 2023 & 2033 (%)
6.8 Plasticizers
6.8.1 Market Size by Region, 2023-2033 (US$ Million)
6.8.2 Market Share by Region, 2023 & 2033 (%)
6.9 Food & Beverage
6.9.1 Market Size by Region, 2023-2033 (US$ Million)
6.9.2 Market Share by Region, 2023 & 2033 (%)
6.10 Pharmaceuticals
6.10.1 Market Size by Region, 2023-2033 (US$ Million)
6.10.2 Market Share by Region, 2023 & 2033 (%)
6.11 Cosmetics & Personal Care
6.11.1 Market Size by Region, 2023-2033 (US$ Million)
6.11.2 Market Share by Region, 2023 & 2033 (%)
6.12 Others
6.12.1 Market Size by Region, 2023-2033 (US$ Million)
6.12.2 Market Share by Region, 2023 & 2033 (%)
7 Propylene Glycol Market Analysis by Region
7.1 Key Findings
7.2 Regional Market Size Estimation and Forecast
8 North America Propylene Glycol Market Analysis
8.1 Key Findings
8.2 North America Propylene Glycol Market Attractiveness Index
8.3 North America Propylene Glycol Market by Country, 2023, 2028 & 2033 (US$ Million and Kilo Tons)
8.4 North America Propylene Glycol Market Size Estimation and Forecast by Country
8.5 North America Propylene Glycol Market Size Estimation and Forecast by Source
8.6 North America Propylene Glycol Market Size Estimation and Forecast by Grade
8.7 North America Propylene Glycol Market Size Estimation and Forecast by Application
8.8 U.S. Propylene Glycol Market Analysis
8.9 Canada Propylene Glycol Market Analysis
9 Europe Propylene Glycol Market Analysis
9.1 Key Findings
9.2 Europe Propylene Glycol Market Attractiveness Index
9.3 Europe Propylene Glycol Market by Country, 2023, 2028 & 2033 (US$ Million and Kilo Tons)
9.4 Europe Propylene Glycol Market Size Estimation and Forecast by Country
9.5 Europe Propylene Glycol Market Size Estimation and Forecast by Source
9.6 Europe Propylene Glycol Market Size Estimation and Forecast by Grade
9.7 Europe Propylene Glycol Market Size Estimation and Forecast by Application
9.8 Germany Propylene Glycol Market Analysis
9.9 UK Propylene Glycol Market Analysis
9.10 France Propylene Glycol Market Analysis
9.11 Italy Propylene Glycol Market Analysis
9.12 Spain Propylene Glycol Market Analysis
9.13 Russia Propylene Glycol Market Analysis
9.14 Rest of Europe Propylene Glycol Market Analysis
10 Asia Pacific Propylene Glycol Market Analysis
10.1 Key Findings
10.2 Asia Pacific Propylene Glycol Market Attractiveness Index
10.3 Asia Pacific Propylene Glycol Market by Country, 2023, 2028 & 2033 (US$ Million and Kilo Tons)
10.4 Asia Pacific Propylene Glycol Market Size Estimation and Forecast by Country
10.5 Asia Pacific Propylene Glycol Market Size Estimation and Forecast by Source
10.6 Asia Pacific Propylene Glycol Market Size Estimation and Forecast by Grade
10.7 Asia Pacific Propylene Glycol Market Size Estimation and Forecast by Application
10.8 China Propylene Glycol Market Analysis
10.9 Japan Propylene Glycol Market Analysis
10.10 India Propylene Glycol Market Analysis
10.11 South Korea Propylene Glycol Market Analysis
10.12 Australia Propylene Glycol Market Analysis
10.13 Rest of Asia Pacific Propylene Glycol Market Analysis
11 Latin America Propylene Glycol Market Analysis
11.1 Key Findings
11.2 Latin America Propylene Glycol Market Attractiveness Index
11.3 Latin America Propylene Glycol Market by Country, 2023, 2028 & 2033 (US$ Million and Kilo Tons)
11.4 Latin America Propylene Glycol Market Size Estimation and Forecast by Country
11.5 Latin America Propylene Glycol Market Size Estimation and Forecast by Source
11.6 Latin America Propylene Glycol Market Size Estimation and Forecast by Grade
11.7 Latin America Propylene Glycol Market Size Estimation and Forecast by Application
11.8 Mexico Propylene Glycol Market Analysis
11.9 Brazil Propylene Glycol Market Analysis
11.10 Rest of Latin America Propylene Glycol Market Analysis
12 Middle East & Africa Propylene Glycol Market Analysis
12.1 Key Findings
12.2 Middle East & Africa Propylene Glycol Market Attractiveness Index
12.3 Middle East & Africa Propylene Glycol Market by Country, 2023, 2028 & 2033 (US$ Million and Kilo Tons)
12.4 Middle East & Africa Propylene Glycol Market Size Estimation and Forecast by Country
12.5 Middle East & Africa Propylene Glycol Market Size Estimation and Forecast by Source
12.6 Middle East & Africa Propylene Glycol Market Size Estimation and Forecast by Grade
12.7 Middle East & Africa Propylene Glycol Market Size Estimation and Forecast by Application
12.8 GCC Propylene Glycol Market Analysis
12.9 South Africa Propylene Glycol Market Analysis
12.10 Rest of Middle East & Africa Propylene Glycol Market Analysis
13 Company Profiles
13.1 Competitive Landscape, 2022
13.2 Strategic Outlook
13.3 LyondellBasell Industries N.V.
13.3.1 Company Snapshot
13.3.2 Company Overview
13.3.3 Financial Analysis
13.3.3.1 Net Revenue, 2017-2022
13.3.3.2 R&D, 2017-2022
13.3.3.3 Regional Market Shares, 2022
13.3.3.4 Segmental Market Shares, 2022
13.3.4 Product Benchmarking
13.3.5 Strategic Outlook
13.4 Dow Inc.
13.4.1 Company Snapshot
13.4.2 Company Overview
13.4.3 Financial Analysis
13.4.3.1 Net Revenue, 2018-2022
13.4.3.2 R&D, 2018-2022
13.4.3.3 Regional Market Shares, 2022
13.4.3.4 Segmental Market Shares, 2022
13.4.4 Product Benchmarking
13.4.5 Strategic Outlook
13.5 Archer Daniels Midland (ADM)
13.5.1 Company Snapshot
13.5.2 Company Overview
13.5.3 Financial Analysis
13.5.3.1 Net Revenue, 2017-2022
13.5.3.2 R&D, 2017-2022
13.5.3.3 Regional Market Shares, 2022
13.5.3.4 Segmental Market Shares, 2022
13.5.4 Product Benchmarking
13.6 Indorama Ventures Public Company Limited
13.6.1 Company Snapshot
13.6.2 Company Overview
13.6.3 Financial Analysis
13.6.3.1 Net Revenue, 2017-2022
13.6.3.2 R&D, 2017-2022
13.6.3.3 Regional Market Shares, 2022
13.6.3.4 Segmental Market Shares, 2022
13.6.4 Product Benchmarking
13.7 Sadara Chemical Company (Sadara)
13.7.1 Company Snapshot
13.7.2 Company Overview
13.7.3 Product Benchmarking
13.7.4 Strategic Outlook
13.9 BASF SE
13.9.1 Company Snapshot
13.9.2 Company Overview
13.9.3 Financial Analysis
13.9.3.1 Net Revenue, 2017-2022
13.9.3.2 R&D, 2017-2022
13.9.3.3 Regional Market Shares, 2022
13.9.3.4 Segmental Market Shares, 2022
13.9.4 Product Benchmarking
13.9.5 Strategic Outlook
13.10 Shell plc
13.10.1 Company Snapshot
13.10.2 Company Overview
13.10.3 Financial Analysis
13.10.3.1 Net Revenue, 2017-2022
13.10.3.2 R&D, 2017-2022
13.10.3.3 Regional Market Shares, 2022
13.10.3.4 Segmental Market Shares, 2022
13.10.4 Product Benchmarking
13.11 SKC Co., Ltd.
13.11.1 Company Snapshot
13.11.2 Company Overview
13.11.3 Financial Analysis
13.11.3.1 Net Revenue, 2019-2022
13.11.3.2 Segmental Market Shares, 2022
13.11.4 Product Benchmarking
13.12 INEOS Group Holdings S.A.
13.12.1 Company Snapshot
13.12.2 Company Overview
13.12.3 Financial Analysis
13.12.3.1 Net Revenue, 2017-2022
13.12.3.2 R&D, 2017-2022
13.12.3.3 Regional Market Shares, 2022
13.12.3.4 Segmental Market Shares, 2022
13.12.4 Product Benchmarking
13.12.5 Strategic Outlook
13.13 Repsol S.A.
13.13.1 Company Snapshot
13.13.2 Company Overview
13.13.3 Financial Analysis
13.13.3.1 Net Revenue, 2020-2022
13.13.3.2 R&D, 2019-2022
13.13.4 Product Benchmarking
13.13.5 Strategic Outlook
13.14 ADEKA Corporation
13.14.1 Company Snapshot
13.14.2 Company Overview
13.14.3 Financial Analysis
13.14.3.1 Net Revenue, 2017-2022
13.14.3.2 R&D, 2017-2021
13.14.3.3 Regional Market Shares, 2021
13.14.3.4 Segmental Market Shares, 2022
13.14.4 Product Benchmarking
13.15 Manali Petrochemicals Limited
13.15.1 Company Snapshot
13.15.2 Company Overview
13.15.3 Financial Analysis
13.15.3.1 Net Revenue, 2017-2022
13.15.3.2 R&D, 2019-2022
13.15.3.3 Segmental Market Shares, 2022
13.15.4 Product Benchmarking
13.15.5 Strategic Outlook
13.16 Monument Chemical
13.16.1 Company Snapshot
13.16.2 Company Overview
13.16.3 Product Benchmarking
13.17 Global Bio-chem Technology Group Company Limited
13.17.1 Company Snapshot
13.17.2 Company Overview
13.17.3 Financial Analysis
13.17.3.1 Net Revenue, 2017-2022
13.17.3.2 R&D, 2017-2022
13.17.3.3 Regional Market Shares, 2022
13.17.3.4 Segmental Market Shares, 2022
13.17.4 Product Benchmarking
14 Conclusion and Recommendations
14.1 Concluding Remarks from Visiongain
14.2 Recommendations for Market Players
List of Tables
Table 1 Propylene Glycol Market Snapshot, 2023 & 2033 (US$ Million and Kilo Tons, CAGR %)
Table 2 Propylene Glycol Market Volume Forecast by Country, 2023-2033 (Kilo Tons, AGR%, CAGR%): “V” Shaped Recovery Scenario
Table 3 Propylene Glycol Market Volume Forecast by Country, 2023-2033 (Kilo Tons, AGR%, CAGR%): “U” Shaped Recovery Scenario
Table 4 Propylene Glycol Market Forecast by Country, 2023-2033 (Kilo Tons, AGR%, CAGR%): “W” Shaped Recovery Scenario
Table 5 Propylene Glycol Market Volume Forecast by Country, 2023-2033 (Kilo Tons, AGR%, CAGR%): “L” Shaped Recovery Scenario
Table 6 Propylene Glycol Market Revenue Forecast by Source, 2023-2033 (US$ Million, AGR%, CAGR%)
Table 7 Propylene Glycol Market Volume Forecast by Source, 2023-2033 (Kilo Tons, AGR%, CAGR%)
Table 8 Petroleum-derived Propylene Glycol Market Revenue Forecast by Geography, 2023-2033 (US$ Million, AGR%, CAGR%)
Table 9 Bio-derived Propylene Glycol Market Revenue Forecast by Geography, 2023-2033 (US$ Million, AGR%, CAGR%)
Table 10 Propylene Glycol Market Revenue Forecast by Grade, 2023-2033 (US$ Million, AGR%, CAGR%)
Table 11 Propylene Glycol Market Volume Forecast by Grade, 2023-2033 (Kilo Tons, AGR%, CAGR%)
Table 12 Industrial Grade Propylene Glycol Market Revenue Forecast by Geography, 2023-2033 (US$ Million, AGR%, CAGR%)
Table 13 Pharmaceutical Grade Propylene Glycol Market Revenue Forecast by Geography, 2023-2033 (US$ Million, AGR%, CAGR%)
Table 14 Propylene Glycol Market Revenue Forecast by Application, 2023-2033 (US$ Million, AGR%, CAGR%)
Table 15 Propylene Glycol Market Volume Forecast by Application, 2023-2033 (Kilo Tons, AGR%, CAGR%)
Table 16 Unsaturated Polyester Resin Propylene Glycol Market Revenue Forecast by Geography, 2023-2033 (US$ Million, AGR%, CAGR%)
Table 17 Paints and Coatings Propylene Glycol Market Revenue Forecast by Geography, 2023-2033 (US$ Million, AGR%, CAGR%)
Table 18 Antifreeze & Functional Fluids Propylene Glycol Market Revenue Forecast by Geography, 2023-2033 (US$ Million, AGR%, CAGR%)
Table 19 Liquid Detergents Propylene Glycol Market Revenue Forecast by Geography, 2023-2033 (US$ Million, AGR%, CAGR%)
Table 20 Plasticizers Propylene Glycol Market Revenue Forecast by Geography, 2023-2033 (US$ Million, AGR%, CAGR%)
Table 21 Food & Beverage Propylene Glycol Market Revenue Forecast by Geography, 2023-2033 (US$ Million, AGR%, CAGR%)
Table 22 Pharmaceuticals Propylene Glycol Market Revenue Forecast by Geography, 2023-2033 (US$ Million, AGR%, CAGR%)
Table 23 Cosmetics & Personal Care Propylene Glycol Market Revenue Forecast by Geography, 2023-2033 (US$ Million, AGR%, CAGR%)
Table 24 Other Applications Propylene Glycol Market Revenue Forecast by Geography, 2023-2033 (US$ Million, AGR%, CAGR%)
Table 25 Propylene Glycol Market Revenue Forecast by Geography, 2023-2033 (US$ Million, AGR%, CAGR%)
Table 26 Propylene Glycol Market Volume Forecast by Geography, 2023-2033 (Kilo Tons, AGR%, CAGR%)
Table 27 North America Propylene Glycol Market Revenue Forecast by Country, 2023-2033 (US$ Million, AGR%, CAGR%)
Table 28 North America Propylene Glycol Market Volume Forecast by Country, 2023-2033 (Kilo Tons, AGR%, CAGR%)
Table 29 North America Propylene Glycol Market Revenue Forecast by Source, 2023-2033 (US$ Million, AGR%, CAGR%)
Table 30 North America Propylene Glycol Market Volume Forecast by Source, 2023-2033 (Kilo Tons, AGR%, CAGR%)
Table 31 North America Propylene Glycol Market Revenue Forecast by Grade, 2023-2033 (US$ Million, AGR%, CAGR%)
Table 32 North America Propylene Glycol Market Volume Forecast by Grade, 2023-2033 (Kilo Tons, AGR%, CAGR%)
Table 33 North America Propylene Glycol Market Revenue Forecast by Application, 2023-2033 (US$ Million, AGR%, CAGR%)
Table 34 North America Propylene Glycol Market Volume Forecast by Application, 2023-2033 (Kilo Tons, AGR%, CAGR%)
Table 35 U.S. Propylene Glycol Market Revenue Forecast, 2023-2033 (US$ Million, AGR%, CAGR%)
Table 36 U.S. Propylene Glycol Market Volume Forecast, 2023-2033 (Kilo Tons, AGR%, CAGR%)
Table 37 Canada Propylene Glycol Market Revenue Forecast, 2023-2033 (US$ Million, AGR%, CAGR%)
Table 38 Canada Propylene Glycol Market Volume Forecast, 2023-2033 (Kilo Tons, AGR%, CAGR%)
Table 39 Europe Propylene Glycol Market Revenue Forecast by Country, 2023-2033 (US$ Million, AGR%, CAGR%)
Table 40 Europe Propylene Glycol Market Volume Forecast by Country, 2023-2033 (Kilo Tons, AGR%, CAGR%)
Table 41 Europe Propylene Glycol Market Revenue Forecast by Source, 2023-2033 (US$ Million, AGR%, CAGR%)
Table 42 Europe Propylene Glycol Market Volume Forecast by Source, 2023-2033 (Kilo Tons, AGR%, CAGR%)
Table 43 Europe Propylene Glycol Market Revenue Forecast by Grade, 2023-2033 (US$ Million, AGR%, CAGR%)
Table 44 Europe Propylene Glycol Market Volume Forecast by Grade, 2023-2033 (Kilo Tons, AGR%, CAGR%)
Table 45 Europe Propylene Glycol Market Revenue Forecast by Application, 2023-2033 (US$ Million, AGR%, CAGR%)
Table 46 Europe Propylene Glycol Market Volume Forecast by Application, 2023-2033 (Kilo Tons, AGR%, CAGR%)
Table 47 Germany Propylene Glycol Market Revenue Forecast, 2023-2033 (US$ Million, AGR%, CAGR%)
Table 48 Germany Propylene Glycol Market Volume Forecast, 2023-2033 (Kilo Tons, AGR%, CAGR%)
Table 49 UK Propylene Glycol Market Revenue Forecast, 2023-2033 (US$ Million, AGR%, CAGR%)
Table 50 UK Propylene Glycol Market Volume Forecast, 2023-2033 (Kilo Tons, AGR%, CAGR%)
Table 51 France Propylene Glycol Market Revenue Forecast, 2023-2033 (US$ Million, AGR%, CAGR%)
Table 52 France Propylene Glycol Market Volume Forecast, 2023-2033 (Kilo Tons, AGR%, CAGR%)
Table 53 Italy Propylene Glycol Market Revenue Forecast, 2023-2033 (US$ Million, AGR%, CAGR%)
Table 54 Italy Propylene Glycol Market Volume Forecast, 2023-2033 (Kilo Tons, AGR%, CAGR%)
Table 55 Spain Propylene Glycol Market Revenue Forecast, 2023-2033 (US$ Million, AGR%, CAGR%)
Table 56 Spain Propylene Glycol Market Volume Forecast, 2023-2033 (Kilo Tons, AGR%, CAGR%)
Table 57 Russia Propylene Glycol Market Revenue Forecast, 2023-2033 (US$ Million, AGR%, CAGR%)
Table 58 Russia Propylene Glycol Market Volume Forecast, 2023-2033 (Kilo Tons, AGR%, CAGR%)
Table 59 Rest of Europe Propylene Glycol Market Revenue Forecast, 2023-2033 (US$ Million, AGR%, CAGR%)
Table 60 Rest of Europe Propylene Glycol Market Volume Forecast, 2023-2033 (Kilo Tons, AGR%, CAGR%)
Table 61 Asia Pacific Propylene Glycol Market Revenue Forecast by Country, 2023-2033 (US$ Million, AGR%, CAGR%)
Table 62 Asia Pacific Propylene Glycol Market Volume Forecast by Country, 2023-2033 (Kilo Tons, AGR%, CAGR%)1
Table 63 Asia Pacific Propylene Glycol Market Revenue Forecast by Source, 2023-2033 (US$ Million, AGR%, CAGR%)
Table 64 Asia Pacific Propylene Glycol Market Volume Forecast by Source, 2023-2033 (Kilo Tons, AGR%, CAGR%)
Table 65 Asia Pacific Propylene Glycol Market Revenue Forecast by Grade, 2023-2033 (US$ Million, AGR%, CAGR%)
Table 66 Asia Pacific Propylene Glycol Market Volume Forecast by Grade, 2023-2033 (Kilo Tons, AGR%, CAGR%)
Table 67 Asia Pacific Propylene Glycol Market Revenue Forecast by Application, 2023-2033 (US$ Million, AGR%, CAGR%)
Table 68 Asia Pacific Propylene Glycol Market Volume Forecast by Application, 2023-2033 (Kilo Tons, AGR%, CAGR%)
Table 69 China Propylene Glycol Market Revenue Forecast, 2023-2033 (US$ Million, AGR%, CAGR%)
Table 70 China Propylene Glycol Market Volume Forecast, 2023-2033 (Kilo Tons, AGR%, CAGR%)
Table 71 Japan Propylene Glycol Market Revenue Forecast, 2023-2033 (US$ Million, AGR%, CAGR%)
Table 72 Japan Propylene Glycol Market Volume Forecast, 2023-2033 (Kilo Tons, AGR%, CAGR%)
Table 73 India Propylene Glycol Market Revenue Forecast, 2023-2033 (US$ Million, AGR%, CAGR%)
Table 74 India Propylene Glycol Market Volume Forecast, 2023-2033 (Kilo Tons, AGR%, CAGR%)
Table 75 South Korea Propylene Glycol Market Revenue Forecast, 2023-2033 (US$ Million, AGR%, CAGR%)
Table 76 South Korea Propylene Glycol Market Volume Forecast, 2023-2033 (Kilo Tons, AGR%, CAGR%)
Table 77 Australia Propylene Glycol Market Revenue Forecast, 2023-2033 (US$ Million, AGR%, CAGR%)
Table 78 Australia Propylene Glycol Market Volume Forecast, 2023-2033 (Kilo Tons, AGR%, CAGR%)
Table 79 Rest of APAC Propylene Glycol Market Revenue Forecast, 2023-2033 (US$ Million, AGR%, CAGR%)
Table 80 Rest of APAC Propylene Glycol Market Volume Forecast, 2023-2033 (Kilo Tons, AGR%, CAGR%)
Table 81 Latin America Propylene Glycol Market Revenue Forecast by Country, 2023-2033 (US$ Million, AGR%, CAGR%)
Table 82 Latin America Propylene Glycol Market Volume Forecast by Country, 2023-2033 (Kilo Tons, AGR%, CAGR%)
Table 83 Latin America Propylene Glycol Market Revenue Forecast by Source, 2023-2033 (US$ Million, AGR%, CAGR%)
Table 84 Latin America Propylene Glycol Market Volume Forecast by Source, 2023-2033 (Kilo Tons, AGR%, CAGR%)
Table 85 Latin America Propylene Glycol Market Revenue Forecast by Grade, 2023-2033 (US$ Million, AGR%, CAGR%)
Table 86 Latin America Propylene Glycol Market Volume Forecast by Grade, 2023-2033 (Kilo Tons, AGR%, CAGR%)
Table 87 Latin America Propylene Glycol Market Revenue Forecast by Application, 2023-2033 (US$ Million, AGR%, CAGR%)
Table 88 Latin America Propylene Glycol Market Volume Forecast by Application, 2023-2033 (Kilo Tons, AGR%, CAGR%)
Table 89 Mexico Propylene Glycol Market Revenue Forecast, 2023-2033 (US$ Million, AGR%, CAGR%)
Table 90 Mexico Propylene Glycol Market Volume Forecast, 2023-2033 (Kilo Tons, AGR%, CAGR%)
Table 91 Brazil Propylene Glycol Market Revenue Forecast, 2023-2033 (US$ Million, AGR%, CAGR%)
Table 92 Brazil Propylene Glycol Market Volume Forecast, 2023-2033 (Kilo Tons, AGR%, CAGR%)
Table 93 Rest of Latin America Propylene Glycol Market Revenue Forecast, 2023-2033 (US$ Million, AGR%, CAGR%)
Table 94 Rest of Latin America Propylene Glycol Market Volume Forecast, 2023-2033 (Kilo Tons, AGR%, CAGR%)
Table 95 Middle East & Africa Propylene Glycol Market Revenue Forecast by Country, 2023-2033 (US$ Million, AGR%, CAGR%)
Table 96 Middle East & Africa Propylene Glycol Market Volume Forecast by Country, 2023-2033 (Kilo Tons, AGR%, CAGR%)
Table 97 Middle East & Africa Propylene Glycol Market Revenue Forecast by Source, 2023-2033 (US$ Million, AGR%, CAGR%)
Table 98 Middle East & Africa Propylene Glycol Market Volume Forecast by Source, 2023-2033 (Kilo Tons, AGR%, CAGR%)
Table 99 Middle East & Africa Propylene Glycol Market Revenue Forecast by Grade, 2023-2033 (US$ Million, AGR%, CAGR%)
Table 100 Middle East & Africa Propylene Glycol Market Volume Forecast by Grade, 2023-2033 (Kilo Tons, AGR%, CAGR%)
Table 101 Middle East & Africa Propylene Glycol Market Revenue Forecast by Application, 2023-2033 (US$ Million, AGR%, CAGR%)
Table 102 Middle East & Africa Propylene Glycol Market Volume Forecast by Application, 2023-2033 (Kilo Tons, AGR%, CAGR%)
Table 103 GCC Propylene Glycol Market Revenue Forecast, 2023-2033 (US$ Million, AGR%, CAGR%)
Table 104 GCC Propylene Glycol Market Volume Forecast, 2023-2033 (Kilo Tons, AGR%, CAGR%)
Table 105 South Africa Propylene Glycol Market Revenue Forecast, 2023-2033 (US$ Million, AGR%, CAGR%)
Table 106 South Africa Propylene Glycol Market Volume Forecast, 2023-2033 (Kilo Tons, AGR%, CAGR%)
Table 107 Rest of Middle East & Africa Propylene Glycol Market Revenue Forecast, 2023-2033 (US$ Million, AGR%, CAGR%)
Table 108 Rest of Middle East & Africa Propylene Glycol Market Volume Forecast, 2023-2033 (Kilo Tons, AGR%, CAGR%)
Table 109 Strategic Outlook
Table 110 LyondellBasell Industries N.V.: Key Details, (CEO, HQ, Revenue, Founded, No. of Employees, Company Type, Website, Business Segment)
Table 111 LyondellBasell Industries N.V.: Product Benchmarking
Table 112 LyondellBasell Industries N.V.: Strategic Outlook
Table 113 Dow Inc.: Key Details, (CEO, HQ, Revenue, Founded, No. of Employees, Company Type, Website, Business Segment)
Table 114 Dow Inc.: Product Benchmarking
Table 115 Dow Inc.: Strategic Outlook
Table 116 Archer Daniels Midland (ADM): Key Details, (CEO, HQ, Revenue, Founded, No. of Employees, Company Type, Website, Business Segment)
Table 117 Archer Daniels Midland (ADM): Product Benchmarking
Table 118 Indorama Ventures Public Company Limited: Key Details, (CEO, HQ, Revenue, Founded, No. of Employees, Company Type, Website, Business Segment)
Table 119 Indorama Ventures Public Company Limited: Product Benchmarking
Table 120 Sadara Chemical Company (Sadara): Key Details, (CEO, HQ, Revenue, Founded, No. of Employees, Company Type, Website, Business Segment)
Table 121 Sadara Chemical Company (Sadara): Product Benchmarking
Table 122 Sadara Chemical Company (Sadara): Strategic Outlook
Table 123 BASF SE: Key Details, (CEO, HQ, Revenue, Founded, No. of Employees, Company Type, Website, Business Segment)
Table 124 BASF SE: Product Benchmarking
Table 125 BAS SE: Strategic Outlook
Table 126 Shell plc: Key Details, (CEO, HQ, Revenue, Founded, No. of Employees, Company Type, Website, Business Segment)
Table 127 Shell plc: Product Benchmarking
Table 128 SKC Co., Ltd.: Key Details, (CEO, HQ, Revenue, Founded, No. of Employees, Company Type, Website, Business Segment)
Table 129 SKC Co., Ltd.: Product Benchmarking
Table 130 INEOS Group Holdings S.A.: Key Details, (CEO, HQ, Revenue, Founded, No. of Employees, Company Type, Website, Business Segment)
Table 131 INEOS Group Holdings S.A.: Product Benchmarking
Table 132 INEOS Group Holdings S.A.: Strategic Outlook
Table 133 Repsol S.A.: Key Details, (CEO, HQ, Revenue, Founded, No. of Employees, Company Type, Website, Business Segment)
Table 134 Repsol S.A.: Product Benchmarking
Table 135 Repsol S.A.: Strategic Outlook
Table 136 ADEKA Corporation: Key Details, (CEO, HQ, Revenue, Founded, No. of Employees, Company Type, Website, Business Segment)
Table 137 ADEKA Corporation: Product Benchmarking
Table 138 Manali Petrochemicals Limited: Key Details, (CEO, HQ, Revenue, Founded, No. of Employees, Company Type, Website, Business Segment)
Table 139 Manali Petrochemicals Limited: Product Benchmarking
Table 140 Manali Petrochemicals Limited: Strategic Outlook
Table 141 Monument Chemical: Key Details, (CEO, HQ, Revenue, Founded, No. of Employees, Company Type, Website, Business Segment)
Table 142 Monument Chemical: Product Benchmarking
Table 143 Global Bio-chem Technology Group Company Limited: Key Details, (CEO, HQ, Revenue, Founded, No. of Employees, Company Type, Website, Business Segment)
Table 144 Global Bio-chem Technology Group Company Limited: Product Benchmarking
List of Figures
Figure 1 Propylene Glycol Market Segmentation
Figure 2 Propylene Glycol Market by Source: Market Attractiveness Index
Figure 3 Propylene Glycol Market by Grade: Market Attractiveness Index
Figure 4 Propylene Glycol Market by Application: Market Attractiveness Index
Figure 5 Propylene Glycol Market Attractiveness Index by Region
Figure 6 Propylene Glycol Market: Market Dynamics
Figure 7 Propylene Glycol Market Volume Forecast by Region, 2023-2033 (Kilo Tons, AGR%): “V” Shaped Recovery Scenario
Figure 8 Propylene Glycol Market Volume Forecast by Region, 2023-2033 (Kilo Tons, AGR%): “U” Shaped Recovery Scenario
Figure 9 Propylene Glycol Market Volume Forecast by Region, 2023-2033 (Kilo Tons, AGR%): “W” Shaped Recovery Scenario
Figure 10 Propylene Glycol Market Volume Forecast by Region, 2023-2033 (Kilo Tons, AGR%): “L” Shaped Recovery Scenario
Figure 11 Propylene Glycol Market: Porter’s Five Forces Analysis
Figure 12 Propylene Glycol Market: PEST Analysis
Figure 13 Propylene Glycol Market by Source: Market Attractiveness Index
Figure 14 Propylene Glycol Market Revenue Forecast by Source, 2023-2033 (US$ Million, AGR %)
Figure 15 Propylene Glycol Market Revenue Share Forecast by Source, 2023, 2028, 2033 (%)
Figure 16 Propylene Glycol Market Volume Forecast by Source, 2023-2033 (Kilo Tons, AGR %)
Figure 17 Propylene Glycol Market Volume Share Forecast by Source, 2023, 2028, 2033 (%)
Figure 18 Petroleum-derived Propylene Glycol Market Revenue Forecast by Geography, 2023-2033 (US$ Million, AGR %)
Figure 19 Petroleum-derived Propylene Glycol Market Revenue Share Forecast by Region, 2023 & 2033 (%)
Figure 20 Bio-derived Propylene Glycol Market Revenue Forecast by Geography, 2023-2033 (US$ Million, AGR %)
Figure 21 Bio-derived Propylene Glycol Market Revenue Share Forecast by Region, 2023 & 2033 (%)
Figure 22 Propylene Glycol Market by Grade: Market Attractiveness Index
Figure 23 Propylene Glycol Market Revenue Forecast by Grade, 2023-2033 (US$ Million, AGR %)
Figure 24 Propylene Glycol Market Revenue Share Forecast by Grade, 2023, 2028, 2033 (%)
Figure 25 Propylene Glycol Market Volume Forecast by Grade, 2023-2033 (Kilo Tons, AGR %)
Figure 26 Propylene Glycol Market Volume Share Forecast by Grade, 2023, 2028, 2033 (%)
Figure 27 Industrial Grade Propylene Glycol Market Revenue Forecast by Geography, 2023-2033 (US$ Million, AGR %)
Figure 28 Industrial Grade Propylene Glycol Market Revenue Share Forecast by Region, 2023 & 2033 (%)
Figure 29 Pharmaceutical Grade Propylene Glycol Market Revenue Forecast by Geography, 2023-2033 (US$ Million, AGR %)
Figure 30 Pharmaceutical Grade Propylene Glycol Market Revenue Share Forecast by Region, 2023 & 2033 (%)
Figure 31 Propylene Glycol Market by Application: Market Attractiveness Index
Figure 32 Propylene Glycol Market Revenue Forecast by Application, 2023-2033 (US$ Million, AGR %)
Figure 33 Propylene Glycol Market Revenue Share Forecast by Application, 2023, 2028, 2033 (%)
Figure 34 Propylene Glycol Market Volume Forecast by Application, 2023-2033 (Kilo Tons, AGR %)
Figure 35 Propylene Glycol Market Volume Share Forecast by Application, 2023, 2028, 2033 (%)
Figure 36 Unsaturated Polyester Resin Propylene Glycol Market Revenue Forecast by Geography, 2023-2033 (US$ Million, AGR %)
Figure 37 Unsaturated Polyester Resin Propylene Glycol Market Revenue Share Forecast by Region, 2023 & 2033 (%)
Figure 38 Paints and Coatings Propylene Glycol Market Revenue Forecast by Geography, 2023-2033 (US$ Million, AGR %)
Figure 39 Paints and Coatings Propylene Glycol Market Revenue Share Forecast by Region, 2023 & 2033 (%)
Figure 40 Antifreeze & Functional Fluids Propylene Glycol Market Revenue Forecast by Geography, 2023-2033 (US$ Million, AGR %)
Figure 41 Antifreeze & Functional Fluids Propylene Glycol Market Revenue Share Forecast by Region, 2023 & 2033 (%)
Figure 42 Liquid Detergents Propylene Glycol Market Revenue Forecast by Geography, 2023-2033 (US$ Million, AGR %)
Figure 43 Liquid Detergents Propylene Glycol Market Revenue Share Forecast by Region, 2023 & 2033 (%)
Figure 44 Plasticizers Propylene Glycol Market Revenue Forecast by Geography, 2023-2033 (US$ Million, AGR %)
Figure 45 Plasticizers Propylene Glycol Market Revenue Share Forecast by Region, 2023 & 2033 (%)
Figure 46 Food & Beverage Propylene Glycol Market Revenue Forecast by Geography, 2023-2033 (US$ Million, AGR %)
Figure 47 Food & Beverage Propylene Glycol Market Revenue Share Forecast by Region, 2023 & 2033 (%)
Figure 48 Pharmaceutical Propylene Glycol Market Revenue Forecast by Geography, 2023-2033 (US$ Million, AGR %)
Figure 49 Pharmaceutical Propylene Glycol Market Revenue Share Forecast by Region, 2023 & 2033 (%)
Figure 50 Cosmetics & Personal Care Propylene Glycol Market Revenue Forecast by Geography, 2023-2033 (US$ Million, AGR %)
Figure 51 Cosmetics & Personal Care Propylene Glycol Market Revenue Share Forecast by Region, 2023 & 2033 (%)
Figure 52 Other Applications Propylene Glycol Market Revenue Forecast by Geography, 2023-2033 (US$ Million, AGR %)
Figure 53 Other Applications Propylene Glycol Market Revenue Share Forecast by Region, 2023 & 2033 (%)
Figure 54 Propylene Glycol Market Revenue Forecast by Region 2023 and 2033 (US$ Million, CAGR%)
Figure 55 Propylene Glycol Market Volume Forecast by Region 2023 and 2033 (Kilo Tons, CAGR%)
Figure 56 Propylene Glycol Market Revenue Share Forecast by Region 2023, 2028, 2033 (%)
Figure 57 Propylene Glycol Market Volume Share Forecast by Region 2023, 2028, 2033 (%)
Figure 58 Propylene Glycol Market Revenue by Region, 2023-2033 (US$ Million, AGR %)
Figure 59 Propylene Glycol Market Volume by Region, 2023-2033 (Kilo Tons, AGR %)
Figure 60 North America Propylene Glycol Market Attractiveness Index
Figure 61 North America Propylene Glycol Market Revenue by Country, 2023, 2028 & 2033 (US$ Million)
Figure 62 North America Propylene Glycol Market Volume by Country, 2023, 2028 & 2033 (Kilo Tons)
Figure 63 North America Propylene Glycol Market Revenue Forecast by Country, 2023-2033 (US$ Million, AGR %)
Figure 64 North America Propylene Glycol Market Revenue Share Forecast by Country, 2023 & 2033 (%)
Figure 65 North America Propylene Glycol Market Volume Forecast by Country, 2023-2033 (Kilo Tons, AGR %)
Figure 66 North America Propylene Glycol Market Volume Share Forecast by Country, 2023 & 2033 (%)
Figure 67 North America Propylene Glycol Market Revenue Forecast by Source, 2023-2033 (US$ Million, AGR %)
Figure 68 North America Propylene Glycol Market Revenue Share Forecast by Source, 2023 & 2033 (%)
Figure 69 North America Propylene Glycol Market Volume Forecast by Source, 2023-2033 (Kilo Tons, AGR %)
Figure 70 North America Propylene Glycol Market Volume Share Forecast by Source, 2023 & 2033 (%)
Figure 71 North America Propylene Glycol Market Revenue Forecast by Grade, 2023-2033 (US$ Million, AGR %)
Figure 72 North America Propylene Glycol Market Revenue Share Forecast by Grade, 2023 & 2033 (%)
Figure 73 North America Propylene Glycol Market Volume Forecast by Grade, 2023-2033 (Kilo Tons, AGR %)
Figure 74 North America Propylene Glycol Market Volume Share Forecast by Grade, 2023 & 2033 (%)
Figure 75 North America Propylene Glycol Market Revenue Forecast by Application, 2023-2033 (US$ Million, AGR %)
Figure 76 North America Propylene Glycol Market Revenue Share Forecast by Application, 2023 & 2033 (%)
Figure 77 North America Propylene Glycol Market Volume Forecast by Application, 2023-2033 (Kilo Tons, AGR %)
Figure 78 North America Propylene Glycol Market Volume Share Forecast by Application, 2023 & 2033 (%)
Figure 79 U.S. Propylene Glycol Market Revenue Forecast, 2023-2033 (US$ Million, AGR %)
Figure 80 U.S. Propylene Glycol Market Volume Forecast, 2023-2033 (Kilo Tons, AGR %)
Figure 81 Canada Propylene Glycol Market Revenue Forecast, 2023-2033 (US$ Million, AGR %)
Figure 82 Canada Propylene Glycol Market Volume Forecast, 2023-2033 (Kilo Tons, AGR %)
Figure 83 Europe Propylene Glycol Market Attractiveness Index
Figure 84 Europe Propylene Glycol Market Revenue by Country, 2023, 2028 & 2033 (US$ Million)
Figure 85 Europe Propylene Glycol Market Volume by Country, 2023, 2028 & 2033 (Kilo Tons)
Figure 86 Europe Propylene Glycol Market Revenue Forecast by Country, 2023-2033 (US$ Million, AGR %)
Figure 87 Europe Propylene Glycol Market Revenue Share Forecast by Country, 2023 & 2033 (%)
Figure 88 Europe Propylene Glycol Market Volume Forecast by Country, 2023-2033 (Kilo Tons, AGR %)
Figure 89 Europe Propylene Glycol Market Volume Share Forecast by Country, 2023 & 2033 (%)
Figure 90 Europe Propylene Glycol Market Revenue Forecast by Source, 2023-2033 (US$ Million, AGR %)
Figure 91 Europe Propylene Glycol Market Revenue Share Forecast by Source, 2023 & 2033 (%)
Figure 92 Europe Propylene Glycol Market Volume Forecast by Source, 2023-2033 (Kilo Tons, AGR %)
Figure 93 Europe Propylene Glycol Market Volume Share Forecast by Source, 2023 & 2033 (%)
Figure 94 Europe Propylene Glycol Market Revenue Forecast by Grade, 2023-2033 (US$ Million, AGR %)
Figure 95 Europe Propylene Glycol Market Revenue Share Forecast by Grade, 2023 & 2033 (%)
Figure 96 Europe Propylene Glycol Market Volume Forecast by Grade, 2023-2033 (Kilo Tons, AGR %)
Figure 97 Europe Propylene Glycol Market Volume Share Forecast by Grade, 2023 & 2033 (%)
Figure 98 Europe Propylene Glycol Market Revenue Forecast by Application, 2023-2033 (US$ Million, AGR %)
Figure 99 Europe Propylene Glycol Market Revenue Share Forecast by Application, 2023 & 2033 (%)
Figure 100 Europe Propylene Glycol Market Volume Forecast by Application, 2023-2033 (Kilo Tons, AGR %)
Figure 101 Europe Propylene Glycol Market Volume Share Forecast by Application, 2023 & 2033 (%)
Figure 102 Germany Propylene Glycol Market Revenue Forecast, 2023-2033 (US$ Million, AGR %)
Figure 103 Germany Propylene Glycol Market Volume Forecast, 2023-2033 (Kilo Tons, AGR %)
Figure 104 UK Propylene Glycol Market Revenue Forecast, 2023-2033 (US$ Million, AGR %)
Figure 105 UK Propylene Glycol Market Volume Forecast, 2023-2033 (Kilo Tons, AGR %)
Figure 106 France Propylene Glycol Market Revenue Forecast, 2023-2033 (US$ Million, AGR %)
Figure 107 France Propylene Glycol Market Volume Forecast, 2023-2033 (Kilo Tons, AGR %)
Figure 108 Italy Propylene Glycol Market Revenue Forecast, 2023-2033 (US$ Million, AGR %)
Figure 109 Italy Propylene Glycol Market Volume Forecast, 2023-2033 (Kilo Tons, AGR %)
Figure 110 Spain Propylene Glycol Market Revenue Forecast, 2023-2033 (US$ Million, AGR %)
Figure 111 Spain Propylene Glycol Market Volume Forecast, 2023-2033 (Kilo Tons, AGR %)
Figure 112 Russia Propylene Glycol Market Revenue Forecast, 2023-2033 (US$ Million, AGR %)
Figure 113 Russia Propylene Glycol Market Volume Forecast, 2023-2033 (Kilo Tons, AGR %)
Figure 114 Rest of Europe Propylene Glycol Market Revenue Forecast, 2023-2033 (US$ Million, AGR %)
Figure 115 Rest of Europe Propylene Glycol Market Volume Forecast, 2023-2033 (Kilo Tons, AGR %)
Figure 116 Asia Pacific Propylene Glycol Market Attractiveness Index
Figure 117 Asia Pacific Propylene Glycol Market Revenue by Country, 2023, 2028 & 2033 (US$ Million)
Figure 118 Asia Pacific Propylene Glycol Market Volume by Country, 2023, 2028 & 2033 (Kilo Tons)
Figure 119 Asia Pacific Propylene Glycol Market Revenue Forecast by Country, 2023-2033 (US$ Million, AGR %)
Figure 120 Asia Pacific Propylene Glycol Market Revenue Share Forecast by Country, 2023 & 2033 (%)
Figure 121 Asia Pacific Propylene Glycol Market Volume Forecast by Country, 2023-2033 (Kilo Tons, AGR %)
Figure 122 Asia Pacific Propylene Glycol Market Volume Share Forecast by Country, 2023 & 2033 (%)
Figure 123 Asia Pacific Propylene Glycol Market Revenue Forecast by Source, 2023-2033 (US$ Million, AGR %)
Figure 124 Asia Pacific Propylene Glycol Market Revenue Share Forecast by Source, 2023 & 2033 (%)
Figure 125 Asia Pacific Propylene Glycol Market Volume Forecast by Source, 2023-2033 (Kilo Tons, AGR %)
Figure 126 Asia Pacific Propylene Glycol Market Volume Share Forecast by Source, 2023 & 2033 (%)
Figure 127 Asia Pacific Propylene Glycol Market Revenue Forecast by Grade, 2023-2033 (US$ Million, AGR %)
Figure 128 Asia Pacific Propylene Glycol Market Revenue Share Forecast by Grade, 2023 & 2033 (%)
Figure 129 Asia Pacific Propylene Glycol Market Volume Forecast by Grade, 2023-2033 (Kilo Tons, AGR %)
Figure 130 Asia Pacific Propylene Glycol Market Volume Share Forecast by Grade, 2023 & 2033 (%)
Figure 131 Asia Pacific Propylene Glycol Market Revenue Forecast by Application, 2023-2033 (US$ Million, AGR %)
Figure 132 Asia Pacific Propylene Glycol Market Revenue Share Forecast by Application, 2023 & 2033 (%)
Figure 133 Asia Pacific Propylene Glycol Market Volume Forecast by Application, 2023-2033 (Kilo Tons, AGR %)
Figure 134 Asia Pacific Propylene Glycol Market Volume Share Forecast by Application, 2023 & 2033 (%)
Figure 135 China Propylene Glycol Market Revenue Forecast, 2023-2033 (US$ Million, AGR %)
Figure 136 China Propylene Glycol Market Volume Forecast, 2023-2033 (Kilo Tons, AGR %)
Figure 137 Japan Propylene Glycol Market Revenue Forecast, 2023-2033 (US$ Million, AGR %)
Figure 138 Japan Propylene Glycol Market Volume Forecast, 2023-2033 (Kilo Tons, AGR %)
Figure 139 India Propylene Glycol Market Revenue Forecast, 2023-2033 (US$ Million, AGR %)
Figure 140 India Propylene Glycol Market Volume Forecast, 2023-2033 (Kilo Tons, AGR %)
Figure 141 South Korea Propylene Glycol Market Revenue Forecast, 2023-2033 (US$ Million, AGR %)
Figure 142 South Korea Propylene Glycol Market Volume Forecast, 2023-2033 (Kilo Tons, AGR %)
Figure 143 Australia Propylene Glycol Market Revenue Forecast, 2023-2033 (US$ Million, AGR %)
Figure 144 Australia Propylene Glycol Market Volume Forecast, 2023-2033 (Kilo Tons, AGR %)
Figure 145 Rest of APAC Propylene Glycol Market Revenue Forecast, 2023-2033 (US$ Million, AGR %)
Figure 146 Rest of APAC Propylene Glycol Market Volume Forecast, 2023-2033 (Kilo Tons, AGR %)
Figure 147 Latin America Propylene Glycol Market Attractiveness Index
Figure 148 Latin America Propylene Glycol Market Revenue by Region, 2023, 2028 & 2033 (US$ Million)
Figure 149 Latin America Propylene Glycol Market Volume by Region, 2023, 2028 & 2033 (Kilo Tons)
Figure 150 Latin America Propylene Glycol Market Revenue Forecast by Country, 2023-2033 (US$ Million, AGR %)
Figure 151 Latin America Propylene Glycol Market Revenue Share Forecast by Country, 2023 & 2033 (%)
Figure 152 Latin America Propylene Glycol Market Volume Forecast by Country, 2023-2033 (Kilo Tons, AGR %)
Figure 153 Latin America Propylene Glycol Market Volume Share Forecast by Country, 2023 & 2033 (%)
Figure 154 Latin America Propylene Glycol Market Revenue Forecast by Source, 2023-2033 (US$ Million, AGR %)
Figure 155 Latin America Propylene Glycol Market Revenue Share Forecast by Source, 2023 & 2033 (%)
Figure 156 Latin America Propylene Glycol Market Volume Forecast by Source, 2023-2033 (Kilo Tons, AGR %)
Figure 157 Latin America Propylene Glycol Market Volume Share Forecast by Source, 2023 & 2033 (%)
Figure 158 Latin America Propylene Glycol Market Revenue Forecast by Grade, 2023-2033 (US$ Million, AGR %)
Figure 159 Latin America Propylene Glycol Market Revenue Share Forecast by Grade, 2023 & 2033 (%)
Figure 160 Latin America Propylene Glycol Market Volume Forecast by Grade, 2023-2033 (Kilo Tons, AGR %)
Figure 161 Latin America Propylene Glycol Market Volume Share Forecast by Grade, 2023 & 2033 (%)
Figure 162 Latin America Propylene Glycol Market Revenue Forecast by Application, 2023-2033 (US$ Million, AGR %)
Figure 163 Latin America Propylene Glycol Market Revenue Share Forecast by Application, 2023 & 2033 (%)
Figure 164 Latin America Propylene Glycol Market Volume Forecast by Application, 2023-2033 (Kilo Tons, AGR %)
Figure 165 Latin America Propylene Glycol Market Volume Share Forecast by Application, 2023 & 2033 (%)
Figure 166 Mexico Propylene Glycol Market Revenue Forecast, 2023-2033 (US$ Million, AGR %)
Figure 167 Mexico Propylene Glycol Market Volume Forecast, 2023-2033 (Kilo Tons, AGR %)
Figure 168 Brazil Propylene Glycol Market Revenue Forecast, 2023-2033 (US$ Million, AGR %)
Figure 169 Brazil Propylene Glycol Market Volume Forecast, 2023-2033 (Kilo Tons, AGR %)
Figure 170 Rest of Latin America Propylene Glycol Market Revenue Forecast, 2023-2033 (US$ Million, AGR %)
Figure 171 Rest of Latin America Propylene Glycol Market Volume Forecast, 2023-2033 (Kilo Tons, AGR %)
Figure 172 Middle East & Africa Propylene Glycol Market Attractiveness Index
Figure 173 Middle East & Africa Propylene Glycol Market Revenue by Country, 2023, 2028 & 2033 (US$ Million)
Figure 174 Middle East & Africa Propylene Glycol Market Volume by Country, 2023, 2028 & 2033 (Kilo Tons)
Figure 175 Middle East & Africa Propylene Glycol Market Revenue Forecast by Country, 2023-2033 (US$ Million, AGR %)
Figure 176 Middle East & Africa Propylene Glycol Market Revenue Share Forecast by Country, 2023 & 2033 (%)
Figure 177 Middle East & Africa Propylene Glycol Market Volume Forecast by Country, 2023-2033 (Kilo Tons, AGR %)
Figure 178 Middle East & Africa Propylene Glycol Market Volume Share Forecast by Country, 2023 & 2033 (%)
Figure 179 Middle East & Africa Propylene Glycol Market Revenue Forecast by Source, 2023-2033 (US$ Million, AGR %)
Figure 180 Middle East & Africa Propylene Glycol Market Revenue Share Forecast by Source, 2023 & 2033 (%)
Figure 181 Middle East & Africa Propylene Glycol Market Volume Forecast by Source, 2023-2033 (Kilo Tons, AGR %)
Figure 182 Middle East & Africa Propylene Glycol Market Volume Share Forecast by Source, 2023 & 2033 (%)
Figure 183 Middle East & Africa Propylene Glycol Market Revenue Forecast by Grade, 2023-2033 (US$ Million, AGR %)
Figure 184 Middle East & Africa Propylene Glycol Market Revenue Share Forecast by Grade, 2023 & 2033 (%)
Figure 185 Middle East & Africa Propylene Glycol Market Volume Forecast by Grade, 2023-2033 (Kilo Tons, AGR %)
Figure 186 Middle East & Africa Propylene Glycol Market Volume Share Forecast by Grade, 2023 & 2033 (%)
Figure 187 Middle East & Africa Propylene Glycol Market Revenue Forecast by Application, 2023-2033 (US$ Million, AGR %)
Figure 188 Middle East & Africa Propylene Glycol Market Revenue Share Forecast by Application, 2023 & 2033 (%)
Figure 189 Middle East & Africa Propylene Glycol Market Volume Forecast by Application, 2023-2033 (Kilo Tons, AGR %)
Figure 190 Middle East & Africa Propylene Glycol Market Volume Share Forecast by Application, 2023 & 2033 (%)
Figure 191 GCC Propylene Glycol Market Revenue Forecast, 2023-2033 (US$ Million, AGR %)
Figure 192 GCC Propylene Glycol Market Volume Forecast, 2023-2033 (Kilo Tons, AGR %)
Figure 193 South Africa Propylene Glycol Market Revenue Forecast, 2023-2033 (US$ Million, AGR %)
Figure 194 South Africa Propylene Glycol Market Volume Forecast, 2023-2033 (Kilo Tons, AGR %)
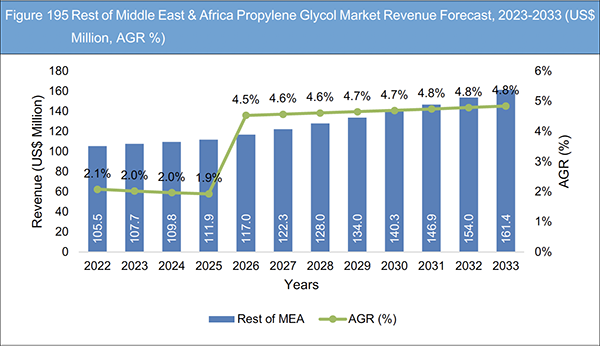
Figure 195 Rest of Middle East & Africa Propylene Glycol Market Revenue Forecast, 2023-2033 (US$ Million, AGR %)
Figure 196 Rest of Middle East & Africa Propylene Glycol Market Volume Forecast, 2023-2033 (Kilo Tons, AGR %)
Figure 197 Propylene Glycol Market: Company Share, 2022
Figure 198 LyondellBasell Industries N.V.: Net Revenue, 2017-2022 (US$ Million, AGR%)
Figure 199 LyondellBasell Industries N.V.: R&D, 2017-2022 (US$ Million, AGR%)
Figure 200 LyondellBasell Industries N.V.: Regional Market Shares, 2022
Figure 201 LyondellBasell Industries N.V.: Segmental Market Shares, 2022
Figure 202 Dow Inc.: Net Revenue, 2018-2022 (US$ Million, AGR%)
Figure 203 Dow Inc.: R&D, 2018-2022 (US$ Million, AGR%)
Figure 204 Dow Inc.: Regional Market Shares, 2022
Figure 205 Dow Inc.: Segmental Market Shares, 2022
Figure 206 Archer Daniels Midland (ADM): Net Revenue, 2017-2022 (US$ Million, AGR%)
Figure 207 Archer Daniels Midland (ADM): R&D, 2017-2022 (US$ Million, AGR%)
Figure 208 Archer Daniels Midland (ADM): Regional Market Shares, 2022
Figure 209 Archer Daniels Midland (ADM): Segmental Market Shares, 2022
Figure 210 Indorama Ventures Public Company Limited: Net Revenue, 2017-2022 (US$ Million, AGR%)
Figure 211 Indorama Ventures Public Company Limited: R&D, 2017-2022 (US$ Million, AGR%)
Figure 212 Indorama Ventures Public Company Limited: Regional Market Shares, 2022
Figure 213 Indorama Ventures Public Company Limited: Segmental Market Shares, 2022
Figure 214 BASF SE: Net Revenue, 2017-2022 (US$ Million, AGR%)
Figure 215 BASF SE: R&D, 2017-2022 (US$ Million, AGR%)
Figure 216 BASF SE: Regional Market Shares, 2022
Figure 217 BASF SE: Segmental Market Shares, 2022
Figure 218 Shell plc: Net Revenue, 2017-2022 (US$ Million, AGR%)
Figure 219 Shell plc: R&D, 2017-2022 (US$ Million, AGR%)
Figure 220 Shell plc: Regional Market Shares, 2022
Figure 221 Shell plc: Segmental Market Shares, 2022
Figure 222 SKC Co., Ltd.: Net Revenue, 2019-2022 (US$ Million, AGR%)
Figure 223 SKC Co., Ltd.: Segmental Market Shares, 2022
Figure 224 INEOS Group Holdings S.A.: Net Revenue, 2017-2022 (US$ Million, AGR%)
Figure 225 INEOS Group Holdings S.A.: R&D, 2017-2022 (US$ Million, AGR%)
Figure 226 INEOS Group Holdings S.A.: Regional Market Shares, 2022
Figure 227 INEOS Group Holdings S.A.: Segmental Market Shares, 2022
Figure 228 Repsol S.A.: Net Revenue, 2020-2022 (US$ Million, AGR%)
Figure 229 Repsol S.A.: R&D, 2019-2022 (US$ Million, AGR%)
Figure 230 ADEKA Corporation: Net Revenue, 2017-2022 (US$ Million, AGR%)
Figure 231 ADEKA Corporation: R&D, 2017-2021 (US$ Million, AGR%)
Figure 232 ADEKA Corporation: Regional Market Shares, 2021
Figure 233 ADEKA Corporation: Segmental Market Shares, 2022
Figure 234 Manali Petrochemicals Limited: Net Revenue, 2017-2022 (US$ Million, AGR%)
Figure 235 Manali Petrochemicals Limited: R&D, 2019-2022 (US$ Million, AGR%)
Figure 236 Manali Petrochemicals Limited: Segmental Market Shares, 2022
Figure 237 Global Bio-chem Technology Group Company Limited: Net Revenue, 2017-2022 (US$ Million, AGR%)
Figure 238 Global Bio-chem Technology Group Company Limited: R&D, 2017-2022 (US$ Million, AGR%)
Figure 239 Global Bio-chem Technology Group Company Limited: Regional Market Shares, 2022
Figure 240 Global Bio-chem Technology Group Company Limited: Segmental Market Shares, 2022
List of Companies profiled in the report
ADEKA Corporation
Archer Daniels Midland (ADM)
BASF SE
Dow Inc.
Global Bio
Indorama Ventures Public Company Limited
INEOS Group Holdings S.A.
LyondellBasell Industries N.V.
Manali Petrochemicals Limited
Monument Chemical
Repsol S.A.
Sadara Chemical Company (Sadara)
Shell plc
SKC Co., Ltd.-chem Technology Group Company Limited
Other Companies mentioned in the report
Air Liquide Engineering and Construction
Alban Muller International
Ashland
BASF Canada Inc.
Boehringer Ingelheim International GmbH
BP
Braskem
Chaoyang Chemicals, Inc
ChemCom Dunaliella B.V.
China Petroleum & Chemical Corporation (Sinopec)
CNOOC Oil & Petrochemicals Co., Ltd
Croda International
DuPont Tate & Lyle
Ethos Asset Management Inc
Evonik Industries AG
GBE Europe B.V.
GreenGlycols® Green Glycols B.V.
HELM AG
Huntsman Corporation
Industrial Technology Investments Poland Sp.z.o.o.
JeNaCell
Kuwait Petroleum Corporation
LG Chem
LOTTE Chemical
Mepol Group
Mepol S.r.l.
Merck KGaA
Metadynea LLC
Metafrax Group
Mitsubishi Chemical Corporation
Mitsui Chemicals
MOL Petrochemicals Private Company Ltd.
Ningbo ZRCC LyondellBasell New Material Company Limited
OCI Company Ltd
Oleon NV
ORLEN Południe
Polar S.r.l.
SABIC
Saudi Electronic Information Exchange Company
Shanghai Huayi Group
Shell Nanhai B.V.
SK picglobal
Sojitz
Solus Biotech
Solvay S.A.
Temix International S.R.L.
Zhejiang NHU Company
List of organization/ associations mentioned in the report
American Chemistry Council (ACC)
Canadian Environmental Protection Act (CEPA)
Dutch Ministry of Health
Environmental Protection Agency (EPA)
European Chemical Industry Council (Cefic)
European Chemicals Agency
European Union
Food and Drug Administration (FDA)
Gulf Cooperation Council
Personal Care Products Council (PCPC)
Organisation of the Petroleum Exporting Countries (OPEC)