The Optical Coatings Market Report 2023-2033: This report will prove invaluable to leading firms striving for new revenue pockets if they wish to better understand the industry and its underlying dynamics. It will be useful for companies that would like to expand into different industries or to expand their existing operations in a new region.
Increasing Demand from Various Industries Such as Electronics, Telecommunications, Automotive, and Healthcare
The optical coating market is a rapidly growing market, driven by the increasing demand from various industries such as electronics, telecommunications, automotive, and healthcare. The market has been experiencing significant growth due to the increasing adoption of optical devices and the growing demand for energy-efficient products. The market has also witnessed significant advancements in technology, with companies investing in research and development activities to improve their product offerings.
The global optical coating market is highly competitive, with several key players dominating the market. These players are constantly investing in research and development activities to improve their product offerings and stay ahead of the competition. The increasing competition from low-cost manufacturers in Asia is also a challenge faced by companies in the market.
The market is expected to continue to grow at a significant pace in the coming years, driven by the increasing demand from emerging economies in Asia Pacific and Latin America. The increasing use of optical coatings in healthcare applications is also expected to drive the growth of the market. The use of optical coatings in medical devices such as endoscopes, microscopes, and surgical instruments is becoming increasingly popular, which is expected to create new opportunities for companies operating in the market.
What Questions Should You Ask before Buying a Market Research Report?
• How is the optical coating market evolving?
• What is driving and restraining the optical coating market?
• How will each optical coating submarket segment grow over the forecast period and how much revenue will these submarkets account for in 2033?
• How will the market shares for each optical coating submarket develop from 2023 to 2033?
• What will be the main driver for the overall market from 2023 to 2033?
• Will leading optical coating markets broadly follow the macroeconomic dynamics, or will individual national markets outperform others?
• How will the market shares of the national markets change by 2033 and which geographical region will lead the market in 2033?
• Who are the leading players and what are their prospects over the forecast period?
• What are the optical coating projects for these leading companies?
• How will the industry evolve during the period between 2023 and 2033? What are the implications of optical coating projects taking place now and over the next 10 years?
• Is there a greater need for product commercialisation to further scale the optical coating market?
• Where is the optical coating market heading and how can you ensure you are at the forefront of the market?
• What are the best investment options for new product and service lines?
• What are the key prospects for moving companies into a new growth path and C-suite?
You need to discover how this will impact the optical coating market today, and over the next 10 years:
• Our 315-page report provides 137 tables and 173 charts/graphs exclusively to you.
• The report highlights key lucrative areas in the industry so you can target them – NOW.
• It contains in-depth analysis of global, regional and national sales and growth.
• It highlights for you the key successful trends, changes and revenue projections made by your competitors.
This report tells you TODAY how the optical coating market will develop in the next 10 years, and in line with the variations in COVID-19 economic recession and bounce. This market is more critical now than at any point over the last 10 years.
Forecasts to 2033 and other analyses reveal commercial prospects
• In addition to revenue forecasting to 2033, our new study provides you with recent results, growth rates, and market shares.
• You will find original analyses, with business outlooks and developments.
• Discover qualitative analyses (including market dynamics, drivers, opportunities, restraints and challenges), cost structure, impact of rising optical coating prices and recent developments.
This report includes data analysis and invaluable insight into how COVID-19 will affect the industry and your company. Four COVID-19 recovery patterns and their impact, namely, “V”, “L”, “W” and “U” are discussed in this report.
Segments Covered in the Report
Market Segment by Coating Materials
• Metallic Materials
• Dielectric Materials
Market Segment by Filter Coating
• Short-Pass
• Long-Pass
• Other Filter Coating
Market Segment by Coating Method
• Vacuum Deposition
• E-Beam Evaporation
• Sputtering Process
• Ion-Assisted Deposition (IAD)
Market Segment by End-Use Industry
• Electronics & Semiconductor
• Aerospace and Defense
• Automotive Industry
• Solar Power Industry
• Other Industry
Market Segment by Type
• Anti-reflective Coatings
• High Reflection Coating
• Beam Splitter Coating
• Transparent Conductive Coating
• Filter Coating
• Other Type

In addition to the revenue predictions for the overall world market and segments, you will also find revenue forecasts for four regional and 20 leading national markets:
North America
• U.S.
• Canada
Europe
• Germany
• Russia
• United Kingdom
• France
• Italy
• Rest of Europe
Asia Pacific
• China
• Japan
• India
• Australia
• South Korea
• Rest of Asia Pacific
Latin America
• Brazil
• Mexico
• Rest of Latin America
Middle East & Africa
• GCC
• South Africa
• Rest of Middle East & Africa
Need industry data? Please contact us today.
The report also includes profiles and for some of the leading companies in the Optical Coating Market, 2023 to 2033, with a focus on this segment of these companies’ operations.
Leading companies and the potential for market growth
• Abrisa Technologies
• Alluxa, Inc.
• Delta Optical Thin Film A/S information
• Denton Vacuum LLC
• Edmund Optics
• Evaporated Coatings Inc.
• Janos Technology LLC
• JDS Uniphase Corporation
• Newport Corporation
• Ophir Optronics Solutions, Inc.
• Optical Coating Laboratory Inc. (OCLI)
• Optical Filter Source LLC
• PPG Industries, Inc.
• Reynard Corporation
• ZEISS Group
Overall world revenue for Optical Coating Market, 2023 to 2033 in terms of value the market will surpass US$14,630 million in 2023, our work calculates. We predict strong revenue growth through to 2033. Our work identifies which organizations hold the greatest potential. Discover their capabilities, progress, and commercial prospects, helping you stay ahead.
How will the Optical Coating Market, 2023 to 2033 report help you?
In summary, our 310+ page report provides you with the following knowledge:
• Revenue forecasts to 2033 for Optical Coating Market, 2023 to 2033 Market, with forecasts for, type, coating materials, filter coating, coating method, and end-use industry, each forecast at a global and regional level – discover the industry’s prospects, finding the most lucrative places for investments and revenues.
• Revenue forecasts to 2033 for four regional and 20 key national markets – See forecasts for the Optical Coating Market, 2023 to 2033 market in North America, Europe, Asia-Pacific, Latin America and Middle East & Africa. Also forecasted is the market in the US, Canada, Brazil, Germany, France, UK, Italy, China, India, Japan, and Australia among other prominent economies.
• Prospects for established firms and those seeking to enter the market – including company profiles for 15 of the major companies involved in the Optical Coating Market, 2023 to 2033.
Find quantitative and qualitative analyses with independent predictions. Receive information that only our report contains, staying informed with invaluable business intelligence.
Information found nowhere else
With our new report, you are less likely to fall behind in knowledge or miss out on opportunities. See how our work could benefit your research, analyses, and decisions. Visiongain’s study is for everybody needing commercial analyses for the Optical Coating Market, 2023 to 2033, market-leading companies. You will find data, trends and predictions.
To access the data contained in this document please email contactus@visiongain.com
Buy our report today Optical Coatings Market Report 2023-2033: Forecasts by Coating Materials (Metallic Materials, Dielectric Materials), by Filter Coating (Short-Pass, Long-Pass, Other), by Coating Method (Vacuum Deposition, E-Beam Evaporation, Sputtering Process, Ion-Assisted Deposition (IAD)), by End-use Industry (Electronics & Semiconductor, Aerospace and Defence, Automotive Industry, Solar Power Industry, Other), by Type (Anti-reflective Coatings, High Reflection Coating, Beam Splitter Coating, Transparent Conductive Coating, Filter Coating, Other) AND Regional and Leading National Market Analysis PLUS Analysis of Leading Companies AND COVID-19 Impact and Recovery Pattern Analysis. Avoid missing out by staying informed – order our report now.
Visiongain is a trading partner with the US Federal Government
CCR Ref number: KD4R6
Do you have any custom requirements we can help you with? Any need for a specific country, geo region, market segment or specific company information? Contact us today, we can discuss your needs and see how we can help: contactus@visiongain.com
1 Report Overview
1.1 Objectives of the Study
1.2 Introduction to Optical Coating Market
1.3 What This Report Delivers
1.4 Why You Should Read This Report
1.5 Key Questions Answered by This Analytical Report
1.6 Who is This Report for?
1.7 Research Methodology
1.7.1 Market Definitions
1.7.2 Market Evaluation & Forecasting Methodology
1.7.3 Data Validation
1.7.3.1 Primary Research
1.7.3.2 Secondary Research
1.8 Frequently Asked Questions (FAQs)
1.9 Associated Visiongain Reports
1.10 About Visiongain
2 Executive Summary
2.1 Segment Analysis
2.1.1 Coating Material Segment: Market Attractiveness Index
2.1.2 Filter Coating Segment: Market Attractiveness Index
2.1.3 Coating Method Segment: Market Attractiveness Index
2.1.4 End-Use Segment: Market Attractiveness Index
2.1.5 Type Segment: Market Attractiveness Index
2.2 Regional Analysis
3 Market Overview
3.1 Key Findings
3.2 Market Dynamics
3.2.1 Market Driving Factors
3.2.1.1 Increasing Demand for High-Quality Optical Systems
3.2.1.2 Advancements in Technology
3.2.1.3 Growing Investment in Research and Development
3.2.2 Market Restraining Factors
3.2.2.1 High Capital Investment and Manufacturing Cost
3.2.2.2 Limited Applications and Niche Market
3.2.2.3 Environmental Concerns and Regulations
3.2.3 Market Opportunities
3.2.3.1 Growing Demand for Optical Coatings in the Consumer Electronics Industry
3.2.3.2 Increasing Use of Optical Coatings in Solar Panels
3.2.3.3 Growing Demand for Optical Coatings in the Healthcare Industry
3.3 COVID-19 Impact Analysis
3.3.1 V-Shaped Recovery
3.3.2 W-Shaped Recovery
3.3.3 U-Shaped Recovery
3.3.4 L-Shaped Recovery
3.4 Porter’s Five Forces Analysis
3.4.1 Threat of New Entrants
3.4.2 Bargaining Power of Suppliers
3.4.3 Bargaining Power of Buyers
3.4.4 Threat of Substitute Products
3.4.5 Intensity of Competitive Rivalry
3.5 PEST Analysis
3.5.1 Political Factors
3.5.2 Economic Factors
3.5.3 Social Factors
3.5.4 Technological Factors
3.6 Recent Developments in the Global Market
4 Optical Coating Market Analysis by Coating Material
4.1 Key Findings
4.2 Coating Material Segment: Market Attractiveness Index
4.3 Global Optical Coating Market by Coating Materials
4.4 Metallic Materials Market
4.4.1 Market Size by Region, 2023-2033 (US$ Mn)
4.4.2 Market Share by Region, 2023 & 2033 (%)
4.5 Dielectric Materials Market
4.5.1 Market Size by Region, 2023-2033 (US$ Mn)
4.5.2 Market Share by Region, 2023 & 2033 (%)
5 Optical Coating Market Analysis by Filter Coating
5.1 Key Findings
5.2 Filter Coating Segment: Market Attractiveness Index
5.3 Global Optical Coating Market by Filter Coating
5.4 Short-Pass Market
5.4.1 Market Size by Region, 2023-2033 (US$ Mn)
5.4.2 Market Share by Region, 2023 & 2033 (%)
5.5 Long-Pass Market
5.5.1 Market Size by Region, 2023-2033 (US$ Mn)
5.5.2 Market Share by Region, 2023 & 2033 (%)
5.6 Other Filter Coating Market
5.6.1 Market Size by Region, 2023-2033 (US$ Mn)
5.6.2 Market Share by Region, 2023 & 2033 (%)
6 Optical Coating Market Analysis by Coating Method
6.1 Key Findings
6.2 Coating Method Segment: Market Attractiveness Index
6.3 Global Optical Coating Market by Coating Method
6.4 Vacuum Deposition Market
6.4.1 Market Size by Region, 2023-2033 (US$ Mn)
6.4.2 Market Share by Region, 2023 & 2033 (%)
6.5 E-Beam Evaporation Market
6.5.1 Market Size by Region, 2023-2033 (US$ Mn)
6.5.2 Market Share by Region, 2023 & 2033 (%)
6.6 Sputtering Process Market
6.6.1 Market Size by Region, 2023-2033 (US$ Mn)
6.6.2 Market Share by Region, 2023 & 2033 (%)
6.7 Ion-Assisted Deposition (IAD) Market
6.7.1 Market Size by Region, 2023-2033 (US$ Mn)
6.7.2 Market Share by Region, 2023 & 2033 (%)
7 Optical Coating Market Analysis by End-Use
7.1 Key Findings
7.2 End-Use Segment: Market Attractiveness Index
7.3 Global Optical Coating Market by End-Use
7.4 Electronics & Semiconductor Market
7.4.1 Market Size by Region, 2023-2033 (US$ Mn)
7.4.2 Market Share by Region, 2023 & 2033 (%)
7.5 Aerospace and Defence Market
7.5.1 Market Size by Region, 2023-2033 (US$ Mn)
7.5.2 Market Share by Region, 2023 & 2033 (%)
7.6 Automotive Industry Market
7.6.1 Market Size by Region, 2023-2033 (US$ Mn)
7.6.2 Market Share by Region, 2023 & 2033 (%)
7.7 Solar Power Industry Market
7.7.1 Market Size by Region, 2023-2033 (US$ Mn)
7.7.2 Market Share by Region, 2023 & 2033 (%)
7.8 Other Industry Market
7.8.1 Market Size by Region, 2023-2033 (US$ Mn)
7.8.2 Market Share by Region, 2023 & 2033 (%)
8 Optical Coating Market Analysis by Type
8.1 Key Findings
8.2 Type Segment: Market Attractiveness Index
8.3 Global Optical Coating Market by Type
8.4 Anti-reflective Coatings Market
8.4.1 Market Size by Region, 2023-2033 (US$ Mn)
8.4.2 Market Share by Region, 2023 & 2033 (%)
8.5 High Reflection Coating Market
8.5.1 Market Size by Region, 2023-2033 (US$ Mn)
8.5.2 Market Share by Region, 2023 & 2033 (%)
8.6 Beam Splitter Coating Market
8.6.1 Market Size by Region, 2023-2033 (US$ Mn)
8.6.2 Market Share by Region, 2023 & 2033 (%)
8.7 Transparent Conductive Coating Market
8.7.1 Market Size by Region, 2023-2033 (US$ Mn)
8.7.2 Market Share by Region, 2023 & 2033 (%)
8.8 Filter Coating Market
8.8.1 Market Size by Region, 2023-2033 (US$ Mn)
8.8.2 Market Share by Region, 2023 & 2033 (%)
8.9 Other Type Market
8.9.1 Market Size by Region, 2023-2033 (US$ Mn)
8.9.2 Market Share by Region, 2023 & 2033 (%)
9 Optical Coating Market Analysis by Region
9.1 Key Findings
9.2 Global Optical Coating Market Forecast
9.3 Global Optical Coating Market by Region
9.4 Global Optical Coating Market by Coating Materials
9.5 Global Optical Coating Market by Filter Coating
9.6 Global Optical Coating Market by Coating Method
9.7 Global Optical Coating Market by End-Use Industry
9.8 Global Optical Coating Market by Type
10 North America Optical Coating Market Analysis
10.1 Key Findings
10.2 North America Optical Coating Market Attractiveness Index
10.3 North America Optical Coating Market by Value
10.4 North America Optical Coating Market by Country
10.5 North America Optical Coating Market by Coating Materials
10.6 North America Optical Coating Market by Filter Coating
10.7 North America Optical Coating Market by Coating Method
10.8 North America Optical Coating Market by End-Use Industry
10.9 North America Optical Coating Market by Type
10.10 North America Optical Coating Market For Aerospace and Defence by Application
10.10.1 Optical Lenses
10.10.2 Aerospace Solar Panels
10.10.3 Night Vision Technology
10.10.4 Satellite Antennas
10.10.5 Laser Optics
10.11 U.S. Optical Coating Market Analysis
10.11.1 Recent Developments
10.11.2 Competitive Landscape
10.12 Canada Optical Coating Market Analysis
10.12.1 Recent Developments
11 Europe Optical Coating Market Analysis
11.1 Key Findings
11.2 Europe Optical Coating Market Attractiveness Index
11.3 Europe Optical Coating Market by Value
11.4 Europe Optical Coating Market by Country
11.5 Europe Optical Coating Market by Coating Materials
11.6 Europe Optical Coating Market by Filter Coating
11.7 Europe Optical Coating Market by Coating Method
11.8 Europe Optical Coating Market by End-Use
11.9 Europe Optical Coating Market by Type
11.10 Europe Optical Coating Market For Aerospace and Defence by Application
11.11 Germany Optical Coating Market Analysis
11.11.1 Recent Developments
11.12 UK Optical Coating Market Analysis
11.12.1 Recent Developments
11.13 France Optical Coating Market Analysis
11.13.1 Recent Developments
11.14 Italy Optical Coating Market Analysis
11.14.1 Recent Developments
11.15 Russia Optical Coating Market Analysis
11.15.1 Recent Developments
11.16 Rest of Europe Optical Coating Market Analysis
12 Asia Pacific Optical Coating Market Analysis
12.1 Key Findings
12.2 Asia Pacific Optical Coating Market Attractiveness Index
12.3 Asia Pacific Optical Coating Market by Value
12.4 Asia Pacific Optical Coating Market by Country
12.5 Asia Pacific Optical Coating Market by Coating Materials
12.6 Asia Pacific Optical Coating Market by Filter Coating
12.7 Asia Pacific Optical Coating Market by Coating Method
12.8 Asia Pacific Optical Coating Market by End-Use
12.9 Asia Pacific Optical Coating Market by Type
12.10 China Optical Coating Market Analysis
12.11 India Optical Coating Market Analysis
12.12 Japan Optical Coating Market Analysis
12.13 South Korea Optical Coating Market Analysis
12.14 Australia Optical Coating Market Analysis
12.15 Rest of Asia Pacific Optical Coating Market Analysis
13 Middle East & Africa Optical Coating Market Analysis
13.1 Key Findings
13.2 Middle East & Africa Optical Coating Market Attractiveness Index
13.3 Middle East & Africa Optical Coating Market by Value
13.4 Middle East & Africa Optical Coating Market by Country
13.5 Middle East & Africa Optical Coating Market by Coating Material
13.6 Middle East & Africa Optical Coating Market by Filter Coating
13.7 Middle East & Africa Optical Coating Market by Coating Method
13.8 Middle East & Africa Optical Coating Market by End-Use
13.9 Middle East & Africa Optical Coating Market by Type
13.10 GCC Optical Coating Market Analysis
13.11 South Africa Optical Coating Market Analysis
13.12 Rest of Middle East & Africa Optical Coating Market Analysis
14 Latin America Optical Coating Market Analysis
14.1 Key Findings
14.2 Latin America Optical Coating Market Attractiveness Index
14.3 Latin America Optical Coating Market by Value
14.4 Latin America Optical Coating Market by Country
14.5 Latin America Optical Coating Market by Coating Material
14.6 Latin America Optical Coating Market by Filter Coating
14.7 Latin America Optical Coating Market by Coating Method
14.8 Latin America Optical Coating Market by End-Use
14.9 Latin America Optical Coating Market by Type
14.10 Brazil Optical Coating Market Analysis
14.11 Mexico Optical Coating Market Analysis
14.12 Rest of Latin America Optical Coating Market Analysis
15 Company Profiles
15.1 Competitive Landscape, 2022
15.2 Strategic Outlook
15.2.1 Acquisitions as Key Business Strategy
15.2.2 Partnership as Key Business Strategy
15.2.3 New Product Launch as Key Business Strategy
15.2.4 Expansion as Key Business Strategy
15.3 PPG Industries, Inc.
15.3.1 Company Snapshot
15.3.2 Company Overview
15.3.3 Financial Analysis
15.3.3.1 Net Revenue, 2018-2022
15.3.3.2 R&D, 2018-2022
15.3.3.3 Regional Revenue Shares, 2022 (%)
15.3.3.4 Business Segment Revenue Shares, 2022 (%)
15.3.4 Product Benchmarking
15.4 Alluxa, Inc
15.4.1 Company Snapshot
15.4.2 Company Overview
15.4.3 Product Benchmarking
15.4.4 Strategic Outlook
15.5 Janos Technology LLC
15.5.1 Company Snapshot
15.5.2 Company Overview
15.5.3 Product Benchmarking
15.6 Newport Corporation
15.6.1 Company Snapshot
15.6.2 Company Overview
15.6.3 Product Benchmarking
15.7 Ophir Optronics Solutions, Inc.
15.7.1 Company Snapshot
15.7.2 Company Overview
15.7.3 Product Benchmarking
15.8 Reynard Corporation
15.8.1 Company Snapshot
15.8.2 Company Overview
15.8.3 Product Benchmarking
15.9 Optical Coating Laboratory Inc. (OCLI)
15.9.1 Company Snapshot
15.9.2 Company Overview
15.9.3 Product Benchmarking
15.10 Abrisa Technologies
15.10.1 Company Snapshot
15.10.2 Company Overview
15.10.3 Product Benchmarking
15.11 Delta Optical Thin Film A/S information
15.11.1 Company Snapshot
15.11.2 Company Overview
15.11.3 Product Benchmarking
15.11.4 Strategic Outlook
15.12 Evaporated Coatings Inc.
15.12.1 Company Snapshot
15.12.2 Company Overview
15.12.3 Product Benchmarking
15.12.4 Strategic Outlook
15.13 Optical Filter Source LLC
15.13.1 Company Snapshot
15.13.2 Company Overview
15.13.3 Product Benchmarking
15.14 Edmund Optics
15.14.1 Company Snapshot
15.14.2 Company Overview
15.14.3 Product Benchmarking
15.14.4 Strategic Outlook
15.15 ZEISS Group
15.15.1 Company Snapshot
15.15.2 Company Overview
15.15.3 Product Benchmarking
15.16 JDS Uniphase Corporation
15.16.1 Company Snapshot
15.16.2 Company Overview
15.16.3 Product Benchmarking
15.17 Denton Vacuum LLC
15.17.1 Company Snapshot
15.17.2 Company Overview
15.17.3 Product Benchmarking
15.17.4 Strategic Outlook
16 Conclusion and Recommendations
16.1 Concluding Remarks from Visiongain
16.2 Recommendations for Market Players
List of Tables
Table 1 Optical Coating Market Snapshot, 2023 & 2033 (US$ million, CAGR %)
Table 2 Global Optical Coating Market Forecast, 2023-2033 (US$ Mn, AGR (%), CAGR (%)) (V-Shaped Recovery Scenario)
Table 3 Global Optical Coating Market by Region, 2023-2033 (US$ Mn, AGR (%), CAGR (%)) (V-Shaped Recovery Scenario)
Table 4 Global Optical Coating Market Forecast, 2023-2033 (US$ Mn, AGR (%), CAGR (%)) (W-Shaped Recovery Scenario)
Table 5 Global Optical Coating Market by Region, 2023-2033 (US$ Mn, AGR (%), CAGR (%)) (W-Shaped Recovery Scenario)
Table 6 Global Optical Coating Market Forecast, 2023-2033 (US$ Mn, AGR (%), CAGR (%)) (U-Shaped Recovery Scenario)
Table 7 Global Optical Coating Market by Region, 2023-2033 (US$ Mn, AGR (%), CAGR (%)) (U-Shaped Recovery Scenario)
Table 8 Global Optical Coating Market Forecast, 2023-2033 (US$ Mn, AGR (%), CAGR (%)) (L-Shaped Recovery Scenario)
Table 9 Global Optical Coating Market by Region, 2023-2033 (US$ Mn, AGR (%), CAGR (%)) (L-Shaped Recovery Scenario)
Table 10 Global Optical Coating Market by Coating Materials, 2023-2033 (US$ Mn, AGR (%), CAGR (%))
Table 11 Metallic Materials Market by Region, 2023-2033 (US$ Mn, AGR (%), CAGR (%))
Table 12 Dielectric Materials Market by Region, 2023-2033 (US$ Mn, AGR (%), CAGR (%))
Table 13 Global Optical Coating Market by Filter Coating, 2023-2033 (US$ Mn, AGR (%), CAGR (%))
Table 14 Short-Pass Market by Region, 2023-2033 (US$ Mn, AGR (%), CAGR (%))
Table 15 Long-Pass Market by Region, 2023-2033 (US$ Mn, AGR (%), CAGR (%))
Table 16 Other Filter Coating Market by Region, 2023-2033 (US$ Mn, AGR (%), CAGR (%))
Table 17 Global Optical Coating Market by Coating Method, 2023-2033 (US$ Mn, AGR (%), CAGR (%))
Table 18 Vacuum Deposition Market by Region, 2023-2033 (US$ Mn, AGR (%), CAGR (%))
Table 19 E-Beam Evaporation Market by Region, 2023-2033 (US$ Mn, AGR (%), CAGR (%))
Table 20 Sputtering Process Market by Region, 2023-2033 (US$ Mn, AGR (%), CAGR (%))
Table 21 Ion-Assisted Deposition (IAD) Market by Region, 2023-2033 (US$ Mn, AGR (%), CAGR (%))
Table 22 Global Optical Coating Market by End-Use Industry, 2023-2033 (US$ Mn, AGR (%), CAGR (%))
Table 23 Electronics & Semiconductor Market by Region, 2023-2033 (US$ Mn, AGR (%), CAGR (%))
Table 24 Aerospace and Defence Market by Region, 2023-2033 (US$ Mn, AGR (%), CAGR (%))
Table 25 Automotive Industry Market by Region, 2023-2033 (US$ Mn, AGR (%), CAGR (%))
Table 26 Solar Power Industry Market by Region, 2023-2033 (US$ Mn, AGR (%), CAGR (%))
Table 27 Other Industry Market by Region, 2023-2033 (US$ Mn, AGR (%), CAGR (%))
Table 28 Global Optical Coating Market by Type, 2023-2033 (US$ Mn, AGR (%), CAGR (%))
Table 29 Anti-reflective Coatings Market by Region, 2023-2033 (US$ Mn, AGR (%), CAGR (%))
Table 30 High Reflection Coating Market by Region, 2023-2033 (US$ Mn, AGR (%), CAGR (%))
Table 31 Beam Splitter Coating Market by Region, 2023-2033 (US$ Mn, AGR (%), CAGR (%))
Table 32 Transparent Conductive Coating Market by Region, 2023-2033 (US$ Mn, AGR (%), CAGR (%))
Table 33 Filter Coating Market by Region, 2023-2033 (US$ Mn, AGR (%), CAGR (%))
Table 34 Other Type Market by Region, 2023-2033 (US$ Mn, AGR (%), CAGR (%))
Table 35 Global Optical Coating Market Forecast, 2023-2033 (US$ Mn, AGR (%), CAGR (%))
Table 36 Global Optical Coating Market by Region, 2023-2033 (US$ Mn, AGR (%), CAGR (%))
Table 37 Global Optical Coating Market by Coating Materials, 2023-2033 (US$ Mn, AGR (%), CAGR (%))
Table 38 Global Optical Coating Market by Filter Coating, 2023-2033 (US$ Mn, AGR (%), CAGR (%))
Table 39 Global Optical Coating Market by Coating Method, 2023-2033 (US$ Mn, AGR (%), CAGR (%))
Table 40 Global Optical Coating Market by End-Use Industry, 2023-2033 (US$ Mn, AGR (%), CAGR (%))
Table 41 Global Optical Coating Market by Type, 2023-2033 (US$ Mn, AGR (%), CAGR (%))
Table 42 North America Optical Coating Market by Value, 2023-2033 (US$ Mn, AGR (%), CAGR (%))
Table 43 North America Optical Coating Market by Country, 2023-2033 (US$ Mn, AGR (%), CAGR (%))
Table 44 North America Optical Coating Market by Coating Materials, 2023-2033 (US$ Mn, AGR (%), CAGR (%))
Table 45 North America Optical Coating Market by Filter Coating, 2023-2033 (US$ Mn, AGR (%), CAGR (%))
Table 46 North America Optical Coating Market by Coating Method, 2023-2033 (US$ Mn, AGR (%), CAGR (%))
Table 47 North America Optical Coating Market by End-Use Industry, 2023-2033 (US$ Mn, AGR (%), CAGR (%))
Table 48 North America Optical Coating Market by Type, 2023-2033 (US$ Mn, AGR (%), CAGR (%))
Table 49 North America Aerospace and Defence Optical Coating Market by Application, 2023-2033 (US$ Mn, AGR (%), CAGR (%))
Table 50 US Optical Coating Market by Value, 2023-2033 (US$ Mn, AGR (%), CAGR (%))
Table 51 Canada Optical Coating Market by Value, 2023-2033 (US$ Mn, AGR (%), CAGR (%))
Table 52 Europe Optical Coating Market by Value, 2023-2033 (US$ Mn, AGR (%), CAGR (%))
Table 53 Europe Optical Coating Market by Country, 2023-2033 (US$ Mn, AGR (%), CAGR (%))
Table 54 Europe Optical Coating Market by Coating Materials, 2023-2033 (US$ Mn, AGR (%), CAGR (%))
Table 55 Europe Optical Coating Market by Filter Coating, 2023-2033 (US$ Mn, AGR (%), CAGR (%))
Table 56 Europe Optical Coating Market by Coating Method, 2023-2033 (US$ Mn, AGR (%), CAGR (%))
Table 57 Europe Optical Coating Market by End-Use Industry, 2023-2033 (US$ Mn, AGR (%), CAGR (%))
Table 58 Europe Optical Coating Market by Type, 2023-2033 (US$ Mn, AGR (%), CAGR (%))
Table 59 Europe Aerospace and Defence Optical Coating Market by Application, 2023-2033 (US$ Mn, AGR (%), CAGR (%))
Table 60 Germany Optical Coating Market by Value, 2023-2033 (US$ Mn, AGR (%), CAGR (%))
Table 61 UK Optical Coating Market by Value, 2023-2033 (US$ Mn, AGR (%), CAGR (%))
Table 62 France Optical Coating Market by Value, 2023-2033 (US$ Mn, AGR (%), CAGR (%))
Table 63 Italy Optical Coating Market by Value, 2023-2033 (US$ Mn, AGR (%), CAGR (%))
Table 64 Russia Optical Coating Market by Value, 2023-2033 (US$ Mn, AGR (%), CAGR (%))
Table 65 Rest of Europe Optical Coating Market by Value, 2023-2033 (US$ Mn, AGR (%), CAGR (%))
Table 66 Asia-Pacific Optical Coating Market by Value, 2023-2033 (US$ Mn, AGR (%), CAGR (%))
Table 67 Asia-Pacific Optical Coating Market by Country, 2023-2033 (US$ Mn, AGR (%), CAGR (%))
Table 68 Asia-Pacific Optical Coating Market by Coating Materials, 2023-2033 (US$ Mn, AGR (%), CAGR (%))
Table 69 Asia-Pacific Optical Coating Market by Filter Coating, 2023-2033 (US$ Mn, AGR (%), CAGR (%))
Table 70 Asia-Pacific Optical Coating Market by Coating Method, 2023-2033 (US$ Mn, AGR (%), CAGR (%))
Table 71 Asia-Pacific Optical Coating Market by End-Use Industry, 2023-2033 (US$ Mn, AGR (%), CAGR (%))
Table 72 Asia-Pacific Optical Coating Market by Type, 2023-2033 (US$ Mn, AGR (%), CAGR (%))
Table 73 China Optical Coating Market by Value, 2023-2033 (US$ Mn, AGR (%), CAGR (%))
Table 74 India Optical Coating Market by Value, 2023-2033 (US$ Mn, AGR (%), CAGR (%))
Table 75 Japan Optical Coating Market by Value, 2023-2033 (US$ Mn, AGR (%), CAGR (%))
Table 76 South Korea Optical Coating Market by Value, 2023-2033 (US$ Mn, AGR (%), CAGR (%))
Table 77 Australia Optical Coating Market by Value, 2023-2033 (US$ Mn, AGR (%), CAGR (%))
Table 78 Rest of Asia-Pacific Optical Coating Market by Value, 2023-2033 (US$ Mn, AGR (%), CAGR (%))
Table 79 Middle East & Africa Optical Coating Market by Value, 2023-2033 (US$ Mn, AGR (%), CAGR (%))
Table 80 Middle East & Africa Optical Coating Market by Country, 2023-2033 (US$ Mn, AGR (%), CAGR (%))
Table 81 Middle East & Africa Optical Coating Market by Coating Materials, 2023-2033 (US$ Mn, AGR (%), CAGR (%))
Table 82 Middle East & Africa Optical Coating Market by Filter Coating, 2023-2033 (US$ Mn, AGR (%), CAGR (%))
Table 83 Middle East & Africa Optical Coating Market by Coating Method, 2023-2033 (US$ Mn, AGR (%), CAGR (%))
Table 84 Middle East & Africa Optical Coating Market by End-Use Industry, 2023-2033 (US$ Mn, AGR (%), CAGR (%))
Table 85 Middle East & Africa Optical Coating Market by Type, 2023-2033 (US$ Mn, AGR (%), CAGR (%))
Table 86 GCC Optical Coating Market by Value, 2023-2033 (US$ Mn, AGR (%), CAGR (%))
Table 87 South Africa Optical Coating Market by Value, 2023-2033 (US$ Mn, AGR (%), CAGR (%))
Table 88 Rest of Middle East & Africa Optical Coating Market by Value, 2023-2033 (US$ Mn, AGR (%), CAGR (%))
Table 89 Latin America Optical Coating Market by Value, 2023-2033 (US$ Mn, AGR (%), CAGR (%))
Table 90 Latin America Optical Coating Market by Country, 2023-2033 (US$ Mn, AGR (%), CAGR (%))
Table 91 Latin America Optical Coating Market by Coating Materials, 2023-2033 (US$ Mn, AGR (%), CAGR (%))
Table 92 Latin America Optical Coating Market by Filter Coating, 2023-2033 (US$ Mn, AGR (%), CAGR (%))
Table 93 Latin America Optical Coating Market by Coating Method, 2023-2033 (US$ Mn, AGR (%), CAGR (%))
Table 94 Latin America Optical Coating Market by End-Use Industry, 2023-2033 (US$ Mn, AGR (%), CAGR (%))
Table 95 Latin America Optical Coating Market by Type, 2023-2033 (US$ Mn, AGR (%), CAGR (%))
Table 96 Brazil Optical Coating Market by Value, 2023-2033 (US$ Mn, AGR (%), CAGR (%))
Table 97 Mexico Optical Coating Market by Value, 2023-2033 (US$ Mn, AGR (%), CAGR (%))
Table 98 Rest of Latin America Optical Coating Market by Value, 2023-2033 (US$ Mn, AGR (%), CAGR (%))
Table 99 Acquisitions as Key Business Strategy
Table 100 Partnership as Key Business Strategy
Table 101 Acquisitions as Key Business Strategy
Table 102 Expansion as Key Business Strategy
Table 103 PPG Industries, Inc: Key Details, (CEO, HQ, Revenue, Founded, No. of Employees, Company Type, Website, Business Segment)
Table 104 PPG Industries, Inc: Product Benchmarking
Table 105 Alluxa, Inc: Key Details, (CEO, HQ, Revenue, Founded, No. of Employees, Company Type, Website, Business Segment)
Table 106 Alluxa, Inc: Product Benchmarking
Table 107 Alluxa, Inc: Strategic Outlook
Table 108 Janos Technology LLC: Key Details, (CEO, HQ, Revenue, Founded, No. of Employees, Company Type, Website, Business Segment)
Table 109 Janos Technology LLC: Product Benchmarking
Table 110 Newport Corporation: Key Details, (CEO, HQ, Revenue, Founded, No. of Employees, Company Type, Website, Business Segment)
Table 111 Newport Corporation: Product Benchmarking
Table 112 Ophir Optronics Solutions, Inc.: Key Details, (CEO, HQ, Revenue, Founded, No. of Employees, Company Type, Website, Business Segment)
Table 113 Ophir Optronics Solutions, Inc.: Product Benchmarking
Table 114 Reynard Corporation: Key Details, (CEO, HQ, Revenue, Founded, No. of Employees, Company Type, Website, Business Segment)
Table 115 Reynard Corporation: Product Benchmarking
Table 116 Optical Coating Laboratory Inc. (OCLI): Key Details, (CEO, HQ, Revenue, Founded, No. of Employees, Company Type, Website, Business Segment)
Table 117 Optical Coating Laboratory Inc. (OCLI): Product Benchmarking
Table 118 Abrisa Technologies: Key Details, (CEO, HQ, Revenue, Founded, No. of Employees, Company Type, Website, Business Segment)
Table 119 Abrisa Technologies: Product Benchmarking
Table 120 Delta Optical Thin Film A/S information: Key Details, (CEO, HQ, Revenue, Founded, No. of Employees, Company Type, Website, Business Segment)
Table 121 Delta Optical Thin Film A/S information: Product Benchmarking
Table 122 Delta Optical Thin Film A/S information: Strategic Outlook
Table 123 Evaporated Coatings Inc.: Key Details, (CEO, HQ, Revenue, Founded, No. of Employees, Company Type, Website, Business Segment)
Table 124 Evaporated Coatings Inc.: Product Benchmarking
Table 125 Evaporated Coatings Inc.: Strategic Outlook
Table 126 Optical Filter Source LLC: Key Details, (CEO, HQ, Revenue, Founded, No. of Employees, Company Type, Website, Business Segment)
Table 127 Optical Filter Source LLC: Product Benchmarking
Table 128 Edmund Optics: Key Details, (CEO, HQ, Revenue, Founded, No. of Employees, Company Type, Website, Business Segment)
Table 129 Edmund Optics: Product Benchmarking
Table 130 Edmund Optics: Strategic Outlook
Table 131 ZEISS Group: Key Details, (CEO, HQ, Revenue, Founded, No. of Employees, Company Type, Website, Business Segment)
Table 132 ZEISS Group: Product Benchmarking
Table 133 JDS Uniphase Corporation: Key Details, (CEO, HQ, Revenue, Founded, No. of Employees, Company Type, Website, Business Segment)
Table 134 JDS Uniphase Corporation: Product Benchmarking
Table 135 Denton Vacuum LLC: Key Details, (CEO, HQ, Revenue, Founded, No. of Employees, Company Type, Website, Business Segment)
Table 136 Denton Vacuum LLC: Product Benchmarking
Table 137 Denton Vacuum LLC: Strategic Outlook
List of Figures
Figure 1 Optical Coating Market Segmentation
Figure 2 Optical Coating Market by Coating Material: Market Attractiveness Index
Figure 3 Optical Coating Market by Filter Coating: Market Attractiveness Index
Figure 4 Optical Coating Market by Coating Method: Market Attractiveness Index
Figure 5 Optical Coating Market by End-Use: Market Attractiveness Index
Figure 6 Optical Coating Market by Type: Market Attractiveness Index
Figure 7 Optical Coating Market Attractiveness Index by Region
Figure 8 Optical Coating Market: Market Dynamics
Figure 9 COVID Impact Analysis: Optical Coating Market Recovery Scenarios
Figure 10 Global Optical Coating Market Forecast, 2023-2033 (US$ Mn, AGR (%)) (V-Shaped Recovery Scenario)
Figure 11 Global Optical Coating Market by Region, 2023-2033 (US$ Mn, AGR (%)) (V-Shaped Recovery Scenario)
Figure 12 Global Optical Coating Market Forecast, 2023-2033 (US$ Mn, AGR (%)) (W-Shaped Recovery Scenario)
Figure 13 Global Optical Coating Market by Region, 2023-2033 (US$ Mn, AGR (%)) (W-Shaped Recovery Scenario)
Figure 14 Global Optical Coating Market Forecast, 2023-2033 (US$ Mn, AGR (%)) (U-Shaped Recovery Scenario)
Figure 15 Global Optical Coating Market by Region, 2023-2033 (US$ Mn, AGR (%)) (U-Shaped Recovery Scenario)
Figure 16 Global Optical Coating Market Forecast, 2023-2033 (US$ Mn, AGR (%)) (L-Shaped Recovery Scenario)
Figure 17 Global Optical Coating Market by Region, 2023-2033 (US$ Mn, AGR (%)) (L-Shaped Recovery Scenario)
Figure 18 Optical Coating Market: Porter’s Five Forces Analysis
Figure 19 Optical Coating Market: PEST Analysis
Figure 20 Optical Coating Market by Coating Material: Market Attractiveness Index
Figure 21 Global Optical Coating Market by Coating Materials, 2023-2033 (US$ Mn, AGR (%))
Figure 22 Metallic Materials Market by Region, 2023-2033 (US$ Mn, AGR (%))
Figure 23 Coating Material Market Share Forecast by Region, 2023 & 2033 (%)
Figure 24 Dielectric Materials Market by Region, 2023-2033 (US$ Mn, AGR (%))
Figure 25 Coating Material Market Share Forecast by Region, 2023 & 2033 (%)
Figure 26 Optical Coating Market by Filter Coating: Market Attractiveness Index
Figure 27 Global Optical Coating Market by Filter Coating, 2023-2033 (US$ Mn, AGR (%))
Figure 28 Short-Pass Market by Region, 2023-2033 (US$ Mn, AGR (%))
Figure 29 Filter Coating Market Share Forecast by Region, 2023 & 2033 (%)
Figure 30 Long-Pass Market by Region, 2023-2033 (US$ Mn, AGR (%))
Figure 31 Filter Coating Market Share Forecast by Region, 2023 & 2033 (%)
Figure 32 Other Filter Coating Market by Region, 2023-2033 (US$ Mn, AGR (%))
Figure 33 Filter Coating Market Share Forecast by Region, 2023 & 2033 (%)
Figure 34 Optical Coating Market by Coating Method: Market Attractiveness Index
Figure 35 Global Optical Coating Market by Coating Method, 2023-2033 (US$ Mn, AGR (%))
Figure 36 Vacuum Deposition Market by Region, 2023-2033 (US$ Mn, AGR (%))
Figure 37 Coating Method Market Share Forecast by Region, 2023 & 2033 (%)
Figure 38 E-Beam Evaporation Market by Region, 2023-2033 (US$ Mn, AGR (%))
Figure 39 Coating Method Market Share Forecast by Region, 2023 & 2033 (%)
Figure 40 Sputtering Process Market by Region, 2023-2033 (US$ Mn, AGR (%))
Figure 41 Coating Method Market Share Forecast by Region, 2023 & 2033 (%)
Figure 42 Ion-Assisted Deposition (IAD) Market by Region, 2023-2033 (US$ Mn, AGR (%))
Figure 43 Coating Method Market Share Forecast by Region, 2023 & 2033 (%)
Figure 44 Optical Coating Market by End-Use: Market Attractiveness Index
Figure 45 Global Optical Coating Market by End-Use Industry, 2023-2033 (US$ Mn, AGR (%))
Figure 46 Electronics & Semiconductor Market by Region, 2023-2033 (US$ Mn, AGR (%))
Figure 47 End-Use Market Share Forecast by Region, 2023 & 2033 (%)
Figure 48 Aerospace and Defence Market by Region, 2023-2033 (US$ Mn, AGR (%))
Figure 49 End-Use Market Share Forecast by Region, 2023 & 2033 (%)
Figure 50 Automotive Industry Market by Region, 2023-2033 (US$ Mn, AGR (%))
Figure 51 End-Use Market Share Forecast by Region, 2023 & 2033 (%)
Figure 52 Solar Power Industry Market by Region, 2023-2033 (US$ Mn, AGR (%))
Figure 53 End-Use Market Share Forecast by Region, 2023 & 2033 (%)
Figure 54 Other Industry Market by Region, 2023-2033 (US$ Mn, AGR (%))
Figure 55 End-Use Market Share Forecast by Region, 2023 & 2033 (%)
Figure 56 Optical Coating Market by Type: Market Attractiveness Index
Figure 57 Global Optical Coating Market by Type, 2023-2033 (US$ Mn, AGR (%))
Figure 58 Anti-reflective Coatings Market by Region, 2023-2033 (US$ Mn, AGR (%))
Figure 59 Type Market Share Forecast by Region, 2023 & 2033 (%)
Figure 60 High Reflection Coating Market by Region, 2023-2033 (US$ Mn, AGR (%))
Figure 61 Type Market Share Forecast by Region, 2023 & 2033 (%)
Figure 62 Beam Splitter Coating Market by Region, 2023-2033 (US$ Mn, AGR (%))
Figure 63 Type Market Share Forecast by Region, 2023 & 2033 (%)
Figure 64 Transparent Conductive Coating Market by Region, 2023-2033 (US$ Mn, AGR (%))
Figure 65 Type Market Share Forecast by Region, 2023 & 2033 (%)
Figure 66 Filter Coating Market by Region, 2023-2033 (US$ Mn, AGR (%))
Figure 67 Type Market Share Forecast by Region, 2023 & 2033 (%)
Figure 68 Other Type Market by Region, 2023-2033 (US$ Mn, AGR (%))
Figure 69 Type Market Share Forecast by Region, 2023 & 2033 (%)
Figure 70 Global Optical Coating Market Forecast, 2023-2033 (US$ Mn, AGR (%))
Figure 71 Global Optical Coating Market by Region, 2023-2033 (US$ Mn, AGR (%))
Figure 72 Global Optical Coating Market by Coating Materials, 2023-2033 (US$ Mn, AGR (%))
Figure 73 Global Optical Coating Market by Filter Coating, 2023-2033 (US$ Mn, AGR (%))
Figure 74 Global Optical Coating Market by Coating Method, 2023-2033 (US$ Mn, AGR (%))
Figure 75 Global Optical Coating Market by End-Use Industry, 2023-2033 (US$ Mn, AGR (%))
Figure 76 Global Optical Coating Market by Type, 2023-2033 (US$ Mn, AGR (%))
Figure 77 North America Optical Coating Market Attractiveness Index
Figure 78 North America Optical Coating Market by Value, 2023-2033 (US$ Mn, AGR (%))
Figure 79 North America Optical Coating Market by Country, 2023-2033 (US$ Mn, AGR (%))
Figure 80 North America Optical Coating Market Share Forecast by Country, 2023-2033 (%)
Figure 81 North America Optical Coating Market by Coating Materials, 2023-2033 (US$ Mn, AGR (%))
Figure 82 North America Optical Coating Market Share Forecast by Coating Materials, 2023-2033 (%)
Figure 83 North America Optical Coating Market by Filter Coating, 2023-2033 (US$ Mn, AGR (%))
Figure 84 North America Optical Coating Market Share Forecast by Filter Coating, 2023-2033 (%)
Figure 85 North America Optical Coating Market by Coating Method, 2023-2033 (US$ Mn, AGR (%))
Figure 86 North America Optical Coating Market Share Forecast by Coating Method, 2023-2033 (%)
Figure 87 North America Optical Coating Market by End-Use Industry, 2023-2033 (US$ Mn, AGR (%))
Figure 88 North America Optical Coating Market Share Forecast by End-Use Industry, 2023-2033 (%)
Figure 89 North America Optical Coating Market by Type, 2023-2033 (US$ Mn, AGR (%))
Figure 90 North America Optical Coating Market Share Forecast by Type, 2023-2033 (%)
Figure 91 North America Aerospace and Defence Optical Coating Market by Application, 2023-2033 (US$ Mn, AGR (%))
Figure 92 US Optical Coating Market by Value, 2023-2033 (US$ Mn, AGR (%))
Figure 93 Canada Optical Coating Market by Value, 2023-2033 (US$ Mn, AGR (%))
Figure 94 Europe Optical Coating Market Attractiveness Index
Figure 95 Europe Optical Coating Market by Value, 2023-2033 (US$ Mn, AGR (%))
Figure 96 Europe Optical Coating Market by Country, 2023-2033 (US$ Mn, AGR (%))
Figure 97 Europe Optical Coating Market Share Forecast by Country, 2023-2033 (%)
Figure 98 Europe Optical Coating Market by Coating Materials, 2023-2033 (US$ Mn, AGR (%))
Figure 99 Europe Optical Coating Market Share Forecast by Coating Materials, 2023-2033 (%)
Figure 100 Europe Optical Coating Market by Filter Coating, 2023-2033 (US$ Mn, AGR (%))
Figure 101 Europe Optical Coating Market Share Forecast by Filter Coating, 2023-2033 (%)
Figure 102 Europe Optical Coating Market by Coating Method, 2023-2033 (US$ Mn, AGR (%))
Figure 103 Europe Optical Coating Market Share Forecast by Coating Method, 2023-2033 (%)
Figure 104 Europe Optical Coating Market by End-Use Industry, 2023-2033 (US$ Mn, AGR (%))
Figure 105 Europe Optical Coating Market Share Forecast by End-Use Industry, 2023-2033 (%)
Figure 106 Europe Optical Coating Market by Type, 2023-2033 (US$ Mn, AGR (%))
Figure 107 Europe Optical Coating Market Share Forecast by Type, 2023-2033 (%)
Figure 108 Europe Aerospace and Defence Optical Coating Market by Application, 2023-2033 (US$ Mn, AGR (%))
Figure 109 Germany Optical Coating Market by Value, 2023-2033 (US$ Mn, AGR (%))
Figure 110 UK Optical Coating Market by Value, 2023-2033 (US$ Mn, AGR (%))
Figure 111 France Optical Coating Market by Value, 2023-2033 (US$ Mn, AGR (%))
Figure 112 Italy Optical Coating Market by Value, 2023-2033 (US$ Mn, AGR (%))
Figure 113 Russia Optical Coating Market by Value, 2023-2033 (US$ Mn, AGR (%))
Figure 114 Rest of Europe Optical Coating Market by Value, 2023-2033 (US$ Mn, AGR (%))
Figure 115 Asia Pacific Optical Coating Market Attractiveness Index
Figure 116 Asia-Pacific Optical Coating Market by Value, 2023-2033 (US$ Mn, AGR (%))
Figure 117 Asia-Pacific Optical Coating Market by Country, 2023-2033 (US$ Mn, AGR (%))
Figure 118 Asia-Pacific Optical Coating Market Share Forecast by Country, 2023-2033 (%)
Figure 119 Asia-Pacific Optical Coating Market by Coating Materials, 2023-2033 (US$ Mn, AGR (%))
Figure 120 Asia-Pacific Optical Coating Market Share Forecast by Coating Materials, 2023-2033 (%)
Figure 121 Asia-Pacific Optical Coating Market by Filter Coating, 2023-2033 (US$ Mn, AGR (%))
Figure 122 Asia-Pacific Optical Coating Market Share Forecast by Filter Coating, 2023-2033 (%)
Figure 123 Asia-Pacific Optical Coating Market by Coating Method, 2023-2033 (US$ Mn, AGR (%))
Figure 124 Global Optical Coating Market Share Forecast by Coating Method, 2023-2033 (%)
Figure 125 Asia-Pacific Optical Coating Market by End-Use Industry, 2023-2033 (US$ Mn, AGR (%))
Figure 126 Asia-Pacific Optical Coating Market Share Forecast by End-Use Industry, 2023-2033 (%)
Figure 127 Asia-Pacific Optical Coating Market by Type, 2023-2033 (US$ Mn, AGR (%))
Figure 128 Asia-Pacific Optical Coating Market Share Forecast by Type, 2023-2033 (%)
Figure 129 China Optical Coating Market by Value, 2023-2033 (US$ Mn, AGR (%))
Figure 130 India Optical Coating Market by Value, 2023-2033 (US$ Mn, AGR (%))
Figure 131 Japan Optical Coating Market by Value, 2023-2033 (US$ Mn, AGR (%))
Figure 132 South Korea Optical Coating Market by Value, 2023-2033 (US$ Mn, AGR (%))
Figure 133 Australia Optical Coating Market by Value, 2023-2033 (US$ Mn, AGR (%))
Figure 134 Rest of Asia-Pacific Optical Coating Market by Value, 2023-2033 (US$ Mn, AGR (%))
Figure 135 Middle East & Africa Optical Coating Market Attractiveness Index
Figure 136 Middle East & Africa Optical Coating Market by Value, 2023-2033 (US$ Mn, AGR (%))
Figure 137 Middle East & Africa Optical Coating Market by Country, 2023-2033 (US$ Mn, AGR (%))
Figure 138 Middle East & Africa Optical Coating Market Share Forecast by Country, 2023-2033 (%)
Figure 139 Middle East & Africa Optical Coating Market by Coating Materials, 2023-2033 (US$ Mn, AGR (%))
Figure 140 Middle East & Africa Optical Coating Market Share Forecast by Coating Materials, 2023-2033 (%)
Figure 141 Middle East & Africa Optical Coating Market by Filter Coating, 2023-2033 (US$ Mn, AGR (%))
Figure 142 Middle East & Africa Optical Coating Market Share Forecast by Filter Coating, 2023-2033 (%)
Figure 143 Middle East & Africa Optical Coating Market by Coating Method, 2023-2033 (US$ Mn, AGR (%))
Figure 144 Middle East & Africa Optical Coating Market Share Forecast by Coating Method, 2023-2033 (%)
Figure 145 Middle East & Africa Optical Coating Market by End-Use Industry, 2023-2033 (US$ Mn, AGR (%))
Figure 146 Middle East & Africa Optical Coating Market Share Forecast by End-Use Industry, 2023-2033 (%)
Figure 147 Middle East & Africa Optical Coating Market by Type, 2023-2033 (US$ Mn, AGR (%))
Figure 148 Middle East & Africa Optical Coating Market Share Forecast by Type, 2023-2033 (%)
Figure 149 GCC Optical Coating Market by Value, 2023-2033 (US$ Mn, AGR (%))
Figure 150 South Africa Optical Coating Market by Value, 2023-2033 (US$ Mn, AGR))
Figure 151 Rest of Middle East & Africa Optical Coating Market by Value, 2023-2033 (US$ Mn, AGR (%))
Figure 152 Latin America Optical Coating Market Attractiveness Index
Figure 153 Latin America Optical Coating Market by Value, 2023-2033 (US$ Mn, AGR (%))
Figure 154 Latin America Optical Coating Market by Country, 2023-2033 (US$ Mn, AGR (%))
Figure 155 Latin America Optical Coating Market Share Forecast by Country, 2023-2033 (%)
Figure 156 Latin America Optical Coating Market by Coating Materials, 2023-2033 (US$ Mn, AGR (%))
Figure 157 Latin America Optical Coating Market Share Forecast by Coating Materials, 2023-2033 (%)
Figure 158 Latin America Optical Coating Market by Filter Coating, 2023-2033 (US$ Mn, AGR (%))
Figure 159 Latin America Optical Coating Market Share Forecast by Filter Coating, 2023-2033 (%)
Figure 160 Latin America Optical Coating Market by Coating Method, 2023-2033 (US$ Mn, AGR (%))
Figure 161 Latin America Optical Coating Market Share Forecast by Coating Method, 2023-2033 (%)
Figure 162 Latin America Optical Coating Market by End-Use Industry, 2023-2033 (US$ Mn, AGR (%))
Figure 163 Latin America Optical Coating Market Share Forecast by End-Use Industry, 2023-2033 (%)
Figure 164 Latin America Optical Coating Market by Type, 2023-2033 (US$ Mn, AGR (%))
Figure 165 Latin America Optical Coating Market Share Forecast by Type, 2023-2033 (%)
Figure 166 Brazil Optical Coating Market by Value, 2023-2033 (US$ Mn, AGR (%))
Figure 167 Mexico Optical Coating Market by Value, 2023-2033 (US$ Mn, AGR (%))
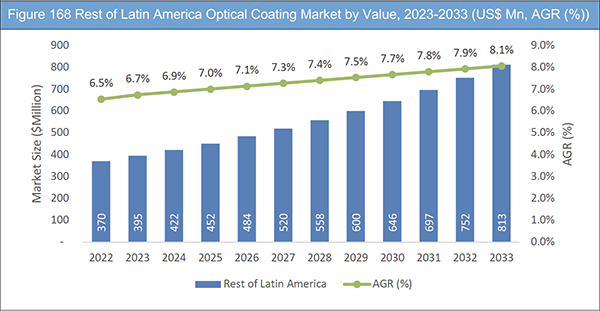
Figure 168 Rest of Latin America Optical Coating Market by Value, 2023-2033 (US$ Mn, AGR (%))
Figure 169 Optical Coating Market: Company Share/Ranking, 2022
Figure 170 PPG Industries, Inc: Net Revenue, 2018-2022 (US$ million, AGR%)
Figure 171 PPG Industries, Inc: R&D, 2018-2022 (US$ million, AGR%)
Figure 172 PPG Industries, Inc: Regional Revenue Shares, 2022 (%)
Figure 173 PPG Industries, Inc: Business Segment Revenue Shares, 2022 (%)
List of Companies Profiled in the report
Abrisa Technologies
Alluxa, Inc.
Delta Optical Thin Film A/S information
Denton Vacuum LLC
Edmund Optics
Evaporated Coatings Inc.
Janos Technology LLC
JDS Uniphase Corporation
Newport Corporation
Ophir Optronics Solutions, Inc.
Optical Coating Laboratory Inc. (OCLI)
Optical Filter Source LLC
PPG Industries, Inc.
Reynard Corporation
ZEISS Group
List of Other Companies Mentioned in the report
Hamamatsu Photonics K.K.
Heraeus Holding GmbH
Hoya Corporation
IDEX Health & Science LLC
II-VI Incorporated
Inficon Holding AG
Infrared Optical Coatings, Inc.
Inrad Optics
Janos Technology Inc.
JDS Uniphase Corporation
K&L Microwave Inc.
Knight Optical Ltd.
Konica Minolta, Inc.
Lasertec Corporation
Leica Microsystems GmbH
Lumentum Operations LLC
Materion Corporation
Meopta - optika, s.r.o.
MKS Instruments, Inc.
Newport Corporation
Nikon Corporation
Northrop Grumman Corporation
Oerlikon Balzers Coating USA Inc.
Optiforms Inc.
Optikos Corporation
OptiLayer GmbH
Optimum Optical Systems, Inc.
OptoSigma Corporation
Oxford Instruments plc
PPG Industries, Inc.
Precision Glass & Optics (PG&O)
Qioptiq Ltd.
R&D Optical Laboratory, Inc.
Raptor Photonics Ltd.
Reynard Corporation
Rigaku Corporation
Satisloh AG
Schott AG
SigOptics, Inc.
Spectrum Thin Films
Sydor Optics Inc.
Thorlabs, Inc.
ULVAC, Inc.
Umicore SA
VLOC Incorporated
Zygo Corporation
List of Associations Mentioned in the Report
American Coatings Association (ACA)
American Institute of Physics (AIP)
American Vacuum Society (AVS)
European Optical Society (EOS)
European Physical Society (EPS)
Institute of Physics (IOP)
International Association of Advanced Materials (IAAM)
International Association of Machinists and Aerospace Workers (IAMAW)
International Commission for Optics (ICO)
International Society for Optics and Photonics (SPIE)
Laser Institute of America (LIA)
Materials Research Society (MRS)
Optical Society of America (OSA)
Society for Applied Spectroscopy (SAS)
Society for Information Display (SID)
Society of Vacuum Coaters (SVC)
The Optical Society of Japan (OSJ)