The Point of Care Diagnostics Market Report 2023-2033: This report will prove invaluable to leading firms striving for new revenue pockets if they wish to better understand the industry and its underlying dynamics. It will be useful for companies that would like to expand into different industries or to expand their existing operations in a new region.
Increasing Incidence of Target Conditions and Rising Number of CLIA Waived POC Tests Are Driving the Market Growth
Target conditions for POC testing are illnesses or disorders that require ongoing monitoring, such as diabetes, hemophilia, cancer, and cardiac problems. The adoption of POC testing equipment can therefore be attributed in large part to the rising incidence and prevalence of these illnesses. Diabetes is a serious, chronic disorder that can significantly affect people’s lives, wellbeing, and families all around the world. According to IDF, in 2021, there were 537 million diabetics worldwide between the ages of 20 and 79.
CLIA defines waived tests as straightforward laboratory investigations and procedures with a very low chance of producing an erroneous result. In addition to approving manufacturer petitions for test system waivers, the Food and Drug Administration (FDA) determines what standards testing must follow in terms of being simple and error prone. The Binx health io CT/NG test, a molecular platform used to detect STDs such as chlamydia and gonorrhea at the point of treatment, acquired a CLIA waiver from the US FDA in April 2021, according to a statement released at the time
Stringent and Time-Consuming Regulatory Policies Likely to Challenge Market Growth
The complicated FDA regulations and CLIA laboratory standards present manufacturers with some regulatory challenges despite the rising demand for POC equipment (for the premarket approval of POC testing kits). Manufacturers must provide performance data to the FDA for any new POC equipment to be approved in the United States. This should show that people and healthcare professionals can use these tools and get outcomes that are comparable to those of clinical laboratory tests. For in vitro diagnostic (IVD) equipment as opposed to non-IVD ones, the amount of examination is also rather exceptional. For instance, the FDA typically waits until the intended application, conditions for usage, target patient demographic, and test performance characteristics remain intact before re-examining approved prescription non-IVD devices for use in new situations. Though under this rule POC devices are not covered.
What Questions Should You Ask before Buying a Market Research Report?
• How is the point of care diagnostics market evolving?
• What is driving and restraining the point of care diagnostics market?
• How will each point of care diagnostic submarket segment grow over the forecast period and how much revenue will these submarkets account for in 2033?
• How will the market shares for each point of care diagnostics submarket develop from 2023 to 2033?
• What will be the main driver for the overall market from 2023 to 2033?
• Will leading point of care diagnostics markets broadly follow the macroeconomic dynamics, or will individual national markets outperform others?
• How will the market shares of the national markets change by 2033 and which geographical region will lead the market in 2033?
• Who are the leading players and what are their prospects over the forecast period?
• What are the point of care diagnostics projects for these leading companies?
• How will the industry evolve during the period between 2023 and 2033? What are the implications of point of care diagnostics projects taking place now and over the next 10 years?
• Is there a greater need for product commercialisation to further scale the point of care diagnostics market?
• Where is the point of care diagnostics market heading and how can you ensure you are at the forefront of the market?
• What are the best investment options for new product and service lines?
• What are the key prospects for moving companies into a new growth path and C-suite?
You need to discover how this will impact the point of care diagnostics market today, and over the next 10 years:
• Our 352-page report provides 158 tables, 225 charts/graphs exclusively to you.
• The report highlights key lucrative areas in the industry so you can target them – NOW.
• It contains in-depth analysis of global, regional and national sales and growth.
• It highlights for you the key successful trends, changes and revenue projections made by your competitors.
This report tells you TODAY how the point of care diagnostics market will develop in the next 10 years, and in line with the variations in COVID-19 economic recession and bounce. This market is more critical now than at any point over the last 10 years.
Forecasts to 2033 and other analyses reveal commercial prospects
• In addition to revenue forecasting to 2033, our new study provides you with recent results, growth rates, and market shares.
• You will find original analyses, with business outlooks and developments.
• Discover qualitative analyses (including market dynamics, drivers, opportunities, restraints and challenges), cost structure, impact of rising point of care diagnostics prices and recent developments.
This report includes data analysis and invaluable insight into how COVID-19 will affect the industry and your company. Four COVID-19 recovery patterns and their impact, namely, “V”, “L”, “W” and “U” are discussed in this report.
Segments Covered in the Report
Product
• Glucose Monitoring
• Cardiometabolic Monitoring
• Infectious Disease Testing
• Coagulation Monitoring
• Pregnancy & Fertility Testing
• Tumor/Cancer Marker Testing
• Urinalysis Testing
• Cholesterol Testing
• Hematology Testing
• Drugs-of-abuse Testing
• Fecal Occult Testing
• Other POC Products
Mode
• Prescription-based
• OTC
Sample
• Blood
• Nasal and Oropharyngeal Swabs
• Urine
• Other
Platform
• Lateral Flow Assay
• Dipstick
• Microfluidics
• Molecular diagnostics
• Immunoassay
End User
• Clinics
• Hospitals
• Home Care Setting
• Others

In addition to the revenue predictions for the overall world market and segments, you will also find revenue forecasts for five regional and 18 leading national markets:
North America
• U.S.
• Canada
Europe
• Germany
• UK
• France
• Italy
• Spain
• Netherlands
• Rest of Europe
Asia Pacific
• China
• Japan
• India
• Australia
• South Korea
• Rest of Asia Pacific
Latin America
• Brazil
• Mexico
• Rest of Latin America
MEA
• GCC
• South Africa
• Rest of MEA
Need industry data? Please contact us today.
The report also includes profiles and for some of the leading companies in the Point of Care Diagnostics Market, 2023 to 2033, with a focus on this segment of these companies’ operations.
Leading companies and the potential for market growth
• Abbott
• AccuBioTech Co., Ltd
• BD
• bioMerieux SA
• Chembio Diagnostics, Inc.
• Danaher
• EKF Diagnostics
• F. Hoffmann-La Roche Ltd
• Fluxergy
• LumiraDx
• Meridian Bioscience
• Nipro Europe Group Companies
• Nova Biomedical
• Orasure Technologies, Inc.
• PTS Diagnostics
• Qiagen
• Quidel Corporation
• Response Biomedical
• Sekisui Diagnostics
• Siemens Healthcare GmbH
• Spectral Medical Inc.
• Thermo Fisher Scientific Inc.
• Trinity Biotech Ireland
• Trividia Health, Inc.
• Werfen
Overall world revenue for Point of Care Diagnostics Market, 2023 to 2033 in terms of value the market will surpass US$43 billion in 2023, our work calculates. We predict strong revenue growth through to 2033. Our work identifies which organizations hold the greatest potential. Discover their capabilities, progress, and commercial prospects, helping you stay ahead.
How will the Point of care diagnostics Market, 2023 to 2033 report help you?
In summary, our 350+ page report provides you with the following knowledge:
• Revenue forecasts to 2033 for Point of Care Diagnostics Market, 2023 to 2033 Market, with forecasts for product, mode, sample, platform, end user, each forecast at a global and regional level – discover the industry’s prospects, finding the most lucrative places for investments and revenues.
• Revenue forecasts to 2033 for five regional and 18 key national markets – See forecasts for the Point of Care Diagnostics Market, 2023 to 2033 market in North America, Europe, Asia-Pacific, Latin America, and MEA. Also forecasted is the market in the US, Canada, Mexico, Brazil, Germany, France, UK, Italy, Spain, Netherlands, China, India, Japan, Australia, South Korea, Brazil, GCC, and South Africa among other prominent economies.
• Prospects for established firms and those seeking to enter the market – including company profiles for 25 of the major companies involved in the Point of Care Diagnostics Market, 2023 to 2033.
Find quantitative and qualitative analyses with independent predictions. Receive information that only our report contains, staying informed with invaluable business intelligence.
Information found nowhere else
With our new report, you are less likely to fall behind in knowledge or miss out on opportunities. See how our work could benefit your research, analyses, and decisions. Visiongain’s study is for everybody needing commercial analyses for the Point of Care Diagnostics Market, 2023 to 2033, market-leading companies. You will find data, trends and predictions.
To access the data contained in this document please email contactus@visiongain.com
Buy our report today Point of Care Diagnostics Market Report 2023-2033: Forecasts by Product (Glucose Monitoring, Cardiometabolic Monitoring, Infectious Disease Testing, Coagulation Monitoring, Pregnancy & Fertility Testing, Tumor/Cancer Marker Testing, Urinalysis Testing, Cholesterol Testing, Hematology Testing, Drugs-of-abuse Testing, Fecal Occult Testing, Other), by Mode (Prescription-based, OTC), by Sample (Blood, Nasal and Oropharyngeal Swabs, Urine, Other), by Platform (Lateral Flow Assay, Dipstick, Microfluidics, Molecular Diagnostics, Immunoassay), by End-user (Clinics, Hospitals, Home Care Setting, Other) AND Regional and Leading National Market Analysis PLUS Analysis of Leading Companies AND COVID-19 Impact and Recovery Pattern Analysis. Avoid missing out by staying informed – order our report now.
Visiongain is a trading partner with the US Federal Government
CCR Ref number: KD4R6
Do you have any custom requirements we can help you with? Any need for a specific country, geo region, market segment or specific company information? Contact us today, we can discuss your needs and see how we can help: contactus@visiongain.com
1. Report Overview
1.1 Objectives of the Study
1.2 Introduction to Point of Care Diagnostics Market
1.3 What This Report Delivers
1.4 Why You Should Read This Report
1.5 Key Questions Answered by This Analytical Report
1.6 Who is This Report for?
1.7 Methodology
1.7.1 Market Definitions
1.7.2 Market Evaluation & Forecasting Methodology
1.7.3 Data Validation
1.7.3.1 Primary Research
1.7.3.2 Secondary Research
1.8 Frequently Asked Questions (FAQs)
1.9 Associated Visiongain Reports
1.10 About Visiongain
2 Executive Summary
3 Market Overview
3.1 Key Findings
3.2 Market Dynamics
3.2.1 Market Driving Factors
3.2.1.1 High Prevalence of Infectious Diseases Across the Globe
3.2.1.2 Increasing Incidence of Target Conditions
3.2.1.3 Growing Government Support
3.2.1.4 Rising Number of CLIA Waived POC Tests
3.2.2 Market Restraining Factors
3.2.2.1 Pricing Pressure Owing to Reimbursement Cuts and Budget Constraints
3.2.2.2 Stringent and Time-Consuming Regulatory Policies
3.2.3 Market Opportunities
3.2.3.1 POC Tests with Multiplexing Capabilities
3.2.3.2 Healthcare Decentralization – Converting Lab Tests to POC Tests
3.3 COVID-19 Impact Analysis
3.4 Porter’s Five Forces Analysis
3.4.1 Low Bargaining Power of Supplier
3.4.2 High Bargaining Power of Buyer
3.4.3 Low Threat of New Entrants
3.4.4 High Threat of Substitutes
3.4.5 High Intensity of Competitive Rivalry
3.5 PEST Analysis
3.6 SWOT Analysis
4 Point of Care Diagnostics Market, by Product, 2023-2033
4.1 Key Findings
4.2 Product Segment: Market Attractiveness Index
4.3 Point of Care Diagnostics Market Size Estimation and Forecast by Product
4.4 Glucose Monitoring
4.4.1 Market Size by Region, 2023-2033 (US$ bn)
4.4.2 Market Share by Region, 2023 & 2033 (%)
4.5 Cardiometabolic Monitoring
4.5.1 Market Size by Region, 2023-2033 (US$ bn)
4.5.2 Market Share by Region, 2023 & 2033 (%)
4.6 Infectious Disease Testing
4.6.1 Market Size by Region, 2023-2033 (US$ bn)
4.6.2 Market Share by Region, 2023 & 2033 (%)
4.7 Coagulation Monitoring
4.7.1 Market Size by Region, 2023-2033 (US$ bn)
4.7.2 Market Share by Region, 2023 & 2033 (%)
4.8 Pregnancy & Fertility Testing
4.8.1 Market Size by Region, 2023-2033 (US$ bn)
4.8.2 Market Share by Region, 2023 & 2033 (%)
4.9 Tumour/Cancer Marker Testing
4.9.1 Market Size by Region, 2023-2033 (US$ bn)
4.9.2 Market Share by Region, 2023 & 2033 (%)
4.10 Urinalysis Testing
4.10.1 Market Size by Region, 2023-2033 (US$ bn)
4.10.2 Market Share by Region, 2023 & 2033 (%)
4.11 Cholesterol Testing
4.11.1 Market Size by Region, 2023-2033 (US$ bn)
4.11.2 Market Share by Region, 2023 & 2033 (%)
4.12 Hematology Testing
4.12.1 Market Size by Region, 2023-2033 (US$ bn)
4.12.2 Market Share by Region, 2023 & 2033 (%)
4.13 Drugs-of-abuse Testing
4.13.1 Market Size by Region, 2023-2033 (US$ bn)
4.13.2 Market Share by Region, 2023 & 2033 (%)
4.14 Fecal Occult Testing
4.14.1 Market Size by Region, 2023-2033 (US$ bn)
4.14.2 Market Share by Region, 2023 & 2033 (%)
4.15 Other POC Products
4.15.1 Market Size by Region, 2023-2033 (US$ bn)
4.15.2 Market Share by Region, 2023 & 2033 (%)
5 Point of Care Diagnostics Market, by Mode, 2023-2033
5.1 Key Findings
5.2 Mode Segment: Market Attractiveness Index
5.3 Point of Care Diagnostics Market, by Mode
5.4 Prescription-based Products
5.4.1 Market Size by Region, 2023-2033 (US$ bn)
5.4.2 Market Share by Region, 2023 & 2033 (%)
5.5 Over the Counter (OTC) Products
5.5.1 Market Size by Region, 2023-2033 (US$ bn)
5.5.2 Market Share by Region, 2023 & 2033 (%)
6 Point of Care Diagnostics Market, by Sample, 2023-2033
6.1 Key Findings
6.2 Sample Segment: Market Attractiveness Index
6.3 Point of Care Diagnostics Market Size Estimation and Forecast by Sample
6.4 Blood
6.4.1 Market Size by Region, 2023-2033 (US$ bn)
6.4.2 Market Share by Region, 2023 & 2033 (%)
6.5 Nasal and Oropharyngeal Swabs
6.5.1 Market Size by Region, 2023-2033 (US$ bn)
6.5.2 Market Share by Region, 2023 & 2033 (%)
6.6 Urine
6.6.1 Market Size by Region, 2023-2033 (US$ bn)
6.6.2 Market Share by Region, 2023 & 2033 (%)
6.7 Other
6.7.1 Market Size by Region, 2023-2033 (US$ bn)
6.7.2 Market Share by Region, 2023 & 2033 (%)
7 Point of Care Diagnostics Market, by Platform, 2023-2033
7.1 Key Findings
7.2 Platform Segment: Market Attractiveness Index
7.3 Point of Care Diagnostics Market Size Estimation and Forecast by Platform
7.4 Lateral Flow Assay
7.4.1 Market Size by Region, 2023-2033 (US$ bn)
7.4.2 Market Share by Region, 2023 & 2033 (%)
7.5 Dipstick
7.5.1 Market Size by Region, 2023-2033 (US$ bn)
7.5.2 Market Share by Region, 2023 & 2033 (%)
7.6 Microfluidics
7.6.1 Market Size by Region, 2023-2033 (US$ bn)
7.6.2 Market Share by Region, 2023 & 2033 (%)
7.7 Molecular diagnostics
7.7.1 Market Size by Region, 2023-2033 (US$ bn)
7.7.2 Market Share by Region, 2023 & 2033 (%)
7.8 Immunoassay
7.8.1 Market Size by Region, 2023-2033 (US$ bn)
7.8.2 Market Share by Region, 2023 & 2033 (%)
8 Point of Care Diagnostics Market, by End User, 2023-2033
8.1 Key Findings
8.2 End User Segment Market Attractiveness Index
8.3 Point of Care Diagnostics Market Size Estimation and Forecast by End User
8.4 Clinics
8.4.1 Market Size by Region, 2023-2033 (US$ bn)
8.4.2 Market Share by Region, 2023 & 2033 (%)
8.5 Hospitals
8.5.1 Market Size by Region, 2023-2033 (US$ bn)
8.5.2 Market Share by Region, 2023 & 2033 (%)
8.6 Home Care Settings
8.6.1 Market Size by Region, 2023-2033 (US$ bn)
8.6.2 Market Share by Region, 2023 & 2033 (%)
8.7 Other End-users
8.7.1 Market Size by Region, 2023-2033 (US$ bn)
8.7.2 Market Share by Region, 2023 & 2033 (%)
9 Point of Care Diagnostics Market Analysis by Region, 2023-2033
9.1 Key Findings
9.2 Regional Market Size Estimation and Forecast
10 North America Point of Care Diagnostics Market, 2023-2033
10.1 Key Findings
10.2 North America Point of Care Diagnostics Market Attractiveness Index
10.3 North America Point of Care Diagnostics Market by Country, 2023, 2028 & 2033 (US$ bn)
10.4 North America Point of Care Diagnostics Market Forecast by Product
10.5 North America Point of Care Diagnostics Market Forecast by Mode
10.6 North America Point of Care Diagnostics Market Size Estimation and Forecast by Sample
10.7 North America Point of Care Diagnostics Market Size Estimation and Forecast by Platform
10.8 North America Point of Care Diagnostics Market Size Estimation and Forecast by End Users
10.9 North America Point of Care Diagnostics Market Forecast by Country
10.10 U.S. Point of Care Diagnostics Market Analysis
10.11 Canada Point of Care Diagnostics Market Analysis
11 Europe Point of Care Diagnostics Market, 2023-2033
11.1 Key Findings
11.2 Europe Point of Care Diagnostics Market Attractiveness Index
11.3 Europe Point of Care Diagnostics Market by Country, 2023, 2028 & 2033 (US$ bn)
11.4 Europe Point of Care Diagnostics Market Size Estimation and Forecast by Country
11.5 Europe Point of Care Diagnostics Market Size Estimation and Forecast by Product
11.6 Europe Point of Care Diagnostics Market Size Estimation and Forecast by Mode
11.7 Europe Point of Care Diagnostics Market Size Estimation and Forecast by Sample
11.8 Europe Point of Care Diagnostics Market Size Estimation and Forecast by Platform
11.9 Europe Point of Care Diagnostics Market Size Estimation and Forecast by End-users
11.10 Germany Point of Care Diagnostics Market Analysis
11.11 UK Point of Care Diagnostics Market Analysis
11.12 France Point of Care Diagnostics Market Analysis
11.13 Italy Point of Care Diagnostics Market Analysis
11.14 Spain Point of Care Diagnostics Market Analysis
11.15 Netherlands Point of Care Diagnostics Market Analysis
11.16 Rest of Europe Point of Care Diagnostics Market Analysis
12 Asia Pacific Point of Care Diagnostics Market Analysis
12.1 Key Findings
12.2 Asia Pacific Point of Care Diagnostics Market Attractiveness Index
12.3 Asia Pacific Point of Care Diagnostics Market by Country, 2023, 2028 & 2033 (US$ bn)
12.4 Asia Pacific Point of Care Diagnostics Market Size Estimation and Forecast by Country
12.5 Asia Pacific Point of Care Diagnostics Market Size Estimation and Forecast by Product
12.6 Asia Pacific Point of Care Diagnostics Market Size Estimation and Forecast by Mode
12.7 Asia Pacific Point of Care Diagnostics Market Size Estimation and Forecast by Sample
12.8 Asia Pacific Point of Care Diagnostics Market Size Estimation and Forecast by Platform
12.9 Asia Pacific Point of Care Diagnostics Market Size Estimation and Forecast by End-users
12.10 Japan Point of Care Diagnostics Market Analysis
12.11 China Point of Care Diagnostics Market Analysis
12.12 India Point of Care Diagnostics Market Analysis
12.13 Australia Point of Care Diagnostics Market Analysis
12.14 South Korea Point of Care Diagnostics Market Analysis
12.15 Rest of Asia Pacific Point of Care Diagnostics Market Analysis
13 Latin America Point of Care Diagnostics Market Analysis
13.1 Key Findings
13.2 Latin America Point of Care Diagnostics Market Attractiveness Index
13.3 Latin America Point of Care Diagnostics Market by Country, 2023, 2028 & 2033 (US$ bn)
13.4 Latin America Point of Care Diagnostics Market Size Estimation and Forecast by Country
13.5 Latin America Point of Care Diagnostics Market Size Estimation and Forecast by Product
13.6 Latin America Point of Care Diagnostics Market Size Estimation and Forecast by Mode
13.7 Latin America Point of Care Diagnostics Market Size Estimation and Forecast by Sample
13.8 Latin America Point of Care Diagnostics Market Size Estimation and Forecast by Platform
13.9 Latin America Point of Care Diagnostics Market Size Estimation and Forecast by End-users
13.10 Brazil Point of Care Diagnostics Market Analysis
13.11 Mexico Point of Care Diagnostics Market Analysis
13.12 Rest of Latin America Point of Care Diagnostics Market Analysis
14 MEA Point of Care Diagnostics Market Analysis
14.1 Key Findings
14.2 MEA Point of Care Diagnostics Market Attractiveness Index
14.3 MEA Point of Care Diagnostics Market by Country, 2023, 2028 & 2033 (US$ bn)
14.4 MEA Point of Care Diagnostics Market Size Estimation and Forecast by Country
14.5 MEA Point of Care Diagnostics Market Size Estimation and Forecast by Product
14.6 MEA Point of Care Diagnostics Market Size Estimation and Forecast by Mode
14.7 MEA Point of Care Diagnostics Market Size Estimation and Forecast by Sample
14.8 MEA Point of Care Diagnostics Market Size Estimation and Forecast by Platform
14.9 MEA Point of Care Diagnostics Market Size Estimation and Forecast by End-users
14.10 GCC Point of Care Diagnostics Market Analysis
14.11 South Africa Point of Care Diagnostics Market Analysis
14.12 Rest of MEA Point of Care Diagnostics Market Analysis
15 Company Profiles
15.1 Competitive Landscape, 2021
15.2 Abbott
15.2.1 Company Snapshot
15.2.2 Company Overview
15.2.3 Financial Analysis
15.2.3.1 Net Revenue, 2017-2021
15.2.3.2 R&D, 2017-2021
15.2.3.3 Regional Market Shares, 2021
15.2.4 Product Benchmarking
15.2.5 Strategic Outlook
15.3 F. Hoffmann-La Roche Ltd
15.3.1 Company Snapshot
15.3.2 Company Overview
15.3.3 Financial Analysis
15.3.3.1 Net Revenue, 2017-2021
15.3.3.2 R&D, 2017-2021
15.3.3.3 Regional Market Shares, 2021
15.3.4 Product Benchmarking
15.3.5 Strategic Outlook
15.4 Quidel Corporation
15.4.1 Company Snapshot
15.4.2 Company Overview
15.4.3 Financial Analysis
15.4.3.1 Net Revenue, 2017-2021
15.4.3.2 R&D, 2017-2021
15.4.3.3 Regional Market Shares, 2021
15.4.4 Product Benchmarking
15.4.5 Strategic Outlook
15.5 AccuBioTech Co., Ltd
15.5.1 Company Snapshot
15.5.2 Company Overview
15.5.3 Product Benchmarking
15.5.4 Strategic Outlook
15.6 Thermo Fisher Scientific
15.6.1 Company Snapshot
15.6.2 Company Overview
15.6.3 Financial Analysis
15.6.3.1 Net Revenue, 2017-2021
15.6.3.2 R&D, 2017-2021
15.6.4 Product Benchmarking
15.6.5 Strategic Outlook
15.7 BD
15.7.1 Company Snapshot
15.7.2 Company Overview
15.7.3 Financial Analysis
15.7.3.1 Net Revenue, 2017-2021
15.7.3.2 R & D, 2017-2021
15.7.3.3 Regional Market Shares, 2021
15.7.4 Product Benchmarking
15.7.5 Strategic Outlook
15.8 Danaher
15.8.1 Company Snapshot
15.8.2 Company Overview
15.8.3 Financial Analysis
15.8.3.1 Net Revenue, 2017-2021
15.8.3.2 R&D, 2017-2021
15.8.3.3 Regional Market Shares, 2021
15.8.4 Product Benchmarking
15.8.5 Strategic Outlook
15.9 PTS Diagnostics
15.9.1 Company Snapshot
15.9.2 Company Overview
15.9.3 Product Benchmarking
15.10 Trinity Biotech Ireland
15.10.1 Company Snapshot
15.10.2 Company Overview
15.10.3 Financial Analysis
15.10.3.1 Net Revenue, 2017-2021
15.10.3.2 Regional Market Shares, 2021
15.10.4 Product Benchmarking
15.10.5 Strategic Outlook
15.11 Siemens Healthcare GmbH
15.11.1 Company Snapshot
15.11.2 Company Overview
15.11.3 Financial Analysis
15.11.3.1 Net Revenue, 2017-2021
15.11.3.2 R&D, 2017-2021
15.11.3.3 Regional Market Shares, 2021
15.11.4 Product Benchmarking
15.11.5 Strategic Outlook
15.12 Sekisui Diagnostics
15.12.1 Company Snapshot
15.12.2 Company Overview
15.12.3 Product Benchmarking
15.12.4 Strategic Outlook
15.13 Fluxergy
15.13.1 Company Snapshot
15.13.2 Company Overview
15.13.3 Product Benchmarking
15.13.4 Strategic Outlook
15.14 Chembio Diagnostics Inc.
15.14.1 Company Snapshot
15.14.2 Company Overview
15.14.3 Financial Analysis
15.14.3.1 Net Revenue, 2017-2021
15.14.3.2 R&D, 2017-2021
15.14.3.3 Regional Market Shares, 2021
15.14.4 Product Benchmarking
15.14.5 Strategic Outlook
15.15 Werfen
15.15.1 Company Snapshot
15.15.2 Company Overview
15.15.3 Financial Analysis
15.15.3.1 Net Revenue, 2017-2021
15.15.3.2 R&D, 2017-2021
15.15.3.3 Regional Market Shares, 2021
15.15.4 Product Benchmarking
15.16 NOVA BIOMEDICAL
15.16.1 Company Snapshot
15.16.2 Company Overview
15.16.3 Product Benchmarking
15.17 Qiagen
15.17.1 Company Snapshot
15.17.2 Company Overview
15.17.3 Financial Analysis
15.17.3.1 Net Revenue, 2017-2021
15.17.3.2 R&D, 2017-2021
15.17.3.3 Regional Market Shares, 2021
15.17.4 Product Benchmarking
15.17.5 Strategic Outlook
15.18 bioMerieux SA
15.18.1 Company Snapshot
15.18.2 Company Overview
15.18.3 Financial Analysis
15.18.3.1 Net Revenue, 2017-2021
15.18.3.2 R&D, 2017-2021
15.18.3.3 Regional Market Shares, 2021
15.18.4 Product Benchmarking
15.18.5 Strategic Outlook
15.19 Nipro Europe Group Companies
15.19.1 Company Snapshot
15.19.2 Company Overview
15.19.3 Financial Analysis
15.19.3.1 Net Revenue, 2017-2021
15.19.3.2 R&D, 2017-2021
15.19.3.3 Regional Market Shares, 2021
15.19.4 Product Benchmarking
15.19.5 Strategic Outlook
15.20 EKF Diagnostics Holdings plc
15.20.1 Company Snapshot
15.20.2 Company Overview
15.20.3 Financial Analysis
15.20.3.1 Net Revenue, 2017-2021
15.20.3.2 Regional Market Shares, 2021
15.20.4 Product Benchmarking
15.20.5 Strategic Outlook
15.21 TRIVIDIA HEALTH, INC.
15.21.1 Company Snapshot
15.21.2 Company Overview
15.21.3 Product Benchmarking
15.22 Spectral Medical Inc.
15.22.1 Company Snapshot
15.22.2 Company Overview
15.22.3 Product Benchmarking
15.23 Orasure Technologies, Inc.
15.23.1 Company Snapshot
15.23.2 Company Overview
15.23.3 Financial Analysis
15.23.3.1 Net Revenue, 2017-2021
15.23.3.2 R&D, 2017-2021
15.23.3.3 Regional Market Shares, 2021
15.23.4 Product Benchmarking
15.23.5 Strategic Outlook
15.24 Response Biomedical
15.24.1 Company Snapshot
15.24.2 Company Overview
15.24.3 Product Benchmarking
15.24.4 Strategic Outlook
15.25 LumiraDX
15.25.1 Company Snapshot
15.25.2 Company Overview
15.25.3 Financial Analysis
15.25.3.1 Net Revenue, 2019-2021
15.25.3.2 R&D, 2019-2021
15.25.4 Product Benchmarking
15.25.5 Strategic Outlook
15.26 Meridian Bioscience Inc.
15.26.1 Company Snapshot
15.26.2 Company Overview
15.26.3 Financial Analysis
15.26.3.1 Net Revenue, 2017-2021
15.26.3.2 R&D, 2017-2021
15.26.3.3 Regional Market Shares, 2021
15.26.4 Product Benchmarking
15.26.5 Strategic Outlook
16 Conclusion and Recommendations
16.1 Concluding Remarks from Visiongain
16.2 Recommendations for Market Players
List of Tables
Table 1 Point of Care Diagnostics Market by Region, 2023-2033 (US$ bn, AGR (%), CAGR (%)): “V” Shaped Recovery Scenario
Table 2 Point of Care Diagnostics Market by Region, 2023-2033 (US$ bn, AGR (%), CAGR (%)): “U” Shaped Recovery Scenario
Table 3 Point of Care Diagnostics Market by Region, 2023-2033 (US$ bn, AGR (%), CAGR (%)): “W” Shaped Recovery Scenario
Table 4 Point of Care Diagnostics Market by Region, 2023-2033 (US$ bn, AGR (%), CAGR (%)): “L” Shaped Recovery Scenario
Table 5 Point of Care Diagnostics Market Forecast By Product, 2023-2033 (US$ Bn, AGR%, CAGR%)
Table 6 Glucose Monitoring Market Forecast by Region, 2023-2033 (US$ bn, AGR%, CAGR%)
Table 7 Cardiometabolic Monitoring Market Forecast by Region, 2023-2033 (US$ bn, AGR%, CAGR%)
Table 8 Infectious Disease Testing Market Forecast by Region, 2023-2033 (US$ bn, AGR%, CAGR%)
Table 9 Coagulation Monitoring Market Forecast by Region, 2023-2033 (US$ bn, AGR%, CAGR%)
Table 10 Pregnancy & Fertility Testing Market Forecast by Region, 2023-2033 (US$ bn, AGR%, CAGR%)
Table 11 Tumour/Cancer Marker Testing Market Forecast by Region, 2023-2033 (US$ bn, AGR%, CAGR%)
Table 12 Urinalysis Testing Market Forecast by Region, 2023-2033 (US$ bn, AGR%, CAGR%)
Table 13 Cholesterol Testing Market Forecast by Region, 2023-2033 (US$ bn, AGR%, CAGR%)
Table 14 Hematology Testing Market Forecast by Region, 2023-2033 (US$ bn, AGR%, CAGR%)
Table 15 Drugs-of-abuse Testing Market Forecast by Region, 2023-2033 (US$ bn, AGR%, CAGR%)
Table 16 Fecal Occult Testing Market Forecast by Region, 2023-2033 (US$ bn, AGR%, CAGR%)
Table 17 Other POC Products Market Forecast by Region, 2023-2033 (US$ bn, AGR%, CAGR%)
Table 18 Point of Care Diagnostics Market by Mode, 2023-2033 (US$ bn, AGR%, CAGR%)
Table 19 Prescription-based Products Market Forecast by Region, 2023-2033 (US$ bn, AGR%, CAGR%)
Table 20 OTC Products Market Forecast by Region, 2023-2033 (US$ bn, AGR%, CAGR%)
Table 21 Point of Care Diagnostics Market Forecast by Sample, 2023-2033 (US$ bn, AGR%, CAGR%)
Table 22 Blood Market Forecast by Region, 2023-2033 (US$ bn, AGR%, CAGR%)
Table 23 Nasal and Oropharyngeal Swabs Market Forecast by Region, 2023-2033 (US$ bn, AGR%, CAGR%)
Table 24 Urine Market Forecast by Region, 2023-2033 (US$ bn, AGR%, CAGR%)
Table 25 Other Market Forecast by Region, 2023-2033 (US$ bn, AGR%, CAGR%)
Table 26 Point of Care Diagnostics Market Forecast by Platform, 2023-2033 (US$ bn, AGR%, CAGR%)
Table 27 Lateral Flow Assay Market Forecast by Region, 2023-2033 (US$ bn, AGR%, CAGR%)
Table 28 Dipstick Market Forecast by Region, 2023-2033 (US$ bn, AGR%, CAGR%)
Table 29 Microfluidics Market Forecast by Region, 2023-2033 (US$ bn, AGR%, CAGR%)
Table 30 Molecular diagnostics Market Forecast by Region, 2023-2033 (US$ bn, AGR%, CAGR%)
Table 31 Immunoassay Market Forecast by Region, 2023-2033 (US$ bn, AGR%, CAGR%)
Table 32 Point of Care Diagnostics Market Forecast By End User, 2023-2033 (US$ bn, AGR%, CAGR%)
Table 33 Clinics Market Forecast by Region, 2023-2033 (US$ bn, AGR%, CAGR%)
Table 34 Hospitals Market Forecast by Region, 2023-2033 (US$ bn, AGR%, CAGR%)
Table 35 Home Care Settings Market Forecast by Region, 2023-2033 (US$ bn, AGR%, CAGR%)
Table 36 Other End-users Market Forecast by Region, 2023-2033 (US$ bn, AGR%, CAGR%)
Table 37 Point of Care Diagnostics Market by Region, 2023-2033 (US$ bn, AGR (%), CAGR (%))
Table 38 North America Point of Care Diagnostics Market Forecast By Products, 2023-2033 (US$ bn, AGR%, CAGR%)
Table 39 North America Point of Care Diagnostics Market Forecast by Mode, 2023-2033 (US$ bn, AGR%, CAGR%)
Table 40 North America Point of Care Diagnostics Market Forecast by Sample, 2023-2033 (US$ bn, AGR%, CAGR%)
Table 41 North America Point of Care Diagnostics Market Forecast by Platform, 2023-2033 (US$ bn, AGR%, CAGR%)
Table 42 North America Point of Care Diagnostics Market Forecast by End Users, 2023-2033 (US$ bn, AGR%, CAGR%)
Table 43 North America Point of Care Diagnostics Market Forecast by Country, 2023-2033 (US$ bn, AGR%, CAGR%)
Table 44 U.S. Point of Care Diagnostics Market Forecast, 2023-2033 (US$ bn, AGR%, CAGR%)
Table 45 Canada Point of Care Diagnostics Market Forecast, 2023-2033 (US$ bn, AGR%, CAGR%)
Table 46 Europe Point of Care Diagnostics Market Forecast by Country, 2023-2033 (US$ bn, AGR%, CAGR%)
Table 47 Europe Point of Care Diagnostics Market Forecast By Product, 2023-2033 (US$ bn, AGR%, CAGR%)
Table 48 Europe Point of Care Diagnostics Market Forecast by Mode, 2023-2033 (US$ bn, AGR%, CAGR%)
Table 49 Europe Point of Care Diagnostics Market Forecast by Sample, 2023-2033 (US$ bn, AGR%, CAGR%)
Table 50 Europe Point of Care Diagnostics Market Forecast by Platform, 2023-2033 (US$ bn, AGR%, CAGR%)
Table 51 Europe Point of Care Diagnostics Market Forecast by End-users, 2023-2033 (US$ bn, AGR%, CAGR%)
Table 52 Germany Point of Care Diagnostics Market Forecast, 2023-2033 (US$ bn, AGR%, CAGR%)
Table 53 UK Point of Care Diagnostics Market Forecast, 2023-2033 (US$ bn, AGR%, CAGR%)
Table 54 France Point of Care Diagnostics Market Forecast, 2023-2033 (US$ bn, AGR%, CAGR%)
Table 55 Italy Point of Care Diagnostics Market Forecast, 2023-2033 (US$ bn, AGR%, CAGR%)
Table 56 Spain Point of Care Diagnostics Market Forecast, 2023-2033 (US$ bn, AGR%, CAGR%)
Table 57 Netherlands Point of Care Diagnostics Market Forecast, 2023-2033 (US$ bn, AGR%, CAGR%)
Table 58 Rest of Europe Point of Care Diagnostics Market Forecast, 2023-2033 (US$ bn, AGR%, CAGR%)
Table 59 Asia Pacific Point of Care Diagnostics Market Forecast by Country, 2023-2033 (US$ bn, AGR%, CAGR%)
Table 60 Asia Pacific Point of Care Diagnostics Market Forecast By Product, 2023-2033 (US$ bn, AGR%, CAGR%)
Table 61 Asia Pacific Point of Care Diagnostics Market Forecast by Mode, 2023-2033 (US$ bn, AGR%, CAGR%)
Table 62 Asia Pacific Point of Care Diagnostics Market Forecast by Sample, 2023-2033 (US$ bn, AGR%, CAGR%)
Table 63 Asia Pacific Point of Care Diagnostics Market Forecast by End-users, 2023-2033 (US$ bn, AGR%, CAGR%)
Table 64 Asia Pacific Point of Care Diagnostics Market Forecast by End-users, 2023-2033 (US$ bn, AGR%, CAGR%)
Table 65 Japan Point of Care Diagnostics Market Forecast, 2023-2033 (US$ bn, AGR%, CAGR%)
Table 66 China Point of Care Diagnostics Market Forecast, 2023-2033 (US$ bn, AGR%, CAGR%)
Table 67 India Point of Care Diagnostics Market Forecast, 2023-2033 (US$ bn, AGR%, CAGR%)
Table 68 Australia Point of Care Diagnostics Market Forecast, 2023-2033 (US$ bn, AGR%, CAGR%)
Table 69 South Korea Point of Care Diagnostics Market Forecast, 2023-2033 (US$ bn, AGR%, CAGR%)
Table 70 Rest of Asia Pacific Point of Care Diagnostics Market Forecast, 2023-2033 (US$ bn, AGR%, CAGR%)
Table 71 Latin America Point of Care Diagnostics Market Forecast by Country, 2023-2033 (US$ bn, AGR%, CAGR%)
Table 72 Latin America Point of Care Diagnostics Market Forecast by Product, 2023-2033 (US$ bn, AGR%, CAGR%)
Table 73 Latin America Point of Care Diagnostics Market Forecast by Mode, 2023-2033 (US$ bn, AGR%, CAGR%)
Table 74 Latin America Point of Care Diagnostics Market Forecast by Sample, 2023-2033 (US$ bn, AGR%, CAGR%)
Table 75 Latin America Point of Care Diagnostics Market Forecast by End-users, 2023-2033 (US$ bn, AGR%, CAGR%)
Table 76 Latin America Point of Care Diagnostics Market Forecast by End-users, 2023-2033 (US$ bn, AGR%, CAGR%)
Table 77 Brazil Point of Care Diagnostics Market Forecast, 2023-2033 (US$ bn, AGR%, CAGR%)
Table 78 Mexico Point of Care Diagnostics Market Forecast, 2023-2033 (US$ bn, AGR%, CAGR%)
Table 79 Rest of Latin America Point of Care Diagnostics Market Forecast, 2023-2033 (US$ bn, AGR%, CAGR%)
Table 80 MEA Point of Care Diagnostics Market Forecast by Country, 2023-2033 (US$ bn, AGR%, CAGR%)
Table 81 MEA Point of Care Diagnostics Market Forecast by Product, 2023-2033 (US$ bn, AGR%, CAGR%)
Table 82 MEA Point of Care Diagnostics Market Forecast by Mode, 2023-2033 (US$ bn, AGR%, CAGR%)
Table 83 MEA Point of Care Diagnostics Market Forecast by Sample, 2023-2033 (US$ bn, AGR%, CAGR%)
Table 84 MEA Point of Care Diagnostics Market Forecast by Platform, 2023-2033 (US$ bn, AGR%, CAGR%)
Table 85 MEA Point of Care Diagnostics Market Forecast by End-users, 2023-2033 (US$ bn, AGR%, CAGR%)
Table 86 GCC Point of Care Diagnostics Market Forecast, 2023-2033 (US$ bn, AGR%, CAGR%)
Table 87 South Africa Point of Care Diagnostics Market Forecast, 2023-2033 (US$ bn, AGR%, CAGR%)
Table 88 Rest of MEA Point of Care Diagnostics Market Forecast, 2023-2033 (US$ bn, AGR%, CAGR%)
Table 89 Abbott: Key Details, (CEO, HQ, Revenue, Founded, No. of Employees, Company Type, Website, Business Segment)
Table 90 Abbott: Product Benchmarking
Table 91 Abbott: Strategic Outlook
Table 92 F. Hoffmann-La Roche Ltd: Key Details, (CEO, HQ, Revenue, Founded, No. of Employees, Company Type, Website, Business Segment)
Table 93 F. Hoffmann-La Roche Ltd: Product Benchmarking
Table 94 F. Hoffmann-La Roche Ltd: Strategic Outlook
Table 95 Quidel Corporation: Key Details, (CEO, HQ, Revenue, Founded, No. of Employees, Company Type, Website, Business Segment)
Table 96 Quidel Corporation: Product Benchmarking
Table 97 Quidel Ortho Corporation: Strategic Outlook
Table 98 AccuBioTech Co., Ltd: Key Details, (CEO, HQ, Revenue, Founded, No. of Employees, Company Type, Website, Business Segment)
Table 99 AccuBioTech Co., Ltd: Product Benchmarking
Table 100 AccuBioTech Co., Ltd: Strategic Outlook
Table 101 Thermo Fisher Scientific: Key Details, (CEO, HQ, Revenue, Founded, No. of Employees, Company Type, Website, Business Segment)
Table 102 Thermo Fisher Scientific.: Product Benchmarking
Table 103 Thermo Fisher Scientific Inc.: Strategic Outlook
Table 104 BD: Key Details, (CEO, HQ, Revenue, Founded, No. of Employees, Company Type, Website, Business Segment)
Table 105 BD: Product Benchmarking
Table 106 BD: Strategic Outlook
Table 107 Danaher: Key Details, (CEO, HQ, Revenue, Founded, No. of Employees, Company Type, Website, Business Segment)
Table 108 Danaher: Product Benchmarking
Table 109 Danaher: Strategic Outlook
Table 110 PTS Diagnostics: Key Details, (CEO, HQ, Revenue, Founded, No. of Employees, Company Type, Website, Business Segment)
Table 111 PTS Diagnostics: Product Benchmarking
Table 112 Trinity Biotech Ireland: Key Details, (CEO, HQ, Revenue, Founded, No. of Employees, Company Type, Website, Business Segment)
Table 113 Trinity Biotech Ireland: Product Benchmarking
Table 114 Trinity Biotech Ireland: Strategic Outlook
Table 115 Siemens Healthcare GmbH: Key Details, (CEO, HQ, Revenue, Founded, No. of Employees, Company Type, Website, Business Segment)
Table 116 Siemens Healthcare GmbH: Product Benchmarking
Table 117 Siemens Healthcare GmbH: Strategic Outlook
Table 118 Sekisui Diagnostics: Key Details, (CEO, HQ, Founded, No. of Employees, Company Type, Website, Business Segment)
Table 119 Sekisui Diagnostics: Product Benchmarking
Table 120 Sekisui Diagnostics: Strategic Outlook
Table 121 Fluxergy: Key Details, (CEO, HQ, Revenue, Founded, No. of Employees, Company Type, Website, Business Segment)
Table 122 Fluxergy: Product Benchmarking
Table 123 Fluxergy: Strategic Outlook
Table 124 Chembio Diagnostics Inc.: Key Details, (CEO, HQ, Revenue, Founded, No. of Employees, Company Type, Website, Business Segment)
Table 125 Chembio Diagnostics: Inc. Product Benchmarking
Table 126 Chembio Diagnostics Inc.: Strategic Outlook
Table 127 Werfen: Key Details, (CEO, HQ, Revenue, Founded, No. of Employees, Company Type, Website, Business Segment)
Table 128 Werfen: Product Benchmarking
Table 129 Nova Biomedical: Key Details, (CEO, HQ, Revenue, Founded, No. of Employees, Company Type, Website, Business Segment)
Table 130 Nova Biomedical: Product Benchmarking
Table 131 Qiagen: Key Details, (CEO, HQ, Revenue, Founded, No. of Employees, Company Type, Website, Business Segment)
Table 132 Qiagen: Product Benchmarking
Table 133 Qiagen: Strategic Outlook
Table 134 bioMerieux SA: Key Details, (CEO, HQ, Revenue, Founded, No. of Employees, Company Type, Website, Business Segment)
Table 135 bioMerieux SA: Product Benchmarking
Table 136 bioMerieux SA: Strategic Outlook
Table 137 Nipro Europe Group Companies: Key Details, (CEO, HQ, Revenue, Founded, No. of Employees, Company Type, Website, Business Segment)
Table 138 Nipro Europe Group Companies: Product Benchmarking
Table 139 Nipro Europe Group Companies: Strategic Outlook
Table 140 EKF Diagnostics: Key Details, (CEO, HQ, Revenue, Founded, No. of Employees, Company Type, Website, Business Segment)
Table 141 EKF Diagnostics: Product Benchmarking
Table 142 EKF Diagnostics: Strategic Outlook
Table 143 Trividia Health, Inc.: Key Details, (CEO, HQ, Revenue, Founded, No. of Employees, Company Type, Website, Business Segment)
Table 144 Trividia Health, Inc.: Product Benchmarking
Table 145 Spectral Medical Inc.: Key Details, (CEO, HQ, Revenue, Founded, No. of Employees, Company Type, Website, Business Segment)
Table 146 Spectral Medical Inc.: Product Benchmarking
Table 147 Orasure Technologies, Inc.: Key Details, (CEO, HQ, Revenue, Founded, No. of Employees, Company Type, Website, Business Segment)
Table 148 Orasure Technologies, Inc.: Product Benchmarking
Table 149 Orasure Technologies, Inc.: Strategic Outlook
Table 150 Response Biomedical.: Key Details, (CEO, HQ, Revenue, Founded, No. of Employees, Company Type, Website, Business Segment)
Table 151 Response Biomedical: Product Benchmarking
Table 152 Response Biomedical.: Strategic Outlook
Table 153 LumiraDX.: Key Details, (CEO, HQ, Revenue, Founded, No. of Employees, Company Type, Website, Business Segment)
Table 154 LumiraDX.: Product Benchmarking
Table 155 LumiraDX.: Strategic Outlook
Table 156 Meridian Bioscience Inc..: Key Details, (CEO, HQ, Revenue, Founded, No. of Employees, Company Type, Website, Business Segment)
Table 157 Meridian Bioscience Inc..: Product Benchmarking
Table 158 Meridian Bioscience Inc..: Strategic Outlook
List of Figures
Figure 1 Point of Care Diagnostics Market Segmentation
Figure 2 Global Point of Care Diagnostics by Region: Market Attractiveness Index
Figure 3 Point of Care Diagnostics Market by Product: Market Attractiveness Index
Figure 4 Point of Care Diagnostics Market by Mode: Market Attractiveness Index
Figure 5 Point of Care Diagnostics Market: Market Dynamics
Figure 6 COVID Impact Analysis: Point of Care Diagnostics Market Recovery Scenarios
Figure 7 Point of Care Diagnostics Market by Region, 2023-2033 (US$ bn, AGR %): “V” Shaped Recovery
Figure 8 Point of Care Diagnostics Market by Region, 2023-2033 (US$ bn, AGR %): “U” Shaped Recovery
Figure 9 Point of Care Diagnostics Market by Region, 2023-2033 (US$ bn, AGR %): “W” Shaped Recovery
Figure 10 Point of Care Diagnostics Market by Region, 2023-2033 (US$ bn, AGR %): “L” Shaped Recovery
Figure 11 Point of Care Diagnostics Market: Porter’s Five Forces Analysis
Figure 12 Point of Care Diagnostics Market: PEST Analysis
Figure 13 Global Point of Care Diagnostics Market: SWOT Analysis
Figure 14 Point of Care Diagnostics Market by Product Segment: Market Attractiveness Index
Figure 15 Point of Care Diagnostics Market Forecast By Product, 2023-2033 (US$ bn)
Figure 16 Point of Care Diagnostics Market Share Forecast By Product, 2023, 2028, 2033 (%)
Figure 17 Glucose Monitoring Market Forecast by Region, 2023-2033 (US$ bn)
Figure 18 Glucose Monitoring Market Share Forecast by Region, 2023 & 2033 (%)
Figure 19 Cardiometabolic Monitoring Market Forecast by Region, 2023-2033 (US$ bn)
Figure 20 Cardiometabolic Monitoring Market Share Forecast by Region, 2023 & 2033 (%)
Figure 21 Infectious Disease Testing Market Forecast by Region, 2023-2033 (US$ bn)
Figure 22 Infectious Disease Testing Market Share Forecast by Region, 2023 & 2033 (%)
Figure 23 Coagulation Monitoring Market Forecast by Region, 2023-2033 (US$ bn)
Figure 24 Coagulation Monitoring Market Share Forecast by Region, 2023 & 2033 (%)
Figure 25 Pregnancy & Fertility Testing Market Forecast by Region, 2023-2033 (US$ bn)
Figure 26 Pregnancy & Fertility Testing Market Share Forecast by Region, 2023 & 2033 (%)
Figure 27 Tumour/Cancer Marker Testing Market Forecast by Region, 2023-2033 (US$ bn)
Figure 28 Tumour/Cancer Marker Testing Market Share Forecast by Region, 2023 & 2033 (%)
Figure 29 Urinalysis Testing Market Forecast by Region, 2023-2033 (US$ bn)
Figure 30 Urinalysis Testing Market Share Forecast by Region, 2023 & 2033 (%)
Figure 31 Cholesterol Testing Market Forecast by Region, 2023-2033 (US$ bn)
Figure 32 Cholesterol Testing Market Share Forecast by Region, 2023 & 2033 (%)
Figure 33 Hematology Testing Market Forecast by Region, 2023-2033 (US$ bn)
Figure 34 Hematology Testing Market Share Forecast by Region, 2023 & 2033 (%)
Figure 35 Drugs-of-abuse Testing Market Forecast by Region, 2023-2033 (US$ bn)
Figure 36 Drugs-of-abuse Testing Market Share Forecast by Region, 2023 & 2033 (%)
Figure 37 Fecal Occult Testing Market Forecast by Region, 2023-2033 (US$ bn)
Figure 38 Fecal Occult Testing Market Share Forecast by Region, 2023 & 2033 (%)
Figure 39 Other POC Products Market Forecast by Region, 2023-2033 (US$ bn)
Figure 40 Other POC Products Market Share Forecast by Region, 2023 & 2033 (%)
Figure 41 Point of Care Diagnostics Market by Mode Segment: Market Attractiveness Index
Figure 42 Point of Care Diagnostics Market by Mode, 2023-2033 (US$ bn)
Figure 43 Point of Care Diagnostics Market Share Forecast By Mode, 2023, 2028, 2033 (%)
Figure 44 Prescription-based Products Market Forecast by Region, 2023-2033 (US$ bn)
Figure 45 Prescription-based Products Market Share Forecast by Region, 2023 & 2033 (%)
Figure 46 OTC Products Market Forecast by Region, 2023-2033 (US$ bn)
Figure 47 OTC Products Market Share Forecast by Region, 2023 & 2033 (%)
Figure 48 Point of Care Diagnostics Market by Sample Segment: Market Attractiveness Index
Figure 49 Point of Care Diagnostics Market Forecast by Sample, 2023-2033 (US$ bn)
Figure 50 Point of Care Diagnostics Market Share Forecast by Sample, 2023, 2028, 2033 (%)
Figure 51 Blood Market Forecast by Region, 2023-2033 (US$ bn)
Figure 52 Blood Market Share Forecast by Region, 2023 & 2033 (%)
Figure 53 Nasal and Oropharyngeal Swabs Market Forecast by Region, 2023-2033 (US$ bn)
Figure 54 Nasal and Oropharyngeal Swabs Market Share Forecast by Region, 2023 & 2033 (%)
Figure 55 Urine Market Forecast by Region, 2023-2033 (US$ bn)
Figure 56 Urine Market Share Forecast by Region, 2023 & 2033 (%)
Figure 57 Other Market Forecast by Region, 2023-2033 (US$ bn)
Figure 58 Other Market Share Forecast by Region, 2023 & 2033 (%)
Figure 59 Point of Care Diagnostics Market by Platform Segment: Market Attractiveness Index
Figure 60 Point of Care Diagnostics Market Forecast by Platform, 2023-2033 (US$ bn)
Figure 61 Point of Care Diagnostics Market Share Forecast by Platform, 2023, 2028, 2033 (%)
Figure 62 Lateral Flow Assay Market Forecast by Region, 2023-2033 (US$ bn)
Figure 63 Lateral Flow Assay Market Share Forecast by Region, 2023 & 2033 (%)
Figure 64 Dipstick Market Forecast by Region, 2023-2033 (US$ bn)
Figure 65 Dipstick Market Share Forecast by Region, 2023 & 2033 (%)
Figure 66 Microfluidics Market Forecast by Region, 2023-2033 (US$ bn)
Figure 67 Microfluidics Market Share Forecast by Region, 2023 & 2033 (%)
Figure 68 Molecular diagnostics Market Forecast by Region, 2023-2033 (US$ bn)
Figure 69 Molecular diagnostics Market Share Forecast by Region, 2023 & 2033 (%)
Figure 70 Immunoassay Market Forecast by Region, 2023-2033 (US$ bn)
Figure 71 Immunoassay Market Share Forecast by Region, 2023 & 2033 (%)
Figure 72 Point of Care Diagnostics Market by End User: Market Attractiveness Index
Figure 73 Point of Care Diagnostics Market Forecast by End User, 2023-2033 (US$ bn)
Figure 74 Point of Care Diagnostics Market Share Forecast by End User, 2023, 2028, 2033 (%)
Figure 75 Clinics Market Forecast by Region, 2023-2033 (US$ bn)
Figure 76 Clinics Market Share Forecast by Region, 2023 & 2033 (%)
Figure 77 Hospitals Market Forecast by Region, 2023-2033 (US$ bn)
Figure 78 Hospitals Market Share Forecast by Region, 2023 & 2033 (%)
Figure 79 Home Care Settings Market Forecast by Region, 2023-2033 (US$ bn)
Figure 80 Home Care Settings Market Share Forecast by Region, 2023 & 2033 (%)
Figure 81 Other End-users Market Forecast by Region, 2023-2033 (US$ bn)
Figure 82 Other End-users Market Share Forecast by Region, 2023 & 2033 (%)
Figure 83 Point of Care Diagnostics Market Forecast by Region 2023, 2028, 2033 (Revenue, CAGR%)
Figure 84 Point of Care Diagnostics Market Share Forecast by Region 2023, 2028, 2033(%)
Figure 85 Point of Care Diagnostics Market by Region, 2023-2033 (US$ bn, AGR %)
Figure 86 North America Point of Care Diagnostics Market Attractiveness Index
Figure 87 North America Point of Care Diagnostics Market by Region, 2023, 2028 & 2033 (US$ bn)
Figure 88 North America Point of Care Diagnostics Market Forecast By Products, 2023-2033 (US$ bn)
Figure 89 North America Point of Care Diagnostics Market Share Forecast By Products, 2023 & 2033 (%)
Figure 90 North America Point of Care Diagnostics Market Forecast by Mode, 2023-2033 (US$ Billion)
Figure 91 North America Point of Care Diagnostics Market Share Forecast by Mode, 2023 & 2033 (%)
Figure 92 North America Point of Care Diagnostics Market Forecast by Sample, 2023-2033 (US$ bn)
Figure 93 North America Point of Care Diagnostics Market Share Forecast by Sample, 2023 & 2033 (%)
Figure 94 North America Point of Care Diagnostics Market Forecast by Platform, 2023-2033 (US$ bn)
Figure 95 North America Point of Care Diagnostics Market Share Forecast by Platform, 2023 & 2033 (%)
Figure 96 North America Point of Care Diagnostics Market Forecast by End Users, 2023-2033 (US$ bn)
Figure 97 North America Point of Care Diagnostics Market Share Forecast by End Users, 2023 & 2033 (%)
Figure 98 North America Point of Care Diagnostics Market Forecast by Country, 2023-2033 (US$ bn)
Figure 99 North America Point of Care Diagnostics Market Share Forecast by Country, 2023 & 2033 (%)
Figure 100 U.S. Point of Care Diagnostics Market Forecast, 2023-2033 (US$ bn, AGR %)
Figure 101 Canada Point of Care Diagnostics Market Forecast, 2023-2033 (US$ bn, AGR %)
Figure 102 Europe Point of Care Diagnostics Market Attractiveness Index
Figure 103 Europe Point of Care Diagnostics Market by Region, 2023, 2028 & 2033 (US$ bn)
Figure 104 Europe Point of Care Diagnostics Market Forecast by Country, 2023-2033 (US$ bn)
Figure 105 Europe Point of Care Diagnostics Market Share Forecast by Country, 2023 & 2033 (%)
Figure 106 Europe Point of Care Diagnostics Market Forecast By Product, 2023-2033 (US$ bn)
Figure 107 Europe Point of Care Diagnostics Market Share Forecast By Product, 2023 & 2033 (%)
Figure 108 Europe Point of Care Diagnostics Market Forecast by Mode, 2023-2033 (US$ bn)
Figure 109 Europe Point of Care Diagnostics Market Share Forecast by Mode, 2023 & 2033 (%)
Figure 110 Europe Point of Care Diagnostics Market Forecast by Sample, 2023-2033 (US$ bn)
Figure 111 Europe Point of Care Diagnostics Market Share Forecast by Sample, 2023 & 2033(%)
Figure 112 Europe Point of Care Diagnostics Market Forecast by Platform, 2023-2033 (US$ bn)
Figure 113 Europe Point of Care Diagnostics Market Share Forecast by Platform, 2023 & 2033 (%)
Figure 114 Europe Point of Care Diagnostics Market Forecast by End-users, 2023-2033 (US$ bn)
Figure 115 Europe Point of Care Diagnostics Market Share Forecast by End-users, 2023 & 2033 (%)
Figure 116 Germany Point of Care Diagnostics Market Forecast, 2023-2033 (US$ bn, AGR %)
Figure 117 UK Point of Care Diagnostics Market Forecast, 2023-2033 (US$ bn, AGR %)
Figure 118 France Point of Care Diagnostics Market Forecast, 2023-2033 (US$ bn, AGR %)
Figure 119 Italy Point of Care Diagnostics Market Forecast, 2023-2033 (US$ bn, AGR %)
Figure 120 Spain Point of Care Diagnostics Market Forecast, 2023-2033 (US$ bn, AGR %)
Figure 121 Netherlands Point of Care Diagnostics Market Forecast, 2023-2033 (US$ bn, AGR %)
Figure 122 Rest of Europe Point of Care Diagnostics Market Forecast, 2023-2033 (US$ bn, AGR %)
Figure 123 Asia Pacific Point of Care Diagnostics Market Attractiveness Index
Figure 124 Asia Pacific Point of Care Diagnostics Market by Region, 2023, 2028 & 2033 (US$ bn)
Figure 125 Asia Pacific Point of Care Diagnostics Market Forecast by Country, 2023-2033 (US$ bn)
Figure 126 Asia Pacific Point of Care Diagnostics Market Share Forecast by Country, 2023 & 2033 (%)
Figure 127 Asia Pacific Point of Care Diagnostics Market Forecast By Product, 2023-2033 (US$ bn)
Figure 128 Asia Pacific Point of Care Diagnostics Market Share Forecast By Product, 2023 & 2033 (%)
Figure 129 Asia Pacific Point of Care Diagnostics Market Forecast by Mode, 2023-2033 (US$ bn)
Figure 130 Asia Pacific Point of Care Diagnostics Market Share Forecast by Mode, 2023 & 2033 (%)
Figure 131 Asia Pacific Point of Care Diagnostics Market Forecast by Sample, 2023-2033 (US$ bn)
Figure 132 Asia Pacific Point of Care Diagnostics Market Share Forecast by Sample, 2023 & 2033 (%)
Figure 133 Asia Pacific Point of Care Diagnostics Market Forecast by Platform, 2023-2033 (US$ bn)
Figure 134 Asia Pacific Point of Care Diagnostics Market Share Forecast by Platform, 2023 & 2033(%)
Figure 135 Asia Pacific Point of Care Diagnostics Market Forecast by End-users, 2023-2033 (US$ bn)
Figure 136 Asia Pacific Point of Care Diagnostics Market Share Forecast by End-users, 2023 & 2033 (%)
Figure 137 Japan Point of Care Diagnostics Market Forecast, 2023-2033 (US$ bn, AGR %)
Figure 138 China Point of Care Diagnostics Market Forecast, 2023-2033 (US$ bn, AGR %)
Figure 139 India Point of Care Diagnostics Market Forecast, 2023-2033 (US$ bn, AGR %)
Figure 140 Australia Point of Care Diagnostics Market Forecast, 2023-2033 (US$ bn, AGR %)
Figure 141 South Korea Point of Care Diagnostics Market Forecast, 2023-2033 (US$ bn, AGR %)
Figure 142 Rest of Asia Pacific Point of Care Diagnostics Market Forecast, 2023-2033 (US$ bn, AGR %)
Figure 143 Latin America Point of Care Diagnostics Market Attractiveness Index
Figure 144 Latin America Point of Care Diagnostics Market by Region, 2023, 2028 & 2033 (US$ bn)
Figure 145 Latin America Point of Care Diagnostics Market Forecast by Country, 2023-2033 (US$ bn)
Figure 146 Latin America Point of Care Diagnostics Market Share Forecast by Country, 2023 & 2033 (%)
Figure 147 Latin America Point of Care Diagnostics Market Forecast by Product, 2023-2033 (US$ bn)
Figure 148 Latin America Point of Care Diagnostics Market Share Forecast by Product, 2023 & 2033 (%)
Figure 149 Latin America Point of Care Diagnostics Market Forecast by Mode, 2023-2033 (US$ bn)
Figure 150 Latin America Point of Care Diagnostics Market Share Forecast by Mode, 2023 & 2033 (%)
Figure 151 Latin America Point of Care Diagnostics Market Forecast by Sample, 2023-2033 (US$ bn)
Figure 152 Latin America Point of Care Diagnostics Market Share Forecast by Sample, 2023 & 2033 (%)
Figure 153 Latin America Point of Care Diagnostics Market Forecast by Platform, 2023-2033 (US$ bn)
Figure 154 Latin America Point of Care Diagnostics Market Share Forecast by Platform, 2023 & 2033 (%)
Figure 155 Latin America Point of Care Diagnostics Market Forecast by End-users, 2023-2033 (US$ bn)
Figure 156 Latin America Point of Care Diagnostics Market Share Forecast by End-users, 2023 & 2033 (%)
Figure 157 Brazil Point of Care Diagnostics Market Forecast, 2023-2033 (US$ bn, AGR %)
Figure 158 Mexico Point of Care Diagnostics Market Forecast, 2023-2033 (US$ bn, AGR %)
Figure 159 Rest of Latin America Point of Care Diagnostics Market Forecast, 2023-2033 (US$ bn, AGR %)
Figure 160 MEA Point of Care Diagnostics Market Attractiveness Index
Figure 161 MEA Point of Care Diagnostics Market by Region, 2023, 2028 & 2033 (US$ bn)
Figure 162 MEA Point of Care Diagnostics Market Forecast by Country, 2023-2033 (US$ bn)
Figure 163 MEA Point of Care Diagnostics Market Share Forecast by Country, 2023 & 2033 (%)
Figure 164 MEA Point of Care Diagnostics Market Forecast By Product, 2023-2033 (US$ bn)
Figure 165 MEA Point of Care Diagnostics Market Share Forecast By Product, 2023 & 2033 (%)
Figure 166 MEA Point of Care Diagnostics Market Forecast by Mode, 2023-2033 (US$ bn)
Figure 167 MEA Point of Care Diagnostics Market Share Forecast by Mode, 2023 & 2033 (%)
Figure 168 MEA Point of Care Diagnostics Market Forecast by Sample, 2023-2033 (US$ bn)
Figure 169 MEA Point of Care Diagnostics Market Share Forecast by Sample, 2023 & 2033 (%)
Figure 170 MEA Point of Care Diagnostics Market Forecast by Platform, 2023-2033 (US$ bn)
Figure 171 MEA Point of Care Diagnostics Market Share Forecast by Platform, 2023 & 2033 (%)
Figure 172 MEA Point of Care Diagnostics Market Forecast by End-users, 2023-2033 (US$ bn)
Figure 173 MEA Point of Care Diagnostics Market Share Forecast by End-users, 2023 & 2033 (%)
Figure 174 GCC Point of Care Diagnostics Market Forecast, 2023-2033 (US$ bn, AGR %)
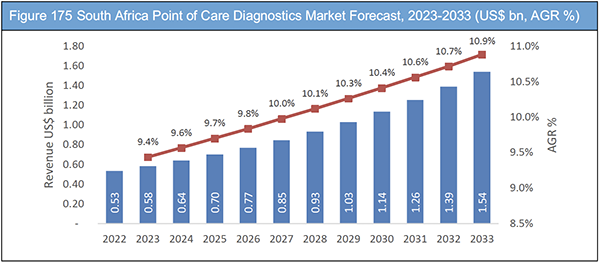
Figure 175 South Africa Point of Care Diagnostics Market Forecast, 2023-2033 (US$ bn, AGR %)
Figure 176 Rest of MEA Point of Care Diagnostics Market Forecast, 2023-2033 (US$ bn, AGR %)
Figure 177 Point of Care Diagnostics Market: Company Share/Ranking, 2021
Figure 178 Abbott: Net Revenue, 2017-2021 (US$ million, AGR%)
Figure 179 Abbott: R&D, 2017-2021 (US$ million, AGR%)
Figure 180 Abbott: Regional Market Shares, 2021
Figure 181 F. Hoffmann-La Roche Ltd: Net Revenue, 2017-2021 (US$ million, AGR%)
Figure 182 F. Hoffmann-La Roche Ltd: R&D, 2017-2021 (US$ million, AGR%)
Figure 183 F. Hoffmann-La Roche Ltd: Regional Market Shares, 2021
Figure 184 Quidel Corporation: Net Revenue, 2017-2021 (US$ million, AGR%)
Figure 185 Quidel Corporation: R&D, 2017-2021 (US$ million, AGR%)
Figure 186 Quidel Corporation: Regional Market Shares, 2021
Figure 187 Thermo Fisher Scientific.: Net Revenue, 2017-2021 (US$ million, AGR%)
Figure 188 Thermo Fisher Scientific.: R&D, 2017-2021 (US$ million, AGR%)
Figure 189 Thermo Fisher Scientific.: Regional Market Shares, 2021
Figure 190 BD: Net Revenue, 2017-2021 (US$ million, AGR%)
Figure 191 BD : R & D, 2017-2021 (US$ million, AGR%)
Figure 192 BD: Regional Market Shares, 2021
Figure 193 Danaher: Net Revenue, 2017-2021 (US$ million, AGR%)
Figure 194 Danaher: R&D, 2017-2021 (US$ million, AGR%)
Figure 195 Danaher: Regional Market Shares, 2021
Figure 196 Trinity Biotech Ireland: Net Revenue, 2017-2021 (US$ million, AGR%)
Figure 197 Trinity Biotech Ireland: Regional Market Shares, 2021
Figure 198 Siemens Healthcare GmbH: Net Revenue, 2017-2021 (US$ million, AGR%)
Figure 199 Siemens Healthcare GmbH: R&D, 2017-2021 (US$ million, AGR%)
Figure 200 Siemens Healthcare GmbH: Regional Market Shares, 2021
Figure 201 Chembio Diagnostics Inc.: Net Revenue, 2017-2021 (US$ million, AGR%)
Figure 202 Chembio Diagnostics Inc: R&D, 2017-2021 (US$ million, AGR%)
Figure 203 Chembio Diagnostics Inc.: Regional Market Shares, 2021
Figure 204 Werfen: Net Revenue, 2017-2021 (US$ million, AGR%)
Figure 205 Werfen: R&D, 2017-2021 (US$ million, AGR%)
Figure 206 Werfen: Regional Market Shares, 2021
Figure 207 Qiagen: Net Revenue, 2017-2021 (US$ million, AGR%)
Figure 208 Qiagen: R&D, 2017-2021 (US$ million, AGR%)
Figure 209 Qiagen: Regional Market Shares, 2021
Figure 210 bioMerieux SA: Net Revenue, 2017-2021 (US$ million, AGR%)
Figure 211 bioMerieux SA: R&D, 2017-2021 (US$ million, AGR%)
Figure 212 bioMerieux SA: Regional Market Shares, 2021
Figure 213 Nipro Europe Group Companies: Net Revenue, 2017-2021 (US$ million, AGR%)
Figure 214 Nipro Europe Group Companies: R&D, 2017-2021 (US$ million, AGR%)
Figure 215 Nipro Europe Group Companies: Regional Market Shares, 2021
Figure 216 EKF Diagnostics: Net Revenue, 2017-2021 (US$ million, AGR%)
Figure 217 EKF Diagnostics: Regional Market Shares, 2021
Figure 218 Orasure Technologies, Inc.: Net Revenue, 2017-2021 (US$ million, AGR%)
Figure 219 Orasure Technologies, Inc.: R&D, 2017-2021 (US$ million, AGR%)
Figure 220 Orasure Technologies, Inc.: Regional Market Shares, 2021
Figure 221 LumiraDX.: Net Revenue, 2019-2021 (US$ million, AGR%)
Figure 222 LumiraDX.: R&D, 2019-2021 (US$ million, AGR%)
Figure 223 Meridian Bioscience Inc..: Net Revenue, 2017-2021 (US$ million, AGR%)
Figure 224 Meridian Bioscience Inc..: R&D, 2017-2021 (US$ million, AGR%)
Figure 225 Meridian Bioscience Inc..: Regional Market Shares, 2021
List of Companies Profiled in the Report
Abbott
AccuBioTech Co., Ltd
BD
bioMerieux SA
Chembio Diagnostics, Inc.
Danaher
EKF Diagnostics
F. Hoffmann-La Roche Ltd
Fluxergy
LumiraDx
Meridian Bioscience
Nipro Europe Group Companies
Nova Biomedical
Orasure Technologies, Inc.
PTS Diagnostics
Qiagen
Quidel Corporation
Response Biomedical
Sekisui Diagnostics
Siemens Healthcare GmbH
Spectral Medical Inc.
Thermo Fisher Scientific Inc.
Trinity Biotech Ireland
Trividia Health, Inc.
Werfen
List of Other Companies Mentioned in the Report
Abaxis, Inc.
Accriva Diagnostics
Acon Laboratories, Inc.
Alere Inc.
Applied Biomedical
BHR Pharmaceuticals
Binx Health
Biomedomics
Biomeme, Inc.
Biomerieux
Bioptix, Inc.
BTNX
C2N Diagnostics
Church & Dwight Co. Inc.
Credo Diagnostics Biomedical
Curiosity Diagnostics
DexCom, Inc.
DiabetOmics
DNAe
DnaNudge
Dragerwerk Ag & Co. Kgaa
DRW Diagnostics for the Real World
Eiken Chemical Co Ltd.
Enigma Diagnostics, Ltd.
Enterix, Inc.
Exact Sciences
Gene Capture
Genedrive
Hangzhou AllTest Biotech
Helena Laboratories
Kaya17
Lifescan, Inc.
Luminostics
Lumos Diagnostics
Magellan Diagnostics
Mbio Diagnostics, Inc.
MedMira, Inc.
Menarini Diagnostics
Mesa Biotech
Micronics, Inc.
Nexus DX
Ortho Clinical Diagnostics
Quantumdx Group Limited
Radiometer Medical A/S
Rapid Diagnostics
Response Biomedical Corp
Rheonix, Inc.
Roswell Biotechnologies
RPS Diagnostics
Sandhill Crane Diagnostics
Veredus Laboratories Pte Ltd
Xagenic
List of Organizations Mentioned in the Report
American Association of Medical Colleges (AAMC)
Astar’s Genome Institute of Singapore (GIS)
Biocertis group
Biotechnology Industry Research Assistance Council (BIRAC)
Clinical Laboratory Improvement Amendments (CLIA)
Clinical Laboratory Improvement Amendments (CLIA)
Diagnostic Related Group (DRG)
Food and Drug Administration (FDA)
Indian Department of Biotechnology (DBT)
Indian institute of technology (IIT)
Indian Medical Device Industry (AIMED)
International Diabetes Federation (IDF)
International Organisation for Standardisation (ISO)
Joint United Nations Programme on HIV and AIDS (UNAIDS)
Nichirei Bioscience
The Bill & Melinda Gates Foundation
The Clinton Health Access Initiative (CHAI)
The Foundation for Innovative New Diagnostics (FIND)
U.S. India Science and Technology Endowment Fund (U.S. ISTEF)
World Health Organization (WHO)