Industries > Packaging > Paper Packaging Market Report 2018-2028
Paper Packaging Market Report 2018-2028
Forecasts by Type (Containerboard, Cartonboard, Flexible Packaging Paper, and Others), by Grade (Unbleached Kraft Paperboard, Bleached Paperboard, Recycled Paperboard, and Others), by End-User (Food and Beverage, Healthcare, Consumer Goods, Industrial, Retail, and Others) & by Region Plus Analysis of Leading Companies
Visiongain’s comprehensive new 209-page report reveals that the global paper packaging market will reach a value of $303.8 billion in 2018. As such paper packaging still dominates the packaging landscape in many consumer verticals and industrial applications due to its light weight and highly recyclable nature.
Are you involved in the paper packaging market or intend to be? If so, then you must read this report
It’s vital that you keep your knowledge up to date. You need this report.
Market scope: Paper based packaging originates from a paper or board mill where the paper or board is transformed into rolls or sheets. There are four main types of paper packaging that we categorize as submarkets: Corrugated Cases, Paperboard, Wrapping Paper and other. Our analysis includes all major end use submarkets such as food, healthcare, beverage, industrial, personal care and other consumer. Visiongain assesses how these four submarkets, six sub segments and the 20 largest national markets will evolve over the forecast period. The competitive landscape is further illustrated with examination of the 15 market leading companies.
The Paper Packaging Market Forecast Report 2018-2028 responds to your need for definitive market data:
• Where are the paper packaging market opportunities?
– 200+ charts, and graphs reveal market data allowing you to target your strategy more effectively
• When will the paper packaging market grow?
– Global, regional and paper packaging submarket forecasts and analysis from 2018-2028 illustrate the market progression
• Where are the regional paper packaging market opportunities from 2018-2028?
– Focused regional forecasts and analysis explore the future opportunities
– North America
– US
– Canada
– Mexico
– Latin America
– Brazil
– Argentina
– Chile
– Asia Pacific
– China
– Japan
– India
– South Korea
– Australia
– Europe
– Germany
– France
– UK
– Italy
– Spain
– Russia
– Middle East and Africa
– UAE
– Egypt
– South Africa
• What are the factors influencing paper packaging market dynamics?
– Economic growth in developing and emerging countries
– Lifestyle trends
– Growth in middle class disposable income
– Rising consumer awareness regarding environment condition
– Increasing demand for packaged food
– Ban on lightweight plastic bags
• Who are the leading 10 paper packaging companies?
– BillerudKorsnäs
– Cascades
– DS Smith
– International Paper Company
– Mondi Group
– WestRock
– Tetra Pak
– ITC Limited
– Clearwater Paper Corporation
– Amcor Limited
• Who should read this report?
– Paper Manufacturers
– Packaging Companies
– Chemical / pulp Processing Companies
– Retailers
– NPD Specialists
– Packaging Engineers
– Recycling Companies
– Business development managers
– Marketing managers
– Suppliers
– Manufacturers
– Investors
– Banks
– Government agencies
Get our report today Paper Packaging Market Report 2018-2028: Forecasts by Type (Containerboard, Cartonboard, Flexible Packaging Paper, and Others), by Grade (Unbleached Kraft Paperboard, Bleached Paperboard, Recycled Paperboard, and Others), by End-User (Food and Beverage, Healthcare, Consumer Goods, Industrial, Retail, and Others) & by Region Plus Analysis of Leading Companies. Avoid missing out – order our report now.
Visiongain is a trading partner with the US Federal Government
CCR Ref number: KD4R6
1.1 Market Definition and Research Scope
1.2 Why you should read this report
1.3 Key Questions Answered by This Analytical Report
1.4 Who is This Report for?
1.5 Methodology
1.6 Frequently Asked Questions (FAQ)
1.7 Associated Visiongain Reports
1.8 About Visiongain
2. Introduction to The Paper Packaging Market
2.1 What is Paper Packaging?
2.2 Types of Paper Used for Packaging
2.3 Types of Paperboard Used in Packaging
2.4 The Advantages of Paper Packaging
2.5 Alternatives to Paper Packaging
2.5.1 Plastic Packaging
2.5.2 Metal Packaging
2.5.3 Glass Packaging
2.5.4 Mixed Materials Packaging
3. Analysis of the Paper Packaging Market 2018-2028
3.1 Factors Driving the Demand of Paper Packaging
3.2 Challenges in the Paper Packaging Market
3.3 paper Packaging Market Trends and Developments
3.4 Performance of Paper Packaging Market Over the Next 10 Years
4. Paper Packaging: Global Market by Type 2018-2028
4.1 Containerboard Packaging Market Forecast and Analysis 2018-2028
4.1.1 Market Trends
4.1.2 Driving Factors and Opportunities
4.2 Cartonboard Packaging market Forecast and Analysis 2018-2028
4.2.1 Market Trends
4.2.2 Driving Factors and Opportunities
4.3 Flexible Packaging Paper Market Forecast and Analysis 2018-2028
4.3.1 Market Trends
4.3.2 Driving Factors and opportunities
4.4 Other Packaging Paper Market Forecast and Analysis 2018-2028
5. Paper Packaging: Global Market by Grade 2018-2028
5.1 Unbleached Kraft paperboard Packaging Market Forecast and Analysis 2018-2028
5.1.1 Market Trends
5.1.2 Driving Factors and Opportunities
5.2 Bleached Paperboard Packaging Market Forecast and Analysis 2018-2028
5.2.1 Market Trends
5.2.2 Driving Factors and Opportunities
5.3 Recycled Paperboard Packaging Market Forecast and Analysis 2018-2028
5.3.1 Market Trends
5.3.2 Driving Factors and Opportunities
5.4 Other Grades paper Packaging Market Forecast and Analysis 2018-2028
6. Paper Packaging: Global Market by End-User 2018-2028
6.1 Food and Beverage Paper Packaging Market Forecast and Analysis 2018 – 2028
6.2 Healthcare Paper Packaging Market Forecast and Analysis 2018-2028
6.3 Consumer Goods Paper Packaging Market Forecast and Analysis 2018-2028
6.4 Industrial Paper Packaging Market Forecast and Analysis 2018-2028
6.5 Retail Paper Packaging Market Forecast and Analysis 2018-2028
6.6 Other End-User Paper Packaging Market Forecast and Analysis 2018-2028
7. North America Paper Packaging Market Forecasts, 2018-2028
7.1 U.S. Paper Packaging Market Forecast and Analysis, 2018-2028
7.2 Canadian Paper Packaging Market Forecast and Analysis, 2018-2028
7.3 Mexico Paper Packaging Market Forecast and Analysis, 2018-2028
8. Europe Paper Packaging Market Forecasts 2018-2028
8.1 UK Paper Packaging Market Forecast and Analysis, 2018-2028
8.2 France Paper Packaging Market Forecast and Analysis, 2018-2028
8.3 Germany Paper Packaging Market Forecast and Analysis, 2018-2028
8.4 Spain Paper Packaging Market Forecast and Analysis, 2018-2028
8.5 Italy Paper Packaging Market Forecast and Analysis, 2018-2028
8.6 Russia Paper Packaging Market Forecast and Analysis, 2018-2028
8.7 Rest of Europe Paper Packaging Market Forecast and Analysis, 2018-2028
9. Asia-Pacific Paper Packaging Market, 2018-2028
9.1 China Paper Packaging Market Forecast and Analysis, 2018-2028
9.2 Japan Paper Packaging Market Forecast and Analysis, 2018-2028
9.3 India Paper Packaging Market Forecast and Analysis, 2018-2028
9.4 South Korea Paper Packaging Market Forecast and Analysis, 2018-2028
9.5 Australia Paper Packaging Market Forecast and Analysis, 2018-2028
9.6 Rest of Asia-Pacific Paper Packaging Market Forecast and Analysis, 2018-2028
10. Latin America Paper Packaging Market, 2018-2028
10.1 Brazil Paper Packaging Market Forecast and Analysis, 2018-2028
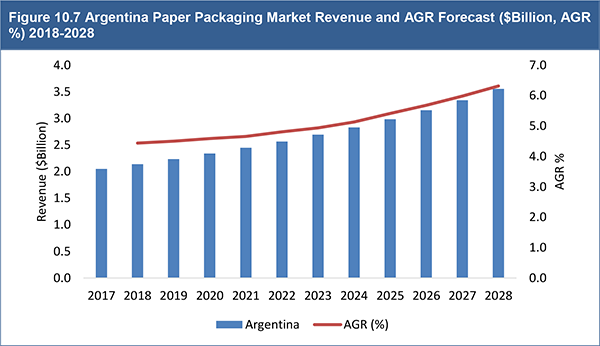
10.2 Argentina Paper Packaging Market Forecast and Analysis, 2018-2028
10.3 Chile Paper Packaging Market Forecast and Analysis, 2018-2028
10.4 Rest of Latin America Paper Packaging Market Forecast and Analysis, 2018-2028
11. Middle East and Africa Paper Packaging Market, 2018-2028
11.1 UAE Paper Packaging Market Forecast and Analysis, 2018-2028
11.2 Egypt Paper Packaging Market Forecast and Analysis, 2018-2028
11.3 South Africa Paper Packaging Market Forecast and Analysis, 2018-2028
11.4 Rest of Middle East and Africa Paper Packaging Market Forecast and Analysis, 2018-2028
12. Leading Companies in the Paper Packaging Market
12.1 DS Smith PLC
12.1.1 Company Overview
12.1.2 Company Performance
12.1.3 Recent Developments
12.2 Mondi Group
12.2.1 Company Overview
12.2.2 Company Performance
12.2.3 Recent Developments
12.3 WestRock Company
12.3.1 Company Overview
12.3.2 Company Performance
12.3.3 Recent Developments
12.4 International Paper Company
12.4.1 Company Overview
12.4.2 Company Performance
12.4.3 Recent Developments
12.5 Clearwater Paper Corporation
12.5.1 Company Overview
12.5.2 Company Performance
12.5.3 Recent Developments
12.6 Amcor Limited
12.6.1 Company Overview
12.6.2 Company Performance
12.6.3 Recent Developments
12.7 Cascades Inc.
12.7.1 Company Overview
12.7.2 Company Performance
12.7.3 Recent Developments
12.8 Tetra Pak
12.8.1 Company Overview
12.8.2 Company Performance
12.8.3 Recent Developments
12.9 ITC Limited
12.9.1 Company Overview
12.9.2 Company Performance
12.9.3 Recent Developments
12.10 BillerudKorsnäs
12.10.1 Company Overview
12.10.2 Company Performance
12.10.3 Recent Developments
12.11 Other Paper Packaging Companies
13. Conclusion
13.1 Leading Segments in the Global Paper Packaging Market
13.2 Leading Companies in the Global Paper Packaging Market
13.3 Leading Regional Markets in the Global Paper Packaging Market
13.4 Emerging Segments in the Global Paper Packaging Market
13.5 The Future of Paper Packaging Market
List of Tables
Table 3.1 Global Paper Packaging Market Forecast 2017-2028 ($billion, AGR %, CAGR%, Cumulative)
Figure 3.2 Global Paper Packaging Market Forecast 2018-2028 ($bn, AGR%)
Table 4.1 Global Paper Packaging Market Revenue Forecast by Type 2018-2028 ($billion)
Table 4.2 Global Paper Packaging Market Revenue CAGR Forecast, by Type, (%) 2018-2023, 2023-2028, 2018-2028
Table 4.3 Global Containerboard Packaging Market Forecast, by Region, ($bn, AGR%) 2018-2028
Table 4.4 Global Containerboard Packaging Market Forecast, by Region, ($bn, AGR%) 2018-2028
Table 4.5 Global Cartonboard Packaging Market Forecast, by Region, ($bn, AGR%) 2018-2028
Table 4.6 Global Cartonboard Packaging Market Forecast, by Region, ($bn, AGR%) 2018-2028
Table 4.7 Global Flexible Packaging Paper Market Forecast, by Region, ($bn, AGR%) 2018-2028
Table 4.8 Global Flexible Packaging Paper Market Forecast, by Region, ($bn, AGR%) 2018-2028
Table 4.9 Global Other Packaging Paper Market Forecast, by Region, ($bn, AGR%) 2018-2028
Table 4.10 Global Other Packaging Paper Market Forecast, by Region, ($bn, AGR%) 2018-2028
Table 5.1 Global Paper Packaging Market Revenue Forecast by Grade 2018-2028 ($billion)
Table 5.2 Global Paper Packaging Market Revenue CAGR Forecast, by Grade, (%) 2018-2023, 2023-2028, 2018-2028
Table 5.3 Global Unbleached Kraft Paperboard Market Forecast, by Region, ($bn, AGR%) 2018-2028
Table 5.4 Global Unbleached Kraft Paperboard Market Forecast, by Region, ($bn, AGR%) 2018-2028
Table 5.5 Global Bleached Paperboard Market Forecast, by Region, ($bn, AGR%) 2018-2028
Table 5.6 Global Bleached Paperboard Market Forecast, by Region, ($bn, AGR%) 2018-2028
Table 5.7 Global Recycled Paperboard Market Forecast, by Region, ($bn, AGR%) 2018-2028
Table 5.8 Global Recycled Paperboard Market Forecast, by Region, ($bn, AGR%) 2018-2028
Table 5.9 Global Other Paper Market Forecast, by Region, ($bn, AGR%) 2018-2028
Table 5.10 Global Other Paper Market Forecast, by Region, ($bn, AGR%) 2018-2028
Table 6.1 Global Paper Packaging Market Revenue Forecast by End-User 2018-2028 ($billion)
Table 6.2 Global Paper Packaging Market Revenue CAGR Forecast, by End-User, (%) 2018-2023, 2023-2028, 2018-2028
Table 6.3 Global Food and Beverage Paper Packaging Market Forecast, by Region, ($bn, AGR%) 2018-2028
Table 6.4 Global Food and Beverage Paper Packaging Market Forecast, by Region, ($bn, AGR%) 2018-2028
Table 6.5 Global Healthcare Paper Packaging Market Forecast, by Region, ($bn, AGR%) 2018-2028
Table 6.6 Global Healthcare Paper Packaging Market Forecast, by Region, ($bn, AGR%) 2018-2028
Table 6.7 Global Consumer Goods Paper Packaging Market Forecast, by Region, ($bn, AGR%) 2018-2028
Table 6.8 Global Consumer Goods Paper Packaging Market Forecast, by Region, ($bn, AGR%) 2018-2028
Table 6.9 Global Industrial Paper Packaging Market Forecast, by Region, ($bn, AGR%) 2018-2028
Table 6.10 Global Industrial Paper Packaging Market Forecast, by Region, ($bn, AGR%) 2018-2028
Table 6.11 Global Retail Paper Packaging Market Forecast, by Region, ($bn, AGR%) 2018-2028
Table 6.12 Global Retail Paper Packaging Market Forecast, by Region, ($bn, AGR%) 2018-2028
Table 6.13 Global Other Industries Paper Packaging Market Forecast, by Region, ($bn, AGR%) 2018-2028
Table 6.14 Global Other Industries Paper Packaging Market Forecast, by Region, ($bn, AGR%) 2018-2028
Table 7.1 North America Paper Packaging Market Revenue Forecast by Country 2018-2028 ($billion)
Table 7.2 North America Paper Packaging Market Revenue CAGR Forecast, by Country, (%) 2018-2023, 2023-2028, 2018-2028
Table 7.3 U.S. Paper Packaging Market Forecast, ($bn, AGR%) 2018-2028
Table 7.4 Canada Paper Packaging Market Forecast, ($bn, AGR%) 2018-2028
Table 7.5 Mexico Paper Packaging Market Forecast, ($bn, AGR%) 2018-2028
Table 8.1 Europe Paper Packaging Market Revenue Forecast by Country 2018-2028 ($billion)
Table 8.2 Europe Paper Packaging Market Revenue CAGR Forecast, by Country, (%) 2018-2023, 2023-2028, 2018-2028
Table 8.3 UK Paper Packaging Market Forecast, ($bn, AGR%) 2018-2028
Table 8.4 France Paper Packaging Market Forecast, ($bn, AGR%) 2018-2028
Table 8.5 Germany Paper Packaging Market Forecast, ($bn, AGR%) 2018-2028
Table 8.6 Spain Paper Packaging Market Forecast, ($bn, AGR%) 2018-2028
Table 8.7 Italy Paper Packaging Market Forecast, ($bn, AGR%) 2018-2028
Table 8.8 Russia Paper Packaging Market Forecast, ($bn, AGR%) 2018-2028
Table 8.9 Rest of Europe Paper Packaging Market Forecast, ($bn, AGR%) 2018-2028
Table 9.1 Asia-Pacific Paper Packaging Market Revenue Forecast by Country 2018-2028 ($billion)
Table 9.2 Asia-Pacific Paper Packaging Market Revenue CAGR Forecast, by Country, (%) 2018-2023, 2023-2028, 2018-2028
Table 9.3 China Paper Packaging Market Forecast, ($bn, AGR%) 2018-2028
Table 9.4 Japan Paper Packaging Market Forecast, ($bn, AGR%) 2018-2028
Table 9.5 India Paper Packaging Market Forecast, ($bn, AGR%) 2018-2028
Table 9.6 South Korea Paper Packaging Market Forecast, ($bn, AGR%) 2018-2028
Table 9.7 Australia Paper Packaging Market Forecast, ($bn, AGR%) 2018-2028
Table 9.8 Rest of Asia-Pacific Paper Packaging Market Forecast, ($bn, AGR%) 2018-2028
Table 10.1 Latin America Paper Packaging Market Revenue Forecast by Country 2018-2028 ($billion)
Table 10.2 Latin America Paper Packaging Market Revenue CAGR Forecast, by Country, (%) 2018-2023, 2023-2028, 2018-2028
Table 10.3 Brazil Paper Packaging Market Forecast, ($bn, AGR%) 2018-2028
Table 10.4 Argentina Paper Packaging Market Forecast, ($bn, AGR%) 2018-2028
Table 10.5 Chile Paper Packaging Market Forecast, ($bn, AGR%) 2018-2028
Table 10.6 Rest of Latin America Paper Packaging Market Forecast, ($bn, AGR%) 2018-2028
Table 11.1 Middle East and Africa Paper Packaging Market Revenue Forecast by Country 2018-2028 ($billion)
Table 11.2 Middle East and Africa Paper Packaging Market Revenue CAGR Forecast, by Country, (%) 2018-2023, 2023-2028, 2018-2028
Table 11.3 UAE Paper Packaging Market Forecast, ($bn, AGR%) 2018-2028
Table 11.4 Egypt Paper Packaging Market Forecast, ($bn, AGR%) 2018-2028
Table 11.5 South Africa Paper Packaging Market Forecast, ($bn, AGR%) 2018-2028
Table 11.6 Rest of Middle East and Africa Paper Packaging Market Forecast, ($bn, AGR%) 2018-2028
Table 12.1 Other Paper Packaging Companies
List of Figures
Figure 1.1 Leading Players in the Global Paper Packaging Market
Figure 1.2 Market Segmentation of Global Paper Packaging Market
Figure 2.1 Recycling Rates across Countries, %, 2017
Figure 2.2 Alternatives to Paper Packaging by Type, % Share, 2017
Figure 3.1 Top 10 Countries E-Retail as Share of Total Retail, % Share, 2017-18
Figure 3.2 CEPI Utilisation of Paper for Recycling by Country, %Share, 2016
Figure 4.1 Global Paper Packaging Market Segmentation by Type
Figure 4.2 Global Paper Packaging Market, by Type, Revenue Forecast ($bn) 2018-2028
Figure 4.3 Global Paper Packaging Market, by Type, Revenue AGR Forecast (AGR %) 2018-2028
Figure 4.4 Global Containerboard Packaging Market Revenue and AGR Forecast ($Billion, AGR %) 2018-2028
Figure 4.5 Global Containerboard Packaging Market Forecast, by Region, ($bn) 2018-2028
Figure 4.6 Global Cartonboard Packaging Market Revenue and AGR Forecast ($Billion, AGR %) 2018-2028
Figure 4.7 Global Cartonboard Packaging Market Forecast, by Region, ($bn) 2018-2028
Figure 4.8 Global Flexible Packaging Paper Market Revenue and AGR Forecast ($Billion, AGR %) 2018-2028
Figure 4.9 Global Flexible Packaging Paper Market Forecast, by Region, ($bn) 2018-2028
Figure 4.10 Global Other Packaging Paper Market Revenue and AGR Forecast ($Billion, AGR %) 2018-2028
Figure 4.11 Global Other Packaging Paper Market Forecast, by Region, ($bn) 2018-2028
Figure 5.1 Global Paper Packaging Market Segmentation by Grade
Figure 5.2 Global Paper Packaging Market, by Grade, Revenue Forecast ($bn) 2018-2028
Figure 5.3 Global Paper Packaging Market, by Grade, Revenue AGR Forecast (AGR %) 2018-2028
Figure 5.4 Global Unbleached Kraft Paperboard Market Revenue and AGR Forecast ($Billion, AGR %) 2018-2028
Figure 5.5 Global Unbleached Kraft Paperboard Market Forecast, by Region, ($bn) 2018-2028
Figure 5.6 Global Bleached Paperboard Market Revenue and AGR Forecast ($Billion, AGR %) 2018-2028
Figure 5.7 Global Bleached Paperboard Market Forecast, by Region, ($bn) 2018-2028
Figure 5.8 Global Recycled Paperboard Market Revenue and AGR Forecast ($Billion, AGR %) 2018-2028
Figure 5.9 Global Recycled Paperboard Market Forecast, by Region, ($bn) 2018-2028
Figure 5.10 Global Other Paper Market Revenue and AGR Forecast ($Billion, AGR %) 2018-2028
Figure 5.11 Global Other Paper Market Forecast, by Region, ($bn) 2018-2028
Figure 6.1 Global Paper Packaging Market Segmentation by End-User
Figure 6.2 Global Paper Packaging Market, by End-User, Revenue Forecast ($bn) 2018-2028
Figure 6.3 Global Paper Packaging Market, by End-User, Revenue AGR Forecast (AGR %) 2018-2028
Figure 6.4 Global Food and Beverage Paper Packaging Market Revenue and AGR Forecast ($Billion, AGR %) 2018-2028
Figure 6.5 Global Food and Beverage Paper Packaging Market Forecast, by Region, ($bn) 2018-2028
Figure 6.6 Global Healthcare Paper Packaging Market Revenue and AGR Forecast ($Billion, AGR %) 2018-2028
Figure 6.7 Global Healthcare Paper Packaging Market Forecast, by Region, ($bn) 2018-2028
Figure 6.8 Global Consumer Goods Paper Packaging Market Revenue and AGR Forecast ($Billion, AGR %) 2018-2028
Figure 6.9 Global Consumer Goods Paper Packaging Market Forecast, by Region, ($bn) 2018-2028
Figure 6.10 Global Industrial Paper Packaging Market Revenue and AGR Forecast ($Billion, AGR %) 2018-2028
Figure 6.11 Global Industrial Paper Packaging Market Forecast, by Region, ($bn) 2018-2028
Figure 6.12 Global Retail Paper Packaging Market Revenue and AGR Forecast ($Billion, AGR %) 2018-2028
Figure 6.13 Global Retail Paper Packaging Market Forecast, by Region, ($bn) 2018-2028 Figure 6.14 Global Other Industries Paper Packaging Market Revenue and AGR Forecast ($Billion, AGR %) 2018-2028
Figure 6.15 Global Other End-Users Paper Packaging Market Forecast, by Region, ($bn) 2018-2028
Figure 7.1 North America Paper Packaging Market Revenue Share (%) by Country, 2017
Figure 7.2 North America Paper Packaging Market Revenue Share (%) by Country, 2023
Figure 7.3 North America Paper Packaging Market Revenue Share (%) by Country, 2028
Figure 7.4 North America Paper Packaging Market, by Country, Revenue Forecast ($bn) 2018-2028
Figure 7.5 North America Paper Packaging Market, by Country, Revenue AGR Forecast (AGR %) 2018-2028
Figure 7.6 Paper and paperboard Recovery in U.S., 2012-2017
Figure 7.7 U.S. Paper Packaging Market Revenue and AGR Forecast ($Billion, AGR %) 2018-2028
Figure 7.8 Canadian Mill Average Recycled Content of Paper Packaging (Domestic Shipments, 2016)
Figure 7.9 Canada Average Recycled Content by Percent, 2016
Figure 7.10 Canada Paper Packaging Market Revenue and AGR Forecast ($Billion, AGR %) 2018-2028
Figure 7.11 Mexico Paper Packaging Market Revenue and AGR Forecast ($Billion, AGR %) 2018-2028
Figure 8.1 Europe Paper Packaging Market Revenue Share (%) by Country, 2017
Figure 8.2 Europe Paper Packaging Market Revenue Share (%) by Country, 2023
Figure 8.3 Europe Paper Packaging Market Revenue Share (%) by Country, 2028
Figure 8.4 Europe Paper Packaging Market, by Country, Revenue Forecast ($bn) 2018-2028
Figure 8.5 Europe Paper Packaging Market, by Country, Revenue AGR Forecast (AGR %) 2018-2028
Figure 8.6 Europe Paper & Board Production by Country, %Share, 2016
Figure 8.7 Europe Production Capacity of Paper & Board, (000 Tonnes)
Figure 8.8 UK Paper Packaging Market Revenue and AGR Forecast ($Billion, AGR %) 2018-2028
Figure 8.9 France Paper Packaging Market Revenue and AGR Forecast ($Billion, AGR %) 2018-2028
Figure 8.10 Germany Paper Packaging Market Revenue and AGR Forecast ($Billion, AGR %) 2018-2028
Figure 8.11 Spain Paper Packaging Market Revenue and AGR Forecast ($Billion, AGR %) 2018-2028
Figure 8.12 Italy Paper Packaging Market Revenue and AGR Forecast ($Billion, AGR %) 2018-2028
Figure 8.13 Russia Paper Packaging Market Revenue and AGR Forecast ($Billion, AGR %) 2018-2028
Figure 8.14 Rest of Europe Paper Packaging Market Revenue and AGR Forecast ($Billion, AGR %) 2018-2028
Figure 9.1 Asia-Pacific Paper Packaging Market Revenue Share (%) by Country, 2018
Figure 9.2 Asia-Pacific Paper Packaging Market Revenue Share (%) by Country, 2023
Figure 9.3 Asia-Pacific Paper Packaging Market Revenue Share (%) by Country, 2028
Figure 9.4 Asia-Pacific Paper Packaging Market, by Country, Revenue Forecast ($bn) 2018-2028
Figure 9.5 Asia-Pacific Paper Packaging Market, by Country, Revenue AGR Forecast (AGR %) 2018-2028
Figure 9.6 China Paper Packaging Market Revenue and AGR Forecast ($Billion, AGR %) 2018-2028
Figure 9.7 Japan Paper Packaging Market Revenue and AGR Forecast ($Billion, AGR %) 2018-2028
Figure 9.8 India Paper Packaging Market Revenue and AGR Forecast ($Billion, AGR %) 2018-2028
Figure 9.9 South Korea Paper Packaging Market Revenue and AGR Forecast ($Billion, AGR %) 2018-2028
Figure 9.10 Australia Paper Packaging Market Revenue and AGR Forecast ($Billion, AGR %) 2018-2028
Figure 9.11 Rest of Asia-Pacific Paper Packaging Market Revenue and AGR Forecast ($Billion, AGR %) 2018-2028
Figure 10.1 Latin America Paper Packaging Market Revenue Share (%) by Country, 2017
Figure 10.2 Latin America Paper Packaging Market Revenue Share (%) by Country, 2023
Figure 10.3 Latin America Paper Packaging Market Revenue Share (%) by Country, 2028
Figure 10.4 Latin America Paper Packaging Market, by Country, Revenue Forecast ($bn) 2018-2028
Figure 10.5 Latin America Paper Packaging Market, by Country, Revenue AGR Forecast (AGR %) 2018-2028
Figure 10.6 Brazil Paper Packaging Market Revenue and AGR Forecast ($Billion, AGR %) 2018-2028
Figure 10.7 Argentina Paper Packaging Market Revenue and AGR Forecast ($Billion, AGR %) 2018-2028
Figure 10.8 Chile Paper Packaging Market Revenue and AGR Forecast ($Billion, AGR %) 2018-2028
Figure 10.9 Rest of Latin America Paper Packaging Market Revenue and AGR Forecast ($Billion, AGR %) 2018-2028
Figure 11.1 Middle East and Africa Paper Packaging Market Revenue Share (%) by Country, 2018
Figure 11.2 Middle East and Africa Paper Packaging Market Revenue Share (%) by Country, 2023
Figure 11.3 Middle East and Africa Paper Packaging Market Revenue Share (%) by Country, 2028
Figure 11.4 Middle East and Africa Paper Packaging Market, by Country, Revenue Forecast ($bn) 2018-2028
Figure 11.5 Middle East and Africa Paper Packaging Market, by Country, Revenue AGR Forecast (AGR %) 2018-2028
Figure 11.6 UAE Paper Packaging Market Revenue and AGR Forecast ($Billion, AGR %) 2018-2028
Figure 11.7 Egypt Paper Packaging Market Revenue and AGR Forecast ($Billion, AGR %) 2018-2028
Figure 11.8 South Africa Paper Packaging Market Revenue and AGR Forecast ($Billion, AGR %) 2018-2028
Figure 11.9 Rest of Middle East and Africa Paper Packaging Market Revenue and AGR Forecast ($Billion, AGR %) 2018-2028
Figure 12.1 Business Performance of DS Smith PLC, 2015-2017, $Mn
Figure 12.2 Business Performance of DS Smith PLC, By Business Segments, 2017, %share
Figure 12.3 Business Performance of DS Smith PLC, By Geography, 2017, %share
Figure 12.4 DS Smith Corrugated Packaging Customers by Volume, 2017, %Share
Figure 12.5 Business Performance of Mondi Group, 2015-2017, $Mn
Figure 12.6 Business Performance of Mondi Group, By Business Segment, 2017, %share, External Revenue
Figure 12.7 Business Performance of Mondi Group, By Geography (Location of Production), 2017, %share, External Revenue
Figure 12.8 Business Performance of Mondi Group, By Geography (Location of Customer), 2017, %share, External Revenue
Figure 12.9 Business Performance of WestRock Company, 2015-2017, $Mn
Figure 12.10 Business Performance of WestRock Company, By Business Segment, 2017, %share
Figure 12.11 Business Performance of International Paper Company, 2015-2017, $Mn
Figure 12.12 Business Performance of International Paper Company, By Business Segment, 2017, %share
Figure 12.13 Business Performance of International Paper Company, By Geography Segment, 2017, %share
Figure 12.14 Business Performance of Clearwater Paper Corporation, 2015-2017, $Mn
Figure 12.15 Business Performance of Clearwater Paper Corporation, By Business Segment, 2017, %share
Figure 12.16 Business Performance of Clearwater Paper Corporation, By Geographic Segment, 2017, %share
Figure 12.17 Business Performance of Amcor Limited, 2015-2017, $Mn
Figure 12.18 Business Performance of Amcor Limited, By Business Segment, 2017, %share
Figure 12.19 Business Performance of Amcor Limited, By Geography Segment, 2017, %share
Figure 12.20 Business Performance of Amcor Limited, By Product Segment, 2017, %share
Figure 12.21 Business Performance of Cascades Inc., 2015-2017, $Mn
Figure 12.22 Business Performance of Cascades Inc., By Business Segment, 2017, %share
Figure 12.23 Business Performance of Cascades Inc., By Geography Segment (From Geographic Region), 2017, %share
Figure 12.24 Business Performance of Cascades Inc., By Geography Segment (To Geographic Region), 2017, %share
Figure 12.25 Business Performance of Tetra Pak, 2015-2017, $Mn
Figure 12.26 Business Performance of Tetra Pak, By Business Segment, 2017, %share
Figure 12.27 Business Performance of Tetra Pak, By Geography Segment, 2017, %share
Figure 12.28 Business Performance of ITC Limited, 2015-2017, $Mn
Figure 12.29 Business Performance of ITC Limited, Ltd., By Business Segment, 2017, %share
Figure 12.30 Business Performance of ITC Limited., By Geographic Segment, 2017, %share
Figure 12.31 Business Performance of BillerudKorsnäs, 2015-2017, $Mn
Figure 12.32 Business Performance of BillerudKorsnäs, By Business Segment, 2017, %share
Figure 12.33 Business Performance of BillerudKorsnäs, By Geographic Segment, 2017, %share
Figure 13.1 Distribution of Paper Types in Paper Packaging Market, 2017, %share
Figure 13.2 Distribution of Grades in Global Paper Packaging Market, 2017, %share
Figure 13.3 Distribution of End-Users in Global Paper Packaging Market, 2017, %share
Figure 13.4 Regional Distribution of the Global Paper Packaging Market, 2017, %share
Alusa
Amazon
Amcor
Appvion Inc.
Arauco
Arctic Paper
Asia Paper Manufacturing Co., Ltd.
Ballarpur Industries
BillerudKorsnäs
BioPappel
Birchbox
Canfor
Cascades Inc.
Cascades Sonoco
Cenveo Packaging
Cheng Loong
Clearwater Paper Corporation
Combined Container Industries LLC
Conifex Timber Inc.
Daiken
Daio Paper
Domtar
DS Smith
Duratex
EUROPAC
Excelsior
Glatfelter
Gopaca
Graphic Packaging
Grupo Lantero
Hankuk Paper
HannaPak
Heinzel Holding
Hengan International
Hokuetsu Paper
Holmen
Holmen Paper
Illumination Entertainment
Interfor
International Paper Company
Island Container Corp.
ITC Limited
JK Paper Ltd.
KapStone Paper and Packaging Corporation
Kimberly-Clark
Klabin
KSP
Lee & Man Paper
Lenzing
Louisiana-pacific
Manchester Industries
Masisa
Mayr-Melnhof Karton
Mercer International
Metsaliitto
Mitsubishi Paper
Moelven
Mondi Group
Moorim Group
Nine Dragons Paper Holdings
Nippon Paper
Norbord
Nordic Packaging and Container Holdings
Octabins
Oji Paper
Packaging corp of America
Packaging INDIA Private Limited (PIPL)
Paperlinx
Plum Creek Timber
Portucel
Potlach
Powerflute
Puma
PWC
Rayonier
Rengo
Reni De Medici
Royal Vaassen Flexible Packaging
Sappi
SCG Packaging
Schneider Electric
Setra group
Shan Dong Sun Paper
Shandong Chenming
Shandong Huatai paper
Silenta Group Oy
Smurfit Kappa
Sonae Industria
Sonoco Products Company
Stora Enso
Sumitomo Forestry
Sveaskog
Tembec
Tencorr Holdings
Tetra Pak
Tetra Pak Artistry
The Lecta Group
The Pack Corporation
Tomoku
Unicharm
Universal Pictures
UPM-Kymmene
Uralplastic
Verso Paper Holdings
Victory Packaging
Western Forest Products
WestRock Company
Weyerhaeuser
Organisations Mentioned in This Report
The National Consortium of Packaging
The American Forest & Paper Association
Corrugated Container Corporation (CCC)
Confederation of European Paper Industries (CEPI)
Download sample pages
Complete the form below to download your free sample pages for Paper Packaging Market Report 2018-2028
Related reports
-
Healthcare Packaging Market Report 2018-2028
The latest report from business intelligence provider Visiongain offers comprehensive analysis of the global healthcare packaging market. Visiongain assesses that...
Full DetailsPublished: 03 April 2018 -

Cosmetics Packaging Market Forecast 2018-2028
The global cosmetics packaging market is expected to be driven by a multitude of factors such as increasingly busy lifestyles...
Full DetailsPublished: 01 May 2018 -
Personal Care Packaging Market Report 2018-2028
The global personal care packaging market is expected to reach $28.1bn in 2018 and develop dynamically over the forecast period,...Full DetailsPublished: 03 August 2018 -
Recycled Packaging Materials Market Report 2018-2028
Developments in recycled packaging materials have had a significant impact on the recycled packaging materials market. Visiongain’s report on this...
Full DetailsPublished: 24 January 2018 -

Global Food Packaging Equipment Market 2018-2028
Visiongain comprehensive new 122-page report assesses that the global food packaging equipment market will be valued at $16bn in 2017....Full DetailsPublished: 01 February 2018 -

Glass Packaging Market 2018-2028
Visiongain has calculated that the global Glass Packaging Market will see a capital expenditure (CAPEX) of $58.98 bn in 2018....
Full DetailsPublished: 20 February 2018 -

Pharmaceutical Packaging Market Report 2018-2028
Visiongain’s definitive new report assesses that the pharmaceutical packaging market will exceed $94bn in 2018. ...Full DetailsPublished: 09 October 2018 -
Tobacco Packaging Market Report 2020-2030
Visiongain has forecasted that the global tobacco packaging market will see a revenue of $16,059 million in 2020.
...Full DetailsPublished: 20 January 2020 -
PET Packaging Market Forecast 2018-2028
Visiongain’s definitive new report assesses that the PET Packaging market will exceed $56bn in 2017.
...Full DetailsPublished: 12 December 2017 -
Healthcare Packaging Market Report 2017-2027
The latest report from business intelligence provider Visiongain offers comprehensive analysis of the global healthcare packaging market. Visiongain assesses that...
Full DetailsPublished: 24 October 2017
Download sample pages
Complete the form below to download your free sample pages for Paper Packaging Market Report 2018-2028
Do you have any custom requirements we can help you with?
Any specific country, geo region, market segment or specific company information?
Email us today, we can discuss your needs and see how we can help: jamie.roberts@visiongain.com
Would you like a free report overview of the report of your choice?
If so, please drop an email to Jamie Roberts stating your chosen report title to jamie.robertsvisiongain.com
Visiongain packaging related reports are compiled using a broad and rich mixture of both primary and secondary information to produce an overall industry outlook. In order to provide our clients with the best product possible product, visiongain analysts reach out to market-leading vendors and industry experts but also review a wealth of financial data and product information from a vast range of sources. To find out more about our reports methodology, please email jamie.roberts@visiongain.com
Would you like to get the latest Visiongain packaging reports catalogue?
What are the dynamic growth sectors? where are the regional business opportunities?
Which technologies will prevail and who are the leading companies succeeding in these sectors and why?
If you want definitive answers to business critical questions, discover Visiongain’s full range of business intelligence reports.
If so, please email Jamie Roberts on jamie.roberts@visiongain.com or call her today on +44 207 336 6100
Adhesive & Sealant Council
Alliance of Foam Packaging Recyclers
American Bakers Association
American Chemistry Council
American Forest & Paper Association
American Frozen Food Institute
American Institute of Food Distributors
American Iron and Steel Institute
American Management Association
American National Standards Institute
American Plastics Council (APC)
American Society for Testing and Materials
Association for Suppliers of Printing, Publishing
AICC, The Independent Packaging Association
Association of Industrial Metallizers, Coaters and Laminators (AIMCAL)
Automated Identification Manufacturer
Automated Imaging Association
Can Manufacturers Institute
Chocolate Manufacturers Association of the U.S.A.
Consumer Healthcare Products Association
Contract Manufacturing and Packaging Association
Converting Equipment Manufacturers Association
Corrugated Packaging Council
Drug, Chemical & Allied Trade Association
Envelope Manufacturers Association
Fibre Box Association
Flexible Packaging Association
Flexographic Technical AssociationFlexographic Technical Association
Foil Stamping and Embossing Association
Food and Drug Law Institute
Food Institute
Food Marketing Institute
Food Processing Machinery & Supplies Association
Foodservice & Packaging Institute
Glass Packaging Institute
Graphic Arts Technical Foundation
Gravure Association of America
Grocery Manufacturers of America
Healthcare Compliance Packaging Council
High Definition Flexo Consortium
Institute of Food Technologists
Institute of Packaging Professionals
International Association of Food Industry Suppliers
International Bottled Water Association
International Dairy Foods Association
International Foodservice Manufacturers Association
International Safe Transit Association
Label Printing Industries of America
Material Handling Industry of America
National Association of Container Distributors
National Association of Manufacturers
National Chicken Council
National Coil Coating Association
National Confectioners Association of the U.S.A.
National Freight Claim & Security
National Institute of Packaging, Handling & Logistics Engineers
National Paper Trade Association
National Wooden Pallet & Container
Open Modular Architecture Controls (OMAC) Packaging Workgroup
Packaging Association of Canada
Paperboard Packaging Council
Petroleum Packaging Council
Pharmaceutical Research and Manufacturers of America
PMMI: The Association for Packaging and Processing Technologies
Polystyrene Packaging Council
Pressure Sensitive Tape Council
Printing Industries of America
Processing and Packaging Machinery Association (PPMA)
Produce Marketing Association, Inc.
Research & Development Associates for Military Food & Packaging Systems
Robotic Industries Association (RIA)
Snack Food Association
Soap & Detergent Association
Society of Glass and Ceramic Decorators
Society of Manufacturing Engineers
Society of Plastics Engineers (SPE)
Society of the Plastics Industry (SPI)
Steel Recycling Institute
Steel Shipping Containers Institute
Tag and Label Manufacturers Institute
Technical Association of the Pulp & Paper Industry
The Aluminum Association
Transportation Consumer Protection Council
Transportation Loss Prevention & Security Association
Tube Council of North America
Uniform Code Council, Inc.
Western Packaging Association (WPA)
World Packaging Organisation
Latest Packaging news
Visiongain Publishes Caps & Closures Market Report 2024-2034
The global caps & closures market was valued at US$80.8 billion in 2023 and is projected to grow at a CAGR of 9% during the forecast period 2024-2034.
22 February 2024
Visiongain Publishes Flexible (Converted) Plastic Packaging Market Report 2024-2034
The global Flexible (Converted) Plastic Packaging market was valued at US$157.3 billion in 2023 and is projected to grow at a CAGR of 5.4% during the forecast period 2024-2034.
04 January 2024
Visiongain Publishes Beverage Packaging Market Report 2023-2033
The global Beverage Packaging market was valued at US$144.3 billion in 2022 and is projected to grow at a CAGR of 4.6% during the forecast period 2023-2033.
28 September 2023
Visiongain Publishes Cosmetics Packaging Market Report 2023-2033
The global Cosmetics Packaging market is projected to grow at a CAGR of 4.3% by 2033
21 July 2023

