The OTC Drugs & Dietary Supplements Market Report 2021-2031: This report will prove invaluable to leading firms striving for new revenue pockets if they wish to better understand the industry and its underlying dynamics. It will be useful for companies that would like to expand into different industries or to expand their existing operations in a new region.
Self-Care In The Global Health System Becomes A Primary Public Resource
People in emerging and industrialised countries are now aware of their health, and fitness and wellness programmes are growing worldwide. Immunization and vaccination, precautionary steps to decrease mortality among children and raise children’s immunity, improved living standards in many healthy dietary countries and nutritional supplements are major efforts that have been adopted globally to extend people’s life expectancy.
Importance Of Dietary Supplement Quality Education Campaigns
Public health agencies, enforcement agencies, associations, industry and other groups should invest in educational programmes which provide advice on picking food supplements of quality and describe potential risks of goods that are not self-assured in their identity or quality. Consumers should be made aware that independent verification procedures from third parties can help establish the representations of products and ingredients. Sensitizing campaigns should focus on the most sensitive or expected physiological impacts of low-quality foodstuffs in consumers’ segments (e.g. senior citizens, pregnant women, military peoples etc.)
What Are These Questions You Should Ask Before Buying A Market Research Report?
• How are the OTC drugs & dietary supplements market evolving?
• What is driving and restraining the OTC drugs & dietary supplements market?
• How will each OTC drugs & dietary supplements submarket segment grow over the forecast period and how much revenue will these submarkets account for in 2031?
• How will the market shares for each OTC drugs & dietary supplements submarket develop from 2021 to 2031?
• What will be the main driver for the overall market from 2021 to 2031?
• Will leading OTC drugs & dietary supplements markets broadly follow the macroeconomic dynamics, or will individual national markets outperform others?
• How will the market shares of the national markets change by 2031 and which geographical region will lead the market in 2031?
• Who are the leading players and what are their prospects over the forecast period?
• What are the OTC drugs & dietary supplements projects for these leading companies?
• How will the industry evolve during the period between 2020 and 2031?
• What is the implication of OTC drugs & dietary supplements projects taking place now and over the next 10 years?
• Is there a greater need for product commercialisation to further scale the OTC drugs & dietary supplements market?
• Where is the OTC drugs & dietary supplements market heading? And how can you ensure you are at the forefront of the market?
• What can be the best investment options for new product and service lines?
• What are the key prospects for moving companies into a new growth path? C-suite?
You need to discover how this will impact the OTC drugs & dietary supplements market today, and over the next 10 years:
• Our 607-page report provides 311 tables and 302 charts/graphs exclusively to you.
• The report highlights key lucrative areas in the industry so you can target them – NOW.
• Contains in-depth analysis of global, regional and national sales and growth
• Highlights for you the key successful trends, changes and revenue projections made by your competitors
This report tells you TODAY how the OTC drugs & dietary supplements market will develop in the next 10 years, and in-line with the variations in COVID-19 economic recession and bounce. This market is more critical now than at any point over the last 10 years.
This report includes data analysis and invaluable insight into how COVID-19 will affect your industry. Access this report today.
To access the data contained in this document please email contactus@visiongain.com
Forecasts to 2031 and other analyses reveal the commercial prospects
• In addition to revenue forecasting to 2031, our new study provides you with recent results, growth rates, and market shares.
• You find original analyses, with business outlooks and developments.
• Discover qualitative analyses (including market dynamics, drivers, opportunities, restraints and challenges), cost structure, the impact of rising OTC drugs & dietary supplements prices and recent developments.
This report includes data analysis and invaluable insight into how COVID-19 will affect the industry and your company. Four COVID-19 recovery patterns and their impact, namely, V, L, W and U are discussed in this report.
Global OTC Drugs & Dietary Supplements Market (COVID Impact Analysis) by Distribution Channel
• Pharmacies/Drugstores
• Supermarkets/Hypermarkets
• Convenience Stores
• Online Drugstores
• Health Food Stores
• Other Distribution Channel
Global OTC Drugs & Dietary Supplements Market (COVID Impact Analysis) by Category
• Cough, Cold and Flu Drugs
• Analgesics
• Dermatological
• Vitamins and Minerals
• Weight Loss/Diet Products
• Gastrointestinal Drugs
• Allergy
• Other Category
Global OTC Drugs & Dietary Supplements Market (COVID Impact Analysis) by Product Type
• Branded Drugs
• Generic Drugs
• Other Product Types
Global OTC Drugs & Dietary Supplements Market (COVID Impact Analysis) by Dosage Form
• Tablets
• Hard Capsules
• Powders
• Ointments
• Soft Capsules
• Liquids
• Other Dosage Forms
Global OTC Drugs & Dietary Supplements Market (COVID Impact Analysis) by Allergy Type
• Eye Allergy
• Rhinitis
• Asthma
• Skin Allergy
• Food Allergies
• Other Allergies
Global OTC Drugs & Dietary Supplements Market (COVID Impact Analysis) by Allergy Drugs
• Antihistamines
• Corticosteroids
• Decongestants
• Other Allergy Drugs

In addition to the revenue predictions for the overall world market and segments, you will also find revenue forecasts for 4 regional and 20 leading national markets:
• North America OTC Drugs & Dietary Supplements Market, 2021 to 2031 Market Outlook
• U.S. OTC Drugs & Dietary Supplements Market, 2021 to 2031 Market Forecast & COVID Impact Analysis
• Canada OTC Drugs & Dietary Supplements Market, 2021 to 2031 Market Forecast & COVID Impact Analysis
• Mexico OTC Drugs & Dietary Supplements Market, 2021 to 2031 Market Forecast & COVID Impact Analysis
• Europe OTC Drugs & Dietary Supplements Market, 2021 to 2031 Market Outlook
• Germany OTC Drugs & Dietary Supplements Market, 2021 to 2031 Market Forecast & COVID Impact Analysis
• Spain OTC Drugs & Dietary Supplements Market, 2021 to 2031 Market Forecast & COVID Impact Analysis
• United Kingdom OTC Drugs & Dietary Supplements Market, 2021 to 2031 Market Forecast & COVID Impact Analysis
• France OTC Drugs & Dietary Supplements Market, 2021 to 2031 Market Forecast & COVID Impact Analysis
• Italy OTC Drugs & Dietary Supplements Market, 2021 to 2031 Market Forecast & COVID Impact Analysis
• Rest of Europe Market Forecast & COVID Impact Analysis
• Asia Pacific OTC Drugs & Dietary Supplements Market, 2021 to 2031 Market Outlook
• China OTC Drugs & Dietary Supplements Market, 2021 to 2031 Market Forecast & COVID Impact Analysis
• Japan OTC Drugs & Dietary Supplements Market, 2021 to 2031 Market Forecast & COVID Impact Analysis
• India OTC Drugs & Dietary Supplements Market, 2021 to 2031 Market Forecast & COVID Impact Analysis
• Australia OTC Drugs & Dietary Supplements Market, 2021 to 2031 Market Forecast & COVID Impact Analysis
• South Korea OTC Drugs & Dietary Supplements Market, 2021 to 2031 Market Forecast & COVID Impact Analysis
• Rest of Asia Pacific Market Forecast & COVID Impact Analysis
• Latin America OTC Drugs & Dietary Supplements Market, 2021 to 2031 Market Outlook
• Brazil OTC Drugs & Dietary Supplements Market, 2021 to 2031 Market Forecast & COVID Impact Analysis
• Mexico OTC Drugs & Dietary Supplements Market, 2021 to 2031 Market Forecast & COVID Impact Analysis
• Colombia OTC Drugs & Dietary Supplements Market, 2021 to 2031 Market Forecast & COVID Impact Analysis
• Argentina OTC Drugs & Dietary Supplements Market, 2021 to 2031 Market Forecast & COVID Impact Analysis
• Rest of Latin America OTC Drugs & Dietary Supplements Market, 2021 to 2031 Market Forecast & COVID Impact Analysis
• Middle East & Africa OTC Drugs & Dietary Supplements Market, 2021 to 2031 Market Outlook
• South Africa OTC Drugs & Dietary Supplements Market, 2021 to 2031 Market Forecast & COVID Impact Analysis
• Turkey OTC Drugs & Dietary Supplements Market, 2021 to 2031 Market Forecast & COVID Impact Analysis
• Saudi Arabia OTC Drugs & Dietary Supplements Market, 2021 to 2031 Market Forecast & COVID Impact Analysis
• UAE OTC Drugs & Dietary Supplements Market, 2021 to 2031 Market Forecast & COVID Impact Analysis
• Qatar OTC Drugs & Dietary Supplements Market, 2021 to 2031 Market Forecast & COVID Impact Analysis
• Rest of Middle East & Africa OTC Drugs & Dietary Supplements Market, 2021 to 2031 Market Forecast & COVID Impact Analysis
Need industry data? Please contact us today.
The report also includes profiles and for some of the leading companies in the OTC Drugs & Dietary Supplements Market, 2021 to 2031, with a focus on this segment of these companies’ operations.
Leading companies and the potential for market growth
• Taisho Pharmaceutical Holdings Co., Ltd
• Nippon Chemiphar Co., Ltd.
• H Lundbeck A/S
• Teva Pharmaceutical Industries Ltd
• Novartis AG
• Pfizer Inc.
• Mylan N.V.
• Abbott Laboratories
• Fresenius SE & Co KgaA
• Sun Pharmaceutical Industries
• Sanofi SA
• Roche Holding AG
• Lupin
• Alcon AG
• Sato Pharmaceutical
• Herbalife Nutrition Ltd
• Bayer AG.
• Glanbia plc
• Nature’s Sunshine Products, Inc. (NSP)
• Danisco
Overall world revenue for OTC Drugs & Dietary Supplements Market, 2021 to 2031 in terms of value the market will surpass US$ billion in 2021, our work calculates. We predict strong revenue growth through 2031. Our work identifies which organizations hold the greatest potential. Discover their capabilities, progress, and commercial prospects, helping you stay ahead.
How the OTC Drugs & Dietary Supplements Market, 2021 to 2031 Market report helps you?
In summary, our 600+ page report provides you with the following knowledge:
• Revenue forecasts to 2031 for OTC Drugs & Dietary Supplements Market, 2021 to 2031 Market, with forecasts for the distribution channel, product type, category, dosage form, Allergy Type, Allergy Drugs each forecasted at a global and regional level– discover the industry’s prospects, finding the most lucrative places for investments and revenues
• Revenue forecasts to 2031 for 4 regional and 20 key national markets – See forecasts for the OTC Drugs & Dietary Supplements Market, 2021 to 2031 market in North America, Europe, Asia-Pacific and LAMEA. Also forecasted are the market in the US, Canada, Mexico, Brazil, Germany, France, UK, Italy, China, India, Japan, and Australia among other prominent economies.
• Prospects for established firms and those seeking to enter the market– including company profiles for 20 of the major companies involved in the OTC Drugs & Dietary Supplements Market, 2021 to 2031 Market.
Find quantitative and qualitative analyses with independent predictions. Receive information that only our report contains, staying informed with this invaluable business intelligence.
Information found nowhere else
With our newly report title, you are less likely to fall behind in knowledge or miss out on opportunities. See how our work could benefit your research, analyses, and decisions. Visiongain’s study is for everybody needing commercial analyses for the OTC Drugs & Dietary Supplements Market, 2021 to 2031 Market and leading companies. You will find data, trends and predictions.
To access the data contained in this document please email contactus@visiongain.com
Buy our report today OTC Drugs & Dietary Supplements Market Report 2021-2031: Forecasts by Distribution Channel (Pharmacies/Drugstores, Supermarkets/Hypermarkets, Convenience Stores, Online Drugstores, Health Food Stores), by Category (Cough, Cold and Flu Drugs, Analgesics, Dermatological, Vitamins and Minerals, Weight Loss/Diet Products, Gastrointestinal Drugs, Allergy, Other), by Dosage Form (Tablets, Hard Capsules, Powders, Ointments, Soft Capsules, Liquids, Other), by Product Type (Branded Drugs, Generic Drugs, Other), by Allergy Type (Eye Allergy, Rhinitis, Asthma, Skin Allergy, Food Allergies, Other), by Allergy Drugs (Antihistamines, Corticosteroids, Decongestants, Other) AND Regional and Leading National Market Analysis PLUS Analysis of Leading OTC Companies AND COVID-19 Recovery Scenarios. Avoid missing out by staying informed – order our report now.
Visiongain is a trading partner with the US Federal Government
CCR Ref number: KD4R6
Do you have any custom requirements we can help you with? Any need for a specific country, geo region, market segment or specific company information? Contact us today, we can discuss your needs and see how we can help: sara.peerun@visiongain.com
1. Report Overview
1.1 Introduction to OTC Drugs & Dietary Supplements Market
1.2 Classification of OTC Pharmaceuticals
1.3 Global OTC Drugs & Dietary Supplements Market Overview
1.4 What are the Objectives of this Report?
1.5 What is the Scope of the Report?
1.6 OTC Drugs & Dietary Supplements Market Definition
1.6.1 Over The Counter (OTC) Drugs
1.6.2 Dietary Supplements
1.7 Why You Should Read This Report
1.8 What This Report Delivers
1.9 Key Questions Answered By This Analytical Report Include:
1.10 Who is This Report for?
1.11 Research Methodology
1.11.1 Primary Research
1.11.2 Secondary Research
1.11.3 Market Evaluation & Forecasting Methodology
1.12 Frequently Asked Questions (FAQs)
1.13 Associated Visiongain Reports
1.14 About Visiongain
2 Executive Summary
3 OTC Drugs & Dietary Supplements Industry Structure
3.1 Overview
3.2 Requirements for an OTC Pharmaceutical Drug
3.3 OTC Switching
3.3.1 A Prescription Medicine Switched To OTC
3.3.2 Manufacturing and Distribution of OTC Pharmaceuticals
3.4 COIVD Impact on OTC Product Sales
3.5 Regulation of OTC Pharmaceuticals
3.5.1 Regulation of OTC Pharmaceuticals in the US
3.5.2 Regulation of OTC Pharmaceuticals in Japan
3.5.3 Regulations of OTC Pharmaceuticals in Europe
3.5.4 Regulation of OTC Pharmaceuticals in Other Countries
4 Global Market Dynamics
4.1 Market Driving Factors
4.1.1 Self-Care In The Global Health System Becomes A Primary Public Resource
4.1.2 Importance Of Dietary Supplement Quality Education Campaigns
4.1.3 Leadership Retain Market
4.2 Market Restraining Factors
4.2.1 Pharmaceutical Companies Are Still Concentrating On Prescription Drugs.
4.2.2 OTC Drugs' Sales and Reputation are Affected by Manufacturing Issues
4.3 Opportunities in the Global Market
4.3.1 Growth Opportunities Will Emerge as a Result of Demographic and Economic Changes
4.3.2 Emerging Markets Are Booming.
4.3.3 OTC Approvals May Be Enabled By New Healthcare Technologies.
4.4 Challenges in the Global Market
4.4.1 Private Label Competition Will Reduce Profitability Competition
4.4.2 Product Withdrawal May Lead To Regulatory Concerns About Safety And Misuse
4.5 SWOT Analysis
4.6 PEST Analysis
4.6.1 Political
4.6.2 Economical
4.6.3 Social
4.6.4 Technology
4.7 Porters Five Forces
4.7.1 Competitor Rivalry [High]
4.7.2 New Entries Threat [Medium]
4.7.3 Suppliers' Power [Low]
4.7.4 Power of Buyers [Medium]
4.7.5 Threats of Substitutes (Medium)
5 Global OTC Drugs & Dietary Supplements Market Analysis
5.1 Global Market Outlook
5.1.1 OTC Market Overview
5.1.2 Dietary Supplement Market Overview
5.2 Pre-COVID-19 Market Scenario
5.3 Post-COVID-19 Market Scenarios (V, W, U, L-Shaped Recovery Analysis)
6 Regional Market Size Estimation and Forecast
6.1 Pre-COVID-19 Market Scenario
6.2 Post-COVID-19 Market Scenarios (V, W, U, L-Shaped Recovery Analysis)
7 Market Size Estimation and Forecast By Distribution Channel
7.1 Segment Overview
7.1.1 Pharmacies/ Drugstores
7.1.2 Supermarkets/Hypermarkets
7.1.3 Convenience Stores
7.1.4 Online Drugstores
7.1.5 Health Food Stores
7.1.6 Other Distribution Channels
7.2 Pre-COVID-19 Market Scenario
7.3 Post-COVID-19 Market Scenarios (V, W, U, L-Shaped Recovery Analysis)
8 Global Market Size Estimation and Forecast By Category
8.1 Segment Overview
8.1.1 Cough, Cold and Flu Drugs
8.1.2 Cough And Cold Remedies
8.1.3 Dermatological
8.1.4 Vitamins and Minerals
8.1.5 Weight Loss/Diet Products
8.1.6 Gastrointestinal Drugs
8.1.7 Allergy
8.1.8 Other Categories
8.2 Pre-COVID-19 Market Scenario
8.3 Post-COVID-19 Market Scenarios (V, W, U, L-Shaped Recovery Analysis)
9 Global Market Size Estimation and Forecast by Allergy Type
9.1 Segment Overview
9.1.1 Eye Allergy
9.1.2 Rhinitis
9.1.3 Asthma
9.1.4 Skin Allergy
9.1.5 Food Allergies
9.1.6 Other Allergies
9.2 Pre-COVID-19 Market Scenario
9.3 Post-COVID-19 Market Scenarios (V, W, U, L-Shaped Recovery Analysis)
10 Global Market Size Estimation and Forecast by Allergy Drugs
10.1 Segment Overview
10.1.1 Antihistamines
10.1.2 Corticosteroids
10.1.3 Decongestants
10.1.4 Other Allergy Drugs
10.2 Pre-COVID-19 Market Scenario
10.3 Post-COVID-19 Market Scenarios (V, W, U, L-Shaped Recovery Analysis)
11 Global Market Size Estimation and Forecast by Product Type
11.1 Segment Overview
11.1.1 Branded Drugs
11.1.2 Generic Drugs
11.2 Pre-COVID-19 Market Scenario
11.3 Post-COVID-19 Market Scenarios (V, W, U, L-Shaped Recovery Analysis)
12 Global Market Size Estimation and Forecast by Dosage Form
12.1 Segment Overview
12.1.1 Tablets
12.1.2 Hard Capsules
12.1.3 Powders
12.1.4 Ointments
12.1.5 Soft Capsule
12.1.6 Liquid Dosage
12.1.7 Other Dosage
12.2 Pre-COVID-19 Market Scenario
12.3 Post-COVID-19 Market Scenarios (V, W, U, L-Shaped Recovery Analysis)
13 North America OTC Drugs & Dietary Supplements Market Analysis
13.1 North America Market Size Estimation and Forecast
13.1.1 Pre-COVID-19 Market Scenario
13.1.2 Post-COVID-19 Market Scenarios (V, W, U, L-Shaped Recovery Analysis)
13.2 Country Market Size Estimation and Forecast
13.3 US Market Analysis
13.3.1 OTC Pharmaceuticals in US
13.3.2 Dietary Supplements in US
13.4 Canada Market Analysis
13.4.1 OTC Pharmaceuticals in Canada
13.4.2 Dietary Supplements in Canada
13.4.3 Pre-COVID-19 Market Scenario
13.4.4 Post-COVID-19 Market Scenarios (V, W, U, L-Shaped Recovery Analysis)
13.5 Market Size Estimation and Forecast By Distribution Channel
13.5.1 Pre-COVID-19 Market Scenario
13.5.2 Post-COVID-19 Market Scenarios (V, W, U, L-Shaped Recovery Analysis)
13.6 North America Market Size Estimation and Forecast Category
13.6.1 Pre-COVID-19 Market Scenario
13.6.2 Post-COVID-19 Market Scenarios (V, W, U, L-Shaped Recovery Analysis)
13.7 North America Market Size Estimation and Forecast by Allergy Type
13.7.1 Pre-COVID-19 Market Scenario
13.7.2 Post-COVID-19 Market Scenarios (V, W, U, L-Shaped Recovery Analysis)
13.8 North America Market Size Estimation and Forecast by Allergy Drugs
13.8.1 Pre-COVID-19 Market Scenario
13.8.2 Post-COVID-19 Market Scenarios (V, W, U, L-Shaped Recovery Analysis)
13.9 North America Market Size Estimation and Forecast by Product Type
13.9.1 Pre-COVID-19 Market Scenario
13.9.2 Post-COVID-19 Market Scenarios (V, W, U, L-Shaped Recovery Analysis)
13.10 North America Market Size Estimation and Forecast by Dosage Form
13.10.1 Pre-COVID-19 Market Scenario
13.10.2 Post-COVID-19 Market Scenarios (V, W, U, L-Shaped Recovery Analysis)
13.11 North America Market Size Estimation and Forecast by Allergy Type
13.11.1 Pre-COVID-19 Market Scenario
13.11.2 Post-COVID-19 Market Scenarios (V, W, U, L-Shaped Recovery Analysis)
13.12 North America Market Size Estimation and Forecast by Allergy Drugs
13.12.1 Pre-COVID-19 Market Scenario
13.12.2 Post-COVID-19 Market Scenarios (V, W, U, L-Shaped Recovery Analysis)
14 Europe OTC Drugs & Dietary Supplements Market Analysis
14.1 Europe Market Outlook
14.2 Europe Market Size Estimation and Forecast
14.2.1 Pre-COVID-19 Market Scenario
14.2.2 Post-COVID-19 Market Scenarios (V, W, U, L-Shaped Recovery Analysis)
14.3 Regional Market Size Estimation and Forecast
14.3.1 UK Market Analysis
14.3.2 Germany Market Analysis
14.3.3 France Market Analysis
14.3.4 Italy Market Analysis
14.3.5 Spain Market Analysis
14.3.6 Russia Market Analysis
14.3.7 Belgium Market Analysis
14.3.8 Netherland Market Analysis
14.3.9 Switzerland Market Analysis
14.3.10 Rest of Europe Market Analysis
14.3.11 Pre-COVID-19 Market Scenario
14.3.12 Post-COVID-19 Market Scenarios (V, W, U, L-Shaped Recovery Analysis)
14.4 Market Size Estimation and Forecast By Distribution Channel
14.4.1 Pre-COVID-19 Market Scenario
14.4.2 Post-COVID-19 Market Scenarios (V, W, U, L-Shaped Recovery Analysis)
14.5 Europe Market Size Estimation and Forecast Category
14.5.1 Pre-COVID-19 Market Scenario
14.5.2 Post-COVID-19 Market Scenarios (V, W, U, L-Shaped Recovery Analysis)
14.6 Europe Market Size Estimation and Forecast by Allergy Type
14.6.1 Pre-COVID-19 Market Scenario
14.6.2 Post-COVID-19 Market Scenarios (V, W, U, L-Shaped Recovery Analysis)
14.7 Europe Market Size Estimation and Forecast by Allergy Drugs
14.7.1 Pre-COVID-19 Market Scenario
14.7.2 Post-COVID-19 Market Scenarios (V, W, U, L-Shaped Recovery Analysis)
14.8 Europe Market Size Estimation and Forecast by Product Type
14.8.1 Pre-COVID-19 Market Scenario
14.8.2 Post-COVID-19 Market Scenarios (V, W, U, L-Shaped Recovery Analysis)
14.9 Europe Market Size Estimation and Forecast by Dosage Form
14.9.1 Pre-COVID-19 Market Scenario
14.9.2 Post-COVID-19 Market Scenarios (V, W, U, L-Shaped Recovery Analysis)
15 Asia-Pacific OTC Drugs & Dietary Supplements Market Analysis
15.1 Asia-Pacific Market Outlook
15.2 Asia-Pacific Market Size Estimation and Forecast
15.2.1 Pre-COVID-19 Market Scenario
15.2.2 Post-COVID-19 Market Scenarios (V, W, U, L-Shaped Recovery Analysis)
15.3 Regional Market Size Estimation and Forecast
15.3.1 China Market Analysis
15.3.2 India Market Analysis
15.3.3 Japan Market Analysis
15.3.4 South Korea Market Analysis
15.3.5 Australia Market Analysis
15.3.6 Singapore Market Analysis
15.3.7 Malaysia Market Analysis
15.3.8 Indonesia Market Analysis
15.3.9 Philippines Market Analysis
15.3.10 Rest of Asia-Pacific Market Analysis
15.3.11 Pre-COVID-19 Market Scenario
15.3.12 Post-COVID-19 Market Scenarios (V, W, U, L-Shaped Recovery Analysis)
15.4 Market Size Estimation and Forecast by Distribution Channel
15.4.1 Pre-COVID-19 Market Scenario
15.4.2 Post-COVID-19 Market Scenarios (V, W, U, L-Shaped Recovery Analysis)
15.5 Asia-Pacific Market Size Estimation and Forecast Category
15.5.1 Pre-COVID-19 Market Scenario
15.5.2 Post-COVID-19 Market Scenarios (V, W, U, L-Shaped Recovery Analysis)
15.6 Asia-Pacific Market Size Estimation and Forecast by Allergy Type
15.6.1 Pre-COVID-19 Market Scenario
15.6.2 Post-COVID-19 Market Scenarios (V, W, U, L-Shaped Recovery Analysis)
15.7 Asia-Pacific Market Size Estimation and Forecast by Allergy Drugs
15.7.1 Pre-COVID-19 Market Scenario
15.7.2 Post-COVID-19 Market Scenarios (V, W, U, L-Shaped Recovery Analysis)
15.8 Asia-Pacific Market Size Estimation and Forecast by Product Type
15.8.1 Pre-COVID-19 Market Scenario
15.8.2 Post-COVID-19 Market Scenarios (V, W, U, L-Shaped Recovery Analysis)
15.9 Asia-Pacific Market Size Estimation and Forecast by Dosage Form
15.9.1 Pre-COVID-19 Market Scenario
15.9.2 Post-COVID-19 Market Scenarios (V, W, U, L-Shaped Recovery Analysis)
16 Latin America OTC Drugs & Dietary Supplements Market Analysis
16.1 Latin America Market Outlook
16.2 Latin America Market Size Estimation and Forecast
16.2.1 Pre-COVID-19 Market Scenario
16.2.2 Post-COVID-19 Market Scenarios (V, W, U, L-Shaped Recovery Analysis)
16.3 Regional Market Size Estimation and Forecast
16.3.1 Brazil Market Analysis
16.3.2 Mexico Market Analysis
16.3.3 Colombia Market Analysis
16.3.4 Argentina Market Analysis
16.3.5 Rest of Latin America Market Analysis
16.3.6 Pre-COVID-19 Market Scenario
16.3.7 Post-COVID-19 Market Scenarios (V, W, U, L-Shaped Recovery Analysis)
16.4 Market Size Estimation and Forecast by Distribution Channel
16.4.1 Pre-COVID-19 Market Scenario
16.4.2 Post-COVID-19 Market Scenarios (V, W, U, L-Shaped Recovery Analysis)
16.5 Latin America Market Size Estimation and Forecast Category
16.5.1 Pre-COVID-19 Market Scenario
16.5.2 Post-COVID-19 Market Scenarios (V, W, U, L-Shaped Recovery Analysis)
16.6 Latin America Market Size Estimation and Forecast by Allergy Type
16.6.1 Pre-COVID-19 Market Scenario
16.6.2 Post-COVID-19 Market Scenarios (V, W, U, L-Shaped Recovery Analysis)
16.7 Latin America Market Size Estimation and Forecast by Allergy Drugs
16.7.1 Pre-COVID-19 Market Scenario
16.7.2 Post-COVID-19 Market Scenarios (V, W, U, L-Shaped Recovery Analysis)
16.8 Latin America Market Size Estimation and Forecast by Product Type
16.8.1 Pre-COVID-19 Market Scenario
16.8.2 Post-COVID-19 Market Scenarios (V, W, U, L-Shaped Recovery Analysis)
16.9 Latin America Market Size Estimation and Forecast by Dosage Form
16.9.1 Pre-COVID-19 Market Scenario
16.9.2 Post-COVID-19 Market Scenarios (V, W, U, L-Shaped Recovery Analysis)
17 Middle East & Africa OTC Drugs & Dietary Supplements Market Analysis
17.1 Middle East & Africa Market Outlook
17.2 Middle East & Africa Market Size Estimation and Forecast
17.2.1 Pre-COVID-19 Market Scenario
17.2.2 Post-COVID-19 Market Scenarios (V, W, U, L-Shaped Recovery Analysis)
17.3 Regional Market Size Estimation and Forecast
17.3.1 South Africa Market Analysis
17.3.2 OTC Drugs in South Africa
17.3.3 Dietary Supplements in South Africa
17.3.4 Turkey Market Analysis
17.3.5 Dietary Supplements in Turkey
17.3.6 UAE Market Analysis
17.3.7 OTC Drugs in UAE
17.3.8 Dietary Supplement in UAE
17.3.9 Qatar Market Analysis
17.3.10 Rest of Middle East & Africa Market Analysis
17.3.11 Pre-COVID-19 Market Scenario
17.3.12 Post-COVID-19 Market Scenarios (V, W, U, L-Shaped Recovery Analysis)
17.4 Middle East & Africa Market Size Estimation and Forecast by Distribution Channel
17.4.1 Pre-COVID-19 Market Scenario
17.4.2 Post-COVID-19 Market Scenarios (V, W, U, L-Shaped Recovery Analysis)
17.5 Middle East & Africa Market Size Estimation and Forecast Category
17.5.1 Pre-COVID-19 Market Scenario
17.5.2 Post-COVID-19 Market Scenarios (V, W, U, L-Shaped Recovery Analysis)
17.6 Middle East & Africa Market Size Estimation and Forecast by Allergy Type
17.6.1 Pre-COVID-19 Market Scenario
17.6.2 Post-COVID-19 Market Scenarios (V, W, U, L-Shaped Recovery Analysis)
17.7 Middle East & Africa Market Size Estimation and Forecast by Allergy Drugs
17.7.1 Pre-COVID-19 Market Scenario
17.7.2 Post-COVID-19 Market Scenarios (V, W, U, L-Shaped Recovery Analysis)
17.8 Middle East & Africa Market Size Estimation and Forecast by Product Type
17.8.1 Pre-COVID-19 Market Scenario
17.8.2 Post-COVID-19 Market Scenarios (V, W, U, L-Shaped Recovery Analysis)
17.9 Middle East & Africa Market Size Estimation and Forecast by Dosage Form
17.9.1 Pre-COVID-19 Market Scenario
17.9.2 Post-COVID-19 Market Scenarios (V, W, U, L-Shaped Recovery Analysis)
18 Companies Profiles
18.1 Taisho Pharmaceutical Holdings Co., Ltd
18.1.1 Company Snapshot
18.1.2 Company Overview
18.1.3 Company Financial Profile
18.1.4 Company Product Benchmarking
18.1.5 Company Recent Developments
18.2 Nippon Chemiphar Co., Ltd.
18.2.1 Company Snapshot
18.2.2 Company Overview
18.2.3 Company Financial Profile
18.2.4 Company Product Benchmarking
18.2.5 Company Recent Developments
18.3 H Lundbeck A/S
18.3.1 Company Snapshot
18.3.2 Company Overview
18.3.3 Company Financial Profile
18.3.4 Company Product Benchmarking
18.3.5 Company Recent Developments
18.4 Teva Pharmaceutical Industries Ltd
18.4.1 Company Snapshot
18.4.2 Company Overview
18.4.3 Company Financial Profile
18.4.4 Company Product Benchmarking
18.4.5 Company Recent Developments
18.5 Novartis AG
18.5.1 Company Snapshot
18.5.2 Company Overview
18.5.3 Company Financial Profile
18.5.4 Company Product Benchmarking
18.5.5 Company Recent Developments
18.6 Pfizer Inc.
18.6.1 Company Snapshot
18.6.2 Company Overview
18.6.3 Company Financial Profile
18.6.4 Company Product Benchmarking
18.6.5 Company Recent Developments
18.7 Mylan N.V.
18.7.1 Company Snapshot
18.7.2 Company Overview
18.7.3 Company Financial Profile
18.7.4 Company Product Benchmarking
18.7.5 Company Recent Developments
18.8 Abbott Laboratories
18.8.1 Company Snapshot
18.8.2 Company Overview
18.8.3 Company Financial Profile
18.8.4 Company Product Benchmarking
18.8.5 Company Recent Developments
18.9 Fresenius SE & Co KgaA
18.9.1 Company Snapshot
18.9.2 Company Overview
18.9.3 Company Financial Profile
18.9.4 Company Product Benchmarking
18.9.5 Company Recent Developments
18.10 Sun Pharmaceutical Industries
18.10.1 Company Snapshot
18.10.2 Company Overview
18.10.3 Company Financial Profile
18.10.4 Company Product Benchmarking
18.10.5 Company Recent Developments
18.11 Sanofi SA
18.11.1 Company Snapshot
18.11.2 Company Overview
18.11.3 Company Financial Profile
18.11.4 Company Product Benchmarking
18.11.5 Company Recent Developments
18.12 Roche Holding AG
18.12.1 Company Snapshot
18.12.2 Company Overview
18.12.3 Company Financial Profile
18.12.4 Company Product Benchmarking
18.12.5 Company Recent Developments
18.13 Lupin
18.13.1 Company Snapshot
18.13.2 Company Overview
18.13.3 Company Financial Profile
18.13.4 Company Product Benchmarking
18.13.5 Company Recent Developments
18.14 Alcon AG
18.14.1 Company Snapshot
18.14.2 Company Overview
18.14.3 Company Financial Profile
18.14.4 Company Product Benchmarking
18.14.5 Company Recent Developments
18.15 Sato Pharmaceutical
18.15.1 Company Snapshot
18.15.2 Company Overview
18.15.3 Company Product Benchmarking
18.16 Herbalife Nutrition Ltd
18.16.1 Company Snapshot
18.16.2 Company Overview
18.16.3 Company Financial Profile
18.16.4 Company Product Benchmarking
18.17 Bayer AG.
18.17.1 Company Snapshot
18.17.2 Company Overview
18.17.3 Company Financial Profile
18.17.4 Company Product Benchmarking
18.17.5 Company Recent Developments
18.18 Glanbia plc
18.18.1 Company Snapshot
18.18.2 Company Overview
18.18.3 Company Financial Profile
18.18.4 Company Product Benchmarking
18.19 Nature’s Sunshine Products, Inc. (NSP)
18.19.1 Company Snapshot
18.19.2 Company Overview
18.19.3 Company Financial Profile
18.19.4 Company Product Benchmarking
18.20 Danisco
18.20.1 Company Snapshot
18.20.2 Company Overview
18.20.3 Company Product Benchmarking
19 Conclusion and Recommendations
19.1 Concluding Remarks from Visiongain
19.2 Recommendations for Market Players
19.2.1 Rx-to-OTC Switch is The Upcoming Trends
19.2.2 Cost Of OTC Drugs is Less as Compared to Prescribed Drugs
19.2.3 Strict Regulatory Framework
List of Tables
Table 1. Global OTC Drugs & Dietary Supplements Market, 2021-2031 (USD Bn, AGR (%), CAGR(%))
Table 2. Global OTC Drugs & Dietary Supplements Market Snapshot, 2021 & 2031 (US$billion, CAGR %)
Table 3. Global OTC Drugs & Dietary Supplements Market, 2021-2031 (USD Bn, AGR (%), CAGR(%))
Table 4. Global OTC Drugs & Dietary Supplements Market, 2021-2031 (USD Bn, AGR (%), CAGR(%))(V – Shaped Recovery)
Table 5. Global OTC Drugs & Dietary Supplements Market, 2021-2031 (USD Bn, AGR (%), CAGR(%))(W – Shaped Recovery)
Table 6. Global OTC Drugs & Dietary Supplements Market, 2021-2031 (USD Bn, AGR (%), CAGR(%))(U – Shaped Recovery)
Table 7. Global OTC Drugs & Dietary Supplements Market, 2021-2031 (USD Bn, AGR (%), CAGR(%))(L – Shaped Recovery)
Table 8. Global OTC Drugs & Dietary Supplements Market by Region, 2021-2031 (USD Bn, AGR (%), CAGR(%))
Table 9. Global OTC Drugs & Dietary Supplements Market by Region, 2021-2031 (USD Bn, AGR (%), CAGR(%))(V – Shaped Recovery)
Table 10. Global OTC Drugs & Dietary Supplements Market by Region, 2021-2031 (USD Bn, AGR (%), CAGR(%))(W – Shaped Recovery)
Table 11. Global OTC Drugs & Dietary Supplements Market by Region, 2021-2031 (USD Bn, AGR (%), CAGR(%))(U – Shaped Recovery)
Table 12. Global OTC Drugs & Dietary Supplements Market by Region, 2021-2031 (USD Bn, AGR (%), CAGR(%))(L – Shaped Recovery)
Table 13. Global OTC Drugs & Dietary Supplements Market by Distribution Channel, 2021-2031 (USD Bn, AGR (%), CAGR(%))
Table 14. Global OTC Drugs & Dietary Supplements Market by Distribution Channel, 2021-2031 (USD Bn, AGR (%), CAGR(%))(V – Shaped Recovery)
Table 15. Global OTC Drugs & Dietary Supplements Market by Distribution Channel, 2021-2031 (USD Bn, AGR (%), CAGR(%))(W – Shaped Recovery)
Table 16. Global OTC Drugs & Dietary Supplements Market by Distribution Channel, 2021-2031 (USD Bn, AGR (%), CAGR(%))(U – Shaped Recovery)
Table 17. Global OTC Drugs & Dietary Supplements Market by Distribution Channel, 2021-2031 (USD Bn, AGR (%), CAGR(%))(L – Shaped Recovery)
Table 18. Global OTC Drugs & Dietary Supplements Market by Category, 2021-2031 (USD Bn, AGR (%), CAGR(%))
Table 19. Global OTC Drugs & Dietary Supplements Market by Category, 2021-2031 (USD Bn, AGR (%), CAGR(%))(V-Shape Recovery)
Table 20. Global OTC Drugs & Dietary Supplements Market by Category, 2021-2031 (USD Bn, AGR (%), CAGR(%))(W-Shape Recovery)
Table 21. Global OTC Drugs & Dietary Supplements Market by Category, 2021-2031 (USD Bn, AGR (%), CAGR(%))(U-Shape Recovery)
Table 22. Global OTC Drugs & Dietary Supplements Market by Category, 2021-2031 (USD Bn, AGR (%), CAGR(%))(L-Shape Recovery)
Table 23. Global OTC Drugs & Dietary Supplements Market by Allergy Type, 2021-2031 (USD Bn, AGR (%), CAGR(%))
Table 24. Global OTC Drugs & Dietary Supplements Market by Allergy Type, 2021-2031 (USD Bn, AGR (%), CAGR(%))(V-Shape Recovery)
Table 25. Global OTC Drugs & Dietary Supplements Market by Allergy Type, 2021-2031 (USD Bn, AGR (%), CAGR(%))(W-Shape Recovery)
Table 26. Global OTC Drugs & Dietary Supplements Market by Allergy Type, 2021-2031 (USD Bn, AGR (%), CAGR(%))(U-Shape Recovery)
Table 27. Global OTC Drugs & Dietary Supplements Market by Allergy Type, 2021-2031 (USD Bn, AGR (%), CAGR(%))(L-Shape Recovery)
Table 28. Global OTC Drugs & Dietary Supplements Market by Allergy Drugs, 2021-2031 (USD Bn, AGR (%), CAGR(%))
Table 29. Global OTC Drugs & Dietary Supplements Market by Allergy Drugs, 2021-2031 (USD Bn, AGR (%), CAGR(%))(V-Shape Recovery)
Table 30. Global OTC Drugs & Dietary Supplements Market by Allergy Drugs, 2021-2031 (USD Bn, AGR (%), CAGR(%))(W-Shape Recovery)
Table 31. Global OTC Drugs & Dietary Supplements Market by Allergy Drugs, 2021-2031 (USD Bn, AGR (%), CAGR(%))(U-Shape Recovery)
Table 32. Global OTC Drugs & Dietary Supplements Market by Allergy Drugs, 2021-2031 (USD Bn, AGR (%), CAGR(%))(L-Shape Recovery)
Table 33. Global OTC Drugs & Dietary Supplements Market by Product Type, 2021-2031 (USD Bn, AGR (%), CAGR(%))
Table 34. Global OTC Drugs & Dietary Supplements Market by Product Type, 2021-2031 (USD Bn, AGR (%), CAGR(%))(V – Shaped Recovery)
Table 35. Global OTC Drugs & Dietary Supplements Market by Product Type, 2021-2031 (USD Bn, AGR (%), CAGR(%))(W – Shaped Recovery)
Table 36. Global OTC Drugs & Dietary Supplements Market by Product Type, 2021-2031 (USD Bn, AGR (%), CAGR(%))(U – Shaped Recovery)
Table 37. Global OTC Drugs & Dietary Supplements Market by Product Type, 2021-2031 (USD Bn, AGR (%), CAGR(%))(L – Shaped Recovery)
Table 38. Global OTC Drugs & Dietary Supplements Market by Dosage Form, 2021-2031 (USD Bn, AGR (%), CAGR(%))
Table 39. Global OTC Drugs & Dietary Supplements Market by Dosage Form, 2021-2031 (USD Bn, AGR (%), CAGR(%))(V – Shaped Recovery)
Table 40. Global OTC Drugs & Dietary Supplements Market by Dosage Form, 2021-2031 (USD Bn, AGR (%), CAGR(%))(W – Shaped Recovery)
Table 41. Global OTC Drugs & Dietary Supplements Market by Dosage Form, 2021-2031 (USD Bn, AGR (%), CAGR(%))(U – Shaped Recovery)
Table 42. Global OTC Drugs & Dietary Supplements Market by Dosage Form, 2021-2031 (USD Bn, AGR (%), CAGR(%))(L – Shaped Recovery)
Table 43. North America OTC Drugs & Dietary Supplements Market, 2021-2031 (USD Bn, AGR (%), CAGR(%))
Table 44. North America OTC Drugs & Dietary Supplements Market, 2021-2031 (USD Bn, AGR (%), CAGR(%))(V – Shaped Recovery)
Table 45. North America OTC Drugs & Dietary Supplements Market, 2021-2031 (USD Bn, AGR (%), CAGR(%))(W – Shaped Recovery)
Table 46. North America OTC Drugs & Dietary Supplements Market, 2021-2031 (USD Bn, AGR (%), CAGR(%))(U – Shaped Recovery)
Table 47. North America OTC Drugs & Dietary Supplements Market, 2021-2031 (USD Bn, AGR (%), CAGR(%))(L – Shaped Recovery)
Table 48. North America OTC Drugs & Dietary Supplements Market by Country, 2021-2031 (USD Bn, AGR (%), CAGR(%))
Table 49. North America OTC Drugs & Dietary Supplements Market by Country, 2021-2031 (USD Bn, AGR (%), CAGR(%))(V – Shaped Recovery)
Table 50. North America OTC Drugs & Dietary Supplements Market by Country, 2021-2031 (USD Bn, AGR (%), CAGR(%))(W – Shaped Recovery)
Table 51. North America OTC Drugs & Dietary Supplements Market by Country, 2021-2031 (USD Bn, AGR (%), CAGR(%))(U – Shaped Recovery)
Table 52. North America OTC Drugs & Dietary Supplements Market by Country, 2021-2031 (USD Bn, AGR (%), CAGR(%))(L – Shaped Recovery)
Table 53. North America OTC Drugs & Dietary Supplements Market by Distribution Channel, 2021-2031 (USD Bn, AGR (%), CAGR(%))
Table 54. North America OTC Drugs & Dietary Supplements Market by Distribution Channel, 2021-2031 (USD Bn, AGR (%), CAGR(%))(V – Shaped Recovery)
Table 55. North America OTC Drugs & Dietary Supplements Market by Distribution Channel, 2021-2031 (USD Bn, AGR (%), CAGR(%))(W – Shaped Recovery)
Table 56. North America OTC Drugs & Dietary Supplements Market by Distribution Channel, 2021-2031 (USD Bn, AGR (%), CAGR(%))(U – Shaped Recovery)
Table 57. North America OTC Drugs & Dietary Supplements Market by Distribution Channel, 2021-2031 (USD Bn, AGR (%), CAGR(%))(L – Shaped Recovery)
Table 58. North America OTC Drugs & Dietary Supplements Market by Category, 2021-2031 (USD Bn, AGR (%), CAGR(%))
Table 59. North America OTC Drugs & Dietary Supplements Market by Category, 2021-2031 (USD Bn, AGR (%), CAGR(%))(V – Shaped Recovery)
Table 60. North America OTC Drugs & Dietary Supplements Market by Category, 2021-2031 (USD Bn, AGR (%), CAGR(%))(W – Shaped Recovery)
Table 61. North America OTC Drugs & Dietary Supplements Market by Category, 2021-2031 (USD Bn, AGR (%), CAGR(%))(U – Shaped Recovery)
Table 62. North America OTC Drugs & Dietary Supplements Market by Category, 2021-2031 (USD Bn, AGR (%), CAGR(%))(L – Shaped Recovery)
Table 63. North America OTC Drugs & Dietary Supplements Market by Allergy Type, 2021-2031 (USD Bn, AGR (%), CAGR(%))
Table 64. North America OTC Drugs & Dietary Supplements Market by Allergy Type, 2021-2031 (USD Bn, AGR (%), CAGR(%))(V-Shape Recovery)
Table 65. North America OTC Drugs & Dietary Supplements Market by Allergy Type, 2021-2031 (USD Bn, AGR (%), CAGR(%))(W-Shape Recovery)
Table 66. North America OTC Drugs & Dietary Supplements Market by Allergy Type, 2021-2031 (USD Bn, AGR (%), CAGR(%))(U-Shape Recovery)
Table 67. North America OTC Drugs & Dietary Supplements Market by Allergy Type, 2021-2031 (USD Bn, AGR (%), CAGR(%))(L-Shape Recovery)
Table 68. North America OTC Drugs & Dietary Supplements Market by Allergy Drugs, 2021-2031 (USD Bn, AGR (%), CAGR(%))
Table 69. North America OTC Drugs & Dietary Supplements Market by Allergy Drugs, 2021-2031 (USD Bn, AGR (%), CAGR(%))(V-Shape Recovery)
Table 70. North America OTC Drugs & Dietary Supplements Market by Allergy Drugs, 2021-2031 (USD Bn, AGR (%), CAGR(%))(W-Shape Recovery)
Table 71. North America OTC Drugs & Dietary Supplements Market by Allergy Drugs, 2021-2031 (USD Bn, AGR (%), CAGR(%))(U-Shape Recovery)
Table 72. North America OTC Drugs & Dietary Supplements Market by Allergy Drugs, 2021-2031 (USD Bn, AGR (%), CAGR(%))(L-Shape Recovery)
Table 73. North America OTC Drugs & Dietary Supplements Market by Product Type, 2021-2031 (USD Bn, AGR (%), CAGR(%))
Table 74. North America OTC Drugs & Dietary Supplements Market by Product Type, 2021-2031 (USD Bn, AGR (%), CAGR(%))(V – Shaped Recovery)
Table 75. North America OTC Drugs & Dietary Supplements Market by Product Type, 2021-2031 (USD Bn, AGR (%), CAGR(%))(W – Shaped Recovery)
Table 76. North America OTC Drugs & Dietary Supplements Market by Product Type, 2021-2031 (USD Bn, AGR (%), CAGR(%))(U – Shaped Recovery)
Table 77. North America OTC Drugs & Dietary Supplements Market by Product Type, 2021-2031 (USD Bn, AGR (%), CAGR(%))(L – Shaped Recovery)
Table 78. North America OTC Drugs & Dietary Supplements Market by Dosage Form, 2021-2031 (USD Bn, AGR (%), CAGR(%))
Table 79. North America OTC Drugs & Dietary Supplements Market by Dosage Form, 2021-2031 (USD Bn, AGR (%), CAGR(%))(V – Shaped Recovery)
Table 80. North America OTC Drugs & Dietary Supplements Market by Dosage Form, 2021-2031 (USD Bn, AGR (%), CAGR(%))(W – Shaped Recovery)
Table 81. North America OTC Drugs & Dietary Supplements Market by Dosage Form, 2021-2031 (USD Bn, AGR (%), CAGR(%))(U – Shaped Recovery)
Table 82. North America OTC Drugs & Dietary Supplements Market by Dosage Form, 2021-2031 (USD Bn, AGR (%), CAGR(%))(L – Shaped Recovery)
Table 83. Europe OTC Drugs & Dietary Supplements Market, 2021-2031 (USD Bn, AGR (%), CAGR(%))
Table 84. Europe OTC Drugs & Dietary Supplements Market, 2021-2031 (USD Bn, AGR (%), CAGR(%))(V – Shaped Recovery)
Table 85. Europe OTC Drugs & Dietary Supplements Market, 2021-2031 (USD Bn, AGR (%), CAGR(%))(W – Shaped Recovery)
Table 86. Europe OTC Drugs & Dietary Supplements Market, 2021-2031 (USD Bn, AGR (%), CAGR(%))(U – Shaped Recovery)
Table 87. Europe OTC Drugs & Dietary Supplements Market, 2021-2031 (USD Bn, AGR (%), CAGR(%))(L – Shaped Recovery)
Table 88. Europe OTC Drugs & Dietary Supplements Market by Country, 2021-2031 (USD Bn, AGR (%), CAGR(%))
Table 89. Europe OTC Drugs & Dietary Supplements Market by Country, 2021-2031 (USD Bn, AGR (%), CAGR(%))(V – Shaped Recovery)
Table 90. Europe OTC Drugs & Dietary Supplements Market by Country, 2021-2031 (USD Bn, AGR (%), CAGR(%))(W – Shaped Recovery)
Table 91. Europe OTC Drugs & Dietary Supplements Market by Country, 2021-2031 (USD Bn, AGR (%), CAGR(%))(U – Shaped Recovery)
Table 92. Europe OTC Drugs & Dietary Supplements Market by Country, 2021-2031 (USD Bn, AGR (%), CAGR(%))(L – Shaped Recovery)
Table 93. Europe OTC Drugs & Dietary Supplements Market by Distribution Channel, 2021-2031 (USD Bn, AGR (%), CAGR(%))
Table 94. Europe OTC Drugs & Dietary Supplements Market by Distribution Channel, 2021-2031 (USD Bn, AGR (%), CAGR(%))(V – Shaped Recovery)
Table 95. Europe OTC Drugs & Dietary Supplements Market by Distribution Channel, 2021-2031 (USD Bn, AGR (%), CAGR(%))(W – Shaped Recovery)
Table 96. Europe OTC Drugs & Dietary Supplements Market by Distribution Channel, 2021-2031 (USD Bn, AGR (%), CAGR(%))(U – Shaped Recovery)
Table 97. Europe OTC Drugs & Dietary Supplements Market by Distribution Channel, 2021-2031 (USD Bn, AGR (%), CAGR(%))(L – Shaped Recovery)
Table 98. Europe OTC Drugs & Dietary Supplements Market by Category, 2021-2031 (USD Bn, AGR (%), CAGR(%))
Table 99. Europe OTC Drugs & Dietary Supplements Market by Category, 2021-2031 (USD Bn, AGR (%), CAGR(%))(V – Shaped Recovery)
Table 100. Europe OTC Drugs & Dietary Supplements Market by Category, 2021-2031 (USD Bn, AGR (%), CAGR(%))(W – Shaped Recovery)
Table 101. Europe OTC Drugs & Dietary Supplements Market by Category, 2021-2031 (USD Bn, AGR (%), CAGR(%))(U – Shaped Recovery)
Table 102. Europe OTC Drugs & Dietary Supplements Market by Category, 2021-2031 (USD Bn, AGR (%), CAGR(%))(L – Shaped Recovery)
Table 103. Europe OTC Drugs & Dietary Supplements Market by Allergy Type, 2021-2031 (USD Bn, AGR (%), CAGR(%))
Table 104. Europe OTC Drugs & Dietary Supplements Market by Allergy Type, 2021-2031 (USD Bn, AGR (%), CAGR(%))(V-Shape Recovery)
Table 105. Europe OTC Drugs & Dietary Supplements Market by Allergy Type, 2021-2031 (USD Bn, AGR (%), CAGR(%))(W-Shape Recovery)
Table 106. Europe OTC Drugs & Dietary Supplements Market by Allergy Type, 2021-2031 (USD Bn, AGR (%), CAGR(%))(U-Shape Recovery)
Table 107. Europe OTC Drugs & Dietary Supplements Market by Allergy Type, 2021-2031 (USD Bn, AGR (%), CAGR(%))(L-Shape Recovery)
Table 108. Europe OTC Drugs & Dietary Supplements Market by Allergy Drugs, 2021-2031 (USD Bn, AGR (%), CAGR(%))
Table 109. Europe OTC Drugs & Dietary Supplements Market by Allergy Drugs, 2021-2031 (USD Bn, AGR (%), CAGR(%))(V-Shape Recovery)
Table 110. Europe OTC Drugs & Dietary Supplements Market by Allergy Drugs, 2021-2031 (USD Bn, AGR (%), CAGR(%))(W-Shape Recovery)
Table 111. Europe OTC Drugs & Dietary Supplements Market by Allergy Drugs, 2021-2031 (USD Bn, AGR (%), CAGR(%))(U-Shape Recovery)
Table 112. Europe OTC Drugs & Dietary Supplements Market by Allergy Drugs, 2021-2031 (USD Bn, AGR (%), CAGR(%))(L-Shape Recovery)
Table 113. Europe OTC Drugs & Dietary Supplements Market by Product Type, 2021-2031 (USD Bn, AGR (%), CAGR(%))
Table 114. Europe OTC Drugs & Dietary Supplements Market by Product Type, 2021-2031 (USD Bn, AGR (%), CAGR(%))(V – Shaped Recovery)
Table 115. Europe OTC Drugs & Dietary Supplements Market by Product Type, 2021-2031 (USD Bn, AGR (%), CAGR(%))(W – Shaped Recovery)
Table 116. Europe OTC Drugs & Dietary Supplements Market by Product Type, 2021-2031 (USD Bn, AGR (%), CAGR(%))(U – Shaped Recovery)
Table 117. Europe OTC Drugs & Dietary Supplements Market by Product Type, 2021-2031 (USD Bn, AGR (%), CAGR(%))(L – Shaped Recovery)
Table 118. Europe OTC Drugs & Dietary Supplements Market by Dosage Form, 2021-2031 (USD Bn, AGR (%), CAGR(%))
Table 119. Europe OTC Drugs & Dietary Supplements Market by Dosage Form, 2021-2031 (USD Bn, AGR (%), CAGR(%))(V – Shaped Recovery)
Table 120. Europe OTC Drugs & Dietary Supplements Market by Dosage Form, 2021-2031 (USD Bn, AGR (%), CAGR(%))(W – Shaped Recovery)
Table 121. Europe OTC Drugs & Dietary Supplements Market by Dosage Form, 2021-2031 (USD Bn, AGR (%), CAGR(%))(U – Shaped Recovery)
Table 122. Europe OTC Drugs & Dietary Supplements Market by Dosage Form, 2021-2031 (USD Bn, AGR (%), CAGR(%))(L – Shaped Recovery)
Table 123. Asia-Pacific OTC Drugs & Dietary Supplements Market, 2021-2031 (USD Bn, AGR (%), CAGR(%))
Table 124. Asia-Pacific OTC Drugs & Dietary Supplements Market, 2021-2031 (USD Bn, AGR (%), CAGR(%))(V – Shaped Recovery)
Table 125. Asia-Pacific OTC Drugs & Dietary Supplements Market, 2021-2031 (USD Bn, AGR (%), CAGR(%))(W – Shaped Recovery)
Table 126. Asia-Pacific OTC Drugs & Dietary Supplements Market, 2021-2031 (USD Bn, AGR (%), CAGR(%))(U – Shaped Recovery)
Table 127. Asia-Pacific OTC Drugs & Dietary Supplements Market, 2021-2031 (USD Bn, AGR (%), CAGR(%))(L – Shaped Recovery)
Table 128. Asia-Pacific OTC Drugs & Dietary Supplements Market by Country, 2021-2031 (USD Bn, AGR (%), CAGR(%))
Table 129. Asia-Pacific OTC Drugs & Dietary Supplements Market by Country, 2021-2031 (USD Bn, AGR (%), CAGR(%))(V – Shaped Recovery)
Table 130. Asia-Pacific OTC Drugs & Dietary Supplements Market by Country, 2021-2031 (USD Bn, AGR (%), CAGR(%))(W – Shaped Recovery)
Table 131. Asia-Pacific OTC Drugs & Dietary Supplements Market by Country, 2021-2031 (USD Bn, AGR (%), CAGR(%))(U – Shaped Recovery)
Table 132. Asia-Pacific OTC Drugs & Dietary Supplements Market by Country, 2021-2031 (USD Bn, AGR (%), CAGR(%))(L – Shaped Recovery)
Table 133. Asia-Pacific OTC Drugs & Dietary Supplements Market by Distribution Channel, 2021-2031 (USD Bn, AGR (%), CAGR(%))
Table 134. Asia-Pacific OTC Drugs & Dietary Supplements Market by Distribution Channel, 2021-2031 (USD Bn, AGR (%), CAGR(%))(V – Shaped Recovery)
Table 135. Asia-Pacific OTC Drugs & Dietary Supplements Market by Distribution Channel, 2021-2031 (USD Bn, AGR (%), CAGR(%))(W – Shaped Recovery)
Table 136. Asia-Pacific OTC Drugs & Dietary Supplements Market by Distribution Channel, 2021-2031 (USD Bn, AGR (%), CAGR(%))(U – Shaped Recovery)
Table 137. Asia-Pacific OTC Drugs & Dietary Supplements Market by Distribution Channel, 2021-2031 (USD Bn, AGR (%), CAGR(%))(L – Shaped Recovery)
Table 138. Asia-Pacific OTC Drugs & Dietary Supplements Market by Category, 2021-2031 (USD Bn, AGR (%), CAGR(%))
Table 139. Asia-Pacific OTC Drugs & Dietary Supplements Market by Category, 2021-2031 (USD Bn, AGR (%), CAGR(%))(V – Shaped Recovery)
Table 140. Asia-Pacific OTC Drugs & Dietary Supplements Market by Category, 2021-2031 (USD Bn, AGR (%), CAGR(%))(W – Shaped Recovery)
Table 141. Asia-Pacific OTC Drugs & Dietary Supplements Market by Category, 2021-2031 (USD Bn, AGR (%), CAGR(%))(U – Shaped Recovery)
Table 142. Asia-Pacific OTC Drugs & Dietary Supplements Market by Category, 2021-2031 (USD Bn, AGR (%), CAGR(%))(L – Shaped Recovery)
Table 143. Asia-Pacific OTC Drugs & Dietary Supplements Market by Allergy Type, 2021-2031 (USD Bn, AGR (%), CAGR(%))
Table 144. Asia-Pacific OTC Drugs & Dietary Supplements Market by Allergy Type, 2021-2031 (USD Bn, AGR (%), CAGR(%))(V-Shape Recovery)
Table 145. Asia-Pacific OTC Drugs & Dietary Supplements Market by Allergy Type, 2021-2031 (USD Bn, AGR (%), CAGR(%))(W-Shape Recovery)
Table 146. Asia-Pacific OTC Drugs & Dietary Supplements Market by Allergy Type, 2021-2031 (USD Bn, AGR (%), CAGR(%))(U-Shape Recovery)
Table 147. Asia-Pacific OTC Drugs & Dietary Supplements Market by Allergy Type, 2021-2031 (USD Bn, AGR (%), CAGR(%))(L-Shape Recovery)
Table 148. Asia-Pacific OTC Drugs & Dietary Supplements Market by Allergy Drugs, 2021-2031 (USD Bn, AGR (%), CAGR(%))
Table 149. Asia-Pacific OTC Drugs & Dietary Supplements Market by Allergy Drugs, 2021-2031 (USD Bn, AGR (%), CAGR(%))(V-Shape Recovery)
Table 150. Asia-Pacific OTC Drugs & Dietary Supplements Market by Allergy Drugs, 2021-2031 (USD Bn, AGR (%), CAGR(%))(W-Shape Recovery)
Table 151. Asia-Pacific OTC Drugs & Dietary Supplements Market by Allergy Drugs, 2021-2031 (USD Bn, AGR (%), CAGR(%))(U-Shape Recovery)
Table 152. Asia-Pacific OTC Drugs & Dietary Supplements Market by Allergy Drugs, 2021-2031 (USD Bn, AGR (%), CAGR(%))(L-Shape Recovery)
Table 153. Asia-Pacific OTC Drugs & Dietary Supplements Market by Product Type, 2021-2031 (USD Bn, AGR (%), CAGR(%))
Table 154. Asia-Pacific OTC Drugs & Dietary Supplements Market by Product Type, 2021-2031 (USD Bn, AGR (%), CAGR(%))(V – Shaped Recovery)
Table 155. Asia-Pacific OTC Drugs & Dietary Supplements Market by Product Type, 2021-2031 (USD Bn, AGR (%), CAGR(%))(W – Shaped Recovery)
Table 156. Asia-Pacific OTC Drugs & Dietary Supplements Market by Product Type, 2021-2031 (USD Bn, AGR (%), CAGR(%))(U – Shaped Recovery)
Table 157. Asia-Pacific OTC Drugs & Dietary Supplements Market by Product Type, 2021-2031 (USD Bn, AGR (%), CAGR(%))(L – Shaped Recovery)
Table 158. Asia-Pacific OTC Drugs & Dietary Supplements Market by Dosage Form, 2021-2031 (USD Bn, AGR (%), CAGR(%))
Table 159. Asia-Pacific OTC Drugs & Dietary Supplements Market by Dosage Form, 2021-2031 (USD Bn, AGR (%), CAGR(%))(V – Shaped Recovery)
Table 160. Asia-Pacific OTC Drugs & Dietary Supplements Market by Dosage Form, 2021-2031 (USD Bn, AGR (%), CAGR(%))(W – Shaped Recovery)
Table 161. Asia-Pacific OTC Drugs & Dietary Supplements Market by Dosage Form, 2021-2031 (USD Bn, AGR (%), CAGR(%))(U – Shaped Recovery)
Table 162. Asia-Pacific OTC Drugs & Dietary Supplements Market by Dosage Form, 2021-2031 (USD Bn, AGR (%), CAGR(%))(L – Shaped Recovery)
Table 163. Latin America OTC Drugs & Dietary Supplements Market, 2021-2031 (USD Bn, AGR (%), CAGR(%))
Table 164. Latin America OTC Drugs & Dietary Supplements Market, 2021-2031 (USD Bn, AGR (%), CAGR(%))(V – Shaped Recovery)
Table 165. Latin America OTC Drugs & Dietary Supplements Market, 2021-2031 (USD Bn, AGR (%), CAGR(%))(W – Shaped Recovery)
Table 166. Latin America OTC Drugs & Dietary Supplements Market, 2021-2031 (USD Bn, AGR (%), CAGR(%))(U – Shaped Recovery)
Table 167. Latin America OTC Drugs & Dietary Supplements Market, 2021-2031 (USD Bn, AGR (%), CAGR(%))(L – Shaped Recovery)
Table 168. Latin America OTC Drugs & Dietary Supplements Market by Country, 2021-2031 (USD Bn, AGR (%), CAGR(%))
Table 169. Latin America OTC Drugs & Dietary Supplements Market by Country, 2021-2031 (USD Bn, AGR (%), CAGR(%))(V – Shaped Recovery)
Table 170. Latin America OTC Drugs & Dietary Supplements Market by Country, 2021-2031 (USD Bn, AGR (%), CAGR(%))(W – Shaped Recovery)
Table 171. Latin America OTC Drugs & Dietary Supplements Market by Country, 2021-2031 (USD Bn, AGR (%), CAGR(%))(U – Shaped Recovery)
Table 172. Latin America OTC Drugs & Dietary Supplements Market by Country, 2021-2031 (USD Bn, AGR (%), CAGR(%))(L – Shaped Recovery)
Table 173. Latin America OTC Drugs & Dietary Supplements Market by Distribution Channel, 2021-2031 (USD Bn, AGR (%), CAGR(%))
Table 174. Latin America OTC Drugs & Dietary Supplements Market by Distribution Channel, 2021-2031 (USD Bn, AGR (%), CAGR(%))(V – Shaped Recovery)
Table 175. Latin America OTC Drugs & Dietary Supplements Market by Distribution Channel, 2021-2031 (USD Bn, AGR (%), CAGR(%))(W – Shaped Recovery)
Table 176. Latin America OTC Drugs & Dietary Supplements Market by Distribution Channel, 2021-2031 (USD Bn, AGR (%), CAGR(%))(U – Shaped Recovery)
Table 177. Latin America OTC Drugs & Dietary Supplements Market by Distribution Channel, 2021-2031 (USD Bn, AGR (%), CAGR(%))(L – Shaped Recovery)
Table 178. Latin America OTC Drugs & Dietary Supplements Market by Category, 2021-2031 (USD Bn, AGR (%), CAGR(%))
Table 179. Latin America OTC Drugs & Dietary Supplements Market by Category, 2021-2031 (USD Bn, AGR (%), CAGR(%))(V – Shaped Recovery)
Table 180. Latin America OTC Drugs & Dietary Supplements Market by Category, 2021-2031 (USD Bn, AGR (%), CAGR(%))(W – Shaped Recovery)
Table 181. Latin America OTC Drugs & Dietary Supplements Market by Category, 2021-2031 (USD Bn, AGR (%), CAGR(%))(U – Shaped Recovery)
Table 182. Latin America OTC Drugs & Dietary Supplements Market by Category, 2021-2031 (USD Bn, AGR (%), CAGR(%))(L – Shaped Recovery)
Table 183. Latin America OTC Drugs & Dietary Supplements Market by Allergy Type, 2021-2031 (USD Bn, AGR (%), CAGR(%))
Table 184. Latin America OTC Drugs & Dietary Supplements Market by Allergy Type, 2021-2031 (USD Bn, AGR (%), CAGR(%))(V-Shape Recovery)
Table 185. Latin America OTC Drugs & Dietary Supplements Market by Allergy Type, 2021-2031 (USD Bn, AGR (%), CAGR(%))(W-Shape Recovery)
Table 186. Latin America OTC Drugs & Dietary Supplements Market by Allergy Type, 2021-2031 (USD Bn, AGR (%), CAGR(%))(U-Shape Recovery)
Table 187. Latin America OTC Drugs & Dietary Supplements Market by Allergy Type, 2021-2031 (USD Bn, AGR (%), CAGR(%))(L-Shape Recovery)
Table 188. Latin America OTC Drugs & Dietary Supplements Market by Allergy Drugs, 2021-2031 (USD Bn, AGR (%), CAGR(%))
Table 189. Latin America OTC Drugs & Dietary Supplements Market by Allergy Drugs, 2021-2031 (USD Bn, AGR (%), CAGR(%))(V-Shape Recovery)
Table 190. Latin America OTC Drugs & Dietary Supplements Market by Allergy Drugs, 2021-2031 (USD Bn, AGR (%), CAGR(%))(W-Shape Recovery)
Table 191. Latin America OTC Drugs & Dietary Supplements Market by Allergy Drugs, 2021-2031 (USD Bn, AGR (%), CAGR(%))(U-Shape Recovery)
Table 192. Latin America OTC Drugs & Dietary Supplements Market by Allergy Drugs, 2021-2031 (USD Bn, AGR (%), CAGR(%))(L-Shape Recovery)
Table 193. Latin America OTC Drugs & Dietary Supplements Market by Product Type, 2021-2031 (USD Bn, AGR (%), CAGR(%))
Table 194. Latin America OTC Drugs & Dietary Supplements Market by Product Type, 2021-2031 (USD Bn, AGR (%), CAGR(%))(V – Shaped Recovery)
Table 195. Latin America OTC Drugs & Dietary Supplements Market by Product Type, 2021-2031 (USD Bn, AGR (%), CAGR(%))(W – Shaped Recovery)
Table 196. Latin America OTC Drugs & Dietary Supplements Market by Product Type, 2021-2031 (USD Bn, AGR (%), CAGR(%))(U – Shaped Recovery)
Table 197. Latin America OTC Drugs & Dietary Supplements Market by Product Type, 2021-2031 (USD Bn, AGR (%), CAGR(%))(L – Shaped Recovery)
Table 198. Latin America OTC Drugs & Dietary Supplements Market by Dosage Form, 2021-2031 (USD Bn, AGR (%), CAGR(%))
Table 199. Latin America OTC Drugs & Dietary Supplements Market by Dosage Form, 2021-2031 (USD Bn, AGR (%), CAGR(%))(V – Shaped Recovery)
Table 200. Latin America OTC Drugs & Dietary Supplements Market by Dosage Form, 2021-2031 (USD Bn, AGR (%), CAGR(%))(W – Shaped Recovery)
Table 201. Latin America OTC Drugs & Dietary Supplements Market by Dosage Form, 2021-2031 (USD Bn, AGR (%), CAGR(%))(U – Shaped Recovery)
Table 202. Latin America OTC Drugs & Dietary Supplements Market by Dosage Form, 2021-2031 (USD Bn, AGR (%), CAGR(%))(L – Shaped Recovery)
Table 203. Middle East & Africa OTC Drugs & Dietary Supplements Market, 2021-2031 (USD Bn, AGR (%), CAGR(%))
Table 204. Middle East & Africa OTC Drugs & Dietary Supplements Market, 2021-2031 (USD Bn, AGR (%), CAGR(%))(V – Shaped Recovery)
Table 205. Middle East & Africa OTC Drugs & Dietary Supplements Market, 2021-2031 (USD Bn, AGR (%), CAGR(%))(W – Shaped Recovery)
Table 206. Middle East & Africa OTC Drugs & Dietary Supplements Market, 2021-2031 (USD Bn, AGR (%), CAGR(%))(U – Shaped Recovery)
Table 207. Middle East & Africa OTC Drugs & Dietary Supplements Market, 2021-2031 (USD Bn, AGR (%), CAGR(%))(L – Shaped Recovery)
Table 208. Middle East & Africa OTC Drugs & Dietary Supplements Market by Country, 2021-2031 (USD Bn, AGR (%), CAGR(%))
Table 209. Middle East & Africa OTC Drugs & Dietary Supplements Market by Country, 2021-2031 (USD Bn, AGR (%), CAGR(%))(V – Shaped Recovery)
Table 210. Middle East & Africa OTC Drugs & Dietary Supplements Market by Country, 2021-2031 (USD Bn, AGR (%), CAGR(%))(W – Shaped Recovery)
Table 211. Middle East & Africa OTC Drugs & Dietary Supplements Market by Country, 2021-2031 (USD Bn, AGR (%), CAGR(%))(U – Shaped Recovery)
Table 212. Middle East & Africa OTC Drugs & Dietary Supplements Market by Country, 2021-2031 (USD Bn, AGR (%), CAGR(%))(L – Shaped Recovery)
Table 213. Middle East & Africa OTC Drugs & Dietary Supplements Market by Distribution Channel, 2021-2031 (USD Bn, AGR (%), CAGR(%))
Table 214. Middle East & Africa OTC Drugs & Dietary Supplements Market by Distribution Channel, 2021-2031 (USD Bn, AGR (%), CAGR(%))(V – Shaped Recovery)
Table 215. Middle East & Africa OTC Drugs & Dietary Supplements Market by Distribution Channel, 2021-2031 (USD Bn, AGR (%), CAGR(%))(W – Shaped Recovery)
Table 216. Middle East & Africa OTC Drugs & Dietary Supplements Market by Distribution Channel, 2021-2031 (USD Bn, AGR (%), CAGR(%))(U – Shaped Recovery)
Table 217. Middle East & Africa OTC Drugs & Dietary Supplements Market by Distribution Channel, 2021-2031 (USD Bn, AGR (%), CAGR(%))(L – Shaped Recovery)
Table 218. Middle East & Africa OTC Drugs & Dietary Supplements Market by Category, 2021-2031 (USD Bn, AGR (%), CAGR(%))
Table 219. Middle East & Africa OTC Drugs & Dietary Supplements Market by Category, 2021-2031 (USD Bn, AGR (%), CAGR(%))(V – Shaped Recovery)
Table 220. Middle East & Africa OTC Drugs & Dietary Supplements Market by Category, 2021-2031 (USD Bn, AGR (%), CAGR(%))(W – Shaped Recovery)
Table 221. Middle East & Africa OTC Drugs & Dietary Supplements Market by Category, 2021-2031 (USD Bn, AGR (%), CAGR(%))(U – Shaped Recovery)
Table 222. Middle East & Africa OTC Drugs & Dietary Supplements Market by Category, 2021-2031 (USD Bn, AGR (%), CAGR(%))(L – Shaped Recovery)
Table 223. Middle East & Africa OTC Drugs & Dietary Supplements Market by Allergy Type, 2021-2031 (USD Bn, AGR (%), CAGR(%))
Table 224. Middle East & Africa OTC Drugs & Dietary Supplements Market by Allergy Type, 2021-2031 (USD Bn, AGR (%), CAGR(%))(V-Shape Recovery)
Table 225. Middle East & Africa OTC Drugs & Dietary Supplements Market by Allergy Type, 2021-2031 (USD Bn, AGR (%), CAGR(%))(W-Shape Recovery)
Table 226. Middle East & Africa OTC Drugs & Dietary Supplements Market by Allergy Type, 2021-2031 (USD Bn, AGR (%), CAGR(%))(U-Shape Recovery)
Table 227. Middle East & Africa OTC Drugs & Dietary Supplements Market by Allergy Type, 2021-2031 (USD Bn, AGR (%), CAGR(%))(L-Shape Recovery)
Table 228. Middle East & Africa OTC Drugs & Dietary Supplements Market by Allergy Drugs, 2021-2031 (USD Bn, AGR (%), CAGR(%))
Table 229. Middle East & Africa OTC Drugs & Dietary Supplements Market by Allergy Drugs, 2021-2031 (USD Bn, AGR (%), CAGR(%))(V-Shape Recovery)
Table 230. Middle East & Africa OTC Drugs & Dietary Supplements Market by Allergy Drugs, 2021-2031 (USD Bn, AGR (%), CAGR(%))(W-Shape Recovery)
Table 231. Middle East & Africa OTC Drugs & Dietary Supplements Market by Allergy Drugs, 2021-2031 (USD Bn, AGR (%), CAGR(%))(U-Shape Recovery)
Table 232. Middle East & Africa OTC Drugs & Dietary Supplements Market by Allergy Drugs, 2021-2031 (USD Bn, AGR (%), CAGR(%))(L-Shape Recovery)
Table 233. Middle East & Africa OTC Drugs & Dietary Supplements Market by Product Type, 2021-2031 (USD Bn, AGR (%), CAGR(%))
Table 234. Middle East & Africa OTC Drugs & Dietary Supplements Market by Product Type, 2021-2031 (USD Bn, AGR (%), CAGR(%))(V – Shaped Recovery)
Table 235. Middle East & Africa OTC Drugs & Dietary Supplements Market by Product Type, 2021-2031 (USD Bn, AGR (%), CAGR(%))(W – Shaped Recovery)
Table 236. Middle East & Africa OTC Drugs & Dietary Supplements Market by Product Type, 2021-2031 (USD Bn, AGR (%), CAGR(%))(U – Shaped Recovery)
Table 237. Middle East & Africa OTC Drugs & Dietary Supplements Market by Product Type, 2021-2031 (USD Bn, AGR (%), CAGR(%))(L – Shaped Recovery)
Table 238. Middle East & Africa OTC Drugs & Dietary Supplements Market by Dosage Form, 2021-2031 (USD Bn, AGR (%), CAGR(%))
Table 239. Middle East & Africa OTC Drugs & Dietary Supplements Market by Dosage Form, 2021-2031 (USD Bn, AGR (%), CAGR(%))(V – Shaped Recovery)
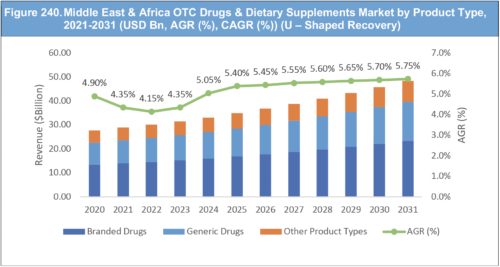
Table 240. Middle East & Africa OTC Drugs & Dietary Supplements Market by Dosage Form, 2021-2031 (USD Bn, AGR (%), CAGR(%))(W – Shaped Recovery)
Table 241. Middle East & Africa OTC Drugs & Dietary Supplements Market by Dosage Form, 2021-2031 (USD Bn, AGR (%), CAGR(%))(U – Shaped Recovery)
Table 242. Middle East & Africa OTC Drugs & Dietary Supplements Market by Dosage Form, 2021-2031 (USD Bn, AGR (%), CAGR(%))(L – Shaped Recovery)
Table 243. Taisho Pharmaceutical Holdings Co., Ltd.: Company Information
Table 244. Taisho Pharmaceutical Holdings Co., Ltd.: Company Service Benchmarking
Table 245. Taisho Pharmaceutical Holdings Co., Ltd.: Company Recent Development Till Apr,2021
Table 246. Nippon Chemiphar Co., Ltd..: Company Information
Table 247. Nippon Chemiphar Co., Ltd..: Company Revenue 2017-2021 (US$Mn, AGR %)
Table 248. Nippon Chemiphar Co., Ltd..: Company Service Benchmarking
Table 249. Nippon Chemiphar Co. Ltd..: Company Recent Development Till Apr,2021
Table 250. H Lundbeck A/S: Company Information
Table 251. H Lundbeck A/S: Company Revenue 2016-2020 (US$Mn, AGR %)
Table 252. H Lundbeck A/S: Company Product and Service Benchmarking
Table 253. H Lundbeck A/S.: Company Recent Development Till Apr,2021
Table 254. Teva Pharmaceutical Industries Ltd : Company Information
Table 255. Teva Pharmaceutical Industries Ltd : Company Revenue 2016-2020(US$Mn, AGR %)
Table 256. Teva Pharmaceutical Industries Ltd .: Company Recent Developments till Feb,2021
Table 257. Novartis AG: Company Information
Table 258. Novartis AG: Company Revenue 2016-2020(US$Mn, AGR %)
Table 259. Novartis AG : Company Product and Service Benchmarking
Table 260. Novartis AG .: Company Recent Developments till Feb,2021
Table 261. Pfizer Inc.: Company Information
Table 262. Pfizer Inc.: Company Revenue 2016-2020 (US$Mn, AGR %)
Table 263. Pfizer Inc.: Company Product and Service Benchmarking
Table 264. Pfizer Inc .: Company Recent Developments till Feb,2021
Table 265. Mylan N.V..: Company Information
Table 266. Mylan N.V.: Company Revenue 2016-2020 (US$Mn, AGR %)
Table 267. Mylan N.V .: Company Recent Developments till Feb,2021
Table 268. Abbott Laboratories.: Company Information
Table 269. Abbott Laboratories.: Company Revenue 2016-2020(US$Mn, AGR %)
Table 270. Abbott Laboratories .: Company Product and Service Benchmarking
Table 271. Abbott Laboratories.: Company Recent Developments till Feb,2021
Table 272. Fresenius SE & Co KgaA.: Company Information
Table 273. Fresenius SE & Co KgaA.: Company Revenue 2016-2020 (US$Mn, AGR %)
Table 274. Fresenius SE & Co KgaA.: Company Product and Service Benchmarking
Table 275. Fresenius SE & Co KgaA.: Company Recent Developments till Feb,2021
Table 276. Sun Pharmaceutical Industries.: Company Information
Table 277. Sun Pharmaceutical Industries.: Company Revenue 2016-2020(US$Mn, AGR %)
Table 278. Sun Pharmaceutical Industries.: Company Product and Service Benchmarking
Table 279. Sun Pharmaceutical Industries.: Company Recent Developments till Feb,2021
Table 280. Sanofi SA.: Company Information
Table 281. Sanofi SA.: Company Revenue 2016-2020 (US$Mn, AGR %)
Table 282. Sanofi SA.: Company Product and Service
Table 283. Sanofi SA.: Company Recent Developments till Feb,2021
Table 284. Roche Holding AG.: Company Information
Table 285. Roche Holding AG: Revenue 2016-2020 (US$Mn, AGR %)
Table 286. Roche Holding AG: Product and Service
Table 287. Roche Holding AG.: Company Recent Developments till Feb,2021
Table 288. Lupin Limited: Company Information
Table 289. Lupin Limited: Company Revenue 2016-2020 (US$Mn, AGR %)
Table 290. Lupin Limited: Product and Service
Table 291. Lupin Limited.: Company Recent Developments till Feb,2021
Table 292. Alcon AG : Company Information
Table 293. Alcon AG.: Company Revenue 2017-2021 (US$Mn, AGR %)
Table 294. Lupin Limited: Product and Service
Table 295. Alcon AG.: Company Recent Developments till Feb,2021
Table 296. Sato Pharmaceutical.: Company Information
Table 297. Sato Pharmaceutical .: Company Product and Service Benchmarking
Table 298. Herbalife Nutrition Ltd.: Company Information
Table 299. Herbalife Nutrition Ltd.: Company Service Benchmarking
Table 300. Bayer AG..: Company Information
Table 301. Bayer AG..: Company Revenue 2016-2020 (US$Mn, AGR %)
Table 302. Bayer AG..: Company Service Benchmarking
Table 303. Bayer AG..: Company Recent Developments till Apr,2021
Table 304. Glanbia plc: Company Information
Table 305. Glanbia plc: Company Revenue 2016-2020 (US$Mn, AGR %)
Table 306. Glanbia plc: Company Product and Service Benchmarking
Table 307. Nature’s Sunshine Products, Inc. (NSP) : Company Information
Table 308. Nature’s Sunshine Products, Inc. (NSP) : Company Revenue 2016-2020(US$Mn, AGR %)
Table 309. Danisco: Company Information
Table 310. Bayer AG..: Company Service Benchmarking
Table 311. Glossary Terms
List of Figures
Figure 1. Global OTC Drugs & Dietary Supplements Market Forecast, 2021-2031 (USD Bn, AGR (%), CAGR (%))
Figure 2. Global OTC Drugs & Dietary Supplements Market Segmentation
Figure 3. Global OTC Drugs & Dietary Supplements Market Segmentation
Figure 4. OTC Pharmaceutical Supply Chain
Figure 5. Global OTC Drugs & Dietary Supplements Market Forecast, 2021-2031 (USD Bn, AGR (%), CAGR (%))
Figure 6. Global OTC Drugs & Dietary Supplements Market Forecast, 2021-2031 (USD Bn, AGR (%), CAGR (%))
Figure 7. Global OTC Drugs & Dietary Supplements Market Forecast, 2021-2031 (USD Bn, AGR (%), CAGR (%))
Figure 8. Global OTC Drugs & Dietary Supplements Market Forecast, 2021-2031 (USD Bn, AGR (%), CAGR (%)) (V – Shaped Recovery)
Figure 9. Global OTC Drugs & Dietary Supplements Market Forecast, 2021-2031 (USD Bn, AGR (%), CAGR (%)) (W – Shaped Recovery)
Figure 10. Global OTC Drugs & Dietary Supplements Market Forecast, 2021-2031 (USD Bn, AGR (%), CAGR (%)) (U – Shaped Recovery)
Figure 11. Global OTC Drugs & Dietary Supplements Market Forecast, 2021-2031 (USD Bn, AGR (%), CAGR (%)) (L – Shaped Recovery)
Figure 12. Global OTC Drugs & Dietary Supplements Market Forecast by Region, 2021-2031 (USD Bn, AGR (%), CAGR (%))
Figure 13. Global OTC Drugs & Dietary Supplements Market Forecast by Region, 2021-2031 (USD Bn, AGR (%), CAGR (%)) (V – Shaped Recovery)
Figure 14. Global OTC Drugs & Dietary Supplements Market Forecast by Region, 2021-2031 (USD Bn, AGR (%), CAGR (%)) (W – Shaped Recovery)
Figure 15. Global OTC Drugs & Dietary Supplements Market Forecast by Region, 2021-2031 (USD Bn, AGR (%), CAGR (%)) (U – Shaped Recovery)
Figure 16. Global OTC Drugs & Dietary Supplements Market Forecast by Region, 2021-2031 (USD Bn, AGR (%), CAGR (%)) (L – Shaped Recovery)
Figure 17. Global OTC Drugs & Dietary Supplements Market Forecast by Distribution Channel, 2021-2031 (USD Bn, AGR (%), CAGR (%))
Figure 18. Global OTC Drugs & Dietary Supplements Market Forecast by Distribution Channel, 2021-2031 (USD Bn, AGR (%), CAGR(%)) (V – Shaped Recovery)
Figure 19. Global OTC Drugs & Dietary Supplements Market Forecast by Distribution Channel, 2021-2031 (USD Bn, AGR (%), CAGR(%)) (W – Shaped Recovery)
Figure 20. Global OTC Drugs & Dietary Supplements Market Forecast by Distribution Channel, 2021-2031 (USD Bn, AGR (%), CAGR(%)) (U – Shaped Recovery)
Figure 21. Global OTC Drugs & Dietary Supplements Market Forecast by Distribution Channel, 2021-2031 (USD Bn, AGR (%), CAGR(%)) (L – Shaped Recovery)
Figure 22. Global OTC Drugs & Dietary Supplements Market by Category, 2021-2031 (USD Bn, AGR (%))
Figure 23. Global OTC Drugs & Dietary Supplements Market by Category, 2021-2031 (USD Bn, AGR (%))(V-Shape Recovery)
Figure 24. Global OTC Drugs & Dietary Supplements Market by Category, 2021-2031 (USD Bn, AGR (%))(W-Shape Recovery)
Figure 25. Global OTC Drugs & Dietary Supplements Market by Category, 2021-2031 (USD Bn, AGR (%))(U-Shape Recovery)
Figure 26. Global OTC Drugs & Dietary Supplements Market by Category, 2021-2031 (USD Bn, AGR (%))(L-Shape Recovery)
Figure 27. Global OTC Drugs & Dietary Supplements Market by Allergy Type, 2021-2031 (USD Bn, AGR (%))
Figure 28. Global OTC Drugs & Dietary Supplements Market by Allergy Type, 2021-2031 (USD Bn, AGR (%))(V-Shape Recovery)
Figure 29. Global OTC Drugs & Dietary Supplements Market by Allergy Type, 2021-2031 (USD Bn, AGR (%))(W-Shape Recovery)
Figure 30. Global OTC Drugs & Dietary Supplements Market by Allergy Type, 2021-2031 (USD Bn, AGR (%))(U-Shape Recovery)
Figure 31. Global OTC Drugs & Dietary Supplements Market by Allergy Type, 2021-2031 (USD Bn, AGR (%))(L-Shape Recovery)
Figure 32. Global OTC Drugs & Dietary Supplements Market by Allergy Drugs, 2021-2031 (USD Bn, AGR (%))
Figure 33. Global OTC Drugs & Dietary Supplements Market by Allergy Drugs, 2021-2031 (USD Bn, AGR (%))(V-Shape Recovery)
Figure 34. Global OTC Drugs & Dietary Supplements Market by Allergy Drugs, 2021-2031 (USD Bn, AGR (%))(W-Shape Recovery)
Figure 35. Global OTC Drugs & Dietary Supplements Market by Allergy Drugs, 2021-2031 (USD Bn, AGR (%))(U-Shape Recovery)
Figure 36. Global OTC Drugs & Dietary Supplements Market by Allergy Drugs, 2021-2031 (USD Bn, AGR (%))(L-Shape Recovery)
Figure 37. Global OTC Drugs & Dietary Supplements Market by Product Type, 2021-2031 (USD Bn, AGR (%), CAGR (%))
Figure 38. Global OTC Drugs & Dietary Supplements Market by Product Type, 2021-2031 (USD Bn, AGR (%), CAGR (%)) (V – Shaped Recovery)
Figure 39. Global OTC Drugs & Dietary Supplements Market by Product Type, 2021-2031 (USD Bn, AGR (%), CAGR (%)) (W – Shaped Recovery)
Figure 40. Global OTC Drugs & Dietary Supplements Market by Product Type, 2021-2031 (USD Bn, AGR (%), CAGR (%)) (U – Shaped Recovery)
Figure 41. Global OTC Drugs & Dietary Supplements Market by Product Type, 2021-2031 (USD Bn, AGR (%), CAGR (%)) (L – Shaped Recovery)
Figure 42. Global OTC Drugs & Dietary Supplements Market by Dosage Form, 2021-2031 (USD Bn, AGR (%), CAGR (%))
Figure 43. Global OTC Drugs & Dietary Supplements Market by Dosage Form, 2021-2031 (USD Bn, AGR (%), CAGR (%)) (V – Shaped Recovery)
Figure 44. Global OTC Drugs & Dietary Supplements Market by Dosage Form, 2021-2031 (USD Bn, AGR (%), CAGR (%)) (W – Shaped Recovery)
Figure 45. Global OTC Drugs & Dietary Supplements Market by Dosage Form, 2021-2031 (USD Bn, AGR (%), CAGR (%)) (U – Shaped Recovery)
Figure 46. Global OTC Drugs & Dietary Supplements Market by Dosage Form, 2021-2031 (USD Bn, AGR (%), CAGR (%)) (L – Shaped Recovery)
Figure 47. North America OTC Drugs & Dietary Supplements Market Forecast, 2021-2031 (USD Bn, AGR (%), CAGR (%))
Figure 48. North America OTC Drugs & Dietary Supplements Market Forecast, 2021-2031 (USD Bn, AGR (%), CAGR (%)) (V – Shaped Recovery)
Figure 49. North America OTC Drugs & Dietary Supplements Market Forecast, 2021-2031 (USD Bn, AGR (%), CAGR (%)) (W – Shaped Recovery)
Figure 50. North America OTC Drugs & Dietary Supplements Market Forecast, 2021-2031 (USD Bn, AGR (%), CAGR (%)) (U – Shaped Recovery)
Figure 51. North America OTC Drugs & Dietary Supplements Market Forecast, 2021-2031 (USD Bn, AGR (%), CAGR (%)) (L – Shaped Recovery)
Figure 52. North America OTC Drugs & Dietary Supplements Market Forecast by Country, 2021-2031 (USD Bn, AGR (%), CAGR (%))
Figure 53. North America OTC Drugs & Dietary Supplements Market Forecast by Country, 2021-2031 (USD Bn, AGR (%), CAGR (%)) (V – Shaped Recovery)
Figure 54. North America OTC Drugs & Dietary Supplements Market Forecast by Country, 2021-2031 (USD Bn, AGR (%), CAGR (%)) (W – Shaped Recovery)
Figure 55. North America OTC Drugs & Dietary Supplements Market Forecast by Country, 2021-2031 (USD Bn, AGR (%), CAGR (%)) (U – Shaped Recovery)
Figure 56. North America OTC Drugs & Dietary Supplements Market Forecast by Country, 2021-2031 (USD Bn, AGR (%), CAGR (%)) (L – Shaped Recovery)
Figure 57. North America OTC Drugs & Dietary Supplements Market Forecast by Distribution Channel, 2021-2031 (USD Bn, AGR (%), CAGR (%))
Figure 58. North America OTC Drugs & Dietary Supplements Market Forecast by Distribution Channel, 2021-2031 (USD Bn, AGR (%), CAGR(%)) (V – Shaped Recovery)
Figure 59. North America OTC Drugs & Dietary Supplements Market Forecast by Distribution Channel, 2021-2031 (USD Bn, AGR (%), CAGR(%)) (W – Shaped Recovery)
Figure 60. North America OTC Drugs & Dietary Supplements Market Forecast by Distribution Channel, 2021-2031 (USD Bn, AGR (%), CAGR(%)) (U – Shaped Recovery)
Figure 61. North America OTC Drugs & Dietary Supplements Market Forecast by Distribution Channel, 2021-2031 (USD Bn, AGR (%), CAGR(%)) (L – Shaped Recovery)
Figure 62. North America OTC Drugs & Dietary Supplements Market by Category, 2021-2031 (USD Bn, AGR (%), CAGR (%))
Figure 63. North America OTC Drugs & Dietary Supplements Market by Category, 2021-2031 (USD Bn, AGR (%), CAGR (%)) (V – Shaped Recovery)
Figure 64. North America OTC Drugs & Dietary Supplements Market by Category, 2021-2031 (USD Bn, AGR (%), CAGR (%)) (W – Shaped Recovery)
Figure 65. North America OTC Drugs & Dietary Supplements Market by Category, 2021-2031 (USD Bn, AGR (%), CAGR (%)) (U – Shaped Recovery)
Figure 66. North America OTC Drugs & Dietary Supplements Market by Category, 2021-2031 (USD Bn, AGR (%), CAGR (%)) (L – Shaped Recovery)
Figure 67. North America OTC Drugs & Dietary Supplements Market by Allergy Type, 2021-2031 (USD Bn, AGR (%))
Figure 68. North America OTC Drugs & Dietary Supplements Market by Allergy Type, 2021-2031 (USD Bn, AGR (%))(V-Shape Recovery)
Figure 69. North America OTC Drugs & Dietary Supplements Market by Allergy Type, 2021-2031 (USD Bn, AGR (%))(W-Shape Recovery)
Figure 70. North America OTC Drugs & Dietary Supplements Market by Allergy Type, 2021-2031 (USD Bn, AGR (%))(U-Shape Recovery)
Figure 71. North America OTC Drugs & Dietary Supplements Market by Allergy Type, 2021-2031 (USD Bn, AGR (%))(L-Shape Recovery)
Figure 72. North America OTC Drugs & Dietary Supplements Market by Allergy Drugs, 2021-2031 (USD Bn, AGR (%))
Figure 73. North America OTC Drugs & Dietary Supplements Market by Allergy Drugs, 2021-2031 (USD Bn, AGR (%))(V-Shape Recovery)
Figure 74. North America OTC Drugs & Dietary Supplements Market by Allergy Drugs, 2021-2031 (USD Bn, AGR (%))(W-Shape Recovery)
Figure 75. North America OTC Drugs & Dietary Supplements Market by Allergy Drugs, 2021-2031 (USD Bn, AGR (%))(U-Shape Recovery)
Figure 76. North America OTC Drugs & Dietary Supplements Market by Allergy Drugs, 2021-2031 (USD Bn, AGR (%))(L-Shape Recovery)
Figure 77. North America OTC Drugs & Dietary Supplements Market by Product Type, 2021-2031 (USD Bn, AGR (%), CAGR (%))
Figure 78. North America OTC Drugs & Dietary Supplements Market by Product Type, 2021-2031 (USD Bn, AGR (%), CAGR (%)) (V – Shaped Recovery)
Figure 79. North America OTC Drugs & Dietary Supplements Market by Product Type, 2021-2031 (USD Bn, AGR (%), CAGR (%)) (W – Shaped Recovery)
Figure 80. North America OTC Drugs & Dietary Supplements Market by Product Type, 2021-2031 (USD Bn, AGR (%), CAGR (%)) (U – Shaped Recovery)
Figure 81. North America OTC Drugs & Dietary Supplements Market by Product Type, 2021-2031 (USD Bn, AGR (%), CAGR (%)) (L – Shaped Recovery)
Figure 82. North America OTC Drugs & Dietary Supplements Market by Dosage Form, 2021-2031 (USD Bn, AGR (%), CAGR (%))
Figure 83. North America OTC Drugs & Dietary Supplements Market by Dosage Form, 2021-2031 (USD Bn, AGR (%), CAGR (%)) (V – Shaped Recovery)
Figure 84. North America OTC Drugs & Dietary Supplements Market by Dosage Form, 2021-2031 (USD Bn, AGR (%), CAGR (%)) (W – Shaped Recovery)
Figure 85. North America OTC Drugs & Dietary Supplements Market by Dosage Form, 2021-2031 (USD Bn, AGR (%), CAGR (%)) (U – Shaped Recovery)
Figure 86. North America OTC Drugs & Dietary Supplements Market by Dosage Form, 2021-2031 (USD Bn, AGR (%), CAGR (%)) (L – Shaped Recovery)
Figure 87. Europe OTC Drugs & Dietary Supplements Market Forecast, 2021-2031 (USD Bn, AGR (%), CAGR (%))
Figure 88. Europe OTC Drugs & Dietary Supplements Market Forecast, 2021-2031 (USD Bn, AGR (%), CAGR (%)) (V – Shaped Recovery)
Figure 89. Europe OTC Drugs & Dietary Supplements Market Forecast, 2021-2031 (USD Bn, AGR (%), CAGR (%)) (W – Shaped Recovery)
Figure 90. Europe OTC Drugs & Dietary Supplements Market Forecast, 2021-2031 (USD Bn, AGR (%), CAGR (%)) (U – Shaped Recovery)
Figure 91. Europe OTC Drugs & Dietary Supplements Market Forecast, 2021-2031 (USD Bn, AGR (%), CAGR (%)) (L – Shaped Recovery)
Figure 92. Europe OTC Drugs & Dietary Supplements Market Forecast by Country, 2021-2031 (USD Bn, AGR (%), CAGR (%))
Figure 93. Europe OTC Drugs & Dietary Supplements Market Forecast by Country, 2021-2031 (USD Bn, AGR (%), CAGR (%)) (V – Shaped Recovery)
Figure 94. Europe OTC Drugs & Dietary Supplements Market Forecast by Country, 2021-2031 (USD Bn, AGR (%), CAGR (%)) (W – Shaped Recovery)
Figure 95. Europe OTC Drugs & Dietary Supplements Market Forecast by Country, 2021-2031 (USD Bn, AGR (%), CAGR (%)) (U – Shaped Recovery)
Figure 96. Europe OTC Drugs & Dietary Supplements Market Forecast by Country, 2021-2031 (USD Bn, AGR (%), CAGR (%)) (L – Shaped Recovery)
Figure 97. Europe OTC Drugs & Dietary Supplements Market Forecast by Distribution Channel, 2021-2031 (Units, AGR (%), CAGR (%))
Figure 98. Europe OTC Drugs & Dietary Supplements Market Forecast by Distribution Channel, 2021-2031 (Units, AGR (%), CAGR(%)) (V – Shaped Recovery)
Figure 99. Europe OTC Drugs & Dietary Supplements Market Forecast by Distribution Channel, 2021-2031 (Units, AGR (%), CAGR(%)) (W – Shaped Recovery)
Figure 100. Europe OTC Drugs & Dietary Supplements Market Forecast by Distribution Channel, 2021-2031 (Units, AGR (%), CAGR(%)) (U – Shaped Recovery)
Figure 101. Europe OTC Drugs & Dietary Supplements Market Forecast by Distribution Channel, 2021-2031 (Units, AGR (%), CAGR(%)) (L – Shaped Recovery)
Figure 102. Europe OTC Drugs & Dietary Supplements Market by Category, 2021-2031 (Units, AGR (%), CAGR (%))
Figure 103. Europe OTC Drugs & Dietary Supplements Market by Category, 2021-2031 (Units, AGR (%), CAGR (%)) (V – Shaped Recovery)
Figure 104. Europe OTC Drugs & Dietary Supplements Market by Category, 2021-2031 (Units, AGR (%), CAGR (%)) (W – Shaped Recovery)
Figure 105. Europe OTC Drugs & Dietary Supplements Market by Category, 2021-2031 (Units, AGR (%), CAGR (%)) (U – Shaped Recovery)
Figure 106. Europe OTC Drugs & Dietary Supplements Market by Category, 2021-2031 (Units, AGR (%), CAGR (%)) (L – Shaped Recovery)
Figure 107. Europe OTC Drugs & Dietary Supplements Market by Allergy Type, 2021-2031 (USD Bn, AGR (%))
Figure 108. Europe OTC Drugs & Dietary Supplements Market by Allergy Type, 2021-2031 (USD Bn, AGR (%))(V-Shape Recovery)
Figure 109. Europe OTC Drugs & Dietary Supplements Market by Allergy Type, 2021-2031 (USD Bn, AGR (%))(W-Shape Recovery)
Figure 110. Europe OTC Drugs & Dietary Supplements Market by Allergy Type, 2021-2031 (USD Bn, AGR (%))(U-Shape Recovery)
Figure 111. Europe OTC Drugs & Dietary Supplements Market by Allergy Type, 2021-2031 (USD Bn, AGR (%))(L-Shape Recovery)
Figure 112. Europe OTC Drugs & Dietary Supplements Market by Allergy Drugs, 2021-2031 (USD Bn, AGR (%))
Figure 113. Europe OTC Drugs & Dietary Supplements Market by Allergy Drugs, 2021-2031 (USD Bn, AGR (%))(V-Shape Recovery)
Figure 114. Europe OTC Drugs & Dietary Supplements Market by Allergy Drugs, 2021-2031 (USD Bn, AGR (%))(W-Shape Recovery)
Figure 115. Europe OTC Drugs & Dietary Supplements Market by Allergy Drugs, 2021-2031 (USD Bn, AGR (%))(U-Shape Recovery)
Figure 116. Europe OTC Drugs & Dietary Supplements Market by Allergy Drugs, 2021-2031 (USD Bn, AGR (%))(L-Shape Recovery)
Figure 117. Europe OTC Drugs & Dietary Supplements Market by Product Type, 2021-2031 (USD Bn, AGR (%), CAGR (%))
Figure 118. Europe OTC Drugs & Dietary Supplements Market by Product Type, 2021-2031 (USD Bn, AGR (%), CAGR (%)) (V – Shaped Recovery)
Figure 119. Europe OTC Drugs & Dietary Supplements Market by Product Type, 2021-2031 (USD Bn, AGR (%), CAGR (%)) (W – Shaped Recovery)
Figure 120. Europe OTC Drugs & Dietary Supplements Market by Product Type, 2021-2031 (USD Bn, AGR (%), CAGR (%)) (U – Shaped Recovery)
Figure 121. Europe OTC Drugs & Dietary Supplements Market by Product Type, 2021-2031 (USD Bn, AGR (%), CAGR (%)) (L – Shaped Recovery)
Figure 122. Europe OTC Drugs & Dietary Supplements Market by Dosage Form, 2021-2031 (USD Bn, AGR (%), CAGR (%))
Figure 123. Europe OTC Drugs & Dietary Supplements Market by Dosage Form, 2021-2031 (USD Bn, AGR (%), CAGR (%)) (V – Shaped Recovery)
Figure 124. Europe OTC Drugs & Dietary Supplements Market by Dosage Form, 2021-2031 (USD Bn, AGR (%), CAGR (%)) (W – Shaped Recovery)
Figure 125. Europe OTC Drugs & Dietary Supplements Market by Dosage Form, 2021-2031 (USD Bn, AGR (%), CAGR (%)) (U – Shaped Recovery)
Figure 126. Europe OTC Drugs & Dietary Supplements Market by Dosage Form, 2021-2031 (USD Bn, AGR (%), CAGR (%)) (L – Shaped Recovery)
Figure 127. Asia-Pacific OTC Drugs & Dietary Supplements Market Forecast, 2021-2031 (USD Bn, AGR (%), CAGR (%))
Figure 128. Asia-Pacific OTC Drugs & Dietary Supplements Market Forecast, 2021-2031 (USD Bn, AGR (%), CAGR (%)) (V – Shaped Recovery)
Figure 129. Asia-Pacific OTC Drugs & Dietary Supplements Market Forecast, 2021-2031 (USD Bn, AGR (%), CAGR (%)) (W – Shaped Recovery)
Figure 130. Asia-Pacific OTC Drugs & Dietary Supplements Market Forecast, 2021-2031 (USD Bn, AGR (%), CAGR (%)) (U – Shaped Recovery)
Figure 131. Asia-Pacific OTC Drugs & Dietary Supplements Market Forecast, 2021-2031 (USD Bn, AGR (%), CAGR (%)) (L – Shaped Recovery)
Figure 132. Asia-Pacific OTC Drugs & Dietary Supplements Market Forecast by Country, 2021-2031 (USD Bn, AGR (%), CAGR (%))
Figure 133. Asia-Pacific OTC Drugs & Dietary Supplements Market Forecast by Country, 2021-2031 (USD Bn, AGR (%), CAGR (%)) (V – Shaped Recovery)
Figure 134. Asia-Pacific OTC Drugs & Dietary Supplements Market Forecast by Country, 2021-2031 (USD Bn, AGR (%), CAGR (%)) (W – Shaped Recovery)
Figure 135. Asia-Pacific OTC Drugs & Dietary Supplements Market Forecast by Country, 2021-2031 (USD Bn, AGR (%), CAGR (%)) (U – Shaped Recovery)
Figure 136. Asia-Pacific OTC Drugs & Dietary Supplements Market Forecast by Country, 2021-2031 (USD Bn, AGR (%), CAGR (%)) (L – Shaped Recovery)
Figure 137. Asia-Pacific OTC Drugs & Dietary Supplements Market Forecast by Distribution Channel, 2021-2031 (USD Bn, AGR (%), CAGR (%))
Figure 138. Asia-Pacific OTC Drugs & Dietary Supplements Market Forecast by Distribution Channel, 2021-2031 (USD Bn, AGR (%), CAGR(%)) (V – Shaped Recovery)
Figure 139. Asia-Pacific OTC Drugs & Dietary Supplements Market Forecast by Distribution Channel, 2021-2031 (USD Bn, AGR (%), CAGR(%)) (W – Shaped Recovery)
Figure 140. Asia-Pacific OTC Drugs & Dietary Supplements Market Forecast by Distribution Channel, 2021-2031 (USD Bn, AGR (%), CAGR(%)) (U – Shaped Recovery)
Figure 141. Asia-Pacific OTC Drugs & Dietary Supplements Market Forecast by Distribution Channel, 2021-2031 (USD Bn, AGR (%), CAGR(%)) (L – Shaped Recovery)
Figure 142. Asia-Pacific OTC Drugs & Dietary Supplements Market by Category, 2021-2031 (USD Bn, AGR (%), CAGR (%))
Figure 143. Asia-Pacific OTC Drugs & Dietary Supplements Market by Category, 2021-2031 (USD Bn, AGR (%), CAGR (%)) (V – Shaped Recovery)
Figure 144. Asia-Pacific OTC Drugs & Dietary Supplements Market by Category, 2021-2031 (USD Bn, AGR (%), CAGR (%)) (W – Shaped Recovery)
Figure 145. Asia-Pacific OTC Drugs & Dietary Supplements Market by Category, 2021-2031 (USD Bn, AGR (%), CAGR (%)) (U – Shaped Recovery)
Figure 146. Asia-Pacific OTC Drugs & Dietary Supplements Market by Category, 2021-2031 (USD Bn, AGR (%), CAGR (%)) (L – Shaped Recovery)
Figure 147. Asia-Pacific OTC Drugs & Dietary Supplements Market by Allergy Type, 2021-2031 (USD Bn, AGR (%))
Figure 148. Asia-Pacific OTC Drugs & Dietary Supplements Market by Allergy Type, 2021-2031 (USD Bn, AGR (%))(V-Shape Recovery)
Figure 149. Asia-Pacific OTC Drugs & Dietary Supplements Market by Allergy Type, 2021-2031 (USD Bn, AGR (%))(W-Shape Recovery)
Figure 150. Asia-Pacific OTC Drugs & Dietary Supplements Market by Allergy Type, 2021-2031 (USD Bn, AGR (%))(U-Shape Recovery)
Figure 151. Asia-Pacific OTC Drugs & Dietary Supplements Market by Allergy Type, 2021-2031 (USD Bn, AGR (%))(L-Shape Recovery)
Figure 152. Asia-Pacific OTC Drugs & Dietary Supplements Market by Allergy Drugs, 2021-2031 (USD Bn, AGR (%))
Figure 153. Asia-Pacific OTC Drugs & Dietary Supplements Market by Allergy Drugs, 2021-2031 (USD Bn, AGR (%))(V-Shape Recovery)
Figure 154. Asia-Pacific OTC Drugs & Dietary Supplements Market by Allergy Drugs, 2021-2031 (USD Bn, AGR (%))(W-Shape Recovery)
Figure 155. Asia-Pacific OTC Drugs & Dietary Supplements Market by Allergy Drugs, 2021-2031 (USD Bn, AGR (%))(U-Shape Recovery)
Figure 156. Asia-Pacific OTC Drugs & Dietary Supplements Market by Allergy Drugs, 2021-2031 (USD Bn, AGR (%))(L-Shape Recovery)
Figure 157. Asia-Pacific OTC Drugs & Dietary Supplements Market by Product Type, 2021-2031 (USD Bn, AGR (%), CAGR (%))
Figure 158. Asia-Pacific OTC Drugs & Dietary Supplements Market by Product Type, 2021-2031 (USD Bn, AGR (%), CAGR (%)) (V – Shaped Recovery)
Figure 159. Asia-Pacific OTC Drugs & Dietary Supplements Market by Product Type, 2021-2031 (USD Bn, AGR (%), CAGR (%)) (W – Shaped Recovery)
Figure 160. Asia-Pacific OTC Drugs & Dietary Supplements Market by Product Type, 2021-2031 (USD Bn, AGR (%), CAGR (%)) (U – Shaped Recovery)
Figure 161. Asia-Pacific OTC Drugs & Dietary Supplements Market by Product Type, 2021-2031 (USD Bn, AGR (%), CAGR (%)) (L – Shaped Recovery)
Figure 162. Asia-Pacific OTC Drugs & Dietary Supplements Market by Dosage Form, 2021-2031 (USD Bn, AGR (%), CAGR (%))
Figure 163. Asia-Pacific OTC Drugs & Dietary Supplements Market by Dosage Form, 2021-2031 (USD Bn, AGR (%), CAGR (%)) (V – Shaped Recovery)
Figure 164. Asia-Pacific OTC Drugs & Dietary Supplements Market by Dosage Form, 2021-2031 (USD Bn, AGR (%), CAGR (%)) (W – Shaped Recovery)
Figure 165. Asia-Pacific OTC Drugs & Dietary Supplements Market by Dosage Form, 2021-2031 (USD Bn, AGR (%), CAGR (%)) (U – Shaped Recovery)
Figure 166. Asia-Pacific OTC Drugs & Dietary Supplements Market by Dosage Form, 2021-2031 (USD Bn, AGR (%), CAGR (%)) (L – Shaped Recovery)
Figure 167. Latin America OTC Drugs & Dietary Supplements Market Forecast, 2021-2031 (USD Bn, AGR (%), CAGR (%))
Figure 168. Latin America OTC Drugs & Dietary Supplements Market Forecast, 2021-2031 (USD Bn, AGR (%), CAGR (%)) (V – Shaped Recovery)
Figure 169. Latin America OTC Drugs & Dietary Supplements Market Forecast, 2021-2031 (USD Bn, AGR (%), CAGR (%)) (W – Shaped Recovery)
Figure 170. Latin America OTC Drugs & Dietary Supplements Market Forecast, 2021-2031 (USD Bn, AGR (%), CAGR (%)) (U – Shaped Recovery)
Figure 171. Latin America OTC Drugs & Dietary Supplements Market Forecast, 2021-2031 (USD Bn, AGR (%), CAGR (%)) (L – Shaped Recovery)
Figure 172. Latin America OTC Drugs & Dietary Supplements Market Forecast by Country, 2021-2031 (USD Bn, AGR (%), CAGR (%))
Figure 173. Latin America OTC Drugs & Dietary Supplements Market Forecast by Country, 2021-2031 (USD Bn, AGR (%), CAGR (%)) (V – Shaped Recovery)
Figure 174. Latin America OTC Drugs & Dietary Supplements Market Forecast by Country, 2021-2031 (USD Bn, AGR (%), CAGR (%)) (W – Shaped Recovery)
Figure 175. Latin America OTC Drugs & Dietary Supplements Market Forecast by Country, 2021-2031 (USD Bn, AGR (%), CAGR (%)) (U – Shaped Recovery)
Figure 176. Latin America OTC Drugs & Dietary Supplements Market Forecast by Country, 2021-2031 (USD Bn, AGR (%), CAGR (%)) (L – Shaped Recovery)
Figure 177. Latin America OTC Drugs & Dietary Supplements Market Forecast by Distribution Channel, 2021-2031 (USD Bn, AGR (%), CAGR (%))
Figure 178. Latin America OTC Drugs & Dietary Supplements Market Forecast by Distribution Channel, 2021-2031 (USD Bn, AGR (%), CAGR(%)) (V – Shaped Recovery)
Figure 179. Latin America OTC Drugs & Dietary Supplements Market Forecast by Distribution Channel, 2021-2031 (USD Bn, AGR (%), CAGR(%)) (W – Shaped Recovery)
Figure 180. Latin America OTC Drugs & Dietary Supplements Market Forecast by Distribution Channel, 2021-2031 (USD Bn, AGR (%), CAGR(%)) (U – Shaped Recovery)
Figure 181. Latin America OTC Drugs & Dietary Supplements Market Forecast by Distribution Channel, 2021-2031 (USD Bn, AGR (%), CAGR(%)) (L – Shaped Recovery)
Figure 182. Latin America OTC Drugs & Dietary Supplements Market by Category, 2021-2031 (USD Bn, AGR (%), CAGR (%))
Figure 183. Latin America OTC Drugs & Dietary Supplements Market by Category, 2021-2031 (USD Bn, AGR (%), CAGR (%)) (V – Shaped Recovery)
Figure 184. Latin America OTC Drugs & Dietary Supplements Market by Category, 2021-2031 (USD Bn, AGR (%), CAGR (%)) (W – Shaped Recovery)
Figure 185. Latin America OTC Drugs & Dietary Supplements Market by Category, 2021-2031 (USD Bn, AGR (%), CAGR (%)) (U – Shaped Recovery)
Figure 186. Latin America OTC Drugs & Dietary Supplements Market by Category, 2021-2031 (USD Bn, AGR (%), CAGR (%)) (L – Shaped Recovery)
Figure 187. Latin America OTC Drugs & Dietary Supplements Market by Allergy Type, 2021-2031 (USD Bn, AGR (%))
Figure 188. Latin America OTC Drugs & Dietary Supplements Market by Allergy Type, 2021-2031 (USD Bn, AGR (%))(V-Shape Recovery)
Figure 189. Latin America OTC Drugs & Dietary Supplements Market by Allergy Type, 2021-2031 (USD Bn, AGR (%))(W-Shape Recovery)
Figure 190. Latin America OTC Drugs & Dietary Supplements Market by Allergy Type, 2021-2031 (USD Bn, AGR (%))(U-Shape Recovery)
Figure 191. Latin America OTC Drugs & Dietary Supplements Market by Allergy Type, 2021-2031 (USD Bn, AGR (%))(L-Shape Recovery)
Figure 192. Latin America OTC Drugs & Dietary Supplements Market by Allergy Drugs, 2021-2031 (USD Bn, AGR (%))
Figure 193. Latin America OTC Drugs & Dietary Supplements Market by Allergy Drugs, 2021-2031 (USD Bn, AGR (%))(V-Shape Recovery)
Figure 194. Latin America OTC Drugs & Dietary Supplements Market by Allergy Drugs, 2021-2031 (USD Bn, AGR (%))(W-Shape Recovery)
Figure 195. Latin America OTC Drugs & Dietary Supplements Market by Allergy Drugs, 2021-2031 (USD Bn, AGR (%))(U-Shape Recovery)
Figure 196. Latin America OTC Drugs & Dietary Supplements Market by Allergy Drugs, 2021-2031 (USD Bn, AGR (%))(L-Shape Recovery)
Figure 197. Latin America OTC Drugs & Dietary Supplements Market by Product Type, 2021-2031 (USD Bn, AGR (%), CAGR (%))
Figure 198. Latin America OTC Drugs & Dietary Supplements Market by Product Type, 2021-2031 (USD Bn, AGR (%), CAGR (%)) (V – Shaped Recovery)
Figure 199. Latin America OTC Drugs & Dietary Supplements Market by Product Type, 2021-2031 (USD Bn, AGR (%), CAGR (%)) (W – Shaped Recovery)
Figure 200. Latin America OTC Drugs & Dietary Supplements Market by Product Type, 2021-2031 (USD Bn, AGR (%), CAGR (%)) (U – Shaped Recovery)
Figure 201. Latin America OTC Drugs & Dietary Supplements Market by Product Type, 2021-2031 (USD Bn, AGR (%), CAGR (%)) (L – Shaped Recovery)
Figure 202. Latin America OTC Drugs & Dietary Supplements Market by Dosage Form, 2021-2031 (USD Bn, AGR (%), CAGR (%))
Figure 203. Latin America OTC Drugs & Dietary Supplements Market by Dosage Form, 2021-2031 (USD Bn, AGR (%), CAGR (%)) (V – Shaped Recovery)
Figure 204. Latin America OTC Drugs & Dietary Supplements Market by Dosage Form, 2021-2031 (USD Bn, AGR (%), CAGR (%)) (W – Shaped Recovery)
Figure 205. Latin America OTC Drugs & Dietary Supplements Market by Dosage Form, 2021-2031 (USD Bn, AGR (%), CAGR (%)) (U – Shaped Recovery)
Figure 206. Latin America OTC Drugs & Dietary Supplements Market by Dosage Form, 2021-2031 (USD Bn, AGR (%), CAGR (%)) (L – Shaped Recovery)
Figure 207. Middle East & Africa OTC Drugs & Dietary Supplements Market Forecast, 2021-2031 (USD Bn, AGR (%), CAGR (%))
Figure 208. Middle East & Africa OTC Drugs & Dietary Supplements Market Forecast, 2021-2031 (USD Bn, AGR (%), CAGR (%)) (V – Shaped Recovery)
Figure 209. Middle East & Africa OTC Drugs & Dietary Supplements Market Forecast, 2021-2031 (USD Bn, AGR (%), CAGR (%)) (W – Shaped Recovery)
Figure 210. Middle East & Africa OTC Drugs & Dietary Supplements Market Forecast, 2021-2031 (USD Bn, AGR (%), CAGR (%)) (U – Shaped Recovery)
Figure 211. Middle East & Africa OTC Drugs & Dietary Supplements Market Forecast, 2021-2031 (USD Bn, AGR (%), CAGR (%)) (L – Shaped Recovery)
Figure 212. Middle East & Africa OTC Drugs & Dietary Supplements Market Forecast By Country, 2021-2031 (USD Bn, AGR (%), CAGR (%))
Figure 213. Middle East & Africa OTC Drugs & Dietary Supplements Market Forecast By Country, 2021-2031 (USD Bn, AGR (%), CAGR (%)) (V – Shaped Recovery)
Figure 214. Middle East & Africa OTC Drugs & Dietary Supplements Market Forecast By Country, 2021-2031 (USD Bn, AGR (%), CAGR (%)) (W – Shaped Recovery)
Figure 215. Middle East & Africa OTC Drugs & Dietary Supplements Market Forecast By Country, 2021-2031 (USD Bn, AGR (%), CAGR (%)) (U – Shaped Recovery)
Figure 216. Middle East & Africa OTC Drugs & Dietary Supplements Market Forecast By Country, 2021-2031 (USD Bn, AGR (%), CAGR (%)) (L – Shaped Recovery)
Figure 217. Middle East & Africa OTC Drugs & Dietary Supplements Market Forecast by Distribution Channel, 2021-2031 (USD Bn, AGR (%), CAGR (%))
Figure 218. Middle East & Africa OTC Drugs & Dietary Supplements Market Forecast by Distribution Channel, 2021-2031 (USD Bn, AGR (%), CAGR(%)) (V – Shaped Recovery)
Figure 219. Middle East & Africa OTC Drugs & Dietary Supplements Market Forecast by Distribution Channel, 2021-2031 (USD Bn, AGR (%), CAGR(%)) (W – Shaped Recovery)
Figure 220. Middle East & Africa OTC Drugs & Dietary Supplements Market Forecast by Distribution Channel, 2021-2031 (USD Bn, AGR (%), CAGR(%)) (U – Shaped Recovery)
Figure 221. Middle East & Africa OTC Drugs & Dietary Supplements Market Forecast by Distribution Channel, 2021-2031 (USD Bn, AGR (%), CAGR(%)) (L – Shaped Recovery)
Figure 222. Middle East & Africa OTC Drugs & Dietary Supplements Market by Category, 2021-2031 (USD Bn, AGR (%), CAGR (%))
Figure 223. Middle East & Africa OTC Drugs & Dietary Supplements Market by Category, 2021-2031 (USD Bn, AGR (%), CAGR (%)) (V – Shaped Recovery)
Figure 224. Middle East & Africa OTC Drugs & Dietary Supplements Market by Category, 2021-2031 (USD Bn, AGR (%), CAGR (%)) (W – Shaped Recovery)
Figure 225. Middle East & Africa OTC Drugs & Dietary Supplements Market by Category, 2021-2031 (USD Bn, AGR (%), CAGR (%)) (U – Shaped Recovery)
Figure 226. Middle East & Africa OTC Drugs & Dietary Supplements Market by Category, 2021-2031 (USD Bn, AGR (%), CAGR (%)) (L – Shaped Recovery)
Figure 227. Middle East & Africa OTC Drugs & Dietary Supplements Market by Allergy Type, 2021-2031 (USD Bn, AGR (%))
Figure 228. Middle East & Africa OTC Drugs & Dietary Supplements Market by Allergy Type, 2021-2031 (USD Bn, AGR (%))(V-Shape Recovery)
Figure 229. Middle East & Africa OTC Drugs & Dietary Supplements Market by Allergy Type, 2021-2031 (USD Bn, AGR (%))(W-Shape Recovery)
Figure 230. Middle East & Africa OTC Drugs & Dietary Supplements Market by Allergy Type, 2021-2031 (USD Bn, AGR (%))(U-Shape Recovery)
Figure 231. Middle East & Africa OTC Drugs & Dietary Supplements Market by Allergy Type, 2021-2031 (USD Bn, AGR (%))(L-Shape Recovery)
Figure 232. Middle East & Africa OTC Drugs & Dietary Supplements Market by Allergy Drugs, 2021-2031 (USD Bn, AGR (%))
Figure 233. Middle East & Africa OTC Drugs & Dietary Supplements Market by Allergy Drugs, 2021-2031 (USD Bn, AGR (%))(V-Shape Recovery)
Figure 234. Middle East & Africa OTC Drugs & Dietary Supplements Market by Allergy Drugs, 2021-2031 (USD Bn, AGR (%))(W-Shape Recovery)
Figure 235. Middle East & Africa OTC Drugs & Dietary Supplements Market by Allergy Drugs, 2021-2031 (USD Bn, AGR (%))(U-Shape Recovery)
Figure 236. Middle East & Africa OTC Drugs & Dietary Supplements Market by Allergy Drugs, 2021-2031 (USD Bn, AGR (%))(L-Shape Recovery)
Figure 237. Middle East & Africa OTC Drugs & Dietary Supplements Market by Product Type, 2021-2031 (USD Bn, AGR (%), CAGR (%))
Figure 238. Middle East & Africa OTC Drugs & Dietary Supplements Market by Product Type, 2021-2031 (USD Bn, AGR (%), CAGR (%)) (V – Shaped Recovery)
Figure 239. Middle East & Africa OTC Drugs & Dietary Supplements Market by Product Type, 2021-2031 (USD Bn, AGR (%), CAGR (%)) (W – Shaped Recovery)
Figure 240. Middle East & Africa OTC Drugs & Dietary Supplements Market by Product Type, 2021-2031 (USD Bn, AGR (%), CAGR (%)) (U – Shaped Recovery)
Figure 241. Middle East & Africa OTC Drugs & Dietary Supplements Market by Product Type, 2021-2031 (USD Bn, AGR (%), CAGR (%)) (L – Shaped Recovery)
Figure 242. Middle East & Africa OTC Drugs & Dietary Supplements Market by Dosage Form, 2021-2031 (USD Bn, AGR (%), CAGR (%))
Figure 243. Middle East & Africa OTC Drugs & Dietary Supplements Market by Dosage Form, 2021-2031 (USD Bn, AGR (%), CAGR (%)) (V – Shaped Recovery)
Figure 244. Middle East & Africa OTC Drugs & Dietary Supplements Market by Dosage Form, 2021-2031 (USD Bn, AGR (%), CAGR (%)) (W – Shaped Recovery)
Figure 245. Middle East & Africa OTC Drugs & Dietary Supplements Market by Dosage Form, 2021-2031 (USD Bn, AGR (%), CAGR (%)) (U – Shaped Recovery)
Figure 246. Middle East & Africa OTC Drugs & Dietary Supplements Market by Dosage Form, 2021-2031 (USD Bn, AGR (%), CAGR (%)) (L – Shaped Recovery)
Figure 247. Taisho Pharmaceutical Holdings Co., Ltd.: Company Revenue 2016-2020 (US$Mn)
Figure 248. Taisho Pharmaceutical Holdings Co., Ltd: Company Gross Profit 2016-2020 (US$Mn, AGR %)
Figure 249. Taisho Pharmaceutical Holdings Co., Ltd: Company Net Income 2016-2020 (US$Mn, AGR %)
Figure 250. Taisho Pharmaceutical Holdings Co., Ltd: Company EBITDA 2016-2020 (US$Mn, AGR %)
Figure 251. Nippon Chemiphar Co., Ltd..: Company Revenue 2017-2021 (US$Mn, AGR %)
Figure 252. Nippon Chemiphar Co., Ltd..: Company Operating Income 2017-2021 (US$Mn, AGR %)
Figure 253. Nippon Chemiphar Co., Ltd..: Company Net Income 2017-2021 (US$Mn, AGR %)
Figure 254. Nippon Chemiphar Co., Ltd.: Company EBITDA 2017-2021 (US$Mn, AGR %)
Figure 255. H Lundbeck A/S: Company Revenue 2016-2020 (US$Mn, AGR %)
Figure 256. H Lundbeck A/S: Company Operating Income 2016-2020 (US$Mn, AGR %)
Figure 257. H Lundbeck A/S: Company Net Income 2016-2020 (US$Mn, AGR %)
Figure 258. H Lundbeck A/S: Company EBITDA 2016-2020 (US$Mn, AGR %)
Figure 259. Teva Pharmaceutical Industries Ltd : Company Revenue 2016-2020(US$Mn, AGR %)
Figure 260. Teva Pharmaceutical Industries Ltd : Company Operating Income 2016-2020(US$Mn, AGR %)
Figure 261. Teva Pharmaceutical Industries Ltd : Company Net Income 2016-2020(US$Mn, AGR %)
Figure 262. Teva Pharmaceutical Industries Ltd : Company EBITDA 2016-2020(US$Mn, AGR %)
Figure 263. Novartis AG: Company Revenue 2016-2020(US$Mn, AGR %)
Figure 264. Novartis AG: Company Operating Income 2016-2020(US$Mn, AGR %)
Figure 265. Novartis AG: Company Net Income 2016-2020(US$Mn, AGR %)
Figure 266. Novartis AG: Company EBITDA 2016-2020(US$Mn, AGR %)
Figure 267. Pfizer Inc.: Company Revenue 2016-2020 (US$Mn, AGR %)
Figure 268. Pfizer Inc.: Company Operating Income 2016-2020 (US$Mn, AGR %)
Figure 269. Pfizer Inc.: Company Net Income 2016-2020 (US$Mn, AGR %)
Figure 270. Pfizer Inc.: Company EBITDA 2016-2020 (US$Mn, AGR %)
Figure 271. Mylan N.V..: Company Revenue 2016-2020 (US$Mn, AGR %)
Figure 272. Mylan N.V.: Company Operating Income 2016-2020 (US$Mn, AGR %)
Figure 273. Mylan N.V.: Company Net Income 2016-2020 (US$Mn, AGR %)
Figure 274. Mylan N.V.: Company EBITA 2016-2020 (US$Mn, AGR %)
Figure 275. Abbott Laboratories.: Company Revenue 2016-2020(US$Mn, AGR %)
Figure 276. Abbott Laboratories.: Company Operating Income 2016-2020(US$Mn, AGR %)
Figure 277. Abbott Laboratories.: Company Net Income 2016-2020(US$Mn, AGR %)
Figure 278. Abbott Laboratories.: Company EBITDA 2016-2020(US$Mn, AGR %)
Figure 279. Fresenius SE & Co KgaA.: Company Revenue 2016-2020 (US$Mn, AGR %)
Figure 280. Fresenius SE & Co KgaA.: Company Operating Income 2016-2020 (US$Mn, AGR %)
Figure 281. Fresenius SE & Co KgaA.: Company Net Income 2016-2020 (US$Mn, AGR %)
Figure 282. Fresenius SE & Co KgaA.: Company EBITDA 2016-2020 (US$Mn, AGR %)
Figure 283. Sun Pharmaceutical Industries.: Company Revenue 2016-2020(US$Mn, AGR %)
Figure 284. Sun Pharmaceutical Industries.: Company Operating Income 2016-2020(US$Mn, AGR %)
Figure 285. Sun Pharmaceutical Industries.: Company Net Income 2016-2020(US$Mn, AGR %)
Figure 286. Sun Pharmaceutical Industries: Company EBITDA 2016-2020(US$Mn, AGR %)
Figure 287. Sanofi SA.: Company Revenue 2016-2020 (US$Mn, AGR %)
Figure 288. Sanofi SA.: Company Operating Income 2016-2020 (US$Mn, AGR %)
Figure 289. Sanofi SA.: Company Net Income 2016-2020 (US$Mn, AGR %)
Figure 290. Sanofi SA.: Company EBITDA 2016-2020 (US$Mn, AGR %)
Figure 291. Roche Holding AG: Revenue 2016-2020 (US$Mn, AGR %)
Figure 292. Roche Holding AG: Operating Income 2016-2020 (US$Mn, AGR %)
Figure 293. Roche Holding AG: Net Income 2016-2020 (US$Mn, AGR %)
Figure 294. Roche Corporation: EBITDA 2016-2020 (US$Mn, AGR %)
Figure 295. Lupin Limited: Company Revenue 2016-2020 (US$Mn, AGR %)
Figure 296. Lupin Limited: Company Operating Income 2016-2020 (US$Mn, AGR %)
Figure 297. Lupin Limited : Company Net Income 2016-2020 (US$Mn, AGR %)
Figure 298. Lupin Limited: Company EBITDA 2016-2020 (US$Mn, AGR %)
Figure 299. Alcon AG.: Company Revenue 2017-2021 (US$Mn, AGR %)
Figure 300. Alcon AG.: Company Operating Income 2017-2021 (US$Mn, AGR %)
Figure 301. Alcon AG.: Company Net Income 2017-2021 (US$Mn, AGR %)
Figure 302. Alcon AG.: Company EBITDA 2017-2021 (US$Mn, AGR %)
List of Companies Profiled in the report:
Abbott Laboratories
Alcon AG
Bayer AG.
Danisco
Fresenius SE & Co KgaA
Glanbia plc
H Lundbeck A/S
Herbalife Nutrition Ltd
Lupin
Mylan N.V.
Nature’s Sunshine Products, Inc. (NSP)
Nippon Chemiphar Co., Ltd.
Novartis AG
Pfizer Inc.
Roche Holding AG
Sanofi SA
Sato Pharmaceutical
Sun Pharmaceutical Industries
Taisho Pharmaceutical Holdings Co., Ltd
Teva Pharmaceutical Industries Ltd
List of Other Companies Mentioned in the report:
23andMe
Abbott Medical Optics
Achelios Therapeutics, Inc.
Acrux
Agrifen
AiPing Pharmaceutical
Akron Pharmaceuticals
Alka Seltzer Vitacilina
Allegiant Health
Alliance Boots
Alvogen pharmaceuticals company
American Health
AmerisourceBergen
Amol Pharmaceuticals Private Limited
Apotex
Arena Pharmaceuticals
Aspen Australia
Aspen Global Inc.
Aspirina
Astellas Pharma US, Inc.
AstraZeneca PLC
Bal Pharma ltd.
Bayer
BePharBel
Beximco Pharmaceuticals
Binnopharm
Biocartis Group NV
Biocon Ltd.
BioGaia
BionTech AG
Bliss GVS Pharma Ltd.
Boehringer Ingelheim
Bristol-Myres Squibb
Bukwang Pharm. Co., Ltd.
Canagen Pharmaceuticals, Inc.
Cardinal Health
Carlyle Group
Catalent Pharma Solutions
Celesio
China Resources
Chr. Hansen
Cialis
Cleveland Clinic
CoLucid Pharmaceuticals
CR Pharmaceutical
Crescent Pharma
Curis, Inc.
Daiichi Sankyo
Delavau Pharmaceutical Partners
Dihon Pharmaceutical Group Co Ltd.
Ducere Pharma
Eisai Co., Ltd.
Electrolit
Eli Lilly
FameWave Ltd.
Flamel
Fujifilm Kyowa Kirin Biologics Co. Ltd.
GCP Laboratories
Genomma Lab
GIC Holdings
Gilead Medicines
GSK
Guangzhou Pharmaceutical Company, Ltd.
Guardian Drug Company
Haplogen GmbH
Hiran Agroceuticals Private Limited
Hi-Tech Pharmaceuticals
Im Co., Ltd
iNova Pharmaceuticals
Insight
Integral Molecular, Inc.
Ion Labs
Jagdale Healthcare
Janssen Pharmaceuticals, Inc.
Johnson & Johnson
Juno Pharmaceuticals
Kowa
Lion
Lipa Pharmaceuticals
LNK International, Inc.
Marksans Pharma
Mayne Pharma
McKesson Corporation
MCP3
Mead Johnson Nutrition Company
Merck
Merck Seron
Moberg Pharma
Momenta Pharmaceuticals, Inc.
Mophic Therapeutic
Mylan N.V.
Nektar Therapeutics
NeoStrata Company, Inc.
Nepstar
Nexgen Pharma Inc.
Nihon Eisai Co., Ltd.
Olainfarm
Olive Healthcare
Omega Pharma Invest N.V.
Ono Pharmaceutical Co., Ltd.
ORJagdale Healthcare SL
ORSL
Pedialyte
Perrigo Company PLC
Pfizer
Phoenix
Procter & Gamble
ProPhase Labs, Inc.
Purzer Pharmaceutical Co., Ltd.
Ranir Global Holdings LLC
Reckitt Benckiser
Rohto
Sal de Uvas Picot
Samson Pharmaceuticals, Inc.
Sarvotham Care Limited
Sentiss Pharmaceuticals, LLC
Shanghai Pharmaceuticals
Sinopharm
Sterling Pharmaceutical
Suerox
Taisho
Takeda
TB Alliance
Tempra
Theravance Biopharma, Inc.
Transgene SA
Trividia Manufacturing Solutions, Inc.
TSI Pharmaceuticals
Valenta Pharm
Verily Life Sciences LLC
Vifor Pharma
Vista Pharmaceuticals
Wellona Pharma
List of Associations Mentioned in the Report:
ANVISA
Association of the European Self-Medication Industry
Canadian Institute for Health Information
Center for Drug Evaluation and Research
European Medicines Agency
French Ministry of Health
Kyoto University
MD Anderson Cancer Center
Medicines and Healthcare products Regulatory Agency
Ministry of Health, Labour and Welfare
Pharmaceutical and Medical Devices Agency
Sarah Cannon Research Institute
State Food and Drug Administration