The NASH Treatment & Therapeutics Market Report 2023-2033: This report will prove invaluable to leading firms striving for new revenue pockets if they wish to better understand the industry and its underlying dynamics. It will be useful for companies that would like to expand into different industries or to expand their existing operations in a new region.
Increasing Prevalence of Non-alcoholic Steatohepatitis (NASH) Driving Market Growth
Some of the major forces propelling the NASH Treatment & Therapeutics market include increasing prevalence of NASH among the population, especially in developing countries. Moreover, Studies indicate a substantial rise in the incidence and prevalence of NASH, making it a significant public health issues, which is further expected to propel market growth. On the other hand, in developed countries such as the United States and Europe, NASH has emerged as the leading cause of chronic liver disease, surpassing hepatitis C. The prevalence of obesity, type 2 diabetes, and metabolic syndrome, all risk factors for NASH, has been steadily increasing, contributing to the rise in NASH cases. In addition, rapid urbanization, sedentary lifestyles, and changes in dietary patterns, including the consumption of high-calorie, processed foods, have further fuelled the epidemic and bolstered market growth.
Furthermore, NASH is not limited to developed nations but has also become a growing concern in developing countries. As these countries undergo rapid economic growth, urbanization, and the adoption of Westernized lifestyles, there has been a simultaneous increase in the prevalence of NASH.
Lack of Approved Therapies to Hamper Industry Growth
The lack of approved therapies for NASH has been a persistent challenge in recent years, leaving patients and healthcare providers with limited treatment options. However, there are currently no specific medications approved by regulatory authorities for the treatment of NASH. Clinical trials investigating potential treatments have faced significant challenges, with many failing to meet primary endpoints or demonstrating limited efficacy. Lack of standardization of the reading process across clinical drug development programs is one of the main reasons for failing trials. Promising drug candidates targeting various mechanisms involved in NASH pathogenesis, such as inflammation, fibrosis, and metabolic pathways, have not yet received regulatory approval due to a lack of compelling evidence from clinical studies.
What Questions Should You Ask before Buying a Market Research Report?
• How is the NASH Treatment & Therapeutics market evolving?
• What is driving and restraining the NASH Treatment & Therapeutics market?
• How will each NASH Treatment & Therapeutics submarket segment grow over the forecast period and how much revenue will these submarkets account for in 2033?
• How will the market shares for each NASH Treatment & Therapeutics submarket develop from 2023 to 2033?
• What will be the main driver for the overall market from 2023 to 2033?
• Will leading NASH Treatment & Therapeutics markets broadly follow the macroeconomic dynamics, or will individual national markets outperform others?
• How will the market shares of the national markets change by 2033 and which geographical region will lead the market in 2033?
• Who are the leading players and what are their prospects over the forecast period?
• What are the NASH Treatment & Therapeutics projects for these leading companies?
• How will the industry evolve during the period between 2023 and 2033? What are the implications of NASH Treatment & Therapeutics projects taking place now and over the next 10 years?
• Is there a greater need for product commercialisation to further scale the NASH Treatment & Therapeutics market?
• Where is the NASH Treatment & Therapeutics market heading and how can you ensure you are at the forefront of the market?
• What are the best investment options for new product and service lines?
• What are the key prospects for moving companies into a new growth path and C-suite?
You need to discover how this will impact the NASH Treatment & Therapeutics market today, and over the next 10 years:
• Our 224-page report provides 78 tables and 111 charts/graphs exclusively to you.
• The report highlights key lucrative areas in the industry so you can target them – NOW.
• It contains in-depth analysis of global, regional and national sales and growth.
• It highlights for you the key successful trends, changes and revenue projections made by your competitors.
This report tells you TODAY how the NASH Treatment & Therapeutics market will develop in the next 10 years, and in line with the variations in COVID-19 economic recession and bounce. This market is more critical now than at any point over the last 10 years.
Forecasts to 2033 and other analyses reveal commercial prospects
• In addition to revenue forecasting to 2033, our new study provides you with recent results, growth rates, and market shares.
• You will find original analyses, with business outlooks and developments.
• Discover qualitative analyses (including market dynamics, drivers, opportunities, restraints and challenges), cost structure, impact of rising NASH Treatment & Therapeutics prices and recent developments.
This report includes data analysis and invaluable insight into how COVID-19 will affect the industry and your company. Four COVID-19 recovery patterns and their impact, namely, “V”, “L”, “W” and “U” are discussed in this report.
Segments Covered in the Report
Product Type
• Vitamin E and Pioglitazone
• Ocaliva
• Elafibranor
• Selonsertib
• Cenicriviroc
• Others
Application
• Treatment
• Diagnosis
Sales Channel
• Hospital Pharmacy
• Online Provider
• Retail Pharmacy
• Others

In addition to the revenue predictions for the overall world market and segments, you will also find revenue forecasts for five regional and 24 leading national markets:
North America
• U.S.
• Canada
Europe
• Germany
• France
• UK
• Italy
• Spain
• Russia
• Rest of Europe
Asia Pacific
• Japan
• China
• India
• Australia
• South Korea
• Singapore
• Rest of Asia Pacific
Latin America
• Brazil
• Mexico
• Argentina
• Colombia
• Rest of Latin America
MEA
• GCC
• South Africa
• Rest of MEA
Need industry data? Please contact us today.
The report also includes profiles and for some of the leading companies in the NASH Treatment & Therapeutics Market (Pipeline Analysis), 2023 to 2033, with a focus on this segment of these companies’ operations.
Leading companies and the potential for market growth
• AbbVie Inc.
• BioPredictive S.A.S
• Cadila Pharmaceuticals
• Enanta
• Galmed Pharmaceuticals
• Genentech
• Genfit
• Gilead Sciences
• Intercept Pharmaceuticals
• Prometheus Laboratories
Overall world revenue for NASH Treatment & Therapeutics Market (Pipeline Analysis), 2023 to 2033 in terms of value the market will surpass US$4,650 million in 2023, our work calculates. We predict strong revenue growth through to 2033. Our work identifies which organizations hold the greatest potential. Discover their capabilities, progress, and commercial prospects, helping you stay ahead.
How will the NASH Treatment & Therapeutics Market (Pipeline Analysis), 2023 to 2033 report help you?
In summary, our 220+ page report provides you with the following knowledge:
• Revenue forecasts to 2033 for NASH Treatment & Therapeutics Market (Pipeline Analysis), 2023 to 2033 Market, with forecasts for product type, application, sales channel, each forecast at a global and regional level – discover the industry’s prospects, finding the most lucrative places for investments and revenues.
• Revenue forecasts to 2033 for five regional and 24 key national markets – See forecasts for the NASH Treatment & Therapeutics Market (Pipeline Analysis), 2023 to 2033 market in North America, Europe, Asia-Pacific, Latin America, and MEA. Also forecasted is the market in the US, Canada, Mexico, Brazil, Germany, France, UK, Italy, China, India, Japan, and Australia among other prominent economies.
• Prospects for established firms and those seeking to enter the market – including company profiles for 10 of the major companies involved in the NASH Treatment & Therapeutics Market (Pipeline Analysis), 2023 to 2033.
Find quantitative and qualitative analyses with independent predictions. Receive information that only our report contains, staying informed with invaluable business intelligence.
Information found nowhere else
With our new report, you are less likely to fall behind in knowledge or miss out on opportunities. See how our work could benefit your research, analyses, and decisions. Visiongain’s study is for everybody needing commercial analyses for the NASH Treatment & Therapeutics Market (Pipeline Analysis), 2023 to 2033, market-leading companies. You will find data, trends and predictions.
To access the data contained in this document please email contactus@visiongain.com
Buy our report today NASH Treatment & Therapeutics Market Report 2023-2033: Forecasts by Product Type (Vitamin E and Pioglitazone, Ocaliva, Elafibranor, Selonsertib, Cenicriviroc, Others), by Application (Treatment, Diagnosis), by Sales Channel (Hospital Pharmacy, Online Provider, Retail Pharmacy, Others) AND Regional and Leading National Market Analysis PLUS Analysis of Leading Companies AND COVID-19 Impact and Recovery Pattern Analysis. Avoid missing out by staying informed – order our report now.
Visiongain is a trading partner with the US Federal Government
CCR Ref number: KD4R6
Do you have any custom requirements we can help you with? Any need for a specific country, geo region, market segment or specific company information? Contact us today, we can discuss your needs and see how we can help: contactus@visiongain.com
1 Report Overview
1.1 Objectives of the Study
1.2 Introduction to NASH Treatment & Therapeutics Market (Pipeline Analysis)
1.3 What This Report Delivers
1.4 Why You Should Read This Report
1.5 Key Questions Answered by This Analytical Report
1.6 Who is This Report for?
1.7 Methodology
1.7.1 Market Definitions
1.7.2 Market Evaluation & Forecasting Methodology
1.7.3 Data Validation
1.7.3.1 Primary Research
1.7.3.2 Secondary Research
1.8 Frequently Asked Questions (FAQs)
1.9 Associated Visiongain Reports
1.10 About Visiongain
2 Executive Summary
3 Market Overview
3.1 Key Findings
3.2 Market Dynamics
3.2.1 Market Driving Factors
3.2.1.1 Increasing Prevalence of NASH
3.2.1.2 Growing Awareness and Diagnosis
3.2.1.3 Increasing Healthcare Expenditure
3.2.2 Market Restraining Factors
3.2.2.1 Lack of Approved Therapies
3.2.2.2 Complex Disease Pathogenesis
3.2.2.3 Clinical Trial Failures
3.2.3 Market Opportunities
3.2.3.1 Technological Advancements
3.2.3.2 Collaborations and Partnerships
3.2.3.3 Diagnostic Tools and Biomarkers
3.3 COVID-19 Impact Analysis
3.4 Porter’s Five Forces Analysis
3.4.1 Bargaining Power of Suppliers
3.4.2 Bargaining Power of Buyers
3.4.3 Competitive Rivalry
3.4.4 Threat from Substitutes
3.4.5 Threat of New Entrants
3.5 PEST Analysis
3.6 Drug Pipeline Analysis
4 NASH Treatment & Therapeutics Market Analysis by Product Type
4.1 Key Findings
4.2 NASH Treatment & Therapeutics Market (Pipeline Analysis) Size Estimation and Forecast by Product Type
4.3 Vitamin E and Pioglitazone
4.4 Ocaliva
4.5 Elafibranor
4.6 Selonsertib
4.7 Cenicriviroc
4.8 Others
5 NASH Treatment & Therapeutics Market Analysis by Application
5.1 Key Findings
5.2 Application Segment: Market Attractiveness Index
5.3 NASH Treatment & Therapeutics Market (Pipeline Analysis) Size Estimation and Forecast by Application
5.4 Treatment
5.4.1 Market Size by Region, 2023-2033 (US$ Million)
5.4.2 Market Share by Region, 2023 & 2033 (%)
5.5 Diagnosis
5.5.1 Market Size by Region, 2023-2033 (US$ Million)
5.5.2 Market Share by Region, 2023 & 2033 (%)
6 NASH Treatment & Therapeutics Market Analysis by Sales Channel
6.1 Key Findings
6.2 Sales Channel Segment: Market Attractiveness Index
6.3 NASH Treatment & Therapeutics Market (Pipeline Analysis) Size Estimation and Forecast by Sales Channel
6.4 Hospital Pharmacy
6.4.1 Market Size by Region, 2023-2033 (US$ Million)
6.4.2 Market Share by Region, 2023 & 2033 (%)
6.5 Online Provider
6.5.1 Market Size by Region, 2023-2033 (US$ Million)
6.5.2 Market Share by Region, 2023 & 2033 (%)
6.6 Retail Pharmacy
6.6.1 Market Size by Region, 2023-2033 (US$ Million)
6.6.2 Market Share by Region, 2023 & 2033 (%)
6.7 Others
6.7.1 Market Size by Region, 2023-2033 (US$ Million)
6.7.2 Market Share by Region, 2023 & 2033 (%)
7 NASH Treatment & Therapeutics Market Analysis by Region
7.1 Key Findings
7.2 Regional Market Size Estimation and Forecast
8 North America NASH Treatment & Therapeutics Market Analysis
8.1 Key Findings
8.2 North America NASH Treatment & Therapeutics Market (Pipeline Analysis) Attractiveness Index
8.3 North America NASH Treatment & Therapeutics Market (Pipeline Analysis) by Country, 2023, 2028 & 2033 (US$ Million)
8.4 North America NASH Treatment & Therapeutics Market (Pipeline Analysis) Size Estimation and Forecast by Country
8.5 North America NASH Treatment & Therapeutics Market (Pipeline Analysis) Size Estimation and Forecast by Application
8.6 North America NASH Treatment & Therapeutics Market (Pipeline Analysis) Size Estimation and Forecast by Sales Channel
8.7 U.S. NASH Treatment & Therapeutics Market Analysis
8.8 Canada NASH Treatment & Therapeutics Market Analysis
9 Europe NASH Treatment & Therapeutics Market Analysis
9.1 Key Findings
9.2 Europe NASH Treatment & Therapeutics Market (Pipeline Analysis) Attractiveness Index
9.3 Europe NASH Treatment & Therapeutics Market (Pipeline Analysis) by Country, 2023, 2028 & 2033 (US$ Million)
9.4 Europe NASH Treatment & Therapeutics Market (Pipeline Analysis) Size Estimation and Forecast by Country
9.5 Europe NASH Treatment & Therapeutics Market (Pipeline Analysis) Size Estimation and Forecast by Application
9.6 Europe NASH Treatment & Therapeutics Market (Pipeline Analysis) Size Estimation and Forecast by Sales Channel
9.7 Germany NASH Treatment & Therapeutics Market Analysis
9.8 France NASH Treatment & Therapeutics Market Analysis
9.9 UK NASH Treatment & Therapeutics Market Analysis
9.10 Italy NASH Treatment & Therapeutics Market Analysis
9.11 Spain NASH Treatment & Therapeutics Market Analysis
9.12 Russia NASH Treatment & Therapeutics Market Analysis
9.13 Rest of Europe NASH Treatment & Therapeutics Market (Pipeline Analysis) Analysis
10 Asia Pacific NASH Treatment & Therapeutics Market (Pipeline Analysis) analysis
10.1 Key Findings
10.2 Asia Pacific NASH Treatment & Therapeutics Market (Pipeline Analysis) Attractiveness Index
10.3 Asia Pacific NASH Treatment & Therapeutics Market (Pipeline Analysis) by Country, 2023, 2028 & 2033 (US$ Million)
10.4 Asia Pacific NASH Treatment & Therapeutics Market (Pipeline Analysis) Size Estimation and Forecast by Country
10.5 Asia Pacific NASH Treatment & Therapeutics Market (Pipeline Analysis) Size Estimation and Forecast by Application
10.6 Asia Pacific NASH Treatment & Therapeutics Market (Pipeline Analysis) Size Estimation and Forecast by Sales Channel
10.7 Japan NASH Treatment & Therapeutics Market Analysis
10.8 China NASH Treatment & Therapeutics Market Analysis
10.9 India NASH Treatment & Therapeutics Market Analysis
10.10 Australia NASH Treatment & Therapeutics Market (Pipeline Analysis) Analysis
10.11 South Korea NASH Treatment & Therapeutics Market Analysis
10.12 Singapore NASH Treatment & Therapeutics Market Analysis
10.13 Rest of Asia Pacific NASH Treatment & Therapeutics Market Analysis
11 Latin America NASH Treatment & Therapeutics Market Analysis
11.1 Key Findings
11.2 Latin America NASH Treatment & Therapeutics Market (Pipeline Analysis) Attractiveness Index
11.3 Latin America NASH Treatment & Therapeutics Market (Pipeline Analysis) by Country, 2023, 2028 & 2033 (US$ Million)
11.4 Latin America NASH Treatment & Therapeutics Market (Pipeline Analysis) Size Estimation and Forecast by Country
11.5 Latin America NASH Treatment & Therapeutics Market (Pipeline Analysis) Size Estimation and Forecast by Application
11.6 Latin America NASH Treatment & Therapeutics Market (Pipeline Analysis) Size Estimation and Forecast by Sales Channel
11.7 Brazil NASH Treatment & Therapeutics Market Analysis
11.8 Mexico NASH Treatment & Therapeutics Market Analysis
11.9 Argentina NASH Treatment & Therapeutics Market Analysis
11.10 Colombia NASH Treatment & Therapeutics Market Analysis
11.11 Rest of Latin America NASH Treatment & Therapeutics Market Analysis
12 Middle East and Africa NASH Treatment & Therapeutics Market Analysis
12.1 Key Findings
12.2 Middle East and Africa NASH Treatment & Therapeutics Market (Pipeline Analysis) Attractiveness Index
12.3 Middle East and Africa NASH Treatment & Therapeutics Market (Pipeline Analysis) by Country, 2023, 2028 & 2033 (US$ Million)
12.4 Middle East and Africa NASH Treatment & Therapeutics Market (Pipeline Analysis) Size Estimation and Forecast by Country
12.5 Middle East and Africa NASH Treatment & Therapeutics Market (Pipeline Analysis) Size Estimation and Forecast by Application
12.6 Middle East and Africa NASH Treatment & Therapeutics Market (Pipeline Analysis) Size Estimation and Forecast by Sales Channel
12.7 GCC NASH Treatment & Therapeutics Market Analysis
12.8 South Africa NASH Treatment & Therapeutics Market Analysis
12.9 Rest of Middle East and Africa NASH Treatment & Therapeutics Market Analysis
13 Company Profiles
13.1 Competitive Landscape, 2022
13.2 Strategic Outlook
13.3 Intercept Pharmaceuticals, Inc.
13.3.1 Company Snapshot
13.3.2 Company Overview
13.3.3 Financial Analysis
13.3.3.1 Net Revenue, 2017-2022
13.3.3.2 R&D, 2017-2022
13.3.4 Product Benchmarking
13.3.5 Strategic Outlook
13.4 Gilead Sciences Inc.
13.4.1 Company Snapshot
13.4.2 Company Overview
13.4.3 Financial Analysis
13.4.3.1 .Net Revenue, 2017-2022
13.4.3.2 R&D, 2017-2022
13.4.3.3 Regional Market Shares, 2022
13.4.4 Product Benchmarking
13.5 Genfit Pharma S.A.S
13.5.1 Company Snapshot
13.5.2 Company Overview
13.5.3 Financial Analysis
13.5.3.1 Net Revenue, 2017-2022
13.5.3.2 R&D, 2017-2022
13.5.4 Product Benchmarking
13.6 BioPredictive S.A.S
13.6.1 Company Snapshot
13.6.2 Company Overview
13.6.3 Product Benchmarking
13.7 Galmed Pharmaceuticals Ltd.
13.7.1 Company Snapshot
13.7.2 Company Overview
13.7.3 Product Benchmarking
13.7.4 Strategic Outlook
13.8 Cadila Pharmaceuticals Ltd.
13.8.1 Company Snapshot
13.8.2 Company Overview
13.8.3 Product Benchmarking
13.9 Prometheus Laboratories Inc.
13.9.1 Company Snapshot
13.9.2 Company Overview
13.9.3 Product Benchmarking
13.10 AbbVie Inc.
13.10.1 Company Snapshot
13.10.2 Company Overview
13.10.3 Financial Analysis
13.10.3.1 Net Revenue, 2017-2022
13.10.3.2 R&D, 2017-2022
13.10.3.3 Regional Market Shares, 2022
13.10.4 Product Benchmarking
13.10.5 Strategic Outlook
13.11 Enanta Pharmaceuticals Inc.
13.11.1 Company Snapshot
13.11.2 Company Overview
13.11.3 Financial Analysis
13.11.3.1 Net Revenue, 2017-2022
13.11.4 Product Benchmarking
13.12 Genentech, Inc.
13.12.1 Company Snapshot
13.12.2 Company Overview
13.12.3 Product Benchmarking
14 Conclusion and Recommendations
14.1 Concluding Remarks from Visiongain
14.2 Recommendations for Market Players
List of Tables
Table 1 NASH Treatment & Therapeutics Market (Pipeline Analysis) Snapshot, 2023 & 2033 (US$ Million, CAGR %)
Table 2 NASH Treatment & Therapeutics Market (Pipeline Analysis) Forecast by Region, 2023-2033 (US$ Million, AGR%, CAGR%): “V” Shaped Recovery
Table 3 NASH Treatment & Therapeutics Market (Pipeline Analysis) Forecast by Region, 2023-2033 (US$ Million, AGR%, CAGR%): “U” Shaped Recovery
Table 4 NASH Treatment & Therapeutics Market (Pipeline Analysis) Forecast by Region, 2023-2033 (US$ Million, AGR%, CAGR%): “W” Shaped Recovery
Table 5 NASH Treatment & Therapeutics Market (Pipeline Analysis) Forecast by Region, 2023-2033 (US$ Million, AGR%, CAGR%): “L” Shaped Recovery
Table 6 NASH Treatment & Therapeutics Market (Pipeline Analysis) Forecast by Product Type, 2023-2033 (US$ Million, AGR%, CAGR%)
Table 7 NASH Treatment & Therapeutics Market (Pipeline Analysis) Forecast by Application, 2023-2033 (US$ Million, AGR%, CAGR%)
Table 8 Treatment Segment Market Forecast by Region, 2023-2033 (US$ Million, AGR%, CAGR%)
Table 9 Diagnosis Segment Market Forecast by Region, 2023-2033 (US$ Million, AGR%, CAGR%)
Table 10 NASH Treatment & Therapeutics Market (Pipeline Analysis) Forecast by Sales Channel, 2023-2033 (US$ Million, AGR%, CAGR%)
Table 11 Hospital Pharmacy Segment Market Forecast by Region, 2023-2033 (US$ Million, AGR%, CAGR%)
Table 12 Online Provider Segment Market Forecast by Region, 2023-2033 (US$ Million, AGR%, CAGR%)
Table 13 Retail Pharmacy Segment Market Forecast by Region, 2023-2033 (US$ Million, AGR%, CAGR%)
Table 14 Others Segment Market Forecast by Region, 2023-2033 (US$ Million, AGR%, CAGR%)
Table 15 NASH Treatment & Therapeutics Market (Pipeline Analysis) Forecast by Region, 2023-2033 (US$ Million, AGR%, CAGR%)
Table 16 North America NASH Treatment & Therapeutics Market (Pipeline Analysis) Forecast by Country, 2023-2033 (US$ Million, AGR%, CAGR%)
Table 17 North America NASH Treatment & Therapeutics Market (Pipeline Analysis) Forecast by Application, 2023-2033 (US$ Million, AGR%, CAGR%)
Table 18 North America NASH Treatment & Therapeutics Market (Pipeline Analysis) Forecast by Sales Channel, 2023-2033 (US$ Million, AGR%, CAGR%)
Table 19 U.S. NASH Treatment & Therapeutics Market (Pipeline Analysis) Forecast, 2023-2033 (US$ Million, AGR%, CAGR%)
Table 20 Canada NASH Treatment & Therapeutics Market (Pipeline Analysis) Forecast, 2023-2033 (US$ Million, AGR%, CAGR%)
Table 21 Europe NASH Treatment & Therapeutics Market (Pipeline Analysis) Forecast by Country, 2023-2033 (US$ Million, AGR%, CAGR%)
Table 22 Europe NASH Treatment & Therapeutics Market (Pipeline Analysis) Forecast by Application, 2023-2033 (US$ Million, AGR%, CAGR%)
Table 23 Europe NASH Treatment & Therapeutics Market (Pipeline Analysis) Forecast by Sales Channel, 2023-2033 (US$ Million, AGR%, CAGR%)
Table 24 Germany NASH Treatment & Therapeutics Market (Pipeline Analysis) Forecast, 2023-2033 (US$ Million, AGR%, CAGR%)
Table 25 France NASH Treatment & Therapeutics Market (Pipeline Analysis) Forecast, 2023-2033 (US$ Million, AGR%, CAGR%)
Table 26 UK NASH Treatment & Therapeutics Market (Pipeline Analysis) Forecast, 2023-2033 (US$ Million, AGR%, CAGR%)
Table 27 Italy NASH Treatment & Therapeutics Market (Pipeline Analysis) Forecast, 2023-2033 (US$ Million, AGR%, CAGR%)
Table 28 Spain NASH Treatment & Therapeutics Market (Pipeline Analysis) Forecast, 2023-2033 (US$ Million, AGR%, CAGR%)
Table 29 Russia NASH Treatment & Therapeutics Market (Pipeline Analysis) Forecast, 2023-2033 (US$ Million, AGR%, CAGR%)
Table 30 Rest of Europe NASH Treatment & Therapeutics Market (Pipeline Analysis) Forecast, 2023-2033 (US$ Million, AGR%, CAGR%)
Table 31 Asia Pacific NASH Treatment & Therapeutics Market (Pipeline Analysis) Forecast by Country, 2023-2033 (US$ Million, AGR%, CAGR%)
Table 32 Asia Pacific NASH Treatment & Therapeutics Market (Pipeline Analysis) Forecast by Application, 2023-2033 (US$ Million, AGR%, CAGR%)
Table 33 Asia Pacific NASH Treatment & Therapeutics Market (Pipeline Analysis) Forecast by Sales Channel, 2023-2033 (US$ Million, AGR%, CAGR%)
Table 34 Japan NASH Treatment & Therapeutics Market (Pipeline Analysis) Forecast, 2023-2033 (US$ Million, AGR%, CAGR%)
Table 35 China NASH Treatment & Therapeutics Market (Pipeline Analysis) Forecast, 2023-2033 (US$ Million, AGR%, CAGR%)
Table 36 India NASH Treatment & Therapeutics Market (Pipeline Analysis) Forecast, 2023-2033 (US$ Million, AGR%, CAGR%)
Table 37 Australia NASH Treatment & Therapeutics Market (Pipeline Analysis) Forecast, 2023-2033 (US$ Million, AGR%, CAGR%)
Table 38 South Korea NASH Treatment & Therapeutics Market (Pipeline Analysis) Forecast, 2023-2033 (US$ Million, AGR%, CAGR%)
Table 39 Singapore NASH Treatment & Therapeutics Market (Pipeline Analysis) Forecast, 2023-2033 (US$ Million, AGR%, CAGR%)
Table 40 Rest of Asia Pacific NASH Treatment & Therapeutics Market (Pipeline Analysis) Forecast, 2023-2033 (US$ Million, AGR%, CAGR%)
Table 41 Latin America NASH Treatment & Therapeutics Market (Pipeline Analysis) Forecast by Country, 2023-2033 (US$ Million, AGR%, CAGR%)
Table 42 Latin America NASH Treatment & Therapeutics Market (Pipeline Analysis) Forecast by Application, 2023-2033 (US$ Million, AGR%, CAGR%)
Table 43 Latin America NASH Treatment & Therapeutics Market (Pipeline Analysis) Forecast by Sales Channel, 2023-2033 (US$ Million, AGR%, CAGR%)
Table 44 Brazil NASH Treatment & Therapeutics Market (Pipeline Analysis) Forecast, 2023-2033 (US$ Million, AGR%, CAGR%)
Table 45 Mexico NASH Treatment & Therapeutics Market (Pipeline Analysis) Forecast, 2023-2033 (US$ Million, AGR%, CAGR%)
Table 46 Argentina NASH Treatment & Therapeutics Market (Pipeline Analysis) Forecast, 2023-2033 (US$ Million, AGR%, CAGR%)
Table 47 Colombia NASH Treatment & Therapeutics Market (Pipeline Analysis) Forecast, 2023-2033 (US$ Million, AGR%, CAGR%)
Table 48 Rest of Latin America NASH Treatment & Therapeutics Market (Pipeline Analysis) Forecast, 2023-2033 (US$ Million, AGR%, CAGR%)
Table 49 Middle East and Africa NASH Treatment & Therapeutics Market (Pipeline Analysis) Forecast by Country, 2023-2033 (US$ Million, AGR%, CAGR%)
Table 50 Middle East and Africa NASH Treatment & Therapeutics Market (Pipeline Analysis) Forecast by Application, 2023-2033 (US$ Million, AGR%, CAGR%)
Table 51 Middle East and Africa NASH Treatment & Therapeutics Market (Pipeline Analysis) Forecast by Sales Channel, 2023-2033 (US$ Million, AGR%, CAGR%)
Table 52 GCC NASH Treatment & Therapeutics Market (Pipeline Analysis) Forecast, 2023-2033 (US$ Million, AGR%, CAGR%)
Table 53 South Africa NASH Treatment & Therapeutics Market (Pipeline Analysis) Forecast, 2023-2033 (US$ Million, AGR%, CAGR%)
Table 54 Rest of Middle East and Africa NASH Treatment & Therapeutics Market (Pipeline Analysis) Forecast, 2023-2033 (US$ Million, AGR%, CAGR%)
Table 55 Strategic Outlook
Table 56 Intercept Pharmaceuticals, Inc.: Key Details, (CEO, HQ, Revenue, Founded, No. of Employees, Company Type, Website, Business Segment)
Table 57 Intercept Pharmaceuticals, Inc.: Product Benchmarking
Table 58 Intercept Pharmaceuticals, Inc.: Strategic Outlook
Table 59 Gilead Sciences Inc.: Key Details, (CEO, HQ, Revenue, Founded, No. of Employees, Company Type, Website, Business Segment)
Table 60 Gilead Sciences Inc.: Product Benchmarking
Table 61 Genfit Pharma S.A.S: Key Details, (CEO, HQ, Revenue, Founded, No. of Employees, Company Type, Website, Business Segment)
Table 62 Genfit Pharma S.A.S: Product Benchmarking
Table 63 BioPredictive S.A.S: Key Details, (HQ, Company Type, Website, Business Segment)
Table 64 BioPredictive S.A.S: Product Benchmarking
Table 65 Galmed Pharmaceuticals Ltd.: Key Details, (CEO, HQ, Founded, Company Type, Website, Business Segment)
Table 66 Galmed Pharmaceuticals Ltd.: Product Benchmarking
Table 67 Galmed Pharmaceuticals Ltd.: Strategic Outlook
Table 68 Cadila Pharmaceuticals Ltd.: Key Details, (CEO, HQ, Founded, No. of Employees, Company Type, Website, Business Segment)
Table 69 Cadila Pharmaceuticals Ltd.: Product Benchmarking
Table 70 Prometheus Laboratories Inc.: Key Details, (CEO, HQ, Founded, No. of Employees, Company Type, Website, Business Segment)
Table 71 Prometheus Laboratories Inc.: Product Benchmarking
Table 72 AbbVie Inc.: Key Details, (CEO, HQ, Revenue, Founded, No. of Employees, Company Type, Website, Business Segment)
Table 73 AbbVie Inc.: Product Benchmarking
Table 74 AbbVie Inc.: Strategic Outlook
Table 75 Enanta Pharmaceuticals Inc.: Key Details, (CEO, HQ, Revenue, Founded, No. of Employees, Company Type, Website, Business Segment)
Table 76 Enanta Pharmaceuticals Inc.: Product Benchmarking
Table 77 Genentech, Inc.: Key Details, (CEO, HQ, Founded, No. of Employees, Company Type, Website, Business Segment)
Table 78 Genentech, Inc.: Product Benchmarking
List of Figures
Figure 1 NASH Treatment & Therapeutics Market (Pipeline Analysis) Segmentation
Figure 2 NASH Treatment & Therapeutics Market (Pipeline Analysis) by Application: Market Attractiveness Index
Figure 3 NASH Treatment & Therapeutics Market (Pipeline Analysis) by Sales Channel: Market Attractiveness Index
Figure 4 NASH Treatment & Therapeutics Market (Pipeline Analysis) Attractiveness Index by Region
Figure 5 NASH Treatment & Therapeutics Market (Pipeline Analysis): Market Dynamics
Figure 6 NASH Treatment & Therapeutics Market (Pipeline Analysis) by Region, 2023-2033 (US$ Million, AGR %): “V” Shaped Recovery
Figure 7 NASH Treatment & Therapeutics Market (Pipeline Analysis) by Region, 2023-2033 (US$ Million, AGR %): “U” Shaped Recovery
Figure 8 NASH Treatment & Therapeutics Market (Pipeline Analysis) by Region, 2023-2033 (US$ Million, AGR %): “W” Shaped Recovery
Figure 9 NASH Treatment & Therapeutics Market (Pipeline Analysis) by Region, 2023-2033 (US$ Million, AGR %): “L” Shaped Recovery
Figure 10 NASH Treatment & Therapeutics Market (Pipeline Analysis): Porter’s Five Forces Analysis
Figure 11 NASH Treatment & Therapeutics Market (Pipeline Analysis): PEST Analysis
Figure 12 NASH Treatment & Therapeutics Market (Pipeline Analysis): Drug Pipeline Analysis
Figure 13 NASH Treatment & Therapeutics Market (Pipeline Analysis) Forecast by Product Type, 2023-2033 (US$ Million, AGR %)
Figure 14 NASH Treatment & Therapeutics Market (Pipeline Analysis) Share Forecast by Product Type, 2023, 2028, 2033 (%)
Figure 15 NASH Treatment & Therapeutics Market (Pipeline Analysis) by Application: Market Attractiveness Index
Figure 16 NASH Treatment & Therapeutics Market (Pipeline Analysis) Forecast by Application, 2023-2033 (US$ Million, AGR %)
Figure 17 NASH Treatment & Therapeutics Market (Pipeline Analysis) Share Forecast by Application, 2023, 2028, 2033 (%)
Figure 18 Treatment Segment Market Forecast by Region, 2023-2033 (US$ Million, AGR %)
Figure 19 Treatment Segment Market Share Forecast by Region, 2023 & 2033 (%)
Figure 20 Diagnosis Segment Market Forecast by Region, 2023-2033 (US$ Million, AGR %)
Figure 21 Diagnosis Segment Market Share Forecast by Region, 2023 & 2033 (%)
Figure 22 NASH Treatment & Therapeutics Market (Pipeline Analysis) by Sales Channel: Market Attractiveness Index
Figure 23 NASH Treatment & Therapeutics Market (Pipeline Analysis) Forecast by Sales Channel, 2023-2033 (US$ Million, AGR %)
Figure 24 NASH Treatment & Therapeutics Market (Pipeline Analysis) Share Forecast by Sales Channel, 2023, 2028, 2033 (%)
Figure 25 Hospital Pharmacy Segment Market Forecast by Region, 2023-2033 (US$ Million, AGR %)
Figure 26 Hospital Pharmacy Segment Market Share Forecast by Region, 2023 & 2033 (%)
Figure 27 Online Provider Segment Market Forecast by Region, 2023-2033 (US$ Million, AGR %)
Figure 28 Online Provider Segment Market Share Forecast by Region, 2023 & 2033 (%)
Figure 29 Retail Pharmacy Segment Market Forecast by Region, 2023-2033 (US$ Million, AGR %)
Figure 30 Retail Pharmacy Segment Market Share Forecast by Region, 2023 & 2033 (%)
Figure 31 Others Segment Market Forecast by Region, 2023-2033 (US$ Million, AGR %)
Figure 32 Others Segment Market Share Forecast by Region, 2023 & 2033 (%)
Figure 33 NASH Treatment & Therapeutics Market (Pipeline Analysis) Forecast by Region 2023 and 2033 (Revenue, CAGR%)
Figure 34 NASH Treatment & Therapeutics Market (Pipeline Analysis) Share Forecast by Region 2023, 2028, 2033 (%)
Figure 35 NASH Treatment & Therapeutics Market (Pipeline Analysis) by Region, 2023-2033 (US$ Million, AGR %)
Figure 36 North America NASH Treatment & Therapeutics Market (Pipeline Analysis) Attractiveness Index
Figure 37 North America NASH Treatment & Therapeutics Market (Pipeline Analysis) by Region, 2023, 2028 & 2033 (US$ Million)
Figure 38 North America NASH Treatment & Therapeutics Market (Pipeline Analysis) Forecast by Country, 2023-2033 (US$ Million, AGR %)
Figure 39 North America NASH Treatment & Therapeutics Market (Pipeline Analysis) Share Forecast by Country, 2023 & 2033 (%)
Figure 40 North America NASH Treatment & Therapeutics Market (Pipeline Analysis) Forecast by Application, 2023-2033 (US$ Million, AGR %)
Figure 41 North America NASH Treatment & Therapeutics Market (Pipeline Analysis) Share Forecast by Application, 2023 & 2033 (%)
Figure 42 North America NASH Treatment & Therapeutics Market (Pipeline Analysis) Forecast by Sales Channel, 2023-2033 (US$ Million, AGR %)
Figure 43 North America NASH Treatment & Therapeutics Market (Pipeline Analysis) Share Forecast by Sales Channel, 2023 & 2033 (%)
Figure 44 U.S. NASH Treatment & Therapeutics Market (Pipeline Analysis) Forecast, 2023-2033 (US$ Million, AGR %)
Figure 45 Canada NASH Treatment & Therapeutics Market (Pipeline Analysis) Forecast, 2023-2033 (US$ Million, AGR %)
Figure 46 Europe NASH Treatment & Therapeutics Market (Pipeline Analysis) Attractiveness Index
Figure 47 Europe NASH Treatment & Therapeutics Market (Pipeline Analysis) by Region, 2023, 2028 & 2033 (US$ Million)
Figure 48 Europe NASH Treatment & Therapeutics Market (Pipeline Analysis) Forecast by Country, 2023-2033 (US$ Million, AGR %)
Figure 49 Europe NASH Treatment & Therapeutics Market (Pipeline Analysis) Share Forecast by Country, 2023 & 2033 (%)
Figure 50 Europe NASH Treatment & Therapeutics Market (Pipeline Analysis) Forecast by Application, 2023-2033 (US$ Million, AGR %)
Figure 51 Europe NASH Treatment & Therapeutics Market (Pipeline Analysis) Share Forecast by Application, 2023 & 2033 (%)
Figure 52 Europe NASH Treatment & Therapeutics Market (Pipeline Analysis) Forecast by Sales Channel, 2023-2033 (US$ Million, AGR %)
Figure 53 Europe NASH Treatment & Therapeutics Market (Pipeline Analysis) Share Forecast by Sales Channel, 2023 & 2033 (%)
Figure 54 Germany NASH Treatment & Therapeutics Market (Pipeline Analysis) Forecast, 2023-2033 (US$ Million, AGR %)
Figure 55 France NASH Treatment & Therapeutics Market (Pipeline Analysis) Forecast, 2023-2033 (US$ Million, AGR %)
Figure 56 UK NASH Treatment & Therapeutics Market (Pipeline Analysis) Forecast, 2023-2033 (US$ Million, AGR %)
Figure 57 Italy NASH Treatment & Therapeutics Market (Pipeline Analysis) Forecast, 2023-2033 (US$ Million, AGR %)
Figure 58 Spain NASH Treatment & Therapeutics Market (Pipeline Analysis) Forecast, 2023-2033 (US$ Million, AGR %)
Figure 59 Russia NASH Treatment & Therapeutics Market (Pipeline Analysis) Forecast, 2023-2033 (US$ Million, AGR %)
Figure 60 Rest of Europe NASH Treatment & Therapeutics Market (Pipeline Analysis) Forecast, 2023-2033 (US$ Million, AGR %)
Figure 61 Asia Pacific NASH Treatment & Therapeutics Market (Pipeline Analysis) Attractiveness Index
Figure 62 Asia Pacific NASH Treatment & Therapeutics Market (Pipeline Analysis) by Region, 2023, 2028 & 2033 (US$ Million)
Figure 63 Asia Pacific NASH Treatment & Therapeutics Market (Pipeline Analysis) Forecast by Country, 2023-2033 (US$ Million, AGR %)
Figure 64 Asia Pacific NASH Treatment & Therapeutics Market (Pipeline Analysis) Share Forecast by Country, 2023 & 2033 (%)
Figure 65 Asia Pacific NASH Treatment & Therapeutics Market (Pipeline Analysis) Forecast by Application, 2023-2033 (US$ Million, AGR %)
Figure 66 Asia Pacific NASH Treatment & Therapeutics Market (Pipeline Analysis) Share Forecast by Application, 2023 & 2033 (%)
Figure 67 Asia Pacific NASH Treatment & Therapeutics Market (Pipeline Analysis) Forecast by Sales Channel, 2023-2033 (US$ Million, AGR %)
Figure 68 Asia Pacific NASH Treatment & Therapeutics Market (Pipeline Analysis) Share Forecast by Sales Channel, 2023 & 2033 (%)
Figure 69 Japan NASH Treatment & Therapeutics Market (Pipeline Analysis) Forecast, 2023-2033 (US$ Million, AGR %)
Figure 70 China NASH Treatment & Therapeutics Market (Pipeline Analysis) Forecast, 2023-2033 (US$ Million, AGR %)
Figure 71 India NASH Treatment & Therapeutics Market (Pipeline Analysis) Forecast, 2023-2033 (US$ Million, AGR %)
Figure 72 Australia NASH Treatment & Therapeutics Market (Pipeline Analysis) Forecast, 2023-2033 (US$ Million, AGR %)
Figure 73 South Korea NASH Treatment & Therapeutics Market (Pipeline Analysis) Forecast, 2023-2033 (US$ Million, AGR %)
Figure 74 Singapore NASH Treatment & Therapeutics Market (Pipeline Analysis) Forecast, 2023-2033 (US$ Million, AGR %)
Figure 75 Rest of Asia Pacific NASH Treatment & Therapeutics Market (Pipeline Analysis) Forecast, 2023-2033 (US$ Million, AGR %)
Figure 76 Latin America NASH Treatment & Therapeutics Market (Pipeline Analysis) Attractiveness Index
Figure 77 Latin America NASH Treatment & Therapeutics Market (Pipeline Analysis) by Region, 2023, 2028 & 2033 (US$ Million)
Figure 78 Latin America NASH Treatment & Therapeutics Market (Pipeline Analysis) Forecast by Country, 2023-2033 (US$ Million, AGR %)
Figure 79 Latin America NASH Treatment & Therapeutics Market (Pipeline Analysis) Share Forecast by Country, 2023 & 2033 (%)
Figure 80 Latin America NASH Treatment & Therapeutics Market (Pipeline Analysis) Forecast by Application, 2023-2033 (US$ Million, AGR %)
Figure 81 Latin America NASH Treatment & Therapeutics Market (Pipeline Analysis) Share Forecast by Application, 2023 & 2033 (%)
Figure 82 Latin America NASH Treatment & Therapeutics Market (Pipeline Analysis) Forecast by Sales Channel, 2023-2033 (US$ Million, AGR %)
Figure 83 Latin America NASH Treatment & Therapeutics Market (Pipeline Analysis) Share Forecast by Sales Channel, 2023 & 2033 (%)
Figure 84 Brazil NASH Treatment & Therapeutics Market (Pipeline Analysis) Forecast, 2023-2033 (US$ Million, AGR %)
Figure 85 Mexico NASH Treatment & Therapeutics Market (Pipeline Analysis) Forecast, 2023-2033 (US$ Million, AGR %)
Figure 86 Argentina NASH Treatment & Therapeutics Market (Pipeline Analysis) Forecast, 2023-2033 (US$ Million, AGR %)
Figure 87 Colombia NASH Treatment & Therapeutics Market (Pipeline Analysis) Forecast, 2023-2033 (US$ Million, AGR %)
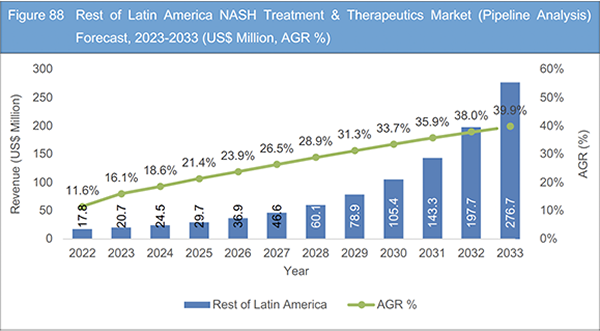
Figure 88 Rest of Latin America NASH Treatment & Therapeutics Market (Pipeline Analysis) Forecast, 2023-2033 (US$ Million, AGR %)
Figure 89 Middle East and Africa NASH Treatment & Therapeutics Market (Pipeline Analysis) Attractiveness Index
Figure 90 Middle East and Africa NASH Treatment & Therapeutics Market (Pipeline Analysis) by Region, 2023, 2028 & 2033 (US$ Million)
Figure 91 Middle East and Africa NASH Treatment & Therapeutics Market (Pipeline Analysis) Forecast by Country, 2023-2033 (US$ Million, AGR %)
Figure 92 Middle East and Africa NASH Treatment & Therapeutics Market (Pipeline Analysis) Share Forecast by Country, 2023 & 2033 (%)
Figure 93 Middle East and Africa NASH Treatment & Therapeutics Market (Pipeline Analysis) Forecast by Application, 2023-2033 (US$ Million, AGR %)
Figure 94 Middle East and Africa NASH Treatment & Therapeutics Market (Pipeline Analysis) Share Forecast by Application, 2023 & 2033 (%)
Figure 95 Middle East and Africa NASH Treatment & Therapeutics Market (Pipeline Analysis) Forecast by Sales Channel, 2023-2033 (US$ Million, AGR %)
Figure 96 Middle East and Africa NASH Treatment & Therapeutics Market (Pipeline Analysis) Share Forecast by Sales Channel, 2023 & 2033 (%)
Figure 97 GCC NASH Treatment & Therapeutics Market (Pipeline Analysis) Forecast, 2023-2033 (US$ Million, AGR %)
Figure 98 South Africa NASH Treatment & Therapeutics Market (Pipeline Analysis) Forecast, 2023-2033 (US$ Million, AGR %)
Figure 99 Rest of Middle East and Africa NASH Treatment & Therapeutics Market (Pipeline Analysis) Forecast, 2023-2033 (US$ Million, AGR %)
Figure 100 NASH Treatment & Therapeutics Market (Pipeline Analysis): Company Share/Ranking, 2022
Figure 101 Intercept Pharmaceuticals, Inc.: Net Revenue, 2017-2022 (US$ Million, AGR%)
Figure 102 Intercept Pharmaceuticals, Inc.: R&D, 2017-2022 (US$ Million, AGR%)
Figure 103 Gilead Sciences Inc.: Net Revenue, 2017-2022 (US$ Million, AGR%)
Figure 104 Gilead Sciences Inc.: R&D, 2017-2022 (US$ Million, AGR%)
Figure 105 Gilead Sciences Inc.: Regional Market Shares, 2022
Figure 106 Genfit Pharma S.A.S: Net Revenue, 2017-2022 (US$ Million, AGR%)
Figure 107 Genfit Pharma S.A.S: R&D, 2017-2022 (US$ Million, AGR%)
Figure 108 AbbVie Inc.: Net Revenue, 2017-2022 (US$ Million, AGR%)
Figure 109 AbbVie Inc.: R&D, 2017-2022 (US$ Million, AGR%)
Figure 110 AbbVie Inc.: Regional Market Shares, 2022
Figure 111 Enanta Pharmaceuticals Inc.: Net Revenue, 2017-2022 (US$ Million, AGR%)
List of Companies Profiled in the Report
AbbVie Inc.
BioPredictive S.A.S
Cadila Pharmaceuticals
Enanta
Galmed Pharmaceuticals
Genentech
Genfit
Gilead Sciences
Intercept Pharmaceuticals
Prometheus Laboratories
List of Other Companies Mentioned in the Report
AstraZeneca
Bristol Myers Squibb
Cirius Therapeutics
Corcept Therapeutics
Madrigal Pharmaceuticals
NorthSea Therapeutics
Novo Nordisk
NuSirt Biopharma
Sagimet Biosciences
Sinew Pharma
List of Associations Mentioned in the Report
American Association for the Study of Liver Diseases (AASLD)
Canadian NASH Network (CanNASH)
European Association for the Study of the Liver (EASL)
Global Liver Institute (GLI)
NASH Alliance
NASH Education Program
NASH Research Network
The International Liver Congress (ILC)
The NASH Network
The NASH-TAG