Industries > Defence > Military Vehicle & Aircraft Protection Systems Market Report 2019-2029
Military Vehicle & Aircraft Protection Systems Market Report 2019-2029
Forecasts & Analysis by Systems & Geography, Ground-Based Systems (Active Protection, Passive Protection & Hybrid), Active Protection Systems (Soft Kill Systems, Hard Kill Systems & Hybrid Systems), Airborne Systems (Floor Protection, Cockpit Protection & Exterior Protection), Regions (The Americas, Asia Oceania, Europe & Rest of World), Plus, Profiles of Leading Companies in the Market Space
• US Army Sends Out Invitations to Future Armoured Vehicles Active Protection Systems USA 2019
• US Fighter Jets Could Soon be Armed with Lasers
• Testing Begins this Summer on ‘Soft Kill’, ‘Hard Kill’ Systems to Protect Ground Vehicles
These are just some of the business-critical headlines that have surfaced about your industry in 2019. How are you, and your company, reacting to news such as this? By ordering and reading our new report today, you will be fully informed and ready to act.
What does the future hold for the Global Military Vehicle & Aircraft Protection Systems market?
Visiongain’s new study supplies the answer to you and supplies it to you NOW.
In this new, 194-page report, you will receive almost 250 tables and charts as well as independent, impartial and objective analysis.
By ordering and reading this report today, you will be given:
• A concise definition and comprehensive analysis of the Military Vehicle & Aircraft Protection Systems market from 2019 to 2029.
• An understanding of not only the financial prospects of the Military Vehicle & Aircraft Protection Systems market but also the growth potential of ground-based and airborne platforms, and each major geographical region.
• An informed forecast of the sales of 16 leading nations – the United States, Canada, Mexico, Brazil, Germany, France, the United Kingdom, Russia, China, India, Japan, South Korea, Israel, Saudi Arabia, South Africa and the United Arab Emirates.
• A description of the main drivers and restraints that are affecting the development of the Military Vehicle & Aircraft Protection Systems market.
• Ten succinct profiles of the key players in the industry, as well as up-to-date information on agreed-upon contracts and analysis of each company’s reputation, finances and outlook.
Who should read this report?
• Senior Executives
• Business Development Managers
• Marketing Directors
• Consultants
• CEOs, CIOs & COOs
Governments, agencies & organisations actively working or interested in the Military Vehicle & Aircraft Protection Systems industry will also find significant value in our research.
Predictions for the global market and submarkets – what’s possible?
Along with an evaluation of the current level of international investment in the Military Vehicle & Aircraft Protection Systems market, this report provides measured forecasts for four submarkets covering the period 2019 to 2029.
• Military Vehicle & Aircraft Protection Systems Forecasts by Ground-Based Systems, 2019-2029
– Active Protection Systems Submarket Forecast, 2019-2029
– Passive Protection Submarket Forecast, 2019-2029
– Hybrid Submarket Forecast, 2019-2029
• Military Vehicle & Aircraft Protection Systems Forecasts by Active Protection Systems, 2019-2029
– Soft Kill Submarket Forecast, 2019-2029
– Hard Kill Submarket Forecast, 2019-2029
– Hybrid – Soft Kill & Hard Kill Submarket Forecast, 2019-2029
• Military Vehicle & Aircraft Protection Systems Forecasts by Airborne Systems, 2019-2029
– Floor Protection Submarket Forecast, 2019-2029
– Cockpit Protection Submarket Forecast, 2019-2029
– Exterior Protection Forecast, 2019-2029
• Military Vehicle & Aircraft Protection Systems Forecasts by Regions, 2019-2029
– The Americas Submarket Forecast, 2019-2029
– Europe Submarket Forecast, 2019-2029
– Asia Oceania Submarket Forecast, 2019-2029
– The Middle East & Africa Submarket Forecast, 2019-2029
This unique study is available today. Only by ordering and reading this report will you stay up-to-date and fully informed of how your industry is evolving and how you can be at the forefront of such changes.
Visiongain is a trading partner with the US Federal Government
CCR Ref number: KD4R6
Do you have any custom requirements we can help you with? Any need for specific country, geo region, market segment or specific company information? Contact us today, we can discuss your needs and see how we can help: sara.peerun@visiongain.com
1.1 Military Vehicle & Aircraft Protection Systems Market Definition & Research Scope
1.2 Why You Should Read This Report
1.3 How This Report Delivers
1.4 Key Questions Answered by This Analytical Report
1.5 Who is This Report for?
1.6 Methodology
1.7 Frequently Asked Questions (FAQ)
1.8 Associated Visiongain Reports
1.9 About Visiongain
2. Introduction to the Military Vehicle & Aircraft Protection Systems Market
2.1 Porter’s Five Forces Analysis
2.1.1 Bargaining Power of Buyers
2.1.2 Bargaining Power of Suppliers
2.1.3 Threats to Substitutes
2.1.4 Threats to New Entrants
2.1.5 Competitive Rivalry
2.1 Market Dynamics
3. Global Military Vehicle & Aircraft Protection Systems Market, 2019-2029
4. Global Military Vehicle & Aircraft Protection Systems Market
4.1 Global Military Vehicle & Aircraft Protection Systems Market Forecast, by Systems Type, 2019-2029
4.1.1 Global Military & Aircraft Protection Systems Market Forecast, Ground-Based Systems Segment 2019-2029
4.1.2 Global Military & Aircraft Protection Systems Market Forecast, by Ground-Based Systems Type 2019-2029
4.1.3 Global Military & Aircraft Protection Systems Market Forecast, Active Protection Systems Segment 2019-2029
4.1.4 Global Military & Aircraft Protection Systems Market Forecast, by Active Protection Systems Type 2019-2029
4.1.5 Global Military & Aircraft Protection Systems Market Forecast, Passive Protection Segment 2019-2029
4.1.6 Global Military & Aircraft Protection Systems Market Forecast, Airborne Systems Segment 2019-2029
4.1.7 Global Military & Aircraft Protection Systems Market Forecast, by Airborne Systems Type 2019-2029
4.1.8 Global Military & Aircraft Protection Systems Market Forecast, Cockpit Protection Segment 2019-2029
4.1.9 Global Military & Aircraft Protection Systems Market Forecast, Floor Protection Segment 2019-2029
4.1.10 Global Military & Aircraft Protection Systems Market Forecast, Exterior Protection Segment 2019-2029
5. Global Military Vehicle & Aircraft Protection Systems Market, by Geography 2019-2029
5.1 The Americas Military Vehicle & Aircraft Protection Systems Market forecast 2019-2029
5.1.1 The Americas Military & Aircraft Protection Systems Market Forecast, by Systems Type 2019-2029
5.1.2 The Americas Military & Aircraft Protection Systems Market Forecast, by Ground-Based Systems Segment 2019-2029
5.1.3 The Americas Military & Aircraft Protection Systems Market Forecast, by Ground-Based Systems Type 2019-2029
5.1.4 The Americas Military & Aircraft Protection Systems Market Forecast, by Active Protection Systems 2019-2029
5.1.5 The Americas Military & Aircraft Protection Systems Market Forecast, by Airborne Systems Type 2019-2029
5.1.6 The Americas Military & Aircraft Protection Systems Market Forecast, by Country 2019-2029
5.1.7 U.S. Military & Aircraft Protection Systems Market Forecast 2019-2029
5.1.8 Canada Military & Aircraft Protection Systems Market Forecast 2019-2029
5.1.9 Mexico Military & Aircraft Protection Systems Market Forecast 2019-2029
5.1.10 Brazil Military & Aircraft Protection Systems Market Forecast 2019-2029
5.1.11 Rest of Americas Military & Aircraft Protection Systems Market Forecast 2019-2029
5.2 Europe Military Vehicle & Aircraft Protection Systems Market forecast 2019-2029
5.2.1 Europe Military & Aircraft Protection Systems Market Forecast, by Systems Type 2019-2029
5.2.2 Europe Military & Aircraft Protection Systems Market Forecast, by Ground-Based Systems Segment 2019-2029
5.2.3 Europe Military & Aircraft Protection Systems Market Forecast, by Ground-Based Systems Type 2019-2029
5.2.4 Europe Military & Aircraft Protection Systems Market Forecast, by Active Protection Systems 2019-2029
5.2.5 Europe Military & Aircraft Protection Systems Market Forecast, by Airborne Systems Type 2019-2029
5.2.6 Europe Military & Aircraft Protection Systems Market Forecast, by Country 2019-2029
5.2.7 Germany Military & Aircraft Protection Systems Market Forecast 2019-2029
5.2.8 France Military & Aircraft Protection Systems Market Forecast 2019-2029
5.2.9 U.K. Military & Aircraft Protection Systems Market Forecast 2019-2029
5.2.10 Russia Military & Aircraft Protection Systems Market Forecast 2019-2029
5.2.11 Rest of Europe Military & Aircraft Protection Systems Market Forecast 2019-2029
5.3 Asia Oceania Military Vehicle & Aircraft Protection Systems Market forecast 2019-2029
5.3.1 Asia Oceania Military & Aircraft Protection Systems Market Forecast, by Systems Type 2019-2029
5.3.2 Asia Oceania Military & Aircraft Protection Systems Market Forecast, by Ground-Based Systems Segment 2019-2029
5.3.3 Asia Oceania Military & Aircraft Protection Systems Market Forecast, by Ground-Based Systems Type 2019-2029
5.3.4 Asia Oceania Military & Aircraft Protection Systems Market Forecast, by Active Protection Systems 2019-2029
5.3.5 Asia Oceania Military & Aircraft Protection Systems Market Forecast, by Airborne Systems Type 2019-2029
5.3.6 Asia Oceania Military & Aircraft Protection Systems Market Forecast, by Country 2019-2029
5.3.7 China Military & Aircraft Protection Systems Market Forecast 2019-2029
5.3.8 India Military & Aircraft Protection Systems Market Forecast 2019-2029
5.3.9 Japan Military & Aircraft Protection Systems Market Forecast 2019-2029
5.3.10 South Korea Military & Aircraft Protection Systems Market Forecast 2019-2029
5.3.11 Rest of Asia Oceania Military & Aircraft Protection Systems Market Forecast 2019-2029
5.4 Middle East & Africa Military Vehicle & Aircraft Protection Systems Market forecast 2019-2029
5.4.1 MEA Military & Aircraft Protection Systems Market Forecast, by Systems Type 2019-2029
5.4.2 MEA Military & Aircraft Protection Systems Market Forecast, by Ground-Based Systems Segment 2019-2029
5.4.3 MEA Military & Aircraft Protection Systems Market Forecast, by Ground-Based Systems Type 2019-2029
5.4.4 MEA Military & Aircraft Protection Systems Market Forecast, by Active Protection Systems 2019-2029
5.4.5 MEA Military & Aircraft Protection Systems Market Forecast, by Airborne Systems Type 2019-2029
5.4.6 MEA Military & Aircraft Protection Systems Market Forecast, by Country 2019-2029
5.4.7 Israel Military & Aircraft Protection Systems Market Forecast 2019-2029
5.4.8 Saudi Arabia Military & Aircraft Protection Systems Market Forecast 2019-2029
5.4.9 South Africa Military & Aircraft Protection Systems Market Forecast 2019-2029
5.4.10 UAE Military & Aircraft Protection Systems Market Forecast 2019-2029
5.4.11 Rest of MEA Military & Aircraft Protection Systems Market Forecast 2019-2029
6. Company Profiles – Military Vehicle & Aircraft Protection Systems Market 2019-2029
6.1 Lockheed Martin Corporation
6.1.1 Lockheed Martin Corporation Total Company Sales 2014-2018
6.1.2 Lockheed Martin Corporation Sales by Segment of Business 2018
6.1.3 Lockheed Martin Corporation Sales by Geographical Location 2018
6.1.4 Lockheed Martin Recent Military Vehicle and Aircraft Protection Systems Related Contracts and Programmes (2015-2018)
6.1.5 Lockheed Martin Analysis
6.2 QinetiQ Group PLC
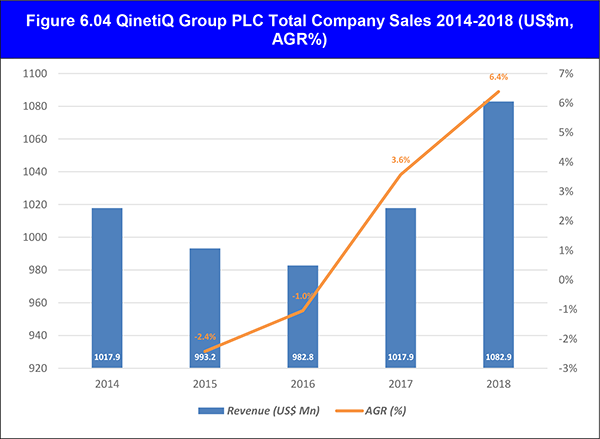
6.2.1 QinetiQ Group PLC Total Company Sales 2014-2018
6.2.2 QinetiQ Group PLC Sales by Segment of Region 2018
6.2.3 QinetiQ Group PLC Recent Military Vehicle and Aircraft Protection Systems Related Contracts and Programmes (2016-2018)
6.2.4 QinetiQ Group Plc Analysis
6.3 General Dynamics Corporation
6.3.1 General Dynamics Corporation Revenue 2015-2018
6.3.2 General Dynamics Corporation Sales Share (%) by Business Segment 2018
6.3.3 General Dynamics Corporation Sales Share by Geography 2018
6.3.4 General Dynamics Corporation Recent Military Vehicle and Aircraft Protection Systems Related Contracts and Programmes (2014-2019)
6.3.5 General Dynamics Corporation Analysis
6.4 BAE Systems PLC
6.4.1 BAE Systems PLC Total Company Sales 2014-2018
6.4.2 BAE Systems PLC Sales Share by Segment of Business 2018
6.4.3 BAE Systems PLC Regional Share
6.4.4 BAE Systems PLC Military Vehicle and Aircraft Protection Systems Selected Recent Contracts, Projects & Programmes 2011-2019
6.4.5 BAE Systems PLC Analysis
6.5 Harris Corporation
6.5.1 Harris Corporation Total Company Sales 2014-2018
6.5.2 Harris Corporation Sales Share by Segment of Business 2018
6.5.3 Harris Corporation Regional Emphasis
6.5.4 Harris Corporation Military Vehicle and Aircraft Protection Systems Selected Recent Contracts & Programmes 2016-2018
6.5.5 Harris Corporation Analysis
6.6 Leonardo SpA
6.6.1 Leonardo SpA Total Company Sales 2014-2018
6.6.2 Leonardo SpA Sales Share by Segment of Business 2017
6.6.3 Leonardo SpA Regional Emphasis
6.6.4 Leonardo SpA Military Vehicle and Aircraft Protection Systems Selected Recent Contracts & Programmes 2015-2019
6.6.5 Leonardo Spa Analysis
6.7 Northrop Grumman Corporation
6.7.1 Northrop Grumman Corporation Total Company Sales 2014-2018
6.7.2 Northrop Grumman Corporation Sales Share by Segment of Business 2018
6.7.3 Northrop Grumman Corporation Regional Emphasis
6.7.4 Northrop Grumman Corporation Military Vehicle and Aircraft Protection Systems Selected Recent Contracts, Projects & Programmes 2011-2019
6.7.5 Northrop Grumman Corporation Analysis
6.8 Rheinmetall AG
6.8.1 Rheinmetall AG Total Company Sales 2015-2018
6.8.2 Rheinmetall AG Sales Share by Segment of Business 2018 (%)
6.8.3 Rheinmetall AG Net Income / Loss 2015-2018
6.8.4 Rheinmetall AG Regional Share (%) 2018
6.8.5 Rheinmetall AG Military Vehicle and Aircraft Protection Systems Selected Recent Contracts & Programmes 2011-2018
6.8.6 Rheinmetall AG Analysis
6.9 Saab AB
6.9.1 Saab AB Total Company Sales 2014-2018
6.9.2 Saab AB Sales by Segment of Business Share 2018
6.9.3 Saab AB Regional Emphasis
6.9.4 Saab AB Military Vehicle and Aircraft Protection Systems Selected Recent Contracts & Programmes 2011-2018
6.9.5 Saab AB Analysis
6.10 Textron Inc
6.10.1 Textron Inc Total Company Sales 2014-2018
6.10.2 Textron Inc Sales by Segment of Business 2018 (%)
6.10.3 Textron Inc Regional Emphasis
6.10.4 Textron Inc Military Vehicle and Aircraft Protection Systems Selected Recent Contracts & Programmes 2011-2017
6.10.5 Textron Inc Analysis
6.11 Other companies Operating in the Global Military Vehicle & Aircraft Protection Systems Market 2019
7. Conclusions
7.1 Military Vehicle & Aircraft Protection Systems Market 2019-2029
7.2 Military Vehicle & Aircraft Protection Systems Market Key Drivers and Restraints
7.3 Strategic Recommendations
8. Glossary
Associated Visiongain Reports
Visiongain Report Sales Order Form
Appendix A
About Visiongain
Appendix B
Visiongain Report Evaluation Form
List of Figures
Figure 3.01: Global Military Vehicle and Aircraft Protection Systems Market Forecast 2019-2029 (US$ Mn, AGR %)
Figure 4.01: Global Military Vehicle and Aircraft Protection Systems Market AGR Forecast by Systems Type 2019-2029 (AGR %)
Figure 4.02: Global Military Vehicle and Aircraft Protection Systems Submarket Forecast by Systems Type 2019-2029 (Revenue US$Mn)
Figure 4.03: Global Military Vehicle and Aircraft Protection Systems Market Share Forecast by Systems Type 2019 (% Share)
Figure 4.04: Global Military Vehicle and Aircraft Protection Systems Market Share Forecast by Systems Type 2024 (% Share)
Figure 4.05: Global Military Vehicle and Aircraft Protection Systems Submarket Share Forecast by Systems Type 2029 (% Share)
Figure 4.06: Global Military Vehicle and Aircraft Protection Systems Market Forecast 2019-2029 (US$ Mn), By Ground Based Systems Segment
Figure 4.07: Global Military Vehicle and Aircraft Protection Systems Submarket Forecast by Ground Based Systems Type 2019-2029 (Revenue US$Mn)
Figure 4.08: Global Military Vehicle and Aircraft Protection Systems Market Share Forecast by Ground Based Systems Type 2019 (% Share)
Figure 4.09: Global Military Vehicle and Aircraft Protection Systems Market Share Forecast by Ground Based Systems Type 2029 (% Share)
Figure 4.10: Global Military Vehicle and Aircraft Protection Systems Market Forecast 2019-2029 (US$ Mn), By Active Protection Systems
Figure 4.11: Global Military Vehicle and Aircraft Protection Systems Market AGR Forecast by Active Protection Systems 2019-2029 (AGR %)
Figure 4.12: Global Military Vehicle and Aircraft Protection Systems Submarket Forecast by Active Protection Systems 2019-2029 (Revenue US$Mn)
Figure 4.13: Global Military Vehicle and Aircraft Protection Systems Market Share Forecast by Active Protection Systems 2019 (% Share)
Figure 4.14: Global Military Vehicle and Aircraft Protection Systems Market Share Forecast by Active Protection Systems 2029 (% Share)
Figure 4.15: Global Military Vehicle and Aircraft Protection Systems Market Forecast 2019-2029 (US$ Mn), By Passive Protection Systems
Figure 4.16: Global Military Vehicle and Aircraft Protection Systems Market Forecast 2019-2029 (US$ Mn), By Airborne Systems Segment
Figure 4.17: Global Military Vehicle and Aircraft Protection Systems Market AGR Forecast by Airborne Systems Type 2019-2029 (AGR %)
Figure 4.18: Global Military Vehicle and Aircraft Protection Systems Submarket Forecast by Airborne Systems Type 2019-2029 (Revenue US$Mn)
Figure 4.19: Global Military Vehicle and Aircraft Protection Systems Market Share Forecast by Airborne Systems Type 2019 (% Share)
Figure 4.20: Global Military Vehicle and Aircraft Protection Systems Market Share Forecast by Airborne Systems Type 2029 (% Share)
Figure 4.21: Global Military Vehicle and Aircraft Protection Systems Market Forecast 2019-2029 (US$ Mn), By Cockpit Protection
Figure 4.22: Global Military Vehicle and Aircraft Protection Systems Market Forecast 2019-2029 (US$ Mn), By Floor Protection
Figure 4.23: Global Military Vehicle and Aircraft Protection Systems Market Forecast 2019-2029 (US$ Mn), By Exterior Protection
Figure 5.01: Global Military Vehicle and Aircraft Protection Systems Market Forecast by Geography 2019-2029
Figure 5.02: Global Military Vehicle and Aircraft Protection Systems Market AGR Forecast by Geography 2019-2029 (AGR %)
Figure 5.03: Global Military Vehicle and Aircraft Protection Systems Market Share Forecast by Geography 2019 (% Share)
Figure 5.04: Global Military Vehicle and Aircraft Protection Systems Market Share Forecast by Geography 2029 (% Share)
Figure 5.05: The Americas Military Vehicle and Aircraft Protection Systems Market Forecast, By Systems Type, 2019-2029 (Revenue US$Mn)
Figure 5.06: The Americas Military Vehicle and Aircraft Protection Systems Market Share, By Systems Type, 2019 (% Share)
Figure 5.07: The Americas Military Vehicle and Aircraft Protection Systems Market Share, By Systems Type, 2029 (% Share)
Figure 5.08: The Americas Military Vehicle and Aircraft Protection Systems Market Forecast 2019-2029 (US$ Mn), By Ground Based Systems Segment
Figure 5.09: The Americas Military Vehicle and Aircraft Protection Systems Market Share Forecast by Ground Based Systems Type 2019 (% Share)
Figure 5.10: The Americas Military Vehicle and Aircraft Protection Systems Market Share Forecast by Ground Based Systems Type 2029 (% Share)
Figure 5.11: The Americas Military Vehicle and Aircraft Protection Systems Market AGR Forecast by Active Protection Systems 2019-2029 (AGR %)
Figure 5.12: The Americas Military Vehicle and Aircraft Protection Systems Submarket Forecast by Active Protection Systems 2019-2029 (Revenue US$Mn)
Figure 5.13: The Americas Military Vehicle and Aircraft Protection Systems Market Share Forecast by Active Protection Systems 2019 (% Share)
Figure 5.14: The Americas Military Vehicle and Aircraft Protection Systems Market Share Forecast by Active Protection Systems 2029 (% Share)
Figure 5.15: The Americas Military Vehicle and Aircraft Protection Systems Market AGR Forecast by Airborne Systems Type 2019-2029 (AGR %)
Figure 5.16: The Americas Military Vehicle and Aircraft Protection Systems Submarket Forecast by Airborne Systems Type 2019-2029 (Revenue US$Mn)
Figure 5.17: The Americas Military Vehicle and Aircraft Protection Systems Market Share Forecast by Airborne Systems Type 2019 (% Share)
Figure 5.18: The Americas Military Vehicle and Aircraft Protection Systems Market Share Forecast by Airborne Systems Type 2029 (% Share)
Figure 5.19: The Americas Military Vehicle and Aircraft Protection Systems Market Forecast, By Country, 2019-2029 (Revenue US$Mn)
Figure 5.20: The Americas Military Vehicle and Aircraft Protection Systems Market Share, By Country, 2019 (% Share)
Figure 5.21: The Americas Military Vehicle and Aircraft Protection Systems Market Share, By Country, 2029 (% Share)
Figure 5.22: U.S. Military Vehicle and Aircraft Protection Systems Market Forecast 2019-2029 (US$ Mn)
Figure 5.23: Canada Military Vehicle and Aircraft Protection Systems Market Forecast 2019-2029 (US$ Mn)
Figure 5.24: Mexico Military Vehicle and Aircraft Protection Systems Market Forecast 2019-2029 (US$ Mn)
Figure 5.25: Brazil Military Vehicle and Aircraft Protection Systems Market Forecast 2019-2029 (US$ Mn)
Figure 5.26: Rest of The Americas Military Vehicle and Aircraft Protection Systems Market Forecast 2019-2029 (US$ Mn)
Figure 5.27: Europe Ground Based Systems and Aircraft Protection Systems Market Forecast, By Systems Type, 2019-2029 (Revenue US$Mn)
Figure 5.28: Europe Ground Based Systems and Aircraft Protection Systems Market Share, By Systems Type, 2019 (% Share)
Figure 5.29: Europe Ground Based Systems and Aircraft Protection Systems Market Share, By Systems Type, 2029 (% Share)
Figure 5.30: Europe Ground Based Systems and Aircraft Protection Systems Market Forecast 2019-2029 (US$ Mn), By Ground Based Systems Segment
Figure 5.31: Europe Ground Based Systems and Aircraft Protection Systems Market Share Forecast by Ground Based Systems Type 2019 (% Share)
Figure 5.32: Europe Ground Based Systems and Aircraft Protection Systems Market Share Forecast by Ground Based Systems Type 2029 (% Share)
Figure 5.33: Europe Ground Based Systems and Aircraft Protection Systems Market AGR Forecast by Active Protection Systems 2019-2029 (AGR %)
Figure 5.34: Europe Ground Based Systems and Aircraft Protection Systems Submarket Forecast by Active Protection Systems 2019-2029 (Revenue US$Mn)
Figure 5.35: Europe Ground Based Systems and Aircraft Protection Systems Market Share Forecast by Active Protection Systems 2019 (% Share)
Figure 5.36: Europe Ground Based Systems and Aircraft Protection Systems Market Share Forecast by Active Protection Systems 2029 (% Share)
Figure 5.37: Europe Ground Based Systems and Aircraft Protection Systems Market AGR Forecast by Airborne Systems Type 2019-2029 (AGR %)
Figure 5.38: Europe Ground Based Systems and Aircraft Protection Systems Submarket Forecast by Airborne Systems Type 2019-2029 (Revenue US$Mn)
Figure 5.39: Europe Ground Based Systems and Aircraft Protection Systems Market Share Forecast by Airborne Systems Type 2019 (% Share)
Figure 5.40: Europe Ground Based Systems and Aircraft Protection Systems Market Share Forecast by Airborne Systems Type 2029 (% Share)
Figure 5.41: Europe Military Vehicle and Aircraft Protection Systems Market Forecast, By Country, 2019-2029 (Revenue US$Mn)
Figure 5.42: Europe Military Vehicle and Aircraft Protection Systems Market Share, By Country, 2019 (% Share)
Figure 5.43: Europe Military Vehicle and Aircraft Protection Systems Market Share, By Country, 2029 (% Share)
Figure 5.44: Germany Military Vehicle and Aircraft Protection Systems Market Forecast 2019-2029 (US$ Mn)
Figure 5.45: France Military Vehicle and Aircraft Protection Systems Market Forecast 2019-2029 (US$ Mn)
Figure 5.46: UK Military Vehicle and Aircraft Protection Systems Market Forecast 2019-2029 (US$ Mn)
Figure 5.47: Russia Military Vehicle and Aircraft Protection Systems Market Forecast 2019-2029 (US$ Mn)
Figure 5.48: Rest of Europe Military Vehicle and Aircraft Protection Systems Market Forecast 2019-2029 (US$ Mn)
Figure 5.49: Asia Oceania Ground Based Systems and Aircraft Protection Systems Market Forecast, By Systems Type, 2019-2029 (Revenue US$Mn)
Figure 5.50: Asia Oceania Ground Based Systems and Aircraft Protection Systems Market Share, By Systems Type, 2019 (% Share)
Figure 5.51: Asia Oceania Ground Based Systems and Aircraft Protection Systems Market Share, By Systems Type, 2029 (% Share)
Figure 5.52: Asia Oceania Ground Based Systems and Aircraft Protection Systems Market Forecast 2019-2029 (US$ Mn), By Ground Based Systems Segment
Figure 5.53: Asia Oceania Ground Based Systems and Aircraft Protection Systems Market Share Forecast by Ground Based Systems Type 2019 (% Share)
Figure 5.54: Asia Oceania Ground Based Systems and Aircraft Protection Systems Market Share Forecast by Ground Based Systems Type 2029 (% Share)
Figure 5.55: Asia Oceania Ground Based Systems and Aircraft Protection Systems Market AGR Forecast by Active Protection Systems 2019-2029 (AGR %)
Figure 5.56: Asia Oceania Ground Based Systems and Aircraft Protection Systems Submarket Forecast by Active Protection Systems 2019-2029 (Revenue US$Mn)
Figure 5.57: Asia Oceania Ground Based Systems and Aircraft Protection Systems Market Share Forecast by Active Protection Systems 2019 (% Share)
Figure 5.58: Asia Oceania Ground Based Systems and Aircraft Protection Systems Market Share Forecast by Active Protection Systems 2029 (% Share)
Figure 5.59: Asia Oceania Ground Based Systems and Aircraft Protection Systems Market AGR Forecast by Airborne Systems Type 2019-2029 (AGR %)
Figure 5.60: Asia Oceania Ground Based Systems and Aircraft Protection Systems Submarket Forecast by Airborne Systems Type 2019-2029 (Revenue US$Mn)
Figure 5.61: Asia Oceania Ground Based Systems and Aircraft Protection Systems Market Share Forecast by Airborne Systems Type 2019 (% Share)
Figure 5.62: Asia Oceania Ground Based Systems and Aircraft Protection Systems Market Share Forecast by Airborne Systems Type 2029 (% Share)
Figure 5.63: Asia Oceania Military Vehicle and Aircraft Protection Systems Market Forecast, By Country, 2019-2029 (Revenue US$Mn)
Figure 5.64: Asia Oceania Military Vehicle and Aircraft Protection Systems Market Share, By Country, 2019 (% Share)
Figure 5.65: Asia Oceania Military Vehicle and Aircraft Protection Systems Market Share, By Country, 2029 (% Share)
Figure 5.66: China Military Vehicle and Aircraft Protection Systems Market Forecast 2019-2029 (US$ Mn)
Figure 5.67: India Military Vehicle and Aircraft Protection Systems Market Forecast 2019-2029 (US$ Mn)
Figure 5.68: Japan Military Vehicle and Aircraft Protection Systems Market Forecast 2019-2029 (US$ Mn)
Figure 5.69: South Korea Military Vehicle and Aircraft Protection Systems Market Forecast 2019-2029 (US$ Mn)
Figure 5.70: Rest of Asia Oceania Military Vehicle and Aircraft Protection Systems Market Forecast 2019-2029 (US$ Mn)
Figure 5.71: MEA Ground Based Systems and Aircraft Protection Systems Market Forecast, By Systems Type, 2019-2029 (Revenue US$Mn)
Figure 5.72: MEA Ground Based Systems and Aircraft Protection Systems Market Share, By Systems Type, 2019 (% Share)
Figure 5.73: MEA Ground Based Systems and Aircraft Protection Systems Market Share, By Systems Type, 2029 (% Share)
Figure 5.74: MEA Ground Based Systems and Aircraft Protection Systems Market Forecast 2019-2029 (US$ Mn), By Ground Based Systems Segment
Figure 5.75: MEA Ground Based Systems and Aircraft Protection Systems Market Share Forecast by Ground Based Systems Type 2019 (% Share)
Figure 5.76: MEA Ground Based Systems and Aircraft Protection Systems Market Share Forecast by Ground Based Systems Type 2029 (% Share)
Figure 5.77: MEA Ground Based Systems and Aircraft Protection Systems Market AGR Forecast by Active Protection Systems 2019-2029 (AGR %)
Figure 5.78: MEA Ground Based Systems and Aircraft Protection Systems Submarket Forecast by Active Protection Systems 2019-2029 (Revenue US$Mn)
Figure 5.79: MEA Ground Based Systems and Aircraft Protection Systems Market Share Forecast by Active Protection Systems 2019 (% Share)
Figure 5.80: MEA Ground Based Systems and Aircraft Protection Systems Market Share Forecast by Active Protection Systems 2029 (% Share)
Figure 5.81: MEA Ground Based Systems and Aircraft Protection Systems Market AGR Forecast by Airborne Systems Type 2019-2029 (AGR %)
Figure 5.82: MEA Ground Based Systems and Aircraft Protection Systems Submarket Forecast by Airborne Systems Type 2019-2029 (Revenue US$Mn)
Figure 5.83: MEA Ground Based Systems and Aircraft Protection Systems Market Share Forecast by Airborne Systems Type 2019 (% Share)
Figure 5.84: MEA Ground Based Systems and Aircraft Protection Systems Market Share Forecast by Airborne Systems Type 2029 (% Share)
Figure 5.85: MEA Military Vehicle and Aircraft Protection Systems Market Forecast, By Country, 2019-2029 (Revenue US$Mn)
Figure 5.86: MEA Military Vehicle and Aircraft Protection Systems Market Share, By Country, 2019 (% Share)
Figure 5.87: MEA Military Vehicle and Aircraft Protection Systems Market Share, By Country, 2029 (% Share)
Figure 5.88: Israel Military Vehicle and Aircraft Protection Systems Market Forecast 2019-2029 (US$ Mn)
Figure 5.89: Saudi Arabia Military Vehicle and Aircraft Protection Systems Market Forecast 2019-2029 (US$ Mn)
Figure 5.90: South Africa Military Vehicle and Aircraft Protection Systems Market Forecast 2019-2029 (US$ Mn)
Figure 5.91: UAE Military Vehicle and Aircraft Protection Systems Market Forecast 2019-2029 (US$ Mn)
Figure 5.92: Rest of MEA Military Vehicle and Aircraft Protection Systems Market Forecast 2019-2029 (US$ Mn)
Figure 6.1 Lockheed Martin Corporation Total Company Sales 2014-2018 (US$m, AGR%)
Figure 6.2 Lockheed Martin Corporation Sales by Segment of Business, 2018
Figure 6.3 Lockheed Martin Corporation Sales by Geographical Location, 2018
Figure 6.4 QinetiQ Group PLC Total Company Sales 2014-2018 (US$m, AGR%)
Figure 6.5 QinetiQ Group PLC Sales by Segment of Region, 2018
Figure 6.6 General Dynamics Corporation Revenue (US$ Mn) 2015 - 2018
Figure 6.7 General Dynamics Corporation Revenues Share by Business Segment 2018
Figure 6.8 General Dynamics Corporation Revenue Share by Geography 2018
Figure 6.9 BAE Systems PLC Sales Share by Business Segment 2018
Figure 6.10 BAE Systems PLC Sales Share by Geographical Location 2018
Figure 6.11 Harris Corporation Sales Share by Segment of Business 2018(Market Share)
Figure 6.12 Harris Corporation Sales Share by Geographical Location 2018 (% share)
Figure 6.13 Leonardo SpA Sales by Segment of Business, 2018 (%)
Figure 6.14 Leonardo SpA Sales Share by Geographical Location 2018
Figure 6.15 Northrop Grumman Corporation Sales Share by Segment of Business 2018
Figure 6.16 Northrop Grumman Corporation Sales Share by Geographical Location 2018
Figure 6.17 Rheinmetall AG Total Company Sales 2015-2018 (US$m, AGR%)
Figure 6.18 Rheinmetall AG Sales Share by Segment of Business 2018 (%)
Figure 6.19 Rheinmetall AG Net Income / Loss 2015-2018 (US$m, AGR%)
Figure 6.20 Rheinmetall AG Regional Share (%) 2018
Figure 6.21 Saab AB Total Company Sales 2014-2018 (US$m, AGR%)
Figure 6.22 Saab AB Sales by Segment of Business Share, 2018
Figure 6.23 Saab AB Primary International Operations 2018
Figure 6.24 Saab AB Sales by Geographical Location, 2018 (%)
Figure 6.25 Textron Inc Total Company Sales 2014-2018 (US$m, AGR%)
Figure 6.26 Textron Inc Sales by Segment of Business, 2018 (%)
Figure 6.27 Textron Inc Primary International Operations 2019
List of Tables
Table 3.01: Global Military Vehicle and Aircraft Protection Systems Market Forecast 2019-2029 (US$ Mn, AGR %, CAGR %, Cumulative)
Table 4.01: Global Military Vehicle and Aircraft Protection Systems Submarket Forecast by Systems Type, 2019-2029 (US$ Mn, AGR %, CAGR %)
Table 4.02: Global Military Vehicle and Aircraft Protection Systems Market Forecast 2019-2029 (US$ Mn, AGR %, CAGR %, Cumulative), By Ground Based Systems Segment
Table 4.03: Global Military Vehicle and Aircraft Protection Systems Submarket Forecast by Ground Based Systems Type, 2019-2029 (US$ Mn, AGR %, CAGR %)
Table 4.04: Global Military Vehicle and Aircraft Protection Systems Market Forecast 2019-2029 (US$ Mn, AGR %, CAGR %), By Active Protection Systems
Table 4.05: Global Military Vehicle and Aircraft Protection Systems Submarket Forecast by Active Protection Systems, 2019-2029 (US$ Mn, AGR %, CAGR %)
Table 4.06: Global Military Vehicle and Aircraft Protection Systems Market Forecast 2019-2029 (US$ Mn, AGR %, CAGR %), By Passive Protection
Table 4.07: Global Military Vehicle and Aircraft Protection Systems Market Forecast 2019-2029 (US$ Mn, AGR %, CAGR %), By Airborne Systems Segment
Table 4.08: Global Military Vehicle and Aircraft Protection Systems Submarket Forecast by Airborne Systems Type, 2019-2029 (US$ Mn, AGR %, CAGR %)
Table 4.09: Global Military Vehicle and Aircraft Protection Systems Market Forecast 2019-2029 (US$ Mn, AGR %, CAGR %), By Cockpit Protection
Table 4.10: Global Military Vehicle and Aircraft Protection Systems Market Forecast 2019-2029 (US$ Mn, AGR %, CAGR %), By Floor Protection
Table 4.11: Global Military Vehicle and Aircraft Protection Systems Market Forecast 2019-2029 (US$ Mn, AGR %, CAGR %), By Exterior Protection
Table 5.01: Global Military Vehicle and Aircraft Protection Systems Market Forecast by Geography 2019-2029 (US$ Mn, AGR %, CAGR %)
Table 5.02: The Americas Military Vehicle and Aircraft Protection Systems Market Forecast, By Systems Type, 2019-2029 (US$ Mn, AGR %, CAGR %)
Table 5.03: The Americas Military Vehicle and Aircraft Protection Systems Market Forecast 2019-2029 (US$ Mn, AGR %, CAGR %, Cumulative), By Ground Based Systems Segment
Table 5.04: The Americas Military Vehicle and Aircraft Protection Systems Submarket Forecast by Ground Based Systems Type, 2019-2029 (US$ Mn, AGR %, CAGR %)
Table 5.05: The Americas Military Vehicle and Aircraft Protection Systems Submarket Forecast by Active Protection Systems, 2019-2029 (US$ Mn, AGR %, CAGR %)
Table 5.06: The Americas Military Vehicle and Aircraft Protection Systems Submarket Forecast by Airborne Systems Type, 2019-2029 (US$ Mn, AGR %, CAGR %)
Table 5.07: The Americas Military Vehicle and Aircraft Protection Systems Market Forecast, By Country, 2019-2029 (US$ Mn, AGR %, CAGR %)
Table 5.08: U.S. Military Vehicle and Aircraft Protection Systems Market Forecast 2019-2029 (US$ Mn, AGR %, CAGR %)
Table 5.09: Canada Military Vehicle and Aircraft Protection Systems Market Forecast 2019-2029 (US$ Mn, AGR %, CAGR %)
Table 5.10: Mexico Military Vehicle and Aircraft Protection Systems Market Forecast 2019-2029 (US$ Mn, AGR %, CAGR %)
Table 5.11: Brazil Military Vehicle and Aircraft Protection Systems Market Forecast 2019-2029 (US$ Mn, AGR %, CAGR %)
Table 5.12: Rest of The Americas Military Vehicle and Aircraft Protection Systems Market Forecast 2019-2029 (US$ Mn, AGR %, CAGR %)
Table 5.13: Europe Ground Based Systems and Aircraft Protection Systems Market Forecast, By Systems Type, 2019-2029 (US$ Mn, AGR %, CAGR %)
Table 5.14: Europe Ground Based Systems and Aircraft Protection Systems Market Forecast 2019-2029 (US$ Mn, AGR %, CAGR %, Cumulative), By Ground Based Systems Segment
Table 5.15: Europe Ground Based Systems and Aircraft Protection Systems Submarket Forecast by Ground Based Systems Type, 2019-2029 (US$ Mn, AGR %, CAGR %)
Table 5.16: Europe Ground Based Systems and Aircraft Protection Systems Submarket Forecast by Active Protection Systems, 2019-2029 (US$ Mn, AGR %, CAGR %)
Table 5.17: Europe Ground Based Systems and Aircraft Protection Systems Submarket Forecast by Airborne Systems Type, 2019-2029 (US$ Mn, AGR %, CAGR %)
Table 5.18: Europe Military Vehicle and Aircraft Protection Systems Market Forecast, By Country, 2019-2029 (US$ Mn, AGR %, CAGR %)
Table 5.19: Germany Military Vehicle and Aircraft Protection Systems Market Forecast 2019-2029 (US$ Mn, AGR %, CAGR %)
Table 5.20: France Military Vehicle and Aircraft Protection Systems Market Forecast 2019-2029 (US$ Mn, AGR %, CAGR %),
Table 5.21: U.K. Military Vehicle and Aircraft Protection Systems Market Forecast 2019-2029 (US$ Mn, AGR %, CAGR %)
Table 5.22: Russia Military Vehicle and Aircraft Protection Systems Market Forecast 2019-2029 (US$ Mn, AGR %, CAGR %)
Table 5.23: Rest of Europe Military Vehicle and Aircraft Protection Systems Market Forecast 2019-2029 (US$ Mn, AGR %, CAGR %)
Table 5.24: Asia Oceania Ground Based Systems and Aircraft Protection Systems Market Forecast, By Systems Type, 2019-2029 (US$ Mn, AGR %, CAGR %)
Table 5.25: Asia Oceania Ground Based Systems and Aircraft Protection Systems Market Forecast 2019-2029 (US$ Mn, AGR %, CAGR %, Cumulative), By Ground Based Systems Segment
Table 5.26: Asia Oceania Ground Based Systems and Aircraft Protection Systems Submarket Forecast by Ground Based Systems Type, 2019-2029 (US$ Mn, AGR %, CAGR %)
Table 5.27: Asia Oceania Ground Based Systems and Aircraft Protection Systems Submarket Forecast by Active Protection Systems, 2019-2029 (US$ Mn, AGR %, CAGR %)
Table 5.28: Asia Oceania Ground Based Systems and Aircraft Protection Systems Submarket Forecast by Airborne Systems Type, 2019-2029 (US$ Mn, AGR %, CAGR %)
Table 5.29: Asia Oceania Military Vehicle and Aircraft Protection Systems Market Forecast, By Country, 2019-2029 (US$ Mn, AGR %, CAGR %)
Table 5.30: China Military Vehicle and Aircraft Protection Systems Market Forecast 2019-2029 (US$ Mn, AGR %, CAGR %)
Table 5.31: India Military Vehicle and Aircraft Protection Systems Market Forecast 2019-2029 (US$ Mn, AGR %, CAGR %)
Table 5.32: Japan Military Vehicle and Aircraft Protection Systems Market Forecast 2019-2029 (US$ Mn, AGR %, CAGR %)
Table 5.33: South Korea Military Vehicle and Aircraft Protection Systems Market Forecast 2019-2029 (US$ Mn, AGR %, CAGR %)
Table 5.34: Rest of Asia Oceania Military Vehicle and Aircraft Protection Systems Market Forecast 2019-2029 (US$ Mn, AGR %, CAGR %)
Table 5.35: MEA Ground Based Systems and Aircraft Protection Systems Market Forecast, By Systems Type, 2019-2029 (US$ Mn, AGR %, CAGR %)
Table 5.36: MEA Ground Based Systems and Aircraft Protection Systems Market Forecast 2019-2029 (US$ Mn, AGR %, CAGR %, Cumulative), By Ground Based Systems Segment
Table 5.37: MEA Ground Based Systems and Aircraft Protection Systems Submarket Forecast by Ground Based Systems Type, 2019-2029 (US$ Mn, AGR %, CAGR %)
Table 5.38: MEA Ground Based Systems and Aircraft Protection Systems Submarket Forecast by Active Protection Systems, 2019-2029 (US$ Mn, AGR %, CAGR %)
Table 5.39: MEA Ground Based Systems and Aircraft Protection Systems Submarket Forecast by Airborne Systems Type, 2019-2029 (US$ Mn, AGR %, CAGR %)
Table 5.40: MEA Military Vehicle and Aircraft Protection Systems Market Forecast, By Country, 2019-2029 (US$ Mn, AGR %, CAGR %)
Table 5.41: Israel Military Vehicle and Aircraft Protection Systems Market Forecast 2019-2029 (US$ Mn, AGR %, CAGR %)
Table 5.42: Saudi Arabia Military Vehicle and Aircraft Protection Systems Market Forecast 2019-2029 (US$ Mn, AGR %, CAGR %)
Table 5.43: South Africa Military Vehicle and Aircraft Protection Systems Market Forecast 2019-2029 (US$ Mn, AGR %, CAGR %)
Table 5.44: UAE Military Vehicle and Aircraft Protection Systems Market Forecast 2019-2029 (US$ Mn, AGR %, CAGR %)
Table 5.45: Rest of MEA Military Vehicle and Aircraft Protection Systems Market Forecast 2019-2029 (US$ Mn, AGR %, CAGR %)
Table 6.01: Lockheed Martin Corporation Profile 2018 (CEO, Total Company Sales US$m, Strongest Business Region, HQ, Founded, No. of Employees, Website)
Table 6.02 Lockheed Martin Corporation Total Company Sales 2014-2018 (US$m, AGR%)
Table 6.03: Lockheed Martin Recent Military Vehicle and Aircraft Protection Systems Related Contracts and Programmes
Table 6.04: QinetiQ Group PLC Profile 2018 (CEO, Total Company Sales US$m, Strongest Business Region, Founded, No. of Employees, Website)
Table 6.05: QinetiQ Group PLC Recent Military Vehicle and Aircraft Protection Systems Related Contracts and Programmes
Table 6.06: General Dynamics Corporation 2018 (CEO, Total Company Sales US$m, Strongest Business Region, HQ, Founded, No. of Employees 2018, Website)
Table 6.07: General Dynamics Corporation Recent Military Vehicle and Aircraft Protection Related Contracts and Programmes
Table 6.08 BAE Systems PLC Profile 2018 (CEO, Total Company Sales US$m, Net Income US$m, Strongest Business Region, HQ, Founded, No. of Employees, IR Contact, Ticker, Website)
Table 6.09 BAE Systems PLC Total Company Sales 2014-2018 (US$m, AGR%)
Table 6.10 Selected Recent BAE Systems PLC Military Vehicle and Aircraft Protection Systems Contracts / Projects / Programmes 2007-2018 (Date, Country, Value US$m, Product, Details)
Table 6.11 Harris Corporation Profile 2018 (CEO, Total Company Sales US$m, Net Income US$m, Strongest Business Region, Submarket Involvement, HQ, Founded, No. of Employees, IR Contact, Ticker, Website)
Table 6.12 Harris Corporation Total Company Sales 2014-2018 (US$m, AGR %)
Table 6.13 Selected Recent Harris Corporation Military Vehicle and Aircraft Protection Systems Contracts & Programmes 2016-2018 (Date, Country, Value US$m, Product & Details)
Table 6.14 Leonardo SpA Profile 2018 (CEO, Total Company Sales US$m, Net Income / Loss US$m, Order Backlog US$m, Strongest Business Region, Submarket Involvement, HQ, Founded, No. of Employees, IR Contact, Ticker, Website)
Table 6.15 Leonardo SpA Total Company Sales 2014-2018 (US$m, AGR %)
Table 6.16 Selected Recent Leonardo SpA Military Vehicle and Aircraft Protection Systems Contracts & Programmes 2015-2019 (Date, Country, Value US$m, Product & Details)
Table 6.17 Northrop Grumman Corporation Profile 2018 (CEO, Total Company Sales US$m, Net Income US$m, Order Backlog US$m, Strongest Business Region, Submarket Involvement, HQ, Founded, No. of Employees, IR Contact, Ticker, Website)
Table 6.18 Northrop Grumman Corporation Total Company Sales 2014-2018 (US$m, AGR %)
Table 6.19 Selected Recent Northrop Grumman Corporation Military Vehicle and Aircraft Protection Systems Contracts / Projects / Programmes 2011-2019 (Date, Country, Value US$m, Product, Details)
Table 6.20 Rheinmetall AG Profile 2018 (CEO, Total Company Sales US$m, Strongest Business Region, Business Segment in the Market, Submarket Involvement, HQ, Founded, No. of Employees, Website)
Table 6.21 Rheinmetall AG Total Company Sales 2014-2017 (US$m, AGR%)
Table 6.22 Rheinmetall AG Net Income / Loss 2015-2018 (US$m, AGR%)
Table 6.23Selected Recent Rheinmetall AG Military Vehicle and Aircraft Protection Systems Contracts & Programmes (Date, Product & Details)
Table 6.24 Saab AB Profile 2018 (CEO, Total Company Sales US$m, Strongest Business Region, Business Segment in the Market, Submarket Involvement, HQ, Founded, No. of Employees, IR Contact, Ticker, Website)
Table 6.25 Saab AB Total Company Sales 2014-2018 (US$m, AGR%)
Table 6.26 Selected Recent Saab AB Border Security Contracts & Programmes 2011-2018 (Date, Country, Value US$m, Product & Details)
Table 6.27 Textron Inc Profile 2018 (CEO, Total Company Sales US$m, Net Income US$m, Strongest Business Region, Business Segment in the Market, Submarket Involvement, HQ, Founded, No. of Employees, IR Contact, Ticker, Website)
Table 6.28 Textron Inc Total Company Sales 2014-2018 (US$m, AGR%)
Table 6.29 Selected Recent Textron Inc Military Vehicle and Aircraft Protection Systems Contracts & Programmes 2011-2017 (Date, Country, Value US$m, Product & Details)
Table 6.30: Other Companies in the Market (Company Name)
Aequis
Aerostructures Assemblies India
Afghanistan National Army (ANA)
Airbus
Artec
Astronics Corporation
ATK
Australian Department of Defense
Australian Government
Aviation Technical Services
AVIC
BAE Systems.
Bell Helicopter Textron
Boeing
Bombardier
Brazilian Government
Brighton University
British Army
CAC
Canadian Army
Canadian Government
Cessna
Chinese Army
Chinese Government
CIO consortium
CMC Electronics Inc
Cobham PLC
Comtech Telecommunications
CPI
Curtiss Wright
Daimler Trucks North America
Danish Defense Acquisition and Logistic Organization (DALO)
Dassault
Dassault Aviation
Defense Advanced Research Projects Agency (DARPA)
Defense Science and Technology Laboratory
Delphi
Department of Homeland Security
Donaldson Aerospace & Defense
DRS Technologies
DSM Dyneema
EDAC
Elettronica SpA
Embraer SA
ESSA Technology
ESSCO
European Organization for Joint Armament Cooperation (OCCAR)
Fds Italy Srl
Federal Office of Bundeswehr Equipment, Information Technology and In-Service Support
FedEx
Finmeccanica
Flir Systems (Raymarine)
FMS Enterprises Migun Ltd
Frazer-Nash
French Army
Fuji Heavy Industries
General Dynamics Corporation
General Dynamics European Land Systems (GDELS)
General Dynamics UK
German Air Force
German Bundeswehr
German Government
Greenbriar Equity Group
Gulfstream Aerospace
Harbin Topfrp Composite Co., Ltd (HTC)
Harris Corporation
Helicopters of Russia
Hindustan Aeronautics Limited (HAL)
HTC
IDF
Indian Army
Indonesian Ministry of Defense
Infinite Technologies
Israel Aerospace Industries Ltd (IAI)
Italian Ministry of Defense
ITT Corporation
Iveco Defense Systems
Jenoptik
Kaman Aerospace Group
Kärcher Futuretech
Kelvin Hughes
Kitron
Kitsap Composites
Kongsberg
Krauss-Maffei Wegmann
L3 Technologies
Leidos
Leonardo DRS, Inc.
Leonardo SpA
Lithuanian Ministry of Defense
Lockheed Martin
Lufthansa Technik
Marshall Aerospace
MBDA
Meggitt PLC
Mexican Government
MillenWorks
Mitsubishi Heavy Industries
NASA
NATO
NORDAM
Norinco
Northrop Grumman Corporation
OptaSense
Orbitall ATK
Oshkosh Defense
OTO Melara
Pacific Radomes Inc.
Panavia Aircraft GmbH
Patria Oyj
Peruvian Marines
Peruvian Ministry of Defense
Pilatus
Plasan
Pratt & Whitney Canada
QinetiQ.,
RADA Electronic Industries Ltd
Rafael Advanced Defense Systems Ltd.
Rheinmetall Active Protection GmbH
Rheinmetall AG
Rheinmetall Ballistic Protection GmbH
Rheinmetall Chempro GmbH
Rheinmetall Defence
Rheinmetall Defense Australia
Rheinmetall MAN Military Vehicles Netherlands
Rheinmetall Waffe Munition GmbH
Roke Manor Research
Romanian Military Vehicle System
Rostec
Royal DSM
Royal Engineered Composites
Royal Netherlands Army
RUAG Aviation
Russian Aircraft Corporation MiG (RSK MiG)
Saab AB
Saab Grintek Technologies Ltd.
Saint-Gobain
SCISYS
Sheergard
Sikorsky
Singapore Technologies Aerospace Ltd (ST Aerospace)
South Korean Army
South Korean Government
Starwin Industries
Sukhoi
Supacat
Supacat Asia Pacific
Swedish Navy
Syrian Government
Tencate
TenCate Advanced Armour
TenCate Advanced Composites
Textron Inc.
Textron Marine & Land Systems (TM&LS)
Textron Systems
Thales
U.S. Air Force
U.S. Army
U.S. Army Contracting Command
U.S. Army Tank Automotive Research Development, and Engineering Center. (TARDEC)
U.S. Marine Corps
UK Ministry of Defense (MoD)
Ultra Electronics
UPS
US Army Tank Automotive and Armaments Command (TACOM)
US Department of Defense (DoD)
US Government
US Marine Corps
US Office of Naval Research
Verdant
Vermont Composites Inc.
Vitrociset
Download sample pages
Complete the form below to download your free sample pages for Military Vehicle & Aircraft Protection Systems Market Report 2019-2029
Related reports
-

Military Armoured Vehicles Upgrade & Retrofit Market Report 2020-2030
COVID-19 pandemic is expected slow market growth for military armoured vehicles upgrade and retrofit industry till 2021. Major defence spenders...Full DetailsPublished: 05 October 2020 -
Military Armoured Vehicle Market Report 2020-2030
Military Armoured Vehicle market to total USD 29.9 billion in 2030.
...Full DetailsPublished: 09 March 2020 -
Special Mission Aircraft Market Report 2019-2029
The US$ 11.42bn special mission aircraft is expected to flourish in the next few years because of widespread budgetary constraints...
Full DetailsPublished: 16 May 2019 -
Military Aircraft Avionics Market Report 2019-2029
The $ 24 billion military avionics is expected to flourish in the next few years because of ongoing investment on...Full DetailsPublished: 26 February 2019 -
Top 20 Air and Missile Defence System (AMDS) Companies 2019
The market for ADMS market is expected to be valued US$14,221.9 million in 2019 and US$27,205.7 million by 2029, at...
Full DetailsPublished: 30 April 2019 -

Automotive Advanced Driver Assistance Systems (ADAS) Market Report to 2031
The major factor that driven the growth of the market is due to government regulations and support by mandating the...Full DetailsPublished: 01 January 1970 -
Military Land Vehicle Electronics (Vetronics) Market Report 2019-2029
Visiongain’s definitive new report values the Military Land Vehicle Electronics (Vetronics) market at USD 3.56 billion in 2019.
...Full DetailsPublished: 10 June 2019 -
Automotive Advanced Driver Assistance Systems (ADAS) Military Vehicles Market Report 2021-2031
Owing to the rise in the number of war threats and injuries, the market for safety features, such as crash...Full DetailsPublished: 21 April 2021 -

Top 20 Automotive Advanced Driver Assistance Systems (ADAS) Companies Report 2019
The Automotive ADAS Market is constantly evolving, and new systems are being introduced to the market every year. However, all...
Full DetailsPublished: 07 August 2019 -

100 Automotive Advanced Driver Assistance Systems (ADAS) Companies to Watch in 2019
The emergence of the automotive advanced driver assistance systems (ADAS) market and increasing R&D spending on semi-autonomous and fully automated...Full DetailsPublished: 07 December 2018
Download sample pages
Complete the form below to download your free sample pages for Military Vehicle & Aircraft Protection Systems Market Report 2019-2029
Do you have any custom requirements we can help you with?
Any specific country, geo region, market segment or specific company information?
Email us today, we can discuss your needs and see how we can help: jamie.roberts@visiongain.com
Would you like a free report overview of the report of your choice?
If so, please drop an email to Jamie Roberts stating your chosen report title to jamie.roberts@visiongain.com
Visiongain defence reports are compiled using a broad and rich mixture of both primary and secondary information to produce an overall industry outlook. In order to provide our clients with the best product possible, Visiongain analysts reach out to market-leading vendors and industry experts and review a wealth of financial data and product information from a vast range of sources. To find out more about our reports methodology, please email jamie.roberts@visiongain.com
Would you like to get the latest Visiongain defence reports catalogue?
What are the dynamic growth sectors? where are the regional business opportunities?
Which technologies will prevail and who are the leading companies succeeding in these sectors and why?
If you want definitive answers to business critical questions, discover Visiongain’s full range of business intelligence reports.
If so, please email Jamie Roberts on jamie.roberts@visiongain.com or call her today on +44 207 336 6100
ADS Group
Aerial Refueling Systems Advisory Group
Aerospace and Defence Industries Association of Nova Scotia
Aerospace Industries Association
Aerospace Industries Association of Canada
AHS International – The Vertical Flight Technical Society
Air Force Association
Aircraft Electronics Association
Airlift/Tanker Association
American Astronautical Society
American Gear Manufacturers Association
American Institute of Aeronautics and Astronautics
American Logistics Association
American Society of Naval Engineers
AMSUS – The Society of the Federal Health Agencies
Armed Forces Communications and Electronics Association
Armed Forces Communications and Electronics Association
Army Aviation Association of America
ASD – Aerospace & Defence Association of Europe
Association for Unmanned Vehicle Systems International
Association of Aviation Manufacturers of the Czech Republic
Association of Naval Aviation
Association of Old Crows
Association of Polish Aviation Industry
Association of the Defense Industry of the Czech Republic
Association of the United States Army
Association of the United States Navy
Australia Defence Association
Australian Industry & Defence Network
Australian Industry Group Defence Council
Austrian Aeronautics Industries Group
Aviation Distributors and Manufacturers Association
Aviation Suppliers Association
Belgian Security and Defence Industry
Bulgarian Defence Industry Association
Business Executives for National Security
Canadian Association of Defence and Security Industries
Conference of Defense Associations
Council of Defense and Space Industry Associations
Danish Defence & Security Industries Association
Defence Industry Manufacturers Association
Defense Industry Initiative on Business Ethics and Conduct
Defense Industry Offset Association
Defense Orientation Conference Association
Deutsche Gesellschaft fur Wehrtechnik
Federal Association of the German Security and Defence Industry
Federation of Aerospace Enterprises in Ireland
French Aerospace Industries Association
French Land Defence Manufacturers Association (GICAT)
German Aerospace Industries Association
Helicopter Association International
Hellenic Aerospace & Defense Industries Group
Homeland Security & Defense Business Council
International Stability Operations Association
Japan Association of Defense Industry
Korea Defense Industry Association
Marine Corps Association & Foundation
National Aeronautic Association
National Association of Ordnance and Explosive Waste Contractors
National Defense Industrial Association
National Defense Transportation Association
National Guard Association of the U.S.
Navy League of the United States
Netherlands Aerospace Group
New Zealand Defence Industry Association
Portuguese Association of Defense Related Industries & New Technologies Companies
Québec Ground Transportation Cluster
Satellite Industry Association
Society of American Military Engineers
South African Aerospace Maritime and Defence Industries Association
Spanish Aerospace and Defence Association Industries
Submarine Industrial Base Council
Swedish Aerospace Industries
Swedish Security and Defence Industry Association
Swiss Aeronautical Industries Group
The Association of Finnish Defence and Aerospace Industries
The Italian Industries Association for Aerospace Systems and Defence
The Netherlands Defence Manufacturers Association
The Society of Japanese Aerospace Companies
UK AeroSpace, Defence & Security Industries
United Kingdom National Defence Association
Don’t Miss Out!
Subscribe to receive the latest Industry news, trending insight and analysis straight to your inbox.Choose your preferences:
Latest Defence news
Robotic Warfare Market
The global Robotic Warfare market is projected to grow at a CAGR of 6.7% by 2034
19 July 2024
Cyber Warfare Market
The global Cyber Warfare market is projected to grow at a CAGR of 17.7% by 2034
16 July 2024
Counter-UAV (C-UAV) Market
The global Counter-UAV (C-UAV) market is projected to grow at a CAGR of 29.6% by 2034
08 July 2024
Special Mission Aircraft Market
The global Special Mission Aircraft market is projected to grow at a CAGR of 4.6% by 2034
27 June 2024
