Industries > Defence > Counter-UAV (C-UAV) Market Report 2020-2030
 Market Report 2020-2030")
Counter-UAV (C-UAV) Market Report 2020-2030
Forecasts by Platform (Defence, Commercial), by Type (Detection, Countermeasure), by Technology (Electronic, Kinetic), by Region (North America, Europe, Asia Pacific, Latin America, Middle East & Africa) Plus Analysis of Leading Counter-UAV Companies and COVID-19 Recovery Scenarios
The one-stop-shop for Counter UAV analysis during this COVID-19 crisis
How will your market be affected by the COVID-19 crisis and the economic developments over the coming long and short terms?
Only this report tells you. And it does that by analysis 5 different potential outcomes so that you are full prepared for the oncoming changes over till 2030. Where is the Counter-UAV market heading? You must read this newly updated report. Visiongain’s report shows you the potential revenues streams to 2030, assessing data, trends, opportunities and business prospects there.
Discover how to stay ahead
Our 944-page report provides 721 tables and 684 charts/graphs. Our new study lets you assess forecasted sales at overall world market and regional level. See financial results, trends, opportunities, and revenue predictions. Though there are potential threats to the global economy, the opportunity still remains in this growing Counter-UAV Market. See how to exploit those opportunities.
To access the data contained in this document please email contactus@visiongain.com
Forecasts to 2030 and other analyses reveal the commercial prospects
• In addition to revenue forecasting to 2030, our new study provides you with recent results, growth rates, and market shares.
• You find original analyses, with business outlooks and developments.
• Discover qualitative analyses (including market dynamics, drivers, opportunities, restraints and challenges), product profiles and commercial developments.
Discover sales predictions for the world market and submarkets
Counter-UAV Market: Platform
• Defense
• Commercial
Counter-UAV Market: Type
• Detection
• Countermeasure
Counter-UAV Market: Technology
• Electronic
• Kinetic

In addition to the revenue predictions for the overall world market and segments, you will also find revenue forecasts for 5 regional and 20 leading national markets:
• North America
– U.S.
– Canada
• Europe
– UK
– Germany
– France
– Italy
– Russia
– Spain
– Rest of Europe
• Asia Pacific
– China
– Japan
– India
– South Korea
– Southeast Asia
– Rest of Asia Pacific
• Latin America
– Brazil
– Argentina
– Rest of Latin America
• Middle East and Africa
– Saudi Arabia
– Qatar
– UAE
– Iraq
– Egypt
– Rest of Middle East & Africa
The report also includes profiles and for some of the leading companies in the Counter-UAV Market, with a focus on this segment of these companies’ operations.
Leading companies and the potential for market growth
• Boeing Company
• Airbus Group SE
• Saab AB
• Thales Group
• Lockheed Martin
• Israel Aerospace Industries
• Raytheon Company
• Northrop Grumman Corporation
• Rafael Advanced Defense Systems
• Rheinmetall AG
Overall world revenue for Counter-UAV Market will surpass $xx million in 2020, our work calculates. We predict strong revenue growth through to 2030.
Our work identifies which organizations hold the greatest potential. Discover their capabilities, progress, and commercial prospects, helping you stay ahead.
How the Counter-UAV Market report helps you
In summary, our 944 report provides you with the following knowledge:
• Revenue forecasts to 2030 for Counter-UAV Market, with forecasts for Type Category, Technology, and Platform, each forecasted at a global and regional level– discover the industry’s prospects, finding the most lucrative places for investments and revenues
• Revenue forecasts to 2030 for 5 regional and 20 key national markets – See forecasts for the Counter-UAV market in North America, Europe, Asia-Pacific, Latin America, and Middle East & Africa. Also forecasted is the market in the US, Canada, Argentina, Brazil, Germany, France, UK, Italy, Spain, China, India, Japan, and Australia among other prominent economies.
• Prospects for established firms and those seeking to enter the market– including company profiles for major companies involved in the Counter-UAV Market. Some of the company’s profiled in this report include Boeing Company, Airbus Group SE, Saab AB, Thales Group, Lockheed Martin, Israel Aerospace Industries, Raytheon Company, Northrop Grumman Corporation, Rafael Advanced Defense Systems, and Rheinmetall AG.
Find quantitative and qualitative analyses with independent predictions. Receive information that only our report contains, staying informed with this invaluable business intelligence.
Information found nowhere else
With our newly report title, you are less likely to fall behind in knowledge or miss out on opportunities. See how our work could benefit your research, analyses, and decisions.
Visiongain’s study is for everybody needing commercial analyses for the Counter-UAV Market and leading companies. You will find data, trends and predictions.
To access the data contained in this document please email contactus@visiongain.com
Buy our report today Counter-UAV (C-UAV) Market Analysis: Forecasts by Platform (Defence, Commercial), by Type (Detection, Countermeasure), by Technology (Electronic, Kinetic), by Region (North America, Europe, Asia Pacific, Latin America, Middle East & Africa) Plus Analysis of Leading Counter-UAV Companies. Avoid missing out by staying informed – order our report now.
Visiongain is a trading partner with the US Federal Government
CCR Ref number: KD4R6
Do you have any custom requirements we can help you with? Any need for a specific country, geo region, market segment or specific company information? Contact us today, we can discuss your needs and see how we can help: sara.peerun@visiongain.com
1. Report Overview
1.1. Global Counter-UAV Market Overview
1.2. Why You Should Read This Report
1.3. How This Report Delivers
1.4. Key Questions Answered by This Analytical Report
1.5. Who Is This Report For?
1.6. Methodology
1.6.1. Primary Research
1.6.2. Secondary Research
1.6.3. Market Evaluation & Forecasting Methodology
1.6.4. COVID-19 Impact: Recovery Scenarios
1.6.5. Market Size Estimation
1.7. Frequently Asked Questions (FAQ)
1.8. Associated Visiongain Reports
1.9. About Visiongain
2. Counter-UAV: Executive Summary
3. Counter-UAV Market: Introduction
3.1. Counter-UAV Market by Platforms
3.1.1. Commercial - Commercial applications of counter UAV include public venues, energy utilities, stadiums, arenas, airports, data centers, and organizations
3.1.2. Defense - This segment covers the market for Counter-UAV systems specific to military applications
3.2. Counter-UAV Market by Type
3.2.1. Detection - Counter-UAS system must be capable of detecting, tracking as well as intercepting UAVs
3.2.1.1. Radar
3.2.1.2. Radio-frequency (RF)
3.2.1.3. Electro-optical (EO)
3.2.1.4. Acoustic
3.2.1.5. Combined sensors
3.2.2. Countermeasure
3.2.2.1. RF Jamming
3.2.2.2. GNSS Jamming
3.2.2.3. Laser
3.3. Counter-UAV Market by Technology
3.3.1. Electronic - This segment covers the market for electronic devices such as laser-based systems, sensors, infrared, and radar systems for detecting, pulsing, and jamming UAVs.
3.3.2. Kinetic - This segment covers the market for kinetic systems used for countermeasures, such as ammunition and guns.
4. Counter-UAV Market Outlook
4.1. Market Drivers
4.1.1. Rising Need for UAV Detection Solutions Due to Security Concerns
4.1.2. Increased Terrorism and Illicit Activities
4.1.3. Risk Associated with UAV’s
4.1.3.1. Privacy Risk
4.1.3.2. Security Risk
4.1.3.3. Penetration Risk
4.2. Market Restraint
4.2.1. High Initial Cost of Research and Development
4.2.2. Public Safety Concerns
4.2.3. Difficulty of Mitigating UAV-Based Threats
4.3. Counter-UAV Industry: Porter’s Five Forces Analysis
4.3.1. Threat of New Entrants – Medium
4.3.2. Threat of Substitutes – Low
4.3.3. Bargaining Power of Buyers – Low
4.3.4. Bargaining Power of Suppliers – Low
4.3.5. Degree of Competition – High
4.4. COVID-19 Impact on Defence Spending
5. Counter-UAV Market by Platform
5.1. Counter-UAV Market Outlook by Platform
5.1.1. Counter-UAV Market Outlook by Platform - “V” Shaped Recovery
5.1.2. Counter-UAV Market Outlook by Platform - “U” Shaped Recovery
5.1.3. Counter-UAV Market Outlook by Platform - “L” Shaped Recovery
5.1.4. Counter-UAV Market Outlook by Platform - “W” Shaped Recovery
5.2. Defense - In 2019, defense spending in United States was surpassed USD 700 billion. China ranked second is defense spending with more than USD 250 billion in 2019.
5.2.1. Counter-UAV Market Outlook for Defense - “V” Shaped Recovery
5.2.2. Counter-UAV Market Outlook for Defense - “U” Shaped Recovery
5.2.3. Counter-UAV Market Outlook for Defense - “L” Shaped Recovery
5.2.4. Counter-UAV Market Outlook for Defense - “W” Shaped Recovery
5.3. Commercial - Rising infrastructure development in India, China, Japan, South Korea, Brazil, and Southeast Asia is expected to open new opportunities for counter UAV industry for commercial applications over the forecast period.
5.3.1. Counter-UAV Market Outlook for Commercial - “V” Shaped Recovery
5.3.2. Counter-UAV Market Outlook for Commercial - “U” Shaped Recovery
5.3.3. Counter-UAV Market Outlook for Commercial - “L” Shaped Recovery
5.3.4. Counter-UAV Market Outlook for Commercial - “W” Shaped Recovery
6. Counter-UAV Market by Type
6.1. Counter-UAV Market Outlook by Type
6.1.1. Counter-UAV Market Outlook by Type - “V” Shaped Recovery
6.1.2. Counter-UAV Market Outlook by Type - “U” Shaped Recovery
6.1.3. Counter-UAV Market Outlook by Type - “L” Shaped Recovery
6.1.4. Counter-UAV Market Outlook by Type - “W” Shaped Recovery
6.2. Detection - The most popular drone detection techniques are radar, RF detection, EO, and IR. C-UAS technology poses a wide range of practical, legal, and policy challenges in all operating environments.
6.2.1. Counter-UAV Market Outlook for Detection - “V” Shaped Recovery
6.2.2. Counter-UAV Market Outlook for Detection - “U” Shaped Recovery
6.2.3. Counter-UAV Market Outlook for Detection - “L” Shaped Recovery
6.2.4. Counter-UAV Market Outlook for Detection - “W” Shaped Recovery
6.2.5. Global Counter-UAV Market by Detection Type, 2020 – 2030
6.2.5.1. Global Counter-UAV Market by Detection Type, 2020 – 2030 - “V” Shaped Recovery
6.2.5.2. Global Counter-UAV Market by Detection Type, 2020 – 2030 - “U” Shaped Recovery
6.2.5.3. Global Counter-UAV Market by Detection Type, 2020 – 2030 - “L” Shaped Recovery
6.2.5.4. Global Counter-UAV Market by Detection Type, 2020 – 2030 - “W” Shaped Recovery
6.2.6. RF Tracking Detection
6.2.7. Radar Based Detection
6.2.8. Electro-Optics Based Detection
6.2.9. IR Based Detection
6.3. Countermeasure - Counter-unmanned aircraft system (UAS) technologies are focusing on a multilayered defense. They’re also being tasked with providing a counter to countermeasures.
6.3.1. Counter-UAV Market Outlook for Countermeasure - “V” Shaped Recovery
6.3.2. Counter-UAV Market Outlook for Countermeasure - “U” Shaped Recovery
6.3.3. Counter-UAV Market Outlook for Countermeasure - “L” Shaped Recovery
6.3.4. Counter-UAV Market Outlook for Countermeasure - “W” Shaped Recovery
6.3.5. Global Counter-UAV Market by Countermeasure Type, 2020 – 2030
6.3.5.1. Global Counter-UAV Market by Countermeasure Type, 2020 – 2030 - “V” Shaped Recovery
6.3.5.2. Global Counter-UAV Market by Countermeasure Type, 2020 – 2030 - “U” Shaped Recovery
6.3.5.3. Global Counter-UAV Market by Countermeasure Type, 2020 – 2030 - “L” Shaped Recovery
6.3.5.4. Global Counter-UAV Market by Countermeasure Type, 2020 – 2030 - “W” Shaped Recovery
6.3.6. Laser Countermeasure
6.3.7. Jamming Countermeasure
6.3.8. High Powered Microwave (HPM) Countermeasure
6.3.9. Interception Countermeasure
7. Counter-UAV Market by Technology
7.1. Counter-UAV Market Outlook by Technology
7.1.1. Counter-UAV Market Outlook by Technology - “V” Shaped Recovery
7.1.2. Counter-UAV Market Outlook by Technology - “U” Shaped Recovery
7.1.3. Counter-UAV Market Outlook by Technology - “L” Shaped Recovery
7.1.4. Counter-UAV Market Outlook by Technology - “W” Shaped Recovery
7.2. Electronic - Companies are making efforts to develop technologically advanced laser-based counter-UAV systems so as to increase the targeting capability of counter-UAV systems. However, this type of system is costlier as compared to other counter-UAV technologies.
7.2.1. Counter-UAV Market Outlook for Electronic - “V” Shaped Recovery
7.2.2. Counter-UAV Market Outlook for Electronic - “U” Shaped Recovery
7.2.3. Counter-UAV Market Outlook for Electronic - “L” Shaped Recovery
7.2.4. Counter-UAV Market Outlook for Electronic - “W” Shaped Recovery
7.3. Kinetic - Kinetic counter UAV devices can be dangerous and as such are mostly limited to remote areas and military applications.
7.3.1. Counter-UAV Market Outlook for Kinetic - “V” Shaped Recovery
7.3.2. Counter-UAV Market Outlook for Kinetic - “U” Shaped Recovery
7.3.3. Counter-UAV Market Outlook for Kinetic - “L” Shaped Recovery
7.3.4. Counter-UAV Market Outlook for Kinetic - “W” Shaped Recovery
8. Regional and Leading National Counter-UAV Market Forecasts 2020 – 2030
8.1. Global Counter-UAV Market by Region, 2020 – 2030
8.1.1. Counter-UAV Market Outlook by Region - “V” Shaped Recovery
8.1.2. Counter-UAV Market Outlook by Region - “U” Shaped Recovery
8.1.3. Counter-UAV Market Outlook by Region - “L” Shaped Recovery
8.1.4. Counter-UAV Market Outlook by Region - “W” Shaped Recovery
9. North America - U.S. dominated counter UAV market size in North America in 2019 and is expected to continue its dominancy over the coming years by virtue of well-developed building & construction, hospital, commercial properties, and airport industry.
9.1. North America Counter-UAV Market 2020 – 2030
9.1.1. North America Counter-UAV Market Outlook - “V” Shaped Recovery
9.1.2. North America Counter-UAV Market Outlook - “U” Shaped Recovery
9.1.3. North America Counter-UAV Market Outlook - “L” Shaped Recovery
9.1.4. North America Counter-UAV Market Outlook - “W” Shaped Recovery
9.2. North America Counter-UAV Market by Platform
9.2.1. North America Counter-UAV Market by Platform - “V” Shaped Recovery
9.2.2. North America Counter-UAV Market by Platform - “U” Shaped Recovery
9.2.3. North America Counter-UAV Market by Platform - “L” Shaped Recovery
9.2.4. North America Counter-UAV Market by Platform - “W” Shaped Recovery
9.3. North America Counter-UAV Market by Type
9.3.1. North America Counter-UAV Market by Type - “V” Shaped Recovery
9.3.2. North America Counter-UAV Market by Type - “U” Shaped Recovery
9.3.3. North America Counter-UAV Market by Type - “L” Shaped Recovery
9.3.4. North America Counter-UAV Market by Type - “W” Shaped Recovery
9.4. North America Counter-UAV Market by Technology
9.4.1. North America Counter-UAV Market by Technology - “V” Shaped Recovery
9.4.2. North America Counter-UAV Market by Technology - “U” Shaped Recovery
9.4.3. North America Counter-UAV Market by Technology - “L” Shaped Recovery
9.4.4. North America Counter-UAV Market by Technology - “W” Shaped Recovery
9.5. U.S. - The U.S. Defense Advanced Research Projects Agency’s Aerial Dragnet program seeks to develop networks of tethered drones that can detect and track every small unmanned aircraft operating within a large coverage area, such as a whole city.
9.5.1. U.S. Counter-UAV Market Outlook - “V” Shaped Recovery
9.5.2. U.S. Counter-UAV Market Outlook - “U” Shaped Recovery
9.5.3. U.S. Counter-UAV Market Outlook - “L” Shaped Recovery
9.5.4. U.S. Counter-UAV Market Outlook - “W” Shaped Recovery
9.6. U.S. Counter-UAV Market by Platform
9.6.1. U.S. Counter-UAV Market by Platform - “V” Shaped Recovery
9.6.2. U.S. Counter-UAV Market by Platform - “U” Shaped Recovery
9.6.3. U.S. Counter-UAV Market by Platform - “L” Shaped Recovery
9.6.4. U.S. Counter-UAV Market by Platform - “W” Shaped Recovery
9.7. U.S. Counter-UAV Market by Type
9.7.1. U.S. Counter-UAV Market by Type - “V” Shaped Recovery
9.7.2. U.S. Counter-UAV Market by Type - “U” Shaped Recovery
9.7.3. U.S. Counter-UAV Market by Type - “L” Shaped Recovery
9.7.4. U.S. Counter-UAV Market by Type - “W” Shaped Recovery
9.8. U.S. Counter-UAV Market by Technology
9.8.1. U.S. Counter-UAV Market by Technology - “V” Shaped Recovery
9.8.2. U.S. Counter-UAV Market by Technology - “U” Shaped Recovery
9.8.3. U.S. Counter-UAV Market by Technology - “L” Shaped Recovery
9.8.4. U.S. Counter-UAV Market by Technology - - “W” Shaped Recovery
9.9. Canada - Canada’s largest economy, government funding programs, and a strong research ecosystem is expected to boost drone industry in Canada over the coming years.
9.9.1. Canada Counter-UAV Market Outlook - “V” Shaped Recovery
9.9.2. Canada Counter-UAV Market Outlook - “U” Shaped Recovery
9.9.3. Canada Counter-UAV Market Outlook - “L” Shaped Recovery
9.9.4. Canada Counter-UAV Market Outlook - “W” Shaped Recovery
9.10. Canada Counter-UAV Market by Platform
9.10.1. Canada Counter-UAV Market by Platform - “V” Shaped Recovery
9.10.2. Canada Counter-UAV Market by Platform - “U” Shaped Recovery
9.10.3. Canada Counter-UAV Market by Platform - “L” Shaped Recovery
9.10.4. Canada Counter-UAV Market by Platform - “W” Shaped Recovery
9.11. Canada Counter-UAV Market by Type
9.11.1. Canada Counter-UAV Market by Type - “V” Shaped Recovery
9.11.2. Canada Counter-UAV Market by Type - “U” Shaped Recovery
9.11.3. Canada Counter-UAV Market by Type - “L” Shaped Recovery
9.11.4. Canada Counter-UAV Market by Type - “W” Shaped Recovery
9.12. Canada Counter-UAV Market by Technology
9.12.1. Canada Counter-UAV Market by Technology - “V” Shaped Recovery
9.12.2. Canada Counter-UAV Market by Technology - “U” Shaped Recovery
9.12.3. Canada Counter-UAV Market by Technology - “L” Shaped Recovery
9.12.4. Canada Counter-UAV Market by Technology - “W” Shaped Recovery
10. Europe - Rising incidences of security breaches by unidentified drones followed by increasing terrorism and illicit activities across the European countries is expected to open new opportunities for counter UAV industry over the coming years.
10.1. Europe Counter-UAV Market by Region, 2020 – 2030
10.1.1. Europe Counter-UAV Market Outlook - “V” Shaped Recovery
10.1.2. Europe Counter-UAV Market Outlook - “U” Shaped Recovery
10.1.3. Europe Counter-UAV Market Outlook - “L” Shaped Recovery
10.1.4. Europe Counter-UAV Market Outlook - “W” Shaped Recovery
10.2. Europe Counter-UAV Market by Platform
10.2.1. Europe Counter-UAV Market by Platform - “V” Shaped Recovery
10.2.2. Europe Counter-UAV Market by Platform - “U” Shaped Recovery
10.2.3. Europe Counter-UAV Market by Platform - “L” Shaped Recovery
10.2.4. Europe Counter-UAV Market by Platform - “W” Shaped Recovery
10.3. Europe Counter-UAV Market by Type
10.3.1. Europe Counter-UAV Market by Type - “V” Shaped Recovery
10.3.2. Europe Counter-UAV Market by Type - “U” Shaped Recovery
10.3.3. Europe Counter-UAV Market by Type - “L” Shaped Recovery
10.3.4. Europe Counter-UAV Market by Type - “W” Shaped Recovery
10.4. Europe Counter-UAV Market by Technology
10.4.1. Europe Counter-UAV Market by Technology - “V” Shaped Recovery
10.4.2. Europe Counter-UAV Market by Technology - “U” Shaped Recovery
10.4.3. Europe Counter-UAV Market by Technology - “L” Shaped Recovery
10.4.4. Europe Counter-UAV Market by Technology - “W” Shaped Recovery
10.5. UK - Increasing drone adoption followed by rising terrorist threat are expected to increase demand for counter UAV market in UK.
10.5.1. UK Counter-UAV Market Outlook - “V” Shaped Recovery
10.5.2. UK Counter-UAV Market Outlook - “U” Shaped Recovery
10.5.3. UK Counter-UAV Market Outlook - “L” Shaped Recovery
10.5.4. UK Counter-UAV Market Outlook - “W” Shaped Recovery
10.6. UK Counter-UAV Market by Platform
10.6.1. UK Counter-UAV Market by Platform - “V” Shaped Recovery
10.6.2. UK Counter-UAV Market by Platform - “U” Shaped Recovery
10.6.3. UK Counter-UAV Market by Platform - “L” Shaped Recovery
10.6.4. UK Counter-UAV Market by Platform - “W” Shaped Recovery
10.7. UK Counter-UAV Market by Type
10.7.1. UK Counter-UAV Market by Type - “V” Shaped Recovery
10.7.2. UK Counter-UAV Market by Type - “U” Shaped Recovery
10.7.3. UK Counter-UAV Market by Type - “L” Shaped Recovery
10.7.4. UK Counter-UAV Market by Type - “W” Shaped Recovery
10.8. UK Counter-UAV Market by Technology
10.8.1. UK Counter-UAV Market by Technology - “V” Shaped Recovery
10.8.2. UK Counter-UAV Market by Technology - “U” Shaped Recovery
10.8.3. UK Counter-UAV Market by Technology - “L” Shaped Recovery
10.8.4. UK Counter-UAV Market by Technology - “W” Shaped Recovery
10.9. Germany - There are about half a million drones in circulation in Germany. Of these, 455,000 drones are used privately and 19,000 drones commercially.
10.9.1. Germany Counter-UAV Market Outlook - “V” Shaped Recovery
10.9.2. Germany Counter-UAV Market Outlook - “U” Shaped Recovery
10.9.3. Germany Counter-UAV Market Outlook - “L” Shaped Recovery
10.9.4. Germany Counter-UAV Market Outlook - “W” Shaped Recovery
10.10. Germany Counter-UAV Market by Platform
10.10.1. Germany Counter-UAV Market by Platform - “V” Shaped Recovery
10.10.2. Germany Counter-UAV Market by Platform - “U” Shaped Recovery
10.10.3. Germany Counter-UAV Market by Platform - “L” Shaped Recovery
10.10.4. Germany Counter-UAV Market by Platform - “W” Shaped Recovery
10.11. Germany Counter-UAV Market by Type
10.11.1. Germany Counter-UAV Market by Type - “V” Shaped Recovery
10.11.2. Germany Counter-UAV Market by Type - “U” Shaped Recovery
10.11.3. Germany Counter-UAV Market by Type - “L” Shaped Recovery
10.11.4. Germany Counter-UAV Market by Type - “W” Shaped Recovery
10.12. Germany Counter-UAV Market by Technology
10.12.1. Germany Counter-UAV Market by Technology - “V” Shaped Recovery
10.12.2. Germany Counter-UAV Market by Technology - “U” Shaped Recovery
10.12.3. Germany Counter-UAV Market by Technology - “L” Shaped Recovery
10.12.4. Germany Counter-UAV Market by Technology - “W” Shaped Recovery
10.13. France - Thales as part of a French government project to bring down intrusive and non-responsive drones is expected to open new opportunities over the forecast period.
10.13.1. France Counter-UAV Market Outlook - “V” Shaped Recovery
10.13.2. France Counter-UAV Market Outlook - “U” Shaped Recovery
10.13.3. France Counter-UAV Market Outlook - “L” Shaped Recovery
10.13.4. France Counter-UAV Market Outlook - “W” Shaped Recovery
10.14. France Counter-UAV Market by Platform
10.14.1. France Counter-UAV Market by Platform - “V” Shaped Recovery
10.14.2. France Counter-UAV Market by Platform - “U” Shaped Recovery
10.14.3. France Counter-UAV Market by Platform - “L” Shaped Recovery
10.14.4. France Counter-UAV Market by Platform - “W” Shaped Recovery
10.15. France Counter-UAV Market by Type
10.15.1. France Counter-UAV Market by Type - “V” Shaped Recovery
10.15.2. France Counter-UAV Market by Type - “U” Shaped Recovery
10.15.3. France Counter-UAV Market by Type - “L” Shaped Recovery
10.15.4. France Counter-UAV Market by Type - “W” Shaped Recovery
10.16. France Counter-UAV Market by Technology
10.16.1. France Counter-UAV Market by Technology - “V” Shaped Recovery
10.16.2. France Counter-UAV Market by Technology - “U” Shaped Recovery
10.16.3. France Counter-UAV Market by Technology - “L” Shaped Recovery
10.16.4. France Counter-UAV Market by Technology - “W” Shaped Recovery
10.17. Italy - Italy was amongst the first countries to acquire unarmed Predator drones from the United States and its been deployed in Iraq, Afghanistan, and Libya
10.17.1. Italy Counter-UAV Market Outlook - “V” Shaped Recovery
10.17.2. Italy Counter-UAV Market Outlook - “U” Shaped Recovery
10.17.3. Italy Counter-UAV Market Outlook - “L” Shaped Recovery
10.17.4. Italy Counter-UAV Market Outlook - “W” Shaped Recovery
10.18. Italy Counter-UAV Market by Platform
10.18.1. Italy Counter-UAV Market by Platform - “V” Shaped Recovery
10.18.2. Italy Counter-UAV Market by Platform - “U” Shaped Recovery
10.18.3. Italy Counter-UAV Market by Platform - “L” Shaped Recovery
10.18.4. Italy Counter-UAV Market by Platform - “W” Shaped Recovery
10.19. Italy Counter-UAV Market by Type
10.19.1. Italy Counter-UAV Market by Type - “V” Shaped Recovery
10.19.2. Italy Counter-UAV Market by Type - “U” Shaped Recovery
10.19.3. Italy Counter-UAV Market by Type - “L” Shaped Recovery
10.19.4. Italy Counter-UAV Market by Type - “W” Shaped Recovery
10.20. Italy Counter-UAV Market by Technology
10.20.1. Italy Counter-UAV Market by Technology - “V” Shaped Recovery
10.20.2. Italy Counter-UAV Market by Technology - “U” Shaped Recovery
10.20.3. Italy Counter-UAV Market by Technology - “L” Shaped Recovery
10.20.4. Italy Counter-UAV Market by Technology - “W” Shaped Recovery
10.21. Russia - Russian arms manufacturer Rostec is marketing a multifaceted counter-unmanned aerial system (C-UAS) capability through its subsidiary Rosoboronexport.
10.21.1. Russia Counter-UAV Market Outlook - “V” Shaped Recovery
10.21.2. Russia Counter-UAV Market Outlook - “U” Shaped Recovery
10.21.3. Russia Counter-UAV Market Outlook - “L” Shaped Recovery
10.21.4. Russia Counter-UAV Market Outlook - “W” Shaped Recovery
10.22. Russia Counter-UAV Market by Platform
10.22.1. Russia Counter-UAV Market by Platform - “V” Shaped Recovery
10.22.2. Russia Counter-UAV Market by Platform - “U” Shaped Recovery
10.22.3. Russia Counter-UAV Market by Platform - “L” Shaped Recovery
10.22.4. Russia Counter-UAV Market by Platform - “W” Shaped Recovery
10.23. Russia Counter-UAV Market by Type
10.23.1. Russia Counter-UAV Market by Type - “V” Shaped Recovery
10.23.2. Russia Counter-UAV Market by Type - “U” Shaped Recovery
10.23.3. Russia Counter-UAV Market by Type - “L” Shaped Recovery
10.23.4. Russia Counter-UAV Market by Type - “W” Shaped Recovery
10.24. Russia Counter-UAV Market by Technology
10.24.1. Russia Counter-UAV Market by Technology - “V” Shaped Recovery
10.24.2. Russia Counter-UAV Market by Technology - “U” Shaped Recovery
10.24.3. Russia Counter-UAV Market by Technology - “L” Shaped Recovery
10.24.4. Russia Counter-UAV Market by Technology - “W” Shaped Recovery
10.25. Spain - In December 2019, Aeronautica SDLE, a developer of UAS (unmanned aerial systems) technologies, has announced that it has been awarded a contract by the Spanish Ministry of Defense to provide two portable counter-drone systems that will be used by the Guardia Civil (Spanish law enforcement agency).
10.25.1. Spain Counter-UAV Market Outlook - “V” Shaped Recovery
10.25.2. Spain Counter-UAV Market Outlook - “U” Shaped Recovery
10.25.3. Spain Counter-UAV Market Outlook - “L” Shaped Recovery
10.25.4. Spain Counter-UAV Market Outlook - “W” Shaped Recovery
10.26. Spain Counter-UAV Market by Platform
10.26.1. Spain Counter-UAV Market by Platform - “V” Shaped Recovery
10.26.2. Spain Counter-UAV Market by Platform - “U” Shaped Recovery
10.26.3. Spain Counter-UAV Market by Platform - “L” Shaped Recovery
10.26.4. Spain Counter-UAV Market by Platform - “W” Shaped Recovery
10.27. Spain Counter-UAV Market by Type
10.27.1. Spain Counter-UAV Market by Type - “V” Shaped Recovery
10.27.2. Spain Counter-UAV Market by Type - “U” Shaped Recovery
10.27.3. Spain Counter-UAV Market by Type - “L” Shaped Recovery
10.27.4. Spain Counter-UAV Market by Type - “W” Shaped Recovery
10.28. Spain Counter-UAV Market by Technology
10.28.1. Spain Counter-UAV Market by Technology - “V” Shaped Recovery
10.28.2. Spain Counter-UAV Market by Technology - “U” Shaped Recovery
10.28.3. Spain Counter-UAV Market by Technology - “L” Shaped Recovery
10.28.4. Spain Counter-UAV Market by Technology - “W” Shaped Recovery
10.29. Rest of Europe
10.29.1. Rest of Europe Counter-UAV Market Outlook - “V” Shaped Recovery
10.29.2. Rest of Europe Counter-UAV Market Outlook - “U” Shaped Recovery
10.29.3. Rest of Europe Counter-UAV Market Outlook - “L” Shaped Recovery
10.29.4. Rest of Europe Counter-UAV Market Outlook - “W” Shaped Recovery
10.30. Rest of Europe Counter-UAV Market by Platform
10.30.1. Rest of Europe Counter-UAV Market by Platform - “V” Shaped Recovery
10.30.2. Rest of Europe Counter-UAV Market by Platform - “U” Shaped Recovery
10.30.3. Rest of Europe Counter-UAV Market by Platform - “L” Shaped Recovery
10.30.4. Rest of Europe Counter-UAV Market by Platform - “W” Shaped Recovery
10.31. Rest of Europe Counter-UAV Market by Type
10.31.1. Rest of Europe Counter-UAV Market by Type - “V” Shaped Recovery
10.31.2. Rest of Europe Counter-UAV Market by Type - “U” Shaped Recovery
10.31.3. Rest of Europe Counter-UAV Market by Type - “L” Shaped Recovery
10.31.4. Rest of Europe Counter-UAV Market by Type - “W” Shaped Recovery
10.32. Rest of Europe Counter-UAV Market by Technology
10.32.1. Rest of Europe Counter-UAV Market by Technology - “V” Shaped Recovery
10.32.2. Rest of Europe Counter-UAV Market by Technology - “U” Shaped Recovery
10.32.3. Rest of Europe Counter-UAV Market by Technology - “L” Shaped Recovery
10.32.4. Rest of Europe Counter-UAV Market by Technology - “W” Shaped Recovery
11. Asia Pacific - Emerging automotive and industrial industry in China, Japan, India, Southeast Asia, South Korea, and Australia
11.1. Asia Pacific Counter-UAV Market by Region, 2020 – 2030
11.1.1. Asia Pacific Counter-UAV Market Outlook - “V” Shaped Recovery
11.1.2. Asia Pacific Counter-UAV Market Outlook - “U” Shaped Recovery
11.1.3. Asia Pacific Counter-UAV Market Outlook - “L” Shaped Recovery
11.1.4. Asia Pacific Counter-UAV Market Outlook - “W” Shaped Recovery
11.2. Asia Pacific Counter-UAV Market by Platform
11.2.1. Asia Pacific Counter-UAV Market by Platform - “V” Shaped Recovery
11.2.2. Asia Pacific Counter-UAV Market by Platform - “U” Shaped Recovery
11.2.3. Asia Pacific Counter-UAV Market by Platform - “L” Shaped Recovery
11.2.4. Asia Pacific Counter-UAV Market by Platform - “W” Shaped Recovery
11.3. Asia Pacific Counter-UAV Market by Type
11.3.1. Asia Pacific Counter-UAV Market by Type - “V” Shaped Recovery
11.3.2. Asia Pacific Counter-UAV Market by Type - “U” Shaped Recovery
11.3.3. Asia Pacific Counter-UAV Market by Type - “L” Shaped Recovery
11.3.4. Asia Pacific Counter-UAV Market by Type - “W” Shaped Recovery
11.4. Asia Pacific Counter-UAV Market by Technology
11.4.1. Asia Pacific Counter-UAV Market by Technology - “V” Shaped Recovery
11.4.2. Asia Pacific Counter-UAV Market by Technology - “U” Shaped Recovery
11.4.3. Asia Pacific Counter-UAV Market by Technology - “L” Shaped Recovery
11.4.4. Asia Pacific Counter-UAV Market by Technology - “W” Shaped Recovery
11.5. China - China is moving to develop laser weapons and counter-drone systems as it tries to catch up with the United States
11.5.1. China Counter-UAV Market Outlook - “V” Shaped Recovery
11.5.2. China Counter-UAV Market Outlook - “U” Shaped Recovery
11.5.3. China Counter-UAV Market Outlook - “L” Shaped Recovery
11.5.4. China Counter-UAV Market Outlook - “W” Shaped Recovery
11.6. China Counter-UAV Market by Platform
11.6.1. China Counter-UAV Market by Platform - “V” Shaped Recovery
11.6.2. China Counter-UAV Market by Platform - “U” Shaped Recovery
11.6.3. China Counter-UAV Market by Platform - “L” Shaped Recovery
11.6.4. China Counter-UAV Market by Platform - “W” Shaped Recovery
11.7. China Counter-UAV Market by Type
11.7.1. China Counter-UAV Market by Type - “V” Shaped Recovery
11.7.2. China Counter-UAV Market by Type - “U” Shaped Recovery
11.7.3. China Counter-UAV Market by Type - “L” Shaped Recovery
11.7.4. China Counter-UAV Market by Type - “W” Shaped Recovery
11.8. China Counter-UAV Market by Technology
11.8.1. China Counter-UAV Market by Technology - “V” Shaped Recovery
11.8.2. China Counter-UAV Market by Technology - “U” Shaped Recovery
11.8.3. China Counter-UAV Market by Technology - “L” Shaped Recovery
11.8.4. China Counter-UAV Market by Technology - “W” Shaped Recovery
11.9. Japan - Presence of well-established counter drone and drone manufacturers
11.9.1. Japan Counter-UAV Market Outlook - “V” Shaped Recovery
11.9.2. Japan Counter-UAV Market Outlook - “U” Shaped Recovery
11.9.3. Japan Counter-UAV Market Outlook - “L” Shaped Recovery
11.9.4. Japan Counter-UAV Market Outlook - “W” Shaped Recovery
11.10. Japan Counter-UAV Market by Platform
11.10.1. Japan Counter-UAV Market by Platform - “V” Shaped Recovery
11.10.2. Japan Counter-UAV Market by Platform - “U” Shaped Recovery
11.10.3. Japan Counter-UAV Market by Platform - “L” Shaped Recovery
11.10.4. Japan Counter-UAV Market by Platform - “W” Shaped Recovery
11.11. Japan Counter-UAV Market by Type
11.11.1. Japan Counter-UAV Market by Type - “V” Shaped Recovery
11.11.2. Japan Counter-UAV Market by Type - “U” Shaped Recovery
11.11.3. Japan Counter-UAV Market by Type - “L” Shaped Recovery
11.11.4. Japan Counter-UAV Market by Type - “W” Shaped Recovery
11.12. Japan Counter-UAV Market by Technology
11.12.1. Japan Counter-UAV Market by Technology - “V” Shaped Recovery
11.12.2. Japan Counter-UAV Market by Technology - “U” Shaped Recovery
11.12.3. Japan Counter-UAV Market by Technology - “L” Shaped Recovery
11.12.4. Japan Counter-UAV Market by Technology - “W” Shaped Recovery
11.13. India – Increasing drone technology industry
11.13.1. India Counter-UAV Market Outlook - “V” Shaped Recovery
11.13.2. India Counter-UAV Market Outlook - “U” Shaped Recovery
11.13.3. India Counter-UAV Market Outlook - “L” Shaped Recovery
11.13.4. India Counter-UAV Market Outlook - “W” Shaped Recovery
11.14. India Counter-UAV Market by Platform
11.14.1. India Counter-UAV Market by Platform - “V” Shaped Recovery
11.14.2. India Counter-UAV Market by Platform - “U” Shaped Recovery
11.14.3. India Counter-UAV Market by Platform - “L” Shaped Recovery
11.14.4. India Counter-UAV Market by Platform - “W” Shaped Recovery
11.15. India Counter-UAV Market by Type
11.15.1. India Counter-UAV Market by Type - “V” Shaped Recovery
11.15.2. India Counter-UAV Market by Type - “U” Shaped Recovery
11.15.3. India Counter-UAV Market by Type - “L” Shaped Recovery
11.15.4. India Counter-UAV Market by Type - “W” Shaped Recovery
11.16. India Counter-UAV Market by Technology
11.16.1. India Counter-UAV Market by Technology - “V” Shaped Recovery
11.16.2. India Counter-UAV Market by Technology - “U” Shaped Recovery
11.16.3. India Counter-UAV Market by Technology - “L” Shaped Recovery
11.16.4. India Counter-UAV Market by Technology - “W” Shaped Recovery
11.17. South Korea - In September 2019, South Korea’s procurement agency – Defence Acquisition Program Administration (DAPA) – plans to invest 88 billion won (USD74 million) in counter-drone technology
11.17.1. South Korea Counter-UAV Market Outlook - “V” Shaped Recovery
11.17.2. South Korea Counter-UAV Market Outlook - “U” Shaped Recovery
11.17.3. South Korea Counter-UAV Market Outlook - “L” Shaped Recovery
11.17.4. South Korea Counter-UAV Market Outlook - “W” Shaped Recovery
11.18. South Korea Counter-UAV Market by Platform
11.18.1. South Korea Counter-UAV Market by Platform - “V” Shaped Recovery
11.18.2. South Korea Counter-UAV Market by Platform - “U” Shaped Recovery
11.18.3. South Korea Counter-UAV Market by Platform - “L” Shaped Recovery
11.18.4. South Korea Counter-UAV Market by Platform - “W” Shaped Recovery
11.19. South Korea Counter-UAV Market by Type
11.19.1. South Korea Counter-UAV Market by Type - “V” Shaped Recovery
11.19.2. South Korea Counter-UAV Market by Type - “U” Shaped Recovery
11.19.3. South Korea Counter-UAV Market by Type - “L” Shaped Recovery
11.19.4. South Korea Counter-UAV Market by Type - “W” Shaped Recovery
11.20. South Korea Counter-UAV Market by Technology
11.20.1. South Korea Counter-UAV Market by Technology - “V” Shaped Recovery
11.20.2. South Korea Counter-UAV Market by Technology - “U” Shaped Recovery
11.20.3. South Korea Counter-UAV Market by Technology - “L” Shaped Recovery
11.20.4. South Korea Counter-UAV Market by Technology - “W” Shaped Recovery
11.21. Southeast Asia - In April 2020, Hensoldt and MyDefence have formed a cooperation to deliver a counter-UAS system for an unnamed Southeast Asian customer.
11.21.1. Southeast Asia Counter-UAV Market Outlook - “V” Shaped Recovery
11.21.2. Southeast Asia Counter-UAV Market Outlook - “U” Shaped Recovery
11.21.3. Southeast Asia Counter-UAV Market Outlook - “L” Shaped Recovery
11.21.4. Southeast Asia Counter-UAV Market Outlook - “W” Shaped Recovery
11.22. Southeast Asia Counter-UAV Market by Platform
11.22.1. Southeast Asia Counter-UAV Market by Platform - “V” Shaped Recovery
11.22.2. Southeast Asia Counter-UAV Market by Platform - “U” Shaped Recovery
11.22.3. Southeast Asia Counter-UAV Market by Platform - “L” Shaped Recovery
11.22.4. Southeast Asia Counter-UAV Market by Platform - “W” Shaped Recovery
11.23. Southeast Asia Counter-UAV Market by Type
11.23.1. Southeast Asia Counter-UAV Market by Type - “V” Shaped Recovery
11.23.2. Southeast Asia Counter-UAV Market by Type - “U” Shaped Recovery
11.23.3. Southeast Asia Counter-UAV Market by Type - “L” Shaped Recovery
11.23.4. Southeast Asia Counter-UAV Market by Type - “W” Shaped Recovery
11.24. Southeast Asia Counter-UAV Market by Technology
11.24.1. Southeast Asia Counter-UAV Market by Technology - “V” Shaped Recovery
11.24.2. Southeast Asia Counter-UAV Market by Technology - “U” Shaped Recovery
11.24.3. Southeast Asia Counter-UAV Market by Technology - “L” Shaped Recovery
11.24.4. Southeast Asia Counter-UAV Market by Technology - “W” Shaped Recovery
11.25. Rest of Asia Pacific
11.25.1. Rest of Asia Pacific Counter-UAV Market Outlook - “V” Shaped Recovery
11.25.2. Rest of Asia Pacific Counter-UAV Market Outlook - “U” Shaped Recovery
11.25.3. Rest of Asia Pacific Counter-UAV Market Outlook - “L” Shaped Recovery
11.25.4. Rest of Asia Pacific Counter-UAV Market Outlook - “W” Shaped Recovery
11.26. Rest of Asia Pacific Counter-UAV Market by Platform
11.26.1. Rest of Asia Pacific Counter-UAV Market by Platform - “V” Shaped Recovery
11.26.2. Rest of Asia Pacific Counter-UAV Market by Platform - “U” Shaped Recovery
11.26.3. Rest of Asia Pacific Counter-UAV Market by Platform - “L” Shaped Recovery
11.26.4. Rest of Asia Pacific Counter-UAV Market by Platform - “W” Shaped Recovery
11.27. Rest of Asia Pacific Counter-UAV Market by Type
11.27.1. Rest of Asia Pacific Counter-UAV Market by Type - “V” Shaped Recovery
11.27.2. Rest of Asia Pacific Counter-UAV Market by Type - “U” Shaped Recovery
11.27.3. Rest of Asia Pacific Counter-UAV Market by Type - “L” Shaped Recovery
11.27.4. Rest of Asia Pacific Counter-UAV Market by Type - “W” Shaped Recovery
11.28. Rest of Asia Pacific Counter-UAV Market by Technology
11.28.1. Rest of Asia Pacific Counter-UAV Market by Technology - “V” Shaped Recovery
11.28.2. Rest of Asia Pacific Counter-UAV Market by Technology - “U” Shaped Recovery
11.28.3. Rest of Asia Pacific Counter-UAV Market by Technology - “L” Shaped Recovery
11.28.4. Rest of Asia Pacific Counter-UAV Market by Technology - “W” Shaped Recovery
12. Latin America - Economic recovery followed by infrastructure development in Brazil, Argentina, Mexico, Chile, Peru, Colombia, and Ecuador
12.1. Latin America Counter-UAV Market by Region, 2020 – 2030
12.1.1. Latin America Counter-UAV Market Outlook - “V” Shaped Recovery
12.1.2. Latin America Counter-UAV Market Outlook - “U” Shaped Recovery
12.1.3. Latin America Counter-UAV Market Outlook - “L” Shaped Recovery
12.1.4. Latin America Counter-UAV Market Outlook - “W” Shaped Recovery
12.2. Latin America Counter-UAV Market by Platform
12.2.1. Latin America Counter-UAV Market by Platform - “V” Shaped Recovery
12.2.2. Latin America Counter-UAV Market by Platform - “U” Shaped Recovery
12.2.3. Latin America Counter-UAV Market by Platform - “L” Shaped Recovery
12.2.4. Latin America Counter-UAV Market by Platform - “W” Shaped Recovery
12.3. Latin America Counter-UAV Market by Type
12.3.1. Latin America Counter-UAV Market by Type - “V” Shaped Recovery
12.3.2. Latin America Counter-UAV Market by Type - “U” Shaped Recovery
12.3.3. Latin America Counter-UAV Market by Type - “L” Shaped Recovery
12.3.4. Latin America Counter-UAV Market by Type - “W” Shaped Recovery
12.4. Latin America Counter-UAV Market by Technology
12.4.1. Latin America Counter-UAV Market by Technology - “V” Shaped Recovery
12.4.2. Latin America Counter-UAV Market by Technology - “U” Shaped Recovery
12.4.3. Latin America Counter-UAV Market by Technology - “L” Shaped Recovery
12.4.4. Latin America Counter-UAV Market by Technology - “W” Shaped Recovery
12.5. Brazil - Brazil has currently about 34,000 civil UAS registered with the SISANT/ANAC (see below). 65% of which are for recreational and 35% for commercial use
12.5.1. Brazil Counter-UAV Market Outlook - “V” Shaped Recovery
12.5.2. Brazil Counter-UAV Market Outlook - “U” Shaped Recovery
12.5.3. Brazil Counter-UAV Market Outlook - “L” Shaped Recovery
12.5.4. Brazil Counter-UAV Market Outlook - “W” Shaped Recovery
12.6. Brazil Counter-UAV Market by Platform
12.6.1. Brazil Counter-UAV Market by Platform - “V” Shaped Recovery
12.6.2. Brazil Counter-UAV Market by Platform - “U” Shaped Recovery
12.6.3. Brazil Counter-UAV Market by Platform - “L” Shaped Recovery
12.6.4. Brazil Counter-UAV Market by Platform - “W” Shaped Recovery
12.7. Brazil Counter-UAV Market by Type
12.7.1. Brazil Counter-UAV Market by Type - “V” Shaped Recovery
12.7.2. Brazil Counter-UAV Market by Type - “U” Shaped Recovery
12.7.3. Brazil Counter-UAV Market by Type - “L” Shaped Recovery
12.7.4. Brazil Counter-UAV Market by Type - “W” Shaped Recovery
12.8. Brazil Counter-UAV Market by Technology
12.8.1. Brazil Counter-UAV Market by Technology - “V” Shaped Recovery
12.8.2. Brazil Counter-UAV Market by Technology - “U” Shaped Recovery
12.8.3. Brazil Counter-UAV Market by Technology - “L” Shaped Recovery
12.8.4. Brazil Counter-UAV Market by Technology - “W” Shaped Recovery
12.9. Argentina - The Lipan M3 is a surveillance, reconnaissance and intelligence unmanned aerial vehicle (UAV) developed entirely by staff of the Ejército Argentino (Argentine Army)
12.9.1. Argentina Counter-UAV Market Outlook - “V” Shaped Recovery
12.9.2. Argentina Counter-UAV Market Outlook - “U” Shaped Recovery
12.9.3. Argentina Counter-UAV Market Outlook - “L” Shaped Recovery
12.9.4. Argentina Counter-UAV Market Outlook - “W” Shaped Recovery
12.10. Argentina Counter-UAV Market by Platform
12.10.1. Argentina Counter-UAV Market by Platform - “V” Shaped Recovery
12.10.2. Argentina Counter-UAV Market by Platform - “U” Shaped Recovery
12.10.3. Argentina Counter-UAV Market by Platform - “L” Shaped Recovery
12.10.4. Argentina Counter-UAV Market by Platform - “W” Shaped Recovery
12.11. Argentina Counter-UAV Market by Type
12.11.1. Argentina Counter-UAV Market by Type - “V” Shaped Recovery
12.11.2. Argentina Counter-UAV Market by Type - “U” Shaped Recovery
12.11.3. Argentina Counter-UAV Market by Type - “L” Shaped Recovery
12.11.4. Argentina Counter-UAV Market by Type - “W” Shaped Recovery
12.12. Argentina Counter-UAV Market by Technology
12.12.1. Argentina Counter-UAV Market by Technology - “V” Shaped Recovery
12.12.2. Argentina Counter-UAV Market by Technology - “U” Shaped Recovery
12.12.3. Argentina Counter-UAV Market by Technology - “L” Shaped Recovery
12.12.4. Argentina Counter-UAV Market by Technology - “W” Shaped Recovery
12.13. Rest of Latin America
12.13.1. Rest of Latin America Counter-UAV Market Outlook - “V” Shaped Recovery
12.13.2. Rest of Latin America Counter-UAV Market Outlook - “U” Shaped Recovery
12.13.3. Rest of Latin America Counter-UAV Market Outlook - “L” Shaped Recovery
12.13.4. Rest of Latin America Counter-UAV Market Outlook - “W” Shaped Recovery
12.14. Rest of Latin America Counter-UAV Market by Platform
12.14.1. Rest of Latin America Counter-UAV Market by Platform - “V” Shaped Recovery
12.14.2. Rest of Latin America Counter-UAV Market by Platform - “U” Shaped Recovery
12.14.3. Rest of Latin America Counter-UAV Market by Platform - “L” Shaped Recovery
12.14.4. Rest of Latin America Counter-UAV Market by Platform - “W” Shaped Recovery
12.15. Rest of Latin America Counter-UAV Market by Type
12.15.1. Rest of Latin America Counter-UAV Market by Type - “V” Shaped Recovery
12.15.2. Rest of Latin America Counter-UAV Market by Type - “U” Shaped Recovery
12.15.3. Rest of Latin America Counter-UAV Market by Type - “L” Shaped Recovery
12.15.4. Rest of Latin America Counter-UAV Market by Type - “W” Shaped Recovery
12.16. Rest of Latin America Counter-UAV Market by Technology
12.16.1. Rest of Latin America Counter-UAV Market by Technology - “V” Shaped Recovery
12.16.2. Rest of Latin America Counter-UAV Market by Technology - “U” Shaped Recovery
12.16.3. Rest of Latin America Counter-UAV Market by Technology - “L” Shaped Recovery
12.16.4. Rest of Latin America Counter-UAV Market by Technology - “W” Shaped Recovery
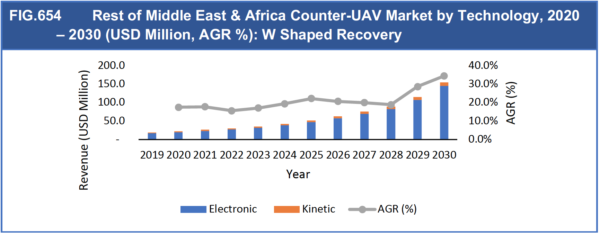
13. Middle East & Africa - Increasing government initiatives towards strengthening manufacturing and defense sector
13.1. Middle East & Africa Counter-UAV Market by Region, 2020 – 2030
13.1.1. Middle East & Africa Counter-UAV Market Outlook - “V” Shaped Recovery
13.1.2. Middle East & Africa Counter-UAV Market Outlook - “U” Shaped Recovery
13.1.3. Middle East & Africa Counter-UAV Market Outlook - “L” Shaped Recovery
13.1.4. Middle East & Africa Counter-UAV Market Outlook - “W” Shaped Recovery
13.2. Middle East & Africa Counter-UAV Market by Platform
13.2.1. Middle East & Africa Counter-UAV Market by Platform - “V” Shaped Recovery
13.2.2. Middle East & Africa Counter-UAV Market by Platform - “U” Shaped Recovery
13.2.3. Middle East & Africa Counter-UAV Market by Platform - “L” Shaped Recovery
13.2.4. Middle East & Africa Counter-UAV Market by Platform - “W” Shaped Recovery
13.3. Middle East & Africa Counter-UAV Market by Type
13.3.1. Middle East & Africa Counter-UAV Market by Type - “V” Shaped Recovery
13.3.2. Middle East & Africa Counter-UAV Market by Type - “U” Shaped Recovery
13.3.3. Middle East & Africa Counter-UAV Market by Type - “L” Shaped Recovery
13.3.4. Middle East & Africa Counter-UAV Market by Type - “W” Shaped Recovery
13.4. Middle East & Africa Counter-UAV Market by Technology
13.4.1. Middle East & Africa Counter-UAV Market by Technology - “V” Shaped Recovery
13.4.2. Middle East & Africa Counter-UAV Market by Technology - “U” Shaped Recovery
13.4.3. Middle East & Africa Counter-UAV Market by Technology - “L” Shaped Recovery
13.4.4. Middle East & Africa Counter-UAV Market by Technology - “W” Shaped Recovery
13.5. Saudi Arabia – Increasing drone attacks over the past few years
13.5.1. Saudi Arabia Counter-UAV Market Outlook - “V” Shaped Recovery
13.5.2. Saudi Arabia Counter-UAV Market Outlook - “U” Shaped Recovery
13.5.3. Saudi Arabia Counter-UAV Market Outlook - “L” Shaped Recovery
13.5.4. Saudi Arabia Counter-UAV Market Outlook - “W” Shaped Recovery
13.6. Saudi Arabia Counter-UAV Market by Platform
13.6.1. Saudi Arabia Counter-UAV Market by Platform - “V” Shaped Recovery
13.6.2. Saudi Arabia Counter-UAV Market by Platform - “U” Shaped Recovery
13.6.3. Saudi Arabia Counter-UAV Market by Platform - “L” Shaped Recovery
13.6.4. Saudi Arabia Counter-UAV Market by Platform - “W” Shaped Recovery
13.7. Saudi Arabia Counter-UAV Market by Type
13.7.1. Saudi Arabia Counter-UAV Market by Type - “V” Shaped Recovery
13.7.2. Saudi Arabia Counter-UAV Market by Type - “U” Shaped Recovery
13.7.3. Saudi Arabia Counter-UAV Market by Type - “L” Shaped Recovery
13.7.4. Saudi Arabia Counter-UAV Market by Type - “W” Shaped Recovery
13.8. Saudi Arabia Counter-UAV Market by Technology
13.8.1. Saudi Arabia Counter-UAV Market by Technology - “V” Shaped Recovery
13.8.2. Saudi Arabia Counter-UAV Market by Technology - “U” Shaped Recovery
13.8.3. Saudi Arabia Counter-UAV Market by Technology - “L” Shaped Recovery
13.8.4. Saudi Arabia Counter-UAV Market by Technology - “W” Shaped Recovery
13.9. Qatar - Qatar is planning to further develop its own drone technology
13.9.1. Qatar Counter-UAV Market Outlook - “V” Shaped Recovery
13.9.2. Qatar Counter-UAV Market Outlook - “U” Shaped Recovery
13.9.3. Qatar Counter-UAV Market Outlook - “L” Shaped Recovery
13.9.4. Qatar Counter-UAV Market Outlook - “W” Shaped Recovery
13.10. Qatar Counter-UAV Market by Platform
13.10.1. Qatar Counter-UAV Market by Platform - “V” Shaped Recovery
13.10.2. Qatar Counter-UAV Market by Platform - “U” Shaped Recovery
13.10.3. Qatar Counter-UAV Market by Platform - “L” Shaped Recovery
13.10.4. Qatar Counter-UAV Market by Platform - “W” Shaped Recovery
13.11. Qatar Counter-UAV Market by Type
13.11.1. Qatar Counter-UAV Market by Type - “V” Shaped Recovery
13.11.2. Qatar Counter-UAV Market by Type - “U” Shaped Recovery
13.11.3. Qatar Counter-UAV Market by Type - “L” Shaped Recovery
13.11.4. Qatar Counter-UAV Market by Type - “W” Shaped Recovery
13.12. Qatar Counter-UAV Market by Technology
13.12.1. Qatar Counter-UAV Market by Technology - “V” Shaped Recovery
13.12.2. Qatar Counter-UAV Market by Technology - “U” Shaped Recovery
13.12.3. Qatar Counter-UAV Market by Technology - “L” Shaped Recovery
13.12.4. Qatar Counter-UAV Market by Technology - “W” Shaped Recovery
13.13. UAE - The Middle East conflict zones are being used for testing and evaluating UAV and counter-UAV technologies from more than a dozen countries
13.13.1. UAE Counter-UAV Market Outlook - “V” Shaped Recovery
13.13.2. UAE Counter-UAV Market Outlook - “U” Shaped Recovery
13.13.3. UAE Counter-UAV Market Outlook - “L” Shaped Recovery
13.13.4. UAE Counter-UAV Market Outlook - “W” Shaped Recovery
13.14. UAE Counter-UAV Market by Platform
13.14.1. UAE Counter-UAV Market by Platform - “V” Shaped Recovery
13.14.2. UAE Counter-UAV Market by Platform - “U” Shaped Recovery
13.14.3. UAE Counter-UAV Market by Platform - “L” Shaped Recovery
13.14.4. UAE Counter-UAV Market by Platform - “W” Shaped Recovery
13.15. UAE Counter-UAV Market by Type
13.15.1. UAE Counter-UAV Market by Type - “V” Shaped Recovery
13.15.2. UAE Counter-UAV Market by Type - “U” Shaped Recovery
13.15.3. UAE Counter-UAV Market by Type - “L” Shaped Recovery
13.15.4. UAE Counter-UAV Market by Type - “W” Shaped Recovery
13.16. UAE Counter-UAV Market by Technology
13.16.1. UAE Counter-UAV Market by Technology - “V” Shaped Recovery
13.16.2. UAE Counter-UAV Market by Technology - “U” Shaped Recovery
13.16.3. UAE Counter-UAV Market by Technology - “L” Shaped Recovery
13.16.4. UAE Counter-UAV Market by Technology - “W” Shaped Recovery
13.17. Iraq - A spate of drone attacks in Syria, Iraq, Saudi Arabia, Yemen and now Lebanon has raised the specter of a new era of conflict in the region
13.17.1. Iraq Counter-UAV Market Outlook - “V” Shaped Recovery
13.17.2. Iraq Counter-UAV Market Outlook - “U” Shaped Recovery
13.17.3. Iraq Counter-UAV Market Outlook - “L” Shaped Recovery
13.17.4. Iraq Counter-UAV Market Outlook - “W” Shaped Recovery
13.18. Iraq Counter-UAV Market by Platform
13.18.1. Iraq Counter-UAV Market by Platform - “V” Shaped Recovery
13.18.2. Iraq Counter-UAV Market by Platform - “U” Shaped Recovery
13.18.3. Iraq Counter-UAV Market by Platform - “L” Shaped Recovery
13.18.4. Iraq Counter-UAV Market by Platform - “W” Shaped Recovery
13.19. Iraq Counter-UAV Market by Type
13.19.1. Iraq Counter-UAV Market by Type - “V” Shaped Recovery
13.19.2. Iraq Counter-UAV Market by Type - “U” Shaped Recovery
13.19.3. Iraq Counter-UAV Market by Type - “L” Shaped Recovery
13.19.4. Iraq Counter-UAV Market by Type - “W” Shaped Recovery
13.20. Iraq Counter-UAV Market by Technology
13.20.1. Iraq Counter-UAV Market by Technology - “V” Shaped Recovery
13.20.2. Iraq Counter-UAV Market by Technology - “U” Shaped Recovery
13.20.3. Iraq Counter-UAV Market by Technology - “L” Shaped Recovery
13.20.4. Iraq Counter-UAV Market by Technology - “W” Shaped Recovery
13.21. Egypt
13.21.1. Egypt Counter-UAV Market Outlook - “V” Shaped Recovery
13.21.2. Egypt Counter-UAV Market Outlook - “U” Shaped Recovery
13.21.3. Egypt Counter-UAV Market Outlook - “L” Shaped Recovery
13.21.4. Egypt Counter-UAV Market Outlook - “W” Shaped Recovery
13.22. Egypt Counter-UAV Market by Platform
13.22.1. Egypt Counter-UAV Market by Platform - “V” Shaped Recovery
13.22.2. Egypt Counter-UAV Market by Platform - “U” Shaped Recovery
13.22.3. Egypt Counter-UAV Market by Platform - “L” Shaped Recovery
13.22.4. Egypt Counter-UAV Market by Platform - “W” Shaped Recovery
13.23. Egypt Counter-UAV Market by Type
13.23.1. Egypt Counter-UAV Market by Type - “V” Shaped Recovery
13.23.2. Egypt Counter-UAV Market by Type - “U” Shaped Recovery
13.23.3. Egypt Counter-UAV Market by Type - “L” Shaped Recovery
13.23.4. Egypt Counter-UAV Market by Type - “W” Shaped Recovery
13.24. Egypt Counter-UAV Market by Technology
13.24.1. Egypt Counter-UAV Market by Technology - “V” Shaped Recovery
13.24.2. Egypt Counter-UAV Market by Technology - “U” Shaped Recovery
13.24.3. Egypt Counter-UAV Market by Technology - “L” Shaped Recovery
13.24.4. Egypt Counter-UAV Market by Technology - “W” Shaped Recovery
13.25. Rest of Middle East & Africa
13.25.1. Rest of Middle East & Africa Counter-UAV Market Outlook - “V” Shaped Recovery
13.25.2. Rest of Middle East & Africa Counter-UAV Market Outlook - “U” Shaped Recovery
13.25.3. Rest of Middle East & Africa Counter-UAV Market Outlook - “L” Shaped Recovery
13.25.4. Rest of Middle East & Africa Counter-UAV Market Outlook - “W” Shaped Recovery
13.26. Rest of Middle East & Africa Counter-UAV Market by Platform
13.26.1. Rest of Middle East & Africa Counter-UAV Market by Platform - “V” Shaped Recovery
13.26.2. Rest of Middle East & Africa Counter-UAV Market by Platform - “U” Shaped Recovery
13.26.3. Rest of Middle East & Africa Counter-UAV Market by Platform - “L” Shaped Recovery
13.26.4. Rest of Middle East & Africa Counter-UAV Market by Platform - “W” Shaped Recovery
13.27. Rest of Middle East & Africa Counter-UAV Market by Type
13.27.1. Rest of Middle East & Africa Counter-UAV Market by Type - “V” Shaped Recovery
13.27.2. Rest of Middle East & Africa Counter-UAV Market by Type - “U” Shaped Recovery
13.27.3. Rest of Middle East & Africa Counter-UAV Market by Type - “L” Shaped Recovery
13.27.4. Rest of Middle East & Africa Counter-UAV Market by Type - “W” Shaped Recovery
13.28. Rest of Middle East & Africa Counter-UAV Market by Technology
13.28.1. Rest of Middle East & Africa Counter-UAV Market by Technology - “V” Shaped Recovery
13.28.2. Rest of Middle East & Africa Counter-UAV Market by Technology - “U” Shaped Recovery
13.28.3. Rest of Middle East & Africa Counter-UAV Market by Technology - “L” Shaped Recovery
13.28.4. Rest of Middle East & Africa Counter-UAV Market by Technology - “W” Shaped Recovery
14. Company Profiles
14.1. Leading Counter UAV Companies
14.2. Boeing Company
14.2.1. Company Overview
14.2.2. Product Benchmarking
14.2.3. Boeing Company: Recent Expansion, Product Launch, Investment, Merger & Acquisition (2017 – 2019)
14.2.4. Financials
14.2.5. Boeing Company: SWOT Analysis
14.3. Airbus Group SE
14.3.1. Company Overview
14.3.2. Product Benchmarking
14.3.3. Airbus Group SE: Recent Expansion, Product Launch, Investment, Merger & Acquisition (2016 – 2020)
14.3.4. Financials
14.3.5. Airbus Group SE: SWOT Analysis
14.4. Saab AB
14.4.1. Company Overview
14.4.2. Product Benchmarking
14.4.3. Saab AB: Recent Expansion, Product Launch, Investment, Merger & Acquisition (2017 – 2020)
14.4.4. Financials
14.4.5. Saab AB: SWOT Analysis
14.5. Thales Group
14.5.1. Company Overview
14.5.2. Product Benchmarking
14.5.3. Thales Group: Recent Expansion, Product Launch, Investment, Merger & Acquisition (2017 – 2020)
14.5.4. Financials
14.5.5. Thales Group: SWOT Analysis
14.6. Lockheed Martin
14.6.1. Company Overview
14.6.2. Product Benchmarking
14.6.3. Lockheed Martin: Recent Expansion, Product Launch, Investment, Merger & Acquisition (2017 – 2020)
14.6.4. Financials
14.6.5. Lockheed Martin: SWOT Analysis
14.7. Israel Aerospace Industries
14.7.1. Company Overview
14.7.2. Product Benchmarking
14.7.3. Israel Aerospace Industries: Recent Expansion, Product Launch, Investment, Merger & Acquisition (2017 – 2020)
14.7.4. Financials
14.7.5. Israel Aerospace Industries: SWOT Analysis
14.8. Raytheon Company
14.8.1. Company Overview
14.8.2. Product Benchmarking
14.8.3. Raytheon Company: Recent Expansion, Product Launch, Investment, Merger & Acquisition (2016 – 2020)
14.8.4. Financials
14.9. Northrop Grumman Corporation
14.9.1. Company Overview
14.9.2. Product Benchmarking
14.9.3. Northrop Grumman Corporation: Recent Expansion, Product Launch, Investment, Merger & Acquisition (2017 – 2020)
14.9.4. Financials
14.9.5. Northrop Grumman Corporation: SWOT Analysis
14.10. Rafael Advanced Defense Systems
14.10.1. Company Overview
14.10.2. Product Benchmarking
14.10.3. Rafael Advanced Defense Systems: Recent Expansion, Product Launch, Investment, Merger & Acquisition (2017 – 2020)
14.10.4. Financials
14.11. Rheinmetall AG
14.11.1. Company Overview
14.11.2. Product Benchmarking
14.11.3. Rheinmetall AG: Recent Expansion, Product Launch, Investment, Merger & Acquisition (2019 – 2020)
14.11.4. Financials
14.12. Hensoldt GmbH
14.12.1. Company Overview
14.12.2. Product Benchmarking
14.12.3. Hensoldt GmbH: Recent Expansion, Product Launch, Investment, Merger & Acquisition (2017 – 2020)
14.12.4. Financials
14.13. Blighter Surveillance Systems
14.13.1. Company Overview
14.13.2. Product Benchmarking
14.13.3. Blighter Surveillance Systems: Recent Expansion, Product Launch, Investment, Merger & Acquisition (2015 – 2019)
14.14. DroneShield, LLC
14.14.1. Company Overview
14.14.2. Product Benchmarking
14.14.3. DroneShield, LLC: Recent Expansion, Product Launch, Investment, Merger & Acquisition (2016 – 2020)
14.15. Radio Hill Technologies
14.15.1. Company Overview
14.15.2. Product Benchmarking
14.15.3. Radio Hill Technologies: Recent Expansion, Product Launch, Investment, Merger & Acquisition (2017 – 2019)
14.16. Battelle
14.16.1. Company Overview
14.16.2. Product Benchmarking
14.16.3. Battelle: Recent Expansion, Product Launch, Investment, Merger & Acquisition (2017 – 2019)
14.17. My Defence
14.17.1. Company Overview
14.17.2. Product Benchmarking
14.17.3. My Defence: Recent Expansion, Product Launch, Investment, Merger & Acquisition (2018 – 2020)
14.18. White Fox
14.18.1. Company Overview
14.18.2. Product Benchmarking
14.18.3. White Fox: Recent Expansion, Product Launch, Investment, Merger & Acquisition (2018)
14.19. Department 13
14.19.1. Company Overview
14.19.2. Product Benchmarking
14.19.3. Department 13: Recent Expansion, Product Launch, Investment, Merger & Acquisition (2017 – 2020)
14.20. Black Sage Technologies
14.20.1. Company Overview
14.20.2. Product Benchmarking
14.20.3. Black Sage Technologies: Recent Expansion, Product Launch, Investment, Merger & Acquisition (2019)
14.21. L-3Harris Technologies
14.21.1. Company Overview
14.21.2. Product Benchmarking
14.21.3. L-3Harris Technologies: Recent Expansion, Product Launch, Investment, Merger & Acquisition (2016 – 2020)
14.21.4. Financials
14.22. Liteye Systems
14.22.1. Company Overview
14.22.2. Product Benchmarking
14.22.3. Liteye Systems: Recent Expansion, Product Launch, Investment, Merger & Acquisition
14.23. SCG Security & Counterintelligence Group
14.23.1. Company Overview
14.23.2. Product Benchmarking
14.23.3. SCG Security & Counterintelligence Group: Recent Expansion, Product Launch, Investment, Merger & Acquisition (2016 – 2020)
14.24. Theiss UAV Solutions
14.24.1. Company Overview
14.24.2. Product Benchmarking
14.25. Aaronia AG
14.25.1. Company Overview
14.25.2. Product Benchmarking
14.25.3. Aaronia AG: Recent Expansion, Product Launch, Investment, Merger & Acquisition (2018 – 2020)
14.26. Other Companies Involved in the Counter UAV (C-UAV) Market
15. Conclusion & Recommendations
16. Glossary
17. Appendix
17.1. Visiongain report evaluation form
List of Figures
FIG.1 Counter-UAV Market Size, 2020 – 2030 (USD Million, AGR %)
FIG.2 Counter-UAV Industry: Segmentation and Scope
FIG.3 Counter-UAV Industry: Market Drivers
FIG.4 Counter-UAV Industry: Market Dynamics
FIG.5 Counter-UAV Industry: Porter’s Five Forces Analysis
FIG.6 Global Counter-UAV Market Size by Platform, 2020 – 2030 (USD Million, AGR %)
FIG.7 Global Counter-UAV Market Size by Platform, 2020 – 2030 (USD Million, AGR %): V Shaped Recovery
FIG.8 Global Counter-UAV Market Size by Platform, 2020 – 2030 (USD Million, AGR %): U Shaped Recovery
FIG.9 Global Counter-UAV Market Size by Platform, 2020 – 2030 (USD Million, AGR %): L Shaped Recovery
FIG.10 Global Counter-UAV Market Size by Platform, 2020 – 2030 (USD Million, AGR %): W Shaped Recovery
FIG.11 Global Counter-UAV Market Share by Platform, 2020, 2025, 2030 (%)
FIG.12 Counter-UAV for Defense Market Value Forecast, 2020 – 2030 (USD Million, AGR %)
FIG.13 Counter-UAV for Defense Market Value Forecast, 2020 – 2030 (USD Million, AGR %): V Shaped Recovery
FIG.14 Counter-UAV for Defense Market Value Forecast, 2020 – 2030 (USD Million, AGR %): U Shaped Recovery
FIG.15 Counter-UAV for Defense Market Value Forecast, 2020 – 2030 (USD Million, AGR %): L Shaped Recovery
FIG.16 Counter-UAV for Defense Market Value Forecast, 2020 – 2030 (USD Million, AGR %): W Shaped Recovery
FIG.17 Counter-UAV for Commercial Market Value Forecast, 2020 – 2030 (USD Million, AGR %)
FIG.18 Counter-UAV for Commercial Market Value Forecast, 2020 – 2030 (USD Million, AGR %): V Shaped Recovery
FIG.19 Counter-UAV for Commercial Market Value Forecast, 2020 – 2030 (USD Million, AGR %): U Shaped Recovery
FIG.20 Counter-UAV for Commercial Market Value Forecast, 2020 – 2030 (USD Million, AGR %): L Shaped Recovery
FIG.21 Counter-UAV for Commercial Market Value Forecast, 2020 – 2030 (USD Million, AGR %): W Shaped Recovery
FIG.22 Global Counter-UAV Market Size by Type, 2020 – 2030 (USD Million, AGR %)
FIG.23 Global Counter-UAV Market Size by Type, 2020 – 2030 (USD Million, AGR %): V Shaped Recovery
FIG.24 Global Counter-UAV Market Size by Type, 2020 – 2030 (USD Million, AGR %): U Shaped Recovery
FIG.25 Global Counter-UAV Market Size by Type, 2020 – 2030 (USD Million, AGR %): L Shaped Recovery
FIG.26 Global Counter-UAV Market Size by Type, 2020 – 2030 (USD Million, AGR %): W Shaped Recovery
FIG.27 Global Counter-UAV Market Share by Type, 2020, 2025, 2030 (%)
FIG.28 Counter-UAV for Detection Market Value Forecast, 2020 – 2030 (USD Million, AGR %)
FIG.29 Counter-UAV for Detection Market Value Forecast, 2020 – 2030 (USD Million, AGR %): V Shaped Recovery
FIG.30 Counter-UAV for Detection Market Value Forecast, 2020 – 2030 (USD Million, AGR %): U Shaped Recovery
FIG.31 Counter-UAV for Detection Market Value Forecast, 2020 – 2030 (USD Million, AGR %): L Shaped Recovery
FIG.32 Counter-UAV for Detection Market Value Forecast, 2020 – 2030 (USD Million, AGR %): W Shaped Recovery
FIG.33 Global Counter-UAV Market by Detection Type, 2020 – 2030 (USD Million, AGR %)
FIG.34 Global Counter-UAV Market by Detection Type, 2020 – 2030 (USD Million, AGR %): V Shaped Recovery
FIG.35 Global Counter-UAV Market by Detection Type, 2020 – 2030 (USD Million, AGR %): U Shaped Recovery
FIG.36 Global Counter-UAV Market by Detection Type, 2020 – 2030 (USD Million, AGR %): L Shaped Recovery
FIG.37 Global Counter-UAV Market by Detection Type, 2020 – 2030 (USD Million, AGR %): W Shaped Recovery
FIG.38 Counter-UAV for Countermeasure Market Value Forecast, 2020 – 2030 (USD Million, AGR %)
FIG.39 Counter-UAV for Countermeasure Market Value Forecast, 2020 – 2030 (USD Million, AGR %): V Shaped Recovery
FIG.40 Counter-UAV for Countermeasure Market Value Forecast, 2020 – 2030 (USD Million, AGR %): U Shaped Recovery
FIG.41 Counter-UAV for Countermeasure Market Value Forecast, 2020 – 2030 (USD Million, AGR %): L Shaped Recovery
FIG.42 Counter-UAV for Countermeasure Market Value Forecast, 2020 – 2030 (USD Million, AGR %): W Shaped Recovery
FIG.43 Global Counter-UAV Market by Countermeasure Type, 2020 – 2030 (USD Million, AGR %)
FIG.44 Global Counter-UAV Market by Countermeasure Type, 2020 – 2030 (USD Million, AGR %): V Shaped Recovery
FIG.45 Global Counter-UAV Market by Countermeasure Type, 2020 – 2030 (USD Million, AGR %): U Shaped Recovery
FIG.46 Global Counter-UAV Market by Countermeasure Type, 2020 – 2030 (USD Million, AGR %): L Shaped Recovery
FIG.47 Global Counter-UAV Market by Countermeasure Type, 2020 – 2030 (USD Million, AGR %): W Shaped Recovery
FIG.48 Global Counter-UAV Market Size by Technology, 2020 – 2030 (USD Million, AGR %)
FIG.49 Global Counter-UAV Market Size by Technology, 2020 – 2030 (USD Million, AGR %): V Shaped Recovery
FIG.50 Global Counter-UAV Market Size by Technology, 2020 – 2030 (USD Million, AGR %): U Shaped Recovery
FIG.51 Global Counter-UAV Market Size by Technology, 2020 – 2030 (USD Million, AGR %): L Shaped Recovery
FIG.52 Global Counter-UAV Market Size by Technology, 2020 – 2030 (USD Million, AGR %): W Shaped Recovery
FIG.53 Global Counter-UAV Market Share by Technology, 2020, 2025, 2030 (%)
FIG.54 Counter-UAV for Electronic Market Value Forecast, 2020 – 2030 (USD Million, AGR %)
FIG.55 Counter-UAV for Electronic Market Value Forecast, 2020 – 2030 (USD Million, AGR %): V Shaped Recovery
FIG.56 Counter-UAV for Electronic Market Value Forecast, 2020 – 2030 (USD Million, AGR %): U Shaped Recovery
FIG.57 Counter-UAV for Electronic Market Value Forecast, 2020 – 2030 (USD Million, AGR %): L Shaped Recovery
FIG.58 Counter-UAV for Electronic Market Value Forecast, 2020 – 2030 (USD Million, AGR %): W Shaped Recovery
FIG.59 Counter-UAV for Kinetic Market Value Forecast, 2020 – 2030 (USD Million, AGR %)
FIG.60 Counter-UAV for Kinetic Market Value Forecast, 2020 – 2030 (USD Million, AGR %): V Shaped Recovery
FIG.61 Counter-UAV for Kinetic Market Value Forecast, 2020 – 2030 (USD Million, AGR %): U Shaped Recovery
FIG.62 Counter-UAV for Kinetic Market Value Forecast, 2020 – 2030 (USD Million, AGR %): L Shaped Recovery
FIG.63 Counter-UAV for Kinetic Market Value Forecast, 2020 – 2030 (USD Million, AGR %): W Shaped Recovery
FIG.64 Global Counter-UAV Market Size by Region, 2020 – 2030 (USD Million, AGR %)
FIG.65 Global Counter-UAV Market Size by Region, 2020 – 2030 (USD Million, AGR %): V Shaped Recovery
FIG.66 Global Counter-UAV Market Size by Region, 2020 – 2030 (USD Million, AGR %): U Shaped Recovery
FIG.67 Global Counter-UAV Market Size by Region, 2020 – 2030 (USD Million, AGR %): L Shaped Recovery
FIG.68 Global Counter-UAV Market Size by Region, 2020 – 2030 (USD Million, AGR %): W Shaped Recovery
FIG.69 Global Counter-UAV Market Share by Region, 2020, 2025, 2030 (%)
FIG.70 North America Counter-UAV Market Value Forecast, 2020 – 2030 (USD Million, AGR %)
FIG.71 North America Counter-UAV Market Value Forecast, 2020 – 2030 (USD Million, AGR %): V Shaped Recovery
FIG.72 North America Counter-UAV Market Value Forecast, 2020 – 2030 (USD Million, AGR %): U Shaped Recovery
FIG.73 North America Counter-UAV Market Value Forecast, 2020 – 2030 (USD Million, AGR %): L Shaped Recovery
FIG.74 North America Counter-UAV Market Value Forecast, 2020 – 2030 (USD Million, AGR %): W Shaped Recovery
FIG.75 North America Counter-UAV Market Share by Country, 2020, 2025, 2030 (%)
FIG.76 North America Counter-UAV Market by Platform, 2020 – 2030 (USD Million, AGR %)
FIG.77 North America Counter-UAV Market by Platform, 2020 – 2030 (USD Million, AGR %): V Shaped Recovery
FIG.78 North America Counter-UAV Market by Platform, 2020 – 2030 (USD Million, AGR %): U Shaped Recovery
FIG.79 North America Counter-UAV Market by Platform, 2020 – 2030 (USD Million, AGR %): L Shaped Recovery
FIG.80 North America Counter-UAV Market by Platform, 2020 – 2030 (USD Million, AGR %): W Shaped Recovery
FIG.81 North America Counter-UAV Market by Type, 2020 – 2030 (USD Million, AGR %)
FIG.82 North America Counter-UAV Market by Type, 2020 – 2030 (USD Million, AGR %): V Shaped Recovery
FIG.83 North America Counter-UAV Market by Type, 2020 – 2030 (USD Million, AGR %): U Shaped Recovery
FIG.84 North America Counter-UAV Market by Type, 2020 – 2030 (USD Million, AGR %): L Shaped Recovery
FIG.85 North America Counter-UAV Market by Type, 2020 – 2030 (USD Million, AGR %): W Shaped Recovery
FIG.86 North America Counter-UAV Market by Technology, 2020 – 2030 (USD Million, AGR %)
FIG.87 North America Counter-UAV Market by Technology, 2020 – 2030 (USD Million, AGR %): V Shaped Recovery
FIG.88 North America Counter-UAV Market by Technology, 2020 – 2030 (USD Million, AGR %): U Shaped Recovery
FIG.89 North America Counter-UAV Market by Technology, 2020 – 2030 (USD Million, AGR %): L Shaped Recovery
FIG.90 North America Counter-UAV Market by Technology, 2020 – 2030 (USD Million, AGR %): W Shaped Recovery
FIG.91 U.S. Counter-UAV Market Value Forecast, 2020 – 2030 (USD Million, AGR %)
FIG.92 U.S. Counter-UAV Market Value Forecast, 2020 – 2030 (USD Million, AGR %): V Shaped Recovery
FIG.93 U.S. Counter-UAV Market Value Forecast, 2020 – 2030 (USD Million, AGR %): U Shaped Recovery
FIG.94 U.S. Counter-UAV Market Value Forecast, 2020 – 2030 (USD Million, AGR %): L Shaped Recovery
FIG.95 U.S. Counter-UAV Market Value Forecast, 2020 – 2030 (USD Million, AGR %): W Shaped Recovery
FIG.96 U.S. Counter-UAV Market by Platform, 2020 – 2030 (USD Million, AGR %)
FIG.97 U.S. Counter-UAV Market by Platform, 2020 – 2030 (USD Million, AGR %): V Shaped Recovery
FIG.98 U.S. Counter-UAV Market by Platform, 2020 – 2030 (USD Million, AGR %): U Shaped Recovery
FIG.99 U.S. Counter-UAV Market by Platform, 2020 – 2030 (USD Million, AGR %): L Shaped Recovery
FIG.100 U.S. Counter-UAV Market by Platform, 2020 – 2030 (USD Million, AGR %): W Shaped Recovery
FIG.101 U.S. Counter-UAV Market by Type, 2020 – 2030 (USD Million, AGR %)
FIG.102 U.S. Counter-UAV Market by Type, 2020 – 2030 (USD Million, AGR %): V Shaped Recovery
FIG.103 U.S. Counter-UAV Market by Type, 2020 – 2030 (USD Million, AGR %): U Shaped Recovery
FIG.104 U.S. Counter-UAV Market by Type, 2020 – 2030 (USD Million, AGR %): L Shaped Recovery
FIG.105 U.S. Counter-UAV Market by Type, 2020 – 2030 (USD Million, AGR %): W Shaped Recovery
FIG.106 U.S. Counter-UAV Market by Technology, 2020 – 2030 (USD Million, AGR %)
FIG.107 U.S. Counter-UAV Market by Technology, 2020 – 2030 (USD Million, AGR %): V Shaped Recovery
FIG.108 U.S. Counter-UAV Market by Technology, 2020 – 2030 (USD Million, AGR %): U Shaped Recovery
FIG.109 U.S. Counter-UAV Market by Technology, 2020 – 2030 (USD Million, AGR %): L Shaped Recovery
FIG.110 U.S. Counter-UAV Market by Technology, 2020 – 2030 (USD Million, AGR %): W Shaped Recovery
FIG.111 Canada Counter-UAV Market Value Forecast, 2020 – 2030 (USD Million, AGR %)
FIG.112 Canada Counter-UAV Market Value Forecast, 2020 – 2030 (USD Million, AGR %): V Shaped Recovery
FIG.113 Canada Counter-UAV Market Value Forecast, 2020 – 2030 (USD Million, AGR %): U Shaped Recovery
FIG.114 Canada Counter-UAV Market Value Forecast, 2020 – 2030 (USD Million, AGR %): L Shaped Recovery
FIG.115 Canada Counter-UAV Market Value Forecast, 2020 – 2030 (USD Million, AGR %): W Shaped Recovery
FIG.116 Canada Counter-UAV Market by Platform, 2020 – 2030 (USD Million, AGR %)
FIG.117 Canada Counter-UAV Market by Platform, 2020 – 2030 (USD Million, AGR %): V Shaped Recovery
FIG.118 Canada Counter-UAV Market by Platform, 2020 – 2030 (USD Million, AGR %): U Shaped Recovery
FIG.119 Canada Counter-UAV Market by Platform, 2020 – 2030 (USD Million, AGR %): L Shaped Recovery
FIG.120 Canada Counter-UAV Market by Platform, 2020 – 2030 (USD Million, AGR %): W Shaped Recovery
FIG.121 Canada Counter-UAV Market by Type, 2020 – 2030 (USD Million, AGR %)
FIG.122 Canada Counter-UAV Market by Type, 2020 – 2030 (USD Million, AGR %): V Shaped Recovery
FIG.123 Canada Counter-UAV Market by Type, 2020 – 2030 (USD Million, AGR %): U Shaped Recovery
FIG.124 Canada Counter-UAV Market by Type, 2020 – 2030 (USD Million, AGR %): L Shaped Recovery
FIG.125 Canada Counter-UAV Market by Type, 2020 – 2030 (USD Million, AGR %): W Shaped Recovery
FIG.126 Canada Counter-UAV Market by Technology, 2020 – 2030 (USD Million, AGR %)
FIG.127 Canada Counter-UAV Market by Technology, 2020 – 2030 (USD Million, AGR %): V Shaped Recovery
FIG.128 Canada Counter-UAV Market by Technology, 2020 – 2030 (USD Million, AGR %): U Shaped Recovery
FIG.129 Canada Counter-UAV Market by Technology, 2020 – 2030 (USD Million, AGR %): L Shaped Recovery
FIG.130 Canada Counter-UAV Market by Technology, 2020 – 2030 (USD Million, AGR %): W Shaped Recovery
FIG.131 Europe Counter-UAV Market Value Forecast, 2020 – 2030 (USD Million, AGR %)
FIG.132 Europe Counter-UAV Market Value Forecast, 2020 – 2030 (USD Million, AGR %): V Shaped Recovery
FIG.133 Europe Counter-UAV Market Value Forecast, 2020 – 2030 (USD Million, AGR %): U Shaped Recovery
FIG.134 Europe Counter-UAV Market Value Forecast, 2020 – 2030 (USD Million, AGR %): L Shaped Recovery
FIG.135 Europe Counter-UAV Market Value Forecast, 2020 – 2030 (USD Million, AGR %): W Shaped Recovery
FIG.136 Europe Counter-UAV Market Share by Country, 2020, 2025, 2030 (%)
FIG.137 Europe Counter-UAV Market by Platform, 2020 – 2030 (USD Million, AGR %)
FIG.138 Europe Counter-UAV Market by Platform, 2020 – 2030 (USD Million, AGR %): V Shaped Recovery
FIG.139 Europe Counter-UAV Market by Platform, 2020 – 2030 (USD Million, AGR %): U Shaped Recovery
FIG.140 Europe Counter-UAV Market by Platform, 2020 – 2030 (USD Million, AGR %): L Shaped Recovery
FIG.141 Europe Counter-UAV Market by Platform, 2020 – 2030 (USD Million, AGR %): W Shaped Recovery
FIG.142 Europe Counter-UAV Market by Type, 2020 – 2030 (USD Million, AGR %)
FIG.143 Europe Counter-UAV Market by Type, 2020 – 2030 (USD Million, AGR %): V Shaped Recovery
FIG.144 Europe Counter-UAV Market by Type, 2020 – 2030 (USD Million, AGR %): U Shaped Recovery
FIG.145 Europe Counter-UAV Market by Type, 2020 – 2030 (USD Million, AGR %): L Shaped Recovery
FIG.146 Europe Counter-UAV Market by Type, 2020 – 2030 (USD Million, AGR %): W Shaped Recovery
FIG.147 Europe Counter-UAV Market by Technology, 2020 – 2030 (USD Million, AGR %)
FIG.148 Europe Counter-UAV Market by Technology, 2020 – 2030 (USD Million, AGR %): V Shaped Recovery
FIG.149 Europe Counter-UAV Market by Technology, 2020 – 2030 (USD Million, AGR %): U Shaped Recovery
FIG.150 Europe Counter-UAV Market by Technology, 2020 – 2030 (USD Million, AGR %): L Shaped Recovery
FIG.151 Europe Counter-UAV Market by Technology, 2020 – 2030 (USD Million, AGR %): W Shaped Recovery
FIG.152 UK Counter-UAV Market Value Forecast, 2020 – 2030 (USD Million, AGR %)
FIG.153 UK Counter-UAV Market Value Forecast, 2020 – 2030 (USD Million, AGR %): V Shaped Recovery
FIG.154 UK Counter-UAV Market Value Forecast, 2020 – 2030 (USD Million, AGR %): U Shaped Recovery
FIG.155 UK Counter-UAV Market Value Forecast, 2020 – 2030 (USD Million, AGR %): L Shaped Recovery
FIG.156 UK Counter-UAV Market Value Forecast, 2020 – 2030 (USD Million, AGR %): W Shaped Recovery
FIG.157 UK Counter-UAV Market by Platform, 2020 – 2030 (USD Million, AGR %)
FIG.158 UK Counter-UAV Market by Platform, 2020 – 2030 (USD Million, AGR %): V Shaped Recovery
FIG.159 UK Counter-UAV Market by Platform, 2020 – 2030 (USD Million, AGR %): U Shaped Recovery
FIG.160 UK Counter-UAV Market by Platform, 2020 – 2030 (USD Million, AGR %): L Shaped Recovery
FIG.161 UK Counter-UAV Market by Platform, 2020 – 2030 (USD Million, AGR %): W Shaped Recovery
FIG.162 UK Counter-UAV Market by Type, 2020 – 2030 (USD Million, AGR %)
FIG.163 UK Counter-UAV Market by Type, 2020 – 2030 (USD Million, AGR %): V Shaped Recovery
FIG.164 UK Counter-UAV Market by Type, 2020 – 2030 (USD Million, AGR %): U Shaped Recovery
FIG.165 UK Counter-UAV Market by Type, 2020 – 2030 (USD Million, AGR %): L Shaped Recovery
FIG.166 UK Counter-UAV Market by Type, 2020 – 2030 (USD Million, AGR %): W Shaped Recovery
FIG.167 UK Counter-UAV Market by Technology, 2020 – 2030 (USD Million, AGR %)
FIG.168 UK Counter-UAV Market by Technology, 2020 – 2030 (USD Million, AGR %): V Shaped Recovery
FIG.169 UK Counter-UAV Market by Technology, 2020 – 2030 (USD Million, AGR %): U Shaped Recovery
FIG.170 UK Counter-UAV Market by Technology, 2020 – 2030 (USD Million, AGR %): L Shaped Recovery
FIG.171 UK Counter-UAV Market by Technology, 2020 – 2030 (USD Million, AGR %): W Shaped Recovery
FIG.172 Germany Counter-UAV Market Value Forecast, 2020 – 2030 (USD Million, AGR %)
FIG.173 Germany Counter-UAV Market Value Forecast, 2020 – 2030 (USD Million, AGR %): V Shaped Recovery
FIG.174 Germany Counter-UAV Market Value Forecast, 2020 – 2030 (USD Million, AGR %): U Shaped Recovery
FIG.175 Germany Counter-UAV Market Value Forecast, 2020 – 2030 (USD Million, AGR %): L Shaped Recovery
FIG.176 Germany Counter-UAV Market Value Forecast, 2020 – 2030 (USD Million, AGR %): W Shaped Recovery
FIG.177 Germany Counter-UAV Market by Platform, 2020 – 2030 (USD Million, AGR %)
FIG.178 Germany Counter-UAV Market by Platform, 2020 – 2030 (USD Million, AGR %): V Shaped Recovery
FIG.179 Germany Counter-UAV Market by Platform, 2020 – 2030 (USD Million, AGR %): U Shaped Recovery
FIG.180 Germany Counter-UAV Market by Platform, 2020 – 2030 (USD Million, AGR %): L Shaped Recovery
FIG.181 Germany Counter-UAV Market by Platform, 2020 – 2030 (USD Million, AGR %): W Shaped Recovery
FIG.182 Germany Counter-UAV Market by Type, 2020 – 2030 (USD Million, AGR %)
FIG.183 Germany Counter-UAV Market by Type, 2020 – 2030 (USD Million, AGR %): V Shaped Recovery
FIG.184 Germany Counter-UAV Market by Type, 2020 – 2030 (USD Million, AGR %): U Shaped Recovery
FIG.185 Germany Counter-UAV Market by Type, 2020 – 2030 (USD Million, AGR %): L Shaped Recovery
FIG.186 Germany Counter-UAV Market by Type, 2020 – 2030 (USD Million, AGR %): W Shaped Recovery
FIG.187 Germany Counter-UAV Market by Technology, 2020 – 2030 (USD Million, AGR %)
FIG.188 Germany Counter-UAV Market by Technology, 2020 – 2030 (USD Million, AGR %): V Shaped Recovery
FIG.189 Germany Counter-UAV Market by Technology, 2020 – 2030 (USD Million, AGR %): U Shaped Recovery
FIG.190 Germany Counter-UAV Market by Technology, 2020 – 2030 (USD Million, AGR %): L Shaped Recovery
FIG.191 Germany Counter-UAV Market by Technology, 2020 – 2030 (USD Million, AGR %): W Shaped Recovery
FIG.192 France Counter-UAV Market Value Forecast, 2020 – 2030 (USD Million, AGR %)
FIG.193 France Counter-UAV Market Value Forecast, 2020 – 2030 (USD Million, AGR %): V Shaped Recovery
FIG.194 France Counter-UAV Market Value Forecast, 2020 – 2030 (USD Million, AGR %): U Shaped Recovery
FIG.195 France Counter-UAV Market Value Forecast, 2020 – 2030 (USD Million, AGR %): L Shaped Recovery
FIG.196 France Counter-UAV Market Value Forecast, 2020 – 2030 (USD Million, AGR %): W Shaped Recovery
FIG.197 France Counter-UAV Market by Platform, 2020 – 2030 (USD Million, AGR %)
FIG.198 France Counter-UAV Market by Platform, 2020 – 2030 (USD Million, AGR %): V Shaped Recovery
FIG.199 France Counter-UAV Market by Platform, 2020 – 2030 (USD Million, AGR %): U Shaped Recovery
FIG.200 France Counter-UAV Market by Platform, 2020 – 2030 (USD Million, AGR %): L Shaped Recovery
FIG.201 France Counter-UAV Market by Platform, 2020 – 2030 (USD Million, AGR %): W Shaped Recovery
FIG.202 France Counter-UAV Market by Type, 2020 – 2030 (USD Million, AGR %)
FIG.203 France Counter-UAV Market by Type, 2020 – 2030 (USD Million, AGR %): V Shaped Recovery
FIG.204 France Counter-UAV Market by Type, 2020 – 2030 (USD Million, AGR %): U Shaped Recovery
FIG.205 France Counter-UAV Market by Type, 2020 – 2030 (USD Million, AGR %): L Shaped Recovery
FIG.206 France Counter-UAV Market by Type, 2020 – 2030 (USD Million, AGR %): W Shaped Recovery
FIG.207 France Counter-UAV Market by Technology, 2020 – 2030 (USD Million, AGR %)
FIG.208 France Counter-UAV Market by Technology, 2020 – 2030 (USD Million, AGR %): V Shaped Recovery
FIG.209 France Counter-UAV Market by Technology, 2020 – 2030 (USD Million, AGR %): U Shaped Recovery
FIG.210 France Counter-UAV Market by Technology, 2020 – 2030 (USD Million, AGR %): L Shaped Recovery
FIG.211 France Counter-UAV Market by Technology, 2020 – 2030 (USD Million, AGR %): W Shaped Recovery
FIG.212 Italy Counter-UAV Market Value Forecast, 2020 – 2030 (USD Million, AGR %)
FIG.213 Italy Counter-UAV Market Value Forecast, 2020 – 2030 (USD Million, AGR %): V Shaped Recovery
FIG.214 Italy Counter-UAV Market Value Forecast, 2020 – 2030 (USD Million, AGR %): U Shaped Recovery
FIG.215 Italy Counter-UAV Market Value Forecast, 2020 – 2030 (USD Million, AGR %): L Shaped Recovery
FIG.216 Italy Counter-UAV Market Value Forecast, 2020 – 2030 (USD Million, AGR %): W Shaped Recovery
FIG.217 Italy Counter-UAV Market by Platform, 2020 – 2030 (USD Million, AGR %)
FIG.218 Italy Counter-UAV Market by Platform, 2020 – 2030 (USD Million, AGR %): V Shaped Recovery
FIG.219 Italy Counter-UAV Market by Platform, 2020 – 2030 (USD Million, AGR %): U Shaped Recovery
FIG.220 Italy Counter-UAV Market by Platform, 2020 – 2030 (USD Million, AGR %): L Shaped Recovery
FIG.221 Italy Counter-UAV Market by Platform, 2020 – 2030 (USD Million, AGR %): W Shaped Recovery
FIG.222 Italy Counter-UAV Market by Type, 2020 – 2030 (USD Million, AGR %)
FIG.223 Italy Counter-UAV Market by Type, 2020 – 2030 (USD Million, AGR %): V Shaped Recovery
FIG.224 Italy Counter-UAV Market by Type, 2020 – 2030 (USD Million, AGR %): U Shaped Recovery
FIG.225 Italy Counter-UAV Market by Type, 2020 – 2030 (USD Million, AGR %): L Shaped Recovery
FIG.226 Italy Counter-UAV Market by Type, 2020 – 2030 (USD Million, AGR %): W Shaped Recovery
FIG.227 Italy Counter-UAV Market by Technology, 2020 – 2030 (USD Million, AGR %)
FIG.228 Italy Counter-UAV Market by Technology, 2020 – 2030 (USD Million, AGR %): V Shaped Recovery
FIG.229 Italy Counter-UAV Market by Technology, 2020 – 2030 (USD Million, AGR %): U Shaped Recovery
FIG.230 Italy Counter-UAV Market by Technology, 2020 – 2030 (USD Million, AGR %): L Shaped Recovery
FIG.231 Italy Counter-UAV Market by Technology, 2020 – 2030 (USD Million, AGR %): W Shaped Recovery
FIG.232 Russia Counter-UAV Market Value Forecast, 2020 – 2030 (USD Million, AGR %)
FIG.233 Russia Counter-UAV Market Value Forecast, 2020 – 2030 (USD Million, AGR %): V Shaped Recovery
FIG.234 Russia Counter-UAV Market Value Forecast, 2020 – 2030 (USD Million, AGR %): U Shaped Recovery
FIG.235 Russia Counter-UAV Market Value Forecast, 2020 – 2030 (USD Million, AGR %): L Shaped Recovery
FIG.236 Russia Counter-UAV Market Value Forecast, 2020 – 2030 (USD Million, AGR %): W Shaped Recovery
FIG.237 Russia Counter-UAV Market by Platform, 2020 – 2030 (USD Million, AGR %)
FIG.238 Russia Counter-UAV Market by Platform, 2020 – 2030 (USD Million, AGR %): V Shaped Recovery
FIG.239 Russia Counter-UAV Market by Platform, 2020 – 2030 (USD Million, AGR %): U Shaped Recovery
FIG.240 Russia Counter-UAV Market by Platform, 2020 – 2030 (USD Million, AGR %): L Shaped Recovery
FIG.241 Russia Counter-UAV Market by Platform, 2020 – 2030 (USD Million, AGR %): W Shaped Recovery
FIG.242 Russia Counter-UAV Market by Type, 2020 – 2030 (USD Million, AGR %)
FIG.243 Russia Counter-UAV Market by Type, 2020 – 2030 (USD Million, AGR %): V Shaped Recovery
FIG.244 Russia Counter-UAV Market by Type, 2020 – 2030 (USD Million, AGR %): U Shaped Recovery
FIG.245 Russia Counter-UAV Market by Type, 2020 – 2030 (USD Million, AGR %): L Shaped Recovery
FIG.246 Russia Counter-UAV Market by Type, 2020 – 2030 (USD Million, AGR %): W Shaped Recovery
FIG.247 Russia Counter-UAV Market by Technology, 2020 – 2030 (USD Million, AGR %)
FIG.248 Russia Counter-UAV Market by Technology, 2020 – 2030 (USD Million, AGR %): V Shaped Recovery
FIG.249 Russia Counter-UAV Market by Technology, 2020 – 2030 (USD Million, AGR %): U Shaped Recovery
FIG.250 Russia Counter-UAV Market by Technology, 2020 – 2030 (USD Million, AGR %): L Shaped Recovery
FIG.251 Russia Counter-UAV Market by Technology, 2020 – 2030 (USD Million, AGR %): W Shaped Recovery
FIG.252 Spain Counter-UAV Market Value Forecast, 2020 – 2030 (USD Million, AGR %)
FIG.253 Spain Counter-UAV Market Value Forecast, 2020 – 2030 (USD Million, AGR %): V Shaped Recovery
FIG.254 Spain Counter-UAV Market Value Forecast, 2020 – 2030 (USD Million, AGR %): U Shaped Recovery
FIG.255 Spain Counter-UAV Market Value Forecast, 2020 – 2030 (USD Million, AGR %): L Shaped Recovery
FIG.256 Spain Counter-UAV Market Value Forecast, 2020 – 2030 (USD Million, AGR %): W Shaped Recovery
FIG.257 Spain Counter-UAV Market by Platform, 2020 – 2030 (USD Million, AGR %)
FIG.258 Spain Counter-UAV Market by Platform, 2020 – 2030 (USD Million, AGR %): V Shaped Recovery
FIG.259 Spain Counter-UAV Market by Platform, 2020 – 2030 (USD Million, AGR %): U Shaped Recovery
FIG.260 Spain Counter-UAV Market by Platform, 2020 – 2030 (USD Million, AGR %): L Shaped Recovery
FIG.261 Spain Counter-UAV Market by Platform, 2020 – 2030 (USD Million, AGR %): W Shaped Recovery
FIG.262 Spain Counter-UAV Market by Type, 2020 – 2030 (USD Million, AGR %)
FIG.263 Spain Counter-UAV Market by Type, 2020 – 2030 (USD Million, AGR %): V Shaped Recovery
FIG.264 Spain Counter-UAV Market by Type, 2020 – 2030 (USD Million, AGR %): U Shaped Recovery
FIG.265 Spain Counter-UAV Market by Type, 2020 – 2030 (USD Million, AGR %): L Shaped Recovery
FIG.266 Spain Counter-UAV Market by Type, 2020 – 2030 (USD Million, AGR %): W Shaped Recovery
FIG.267 Spain Counter-UAV Market by Technology, 2020 – 2030 (USD Million, AGR %)
FIG.268 Spain Counter-UAV Market by Technology, 2020 – 2030 (USD Million, AGR %): V Shaped Recovery
FIG.269 Spain Counter-UAV Market by Technology, 2020 – 2030 (USD Million, AGR %): U Shaped Recovery
FIG.270 Spain Counter-UAV Market by Technology, 2020 – 2030 (USD Million, AGR %): L Shaped Recovery
FIG.271 Spain Counter-UAV Market by Technology, 2020 – 2030 (USD Million, AGR %): W Shaped Recovery
FIG.272 Rest of Europe Counter-UAV Market Value Forecast, 2020 – 2030 (USD Million, AGR %)
FIG.273 Rest of Europe Counter-UAV Market Value Forecast, 2020 – 2030 (USD Million, AGR %): V Shaped Recovery
FIG.274 Rest of Europe Counter-UAV Market Value Forecast, 2020 – 2030 (USD Million, AGR %): U Shaped Recovery
FIG.275 Rest of Europe Counter-UAV Market Value Forecast, 2020 – 2030 (USD Million, AGR %): L Shaped Recovery
FIG.276 Rest of Europe Counter-UAV Market Value Forecast, 2020 – 2030 (USD Million, AGR %): W Shaped Recovery
FIG.277 Rest of Europe Counter-UAV Market by Platform, 2020 – 2030 (USD Million, AGR %)
FIG.278 Rest of Europe Counter-UAV Market by Platform, 2020 – 2030 (USD Million, AGR %): V Shaped Recovery
FIG.279 Rest of Europe Counter-UAV Market by Platform, 2020 – 2030 (USD Million, AGR %): U Shaped Recovery
FIG.280 Rest of Europe Counter-UAV Market by Platform, 2020 – 2030 (USD Million, AGR %): L Shaped Recovery
FIG.281 Rest of Europe Counter-UAV Market by Platform, 2020 – 2030 (USD Million, AGR %): W Shaped Recovery
FIG.282 Rest of Europe Counter-UAV Market by Type, 2020 – 2030 (USD Million, AGR %)
FIG.283 Rest of Europe Counter-UAV Market by Type, 2020 – 2030 (USD Million, AGR %): V Shaped Recovery
FIG.284 Rest of Europe Counter-UAV Market by Type, 2020 – 2030 (USD Million, AGR %): U Shaped Recovery
FIG.285 Rest of Europe Counter-UAV Market by Type, 2020 – 2030 (USD Million, AGR %): L Shaped Recovery
FIG.286 Rest of Europe Counter-UAV Market by Type, 2020 – 2030 (USD Million, AGR %): W Shaped Recovery
FIG.287 Rest of Europe Counter-UAV Market by Technology, 2020 – 2030 (USD Million, AGR %)
FIG.288 Rest of Europe Counter-UAV Market by Technology, 2020 – 2030 (USD Million, AGR %): V Shaped Recovery
FIG.289 Rest of Europe Counter-UAV Market by Technology, 2020 – 2030 (USD Million, AGR %): U Shaped Recovery
FIG.290 Rest of Europe Counter-UAV Market by Technology, 2020 – 2030 (USD Million, AGR %): L Shaped Recovery
FIG.291 Rest of Europe Counter-UAV Market by Technology, 2020 – 2030 (USD Million, AGR %): W Shaped Recovery
FIG.292 Asia Pacific Counter-UAV Market Value Forecast, 2020 – 2030 (USD Million, AGR %)
FIG.293 Asia Pacific Counter-UAV Market Value Forecast, 2020 – 2030 (USD Million, AGR %): V Shaped Recovery
FIG.294 Asia Pacific Counter-UAV Market Value Forecast, 2020 – 2030 (USD Million, AGR %): U Shaped Recovery
FIG.295 Asia Pacific Counter-UAV Market Value Forecast, 2020 – 2030 (USD Million, AGR %): L Shaped Recovery
FIG.296 Asia Pacific Counter-UAV Market Value Forecast, 2020 – 2030 (USD Million, AGR %): W Shaped Recovery
FIG.297 Asia Pacific Counter-UAV Market Share by Country, 2020, 2025, 2030 (%)
FIG.298 Asia Pacific Counter-UAV Market by Platform, 2020 – 2030 (USD Million, AGR %)
FIG.299 Asia Pacific Counter-UAV Market by Platform, 2020 – 2030 (USD Million, AGR %): V Shaped Recovery
FIG.300 Asia Pacific Counter-UAV Market by Platform, 2020 – 2030 (USD Million, AGR %): U Shaped Recovery
FIG.301 Asia Pacific Counter-UAV Market by Platform, 2020 – 2030 (USD Million, AGR %): L Shaped Recovery
FIG.302 Asia Pacific Counter-UAV Market by Platform, 2020 – 2030 (USD Million, AGR %): W Shaped Recovery
FIG.303 Asia Pacific Counter-UAV Market by Type, 2020 – 2030 (USD Million, AGR %)
FIG.304 Asia Pacific Counter-UAV Market by Type, 2020 – 2030 (USD Million, AGR %): V Shaped Recovery
FIG.305 Asia Pacific Counter-UAV Market by Type, 2020 – 2030 (USD Million, AGR %): U Shaped Recovery
FIG.306 Asia Pacific Counter-UAV Market by Type, 2020 – 2030 (USD Million, AGR %): L Shaped Recovery
FIG.307 Asia Pacific Counter-UAV Market by Type, 2020 – 2030 (USD Million, AGR %): W Shaped Recovery
FIG.308 Asia Pacific Counter-UAV Market by Technology, 2020 – 2030 (USD Million, AGR %)
FIG.309 Asia Pacific Counter-UAV Market by Technology, 2020 – 2030 (USD Million, AGR %): V Shaped Recovery
FIG.310 Asia Pacific Counter-UAV Market by Technology, 2020 – 2030 (USD Million, AGR %): U Shaped Recovery
FIG.311 Asia Pacific Counter-UAV Market by Technology, 2020 – 2030 (USD Million, AGR %): L Shaped Recovery
FIG.312 Asia Pacific Counter-UAV Market by Technology, 2020 – 2030 (USD Million, AGR %): W Shaped Recovery
FIG.313 China Counter-UAV Market Value Forecast, 2020 – 2030 (USD Million, AGR %)
FIG.314 China Counter-UAV Market Value Forecast, 2020 – 2030 (USD Million, AGR %): V Shaped Recovery
FIG.315 China Counter-UAV Market Value Forecast, 2020 – 2030 (USD Million, AGR %): U Shaped Recovery
FIG.316 China Counter-UAV Market Value Forecast, 2020 – 2030 (USD Million, AGR %): L Shaped Recovery
FIG.317 China Counter-UAV Market Value Forecast, 2020 – 2030 (USD Million, AGR %): W Shaped Recovery
FIG.318 China Counter-UAV Market by Platform, 2020 – 2030 (USD Million, AGR %)
FIG.319 China Counter-UAV Market by Platform, 2020 – 2030 (USD Million, AGR %): V Shaped Recovery
FIG.320 China Counter-UAV Market by Platform, 2020 – 2030 (USD Million, AGR %): U Shaped Recovery
FIG.321 China Counter-UAV Market by Platform, 2020 – 2030 (USD Million, AGR %): L Shaped Recovery
FIG.322 China Counter-UAV Market by Platform, 2020 – 2030 (USD Million, AGR %): W Shaped Recovery
FIG.323 China Counter-UAV Market by Type, 2020 – 2030 (USD Million, AGR %): V Shaped Recovery
FIG.324 China Counter-UAV Market by Type, 2020 – 2030 (USD Million, AGR %): V Shaped Recovery
FIG.325 China Counter-UAV Market by Type, 2020 – 2030 (USD Million, AGR %): U Shaped Recovery
FIG.326 China Counter-UAV Market by Type, 2020 – 2030 (USD Million, AGR %): L Shaped Recovery
FIG.327 China Counter-UAV Market by Type, 2020 – 2030 (USD Million, AGR %): W Shaped Recovery
FIG.328 China Counter-UAV Market by Technology, 2020 – 2030 (USD Million, AGR %)
FIG.329 China Counter-UAV Market by Technology, 2020 – 2030 (USD Million, AGR %): V Shaped Recovery
FIG.330 China Counter-UAV Market by Technology, 2020 – 2030 (USD Million, AGR %): U Shaped Recovery
FIG.331 China Counter-UAV Market by Technology, 2020 – 2030 (USD Million, AGR %): L Shaped Recovery
FIG.332 China Counter-UAV Market by Technology, 2020 – 2030 (USD Million, AGR %): W Shaped Recovery
FIG.333 Japan Counter-UAV Market Value Forecast, 2020 – 2030 (USD Million, AGR %)
FIG.334 Japan Counter-UAV Market Value Forecast, 2020 – 2030 (USD Million, AGR %): V Shaped Recovery
FIG.335 Japan Counter-UAV Market Value Forecast, 2020 – 2030 (USD Million, AGR %): U Shaped Recovery
FIG.336 Japan Counter-UAV Market Value Forecast, 2020 – 2030 (USD Million, AGR %): L Shaped Recovery
FIG.337 Japan Counter-UAV Market Value Forecast, 2020 – 2030 (USD Million, AGR %): W Shaped Recovery
FIG.338 Japan Counter-UAV Market by Platform, 2020 – 2030 (USD Million, AGR %)
FIG.339 Japan Counter-UAV Market by Platform, 2020 – 2030 (USD Million, AGR %): V Shaped Recovery
FIG.340 Japan Counter-UAV Market by Platform, 2020 – 2030 (USD Million, AGR %): U Shaped Recovery
FIG.341 Japan Counter-UAV Market by Platform, 2020 – 2030 (USD Million, AGR %): L Shaped Recovery
FIG.342 Japan Counter-UAV Market by Platform, 2020 – 2030 (USD Million, AGR %): W Shaped Recovery
FIG.343 Japan Counter-UAV Market by Type, 2020 – 2030 (USD Million, AGR %)
FIG.344 Japan Counter-UAV Market by Type, 2020 – 2030 (USD Million, AGR %): V Shaped Recovery
FIG.345 Japan Counter-UAV Market by Type, 2020 – 2030 (USD Million, AGR %): U Shaped Recovery
FIG.346 Japan Counter-UAV Market by Type, 2020 – 2030 (USD Million, AGR %): L Shaped Recovery
FIG.347 Japan Counter-UAV Market by Type, 2020 – 2030 (USD Million, AGR %): W Shaped Recovery
FIG.348 Japan Counter-UAV Market by Technology, 2020 – 2030 (USD Million, AGR %)
FIG.349 Japan Counter-UAV Market by Technology, 2020 – 2030 (USD Million, AGR %): V Shaped Recovery
FIG.350 Japan Counter-UAV Market by Technology, 2020 – 2030 (USD Million, AGR %): U Shaped Recovery
FIG.351 Japan Counter-UAV Market by Technology, 2020 – 2030 (USD Million, AGR %): L Shaped Recovery
FIG.352 Japan Counter-UAV Market by Technology, 2020 – 2030 (USD Million, AGR %): W Shaped Recovery
FIG.353 India Counter-UAV Market Value Forecast, 2020 – 2030 (USD Million, AGR %)
FIG.354 India Counter-UAV Market Value Forecast, 2020 – 2030 (USD Million, AGR %): V Shaped Recovery
FIG.355 India Counter-UAV Market Value Forecast, 2020 – 2030 (USD Million, AGR %): U Shaped Recovery
FIG.356 India Counter-UAV Market Value Forecast, 2020 – 2030 (USD Million, AGR %): L Shaped Recovery
FIG.357 India Counter-UAV Market Value Forecast, 2020 – 2030 (USD Million, AGR %): W Shaped Recovery
FIG.358 India Counter-UAV Market by Platform, 2020 – 2030 (USD Million, AGR %)
FIG.359 India Counter-UAV Market by Platform, 2020 – 2030 (USD Million, AGR %): V Shaped Recovery
FIG.360 India Counter-UAV Market by Platform, 2020 – 2030 (USD Million, AGR %): U Shaped Recovery
FIG.361 India Counter-UAV Market by Platform, 2020 – 2030 (USD Million, AGR %): L Shaped Recovery
FIG.362 India Counter-UAV Market by Platform, 2020 – 2030 (USD Million, AGR %): W Shaped Recovery
FIG.363 India Counter-UAV Market by Type, 2020 – 2030 (USD Million, AGR %)
FIG.364 India Counter-UAV Market by Type, 2020 – 2030 (USD Million, AGR %): V Shaped Recovery
FIG.365 India Counter-UAV Market by Type, 2020 – 2030 (USD Million, AGR %): U Shaped Recovery
FIG.366 India Counter-UAV Market by Type, 2020 – 2030 (USD Million, AGR %): L Shaped Recovery
FIG.367 India Counter-UAV Market by Type, 2020 – 2030 (USD Million, AGR %): W Shaped Recovery
FIG.368 India Counter-UAV Market by Technology, 2020 – 2030 (USD Million, AGR %)
FIG.369 India Counter-UAV Market by Technology, 2020 – 2030 (USD Million, AGR %): V Shaped Recovery
FIG.370 India Counter-UAV Market by Technology, 2020 – 2030 (USD Million, AGR %): U Shaped Recovery
FIG.371 India Counter-UAV Market by Technology, 2020 – 2030 (USD Million, AGR %): L Shaped Recovery
FIG.372 India Counter-UAV Market by Technology, 2020 – 2030 (USD Million, AGR %): W Shaped Recovery
FIG.373 South Korea Counter-UAV Market Value Forecast, 2020 – 2030 (USD Million, AGR %)
FIG.374 South Korea Counter-UAV Market Value Forecast, 2020 – 2030 (USD Million, AGR %): V Shaped Recovery
FIG.375 South Korea Counter-UAV Market Value Forecast, 2020 – 2030 (USD Million, AGR %): U Shaped Recovery
FIG.376 South Korea Counter-UAV Market Value Forecast, 2020 – 2030 (USD Million, AGR %): L Shaped Recovery
FIG.377 South Korea Counter-UAV Market Value Forecast, 2020 – 2030 (USD Million, AGR %): W Shaped Recovery
FIG.378 South Korea Counter-UAV Market by Platform, 2020 – 2030 (USD Million, AGR %)
FIG.379 South Korea Counter-UAV Market by Platform, 2020 – 2030 (USD Million, AGR %): V Shaped Recovery
FIG.380 South Korea Counter-UAV Market by Platform, 2020 – 2030 (USD Million, AGR %): U Shaped Recovery
FIG.381 South Korea Counter-UAV Market by Platform, 2020 – 2030 (USD Million, AGR %): L Shaped Recovery
FIG.382 South Korea Counter-UAV Market by Platform, 2020 – 2030 (USD Million, AGR %): W Shaped Recovery
FIG.383 South Korea Counter-UAV Market by Type, 2020 – 2030 (USD Million, AGR %)
FIG.384 South Korea Counter-UAV Market by Type, 2020 – 2030 (USD Million, AGR %): V Shaped Recovery
FIG.385 South Korea Counter-UAV Market by Type, 2020 – 2030 (USD Million, AGR %): U Shaped Recovery
FIG.386 South Korea Counter-UAV Market by Type, 2020 – 2030 (USD Million, AGR %): L Shaped Recovery
FIG.387 South Korea Counter-UAV Market by Type, 2020 – 2030 (USD Million, AGR %): W Shaped Recovery
FIG.388 South Korea Counter-UAV Market by Technology, 2020 – 2030 (USD Million, AGR %)
FIG.389 South Korea Counter-UAV Market by Technology, 2020 – 2030 (USD Million, AGR %): V Shaped Recovery
FIG.390 South Korea Counter-UAV Market by Technology, 2020 – 2030 (USD Million, AGR %): U Shaped Recovery
FIG.391 South Korea Counter-UAV Market by Technology, 2020 – 2030 (USD Million, AGR %): L Shaped Recovery
FIG.392 South Korea Counter-UAV Market by Technology, 2020 – 2030 (USD Million, AGR %): W Shaped Recovery
FIG.393 Southeast Asia Counter-UAV Market Value Forecast, 2020 – 2030 (USD Million, AGR %)
FIG.394 Southeast Asia Counter-UAV Market Value Forecast, 2020 – 2030 (USD Million, AGR %): V Shaped Recovery
FIG.395 Southeast Asia Counter-UAV Market Value Forecast, 2020 – 2030 (USD Million, AGR %): U Shaped Recovery
FIG.396 Southeast Asia Counter-UAV Market Value Forecast, 2020 – 2030 (USD Million, AGR %): L Shaped Recovery
FIG.397 Southeast Asia Counter-UAV Market Value Forecast, 2020 – 2030 (USD Million, AGR %): W Shaped Recovery
FIG.398 Southeast Asia Counter-UAV Market by Platform, 2020 – 2030 (USD Million, AGR %)
FIG.399 Southeast Asia Counter-UAV Market by Platform, 2020 – 2030 (USD Million, AGR %): V Shaped Recovery
FIG.400 Southeast Asia Counter-UAV Market by Platform, 2020 – 2030 (USD Million, AGR %): U Shaped Recovery
FIG.401 Southeast Asia Counter-UAV Market by Platform, 2020 – 2030 (USD Million, AGR %): L Shaped Recovery
FIG.402 Southeast Asia Counter-UAV Market by Platform, 2020 – 2030 (USD Million, AGR %): W Shaped Recovery
FIG.403 Southeast Asia Counter-UAV Market by Type, 2020 – 2030 (USD Million, AGR %)
FIG.404 Southeast Asia Counter-UAV Market by Type, 2020 – 2030 (USD Million, AGR %): V Shaped Recovery
FIG.405 Southeast Asia Counter-UAV Market by Type, 2020 – 2030 (USD Million, AGR %): U Shaped Recovery
FIG.406 Southeast Asia Counter-UAV Market by Type, 2020 – 2030 (USD Million, AGR %): L Shaped Recovery
FIG.407 Southeast Asia Counter-UAV Market by Type, 2020 – 2030 (USD Million, AGR %): W Shaped Recovery
FIG.408 Southeast Asia Counter-UAV Market by Technology, 2020 – 2030 (USD Million, AGR %)
FIG.409 Southeast Asia Counter-UAV Market by Technology, 2020 – 2030 (USD Million, AGR %): V Shaped Recovery
FIG.410 Southeast Asia Counter-UAV Market by Technology, 2020 – 2030 (USD Million, AGR %): U Shaped Recovery
FIG.411 Southeast Asia Counter-UAV Market by Technology, 2020 – 2030 (USD Million, AGR %): L Shaped Recovery
FIG.412 Southeast Asia Counter-UAV Market by Technology, 2020 – 2030 (USD Million, AGR %): W Shaped Recovery
FIG.413 Rest of Asia Pacific Counter-UAV Market Value Forecast, 2020 – 2030 (USD Million, AGR %)
FIG.414 Rest of Asia Pacific Counter-UAV Market Value Forecast, 2020 – 2030 (USD Million, AGR %): V Shaped Recovery
FIG.415 Rest of Asia Pacific Counter-UAV Market Value Forecast, 2020 – 2030 (USD Million, AGR %): U Shaped Recovery
FIG.416 Rest of Asia Pacific Counter-UAV Market Value Forecast, 2020 – 2030 (USD Million, AGR %): L Shaped Recovery
FIG.417 Rest of Asia Pacific Counter-UAV Market Value Forecast, 2020 – 2030 (USD Million, AGR %): W Shaped Recovery
FIG.418 Rest of Asia Pacific Counter-UAV Market by Platform, 2020 – 2030 (USD Million, AGR %)
FIG.419 Rest of Asia Pacific Counter-UAV Market by Platform, 2020 – 2030 (USD Million, AGR %): V Shaped Recovery
FIG.420 Rest of Asia Pacific Counter-UAV Market by Platform, 2020 – 2030 (USD Million, AGR %): U Shaped Recovery
FIG.421 Rest of Asia Pacific Counter-UAV Market by Platform, 2020 – 2030 (USD Million, AGR %): L Shaped Recovery
FIG.422 Rest of Asia Pacific Counter-UAV Market by Platform, 2020 – 2030 (USD Million, AGR %): W Shaped Recovery
FIG.423 Rest of Asia Pacific Counter-UAV Market by Type, 2020 – 2030 (USD Million, AGR %)
FIG.424 Rest of Asia Pacific Counter-UAV Market by Type, 2020 – 2030 (USD Million, AGR %): V Shaped Recovery
FIG.425 Rest of Asia Pacific Counter-UAV Market by Type, 2020 – 2030 (USD Million, AGR %): U Shaped Recovery
FIG.426 Rest of Asia Pacific Counter-UAV Market by Type, 2020 – 2030 (USD Million, AGR %): L Shaped Recovery
FIG.427 Rest of Asia Pacific Counter-UAV Market by Type, 2020 – 2030 (USD Million, AGR %): W Shaped Recovery
FIG.428 Rest of Asia Pacific Counter-UAV Market by Technology, 2020 – 2030 (USD Million, AGR %)
FIG.429 Rest of Asia Pacific Counter-UAV Market by Technology, 2020 – 2030 (USD Million, AGR %): V Shaped Recovery
FIG.430 Rest of Asia Pacific Counter-UAV Market by Technology, 2020 – 2030 (USD Million, AGR %): U Shaped Recovery
FIG.431 Rest of Asia Pacific Counter-UAV Market by Technology, 2020 – 2030 (USD Million, AGR %): L Shaped Recovery
FIG.432 Rest of Asia Pacific Counter-UAV Market by Technology, 2020 – 2030 (USD Million, AGR %): W Shaped Recovery
FIG.433 Latin America Counter-UAV Market Value Forecast, 2020 – 2030 (USD Million, AGR %)
FIG.434 Latin America Counter-UAV Market Value Forecast, 2020 – 2030 (USD Million, AGR %): V Shaped Recovery
FIG.435 Latin America Counter-UAV Market Value Forecast, 2020 – 2030 (USD Million, AGR %): U Shaped Recovery
FIG.436 Latin America Counter-UAV Market Value Forecast, 2020 – 2030 (USD Million, AGR %): L Shaped Recovery
FIG.437 Latin America Counter-UAV Market Value Forecast, 2020 – 2030 (USD Million, AGR %): W Shaped Recovery
FIG.438 Latin America Counter-UAV Market Share by Country, 2020, 2025, 2030 (%)
FIG.439 Latin America Counter-UAV Market by Platform, 2020 – 2030 (USD Million, AGR %)
FIG.440 Latin America Counter-UAV Market by Platform, 2020 – 2030 (USD Million, AGR %): V Shaped Recovery
FIG.441 Latin America Counter-UAV Market by Platform, 2020 – 2030 (USD Million, AGR %): U Shaped Recovery
FIG.442 Latin America Counter-UAV Market by Platform, 2020 – 2030 (USD Million, AGR %): L Shaped Recovery
FIG.443 Latin America Counter-UAV Market by Platform, 2020 – 2030 (USD Million, AGR %): W Shaped Recovery
FIG.444 Latin America Counter-UAV Market by Type, 2020 – 2030 (USD Million, AGR %)
FIG.445 Latin America Counter-UAV Market by Type, 2020 – 2030 (USD Million, AGR %): V Shaped Recovery
FIG.446 Latin America Counter-UAV Market by Type, 2020 – 2030 (USD Million, AGR %): U Shaped Recovery
FIG.447 Latin America Counter-UAV Market by Type, 2020 – 2030 (USD Million, AGR %): L Shaped Recovery
FIG.448 Latin America Counter-UAV Market by Type, 2020 – 2030 (USD Million, AGR %): W Shaped Recovery
FIG.449 Latin America Counter-UAV Market by Technology, 2020 – 2030 (USD Million, AGR %)
FIG.450 Latin America Counter-UAV Market by Technology, 2020 – 2030 (USD Million, AGR %): V Shaped Recovery
FIG.451 Latin America Counter-UAV Market by Technology, 2020 – 2030 (USD Million, AGR %): U Shaped Recovery
FIG.452 Latin America Counter-UAV Market by Technology, 2020 – 2030 (USD Million, AGR %): L Shaped Recovery
FIG.453 Latin America Counter-UAV Market by Technology, 2020 – 2030 (USD Million, AGR %): W Shaped Recovery
FIG.454 Brazil Counter-UAV Market Value Forecast, 2020 – 2030 (USD Million, AGR %)
FIG.455 Brazil Counter-UAV Market Value Forecast, 2020 – 2030 (USD Million, AGR %): V Shaped Recovery
FIG.456 Brazil Counter-UAV Market Value Forecast, 2020 – 2030 (USD Million, AGR %): U Shaped Recovery
FIG.457 Brazil Counter-UAV Market Value Forecast, 2020 – 2030 (USD Million, AGR %): L Shaped Recovery
FIG.458 Brazil Counter-UAV Market Value Forecast, 2020 – 2030 (USD Million, AGR %): W Shaped Recovery
FIG.459 Brazil Counter-UAV Market by Platform, 2020 – 2030 (USD Million, AGR %)
FIG.460 Brazil Counter-UAV Market by Platform, 2020 – 2030 (USD Million, AGR %): V Shaped Recovery
FIG.461 Brazil Counter-UAV Market by Platform, 2020 – 2030 (USD Million, AGR %): U Shaped Recovery
FIG.462 Brazil Counter-UAV Market by Platform, 2020 – 2030 (USD Million, AGR %): L Shaped Recovery
FIG.463 Brazil Counter-UAV Market by Platform, 2020 – 2030 (USD Million, AGR %): W Shaped Recovery
FIG.464 Brazil Counter-UAV Market by Type, 2020 – 2030 (USD Million, AGR %)
FIG.465 Brazil Counter-UAV Market by Type, 2020 – 2030 (USD Million, AGR %): V Shaped Recovery
FIG.466 Brazil Counter-UAV Market by Type, 2020 – 2030 (USD Million, AGR %): U Shaped Recovery
FIG.467 Brazil Counter-UAV Market by Type, 2020 – 2030 (USD Million, AGR %): L Shaped Recovery
FIG.468 Brazil Counter-UAV Market by Type, 2020 – 2030 (USD Million, AGR %): W Shaped Recovery
FIG.469 Brazil Counter-UAV Market by Technology, 2020 – 2030 (USD Million, AGR %)
FIG.470 Brazil Counter-UAV Market by Technology, 2020 – 2030 (USD Million, AGR %): V Shaped Recovery
FIG.471 Brazil Counter-UAV Market by Technology, 2020 – 2030 (USD Million, AGR %): U Shaped Recovery
FIG.472 Brazil Counter-UAV Market by Technology, 2020 – 2030 (USD Million, AGR %): L Shaped Recovery
FIG.473 Brazil Counter-UAV Market by Technology, 2020 – 2030 (USD Million, AGR %): W Shaped Recovery
FIG.474 Argentina Counter-UAV Market Value Forecast, 2020 – 2030 (USD Million, AGR %)
FIG.475 Argentina Counter-UAV Market Value Forecast, 2020 – 2030 (USD Million, AGR %): V Shaped Recovery
FIG.476 Argentina Counter-UAV Market Value Forecast, 2020 – 2030 (USD Million, AGR %): U Shaped Recovery
FIG.477 Argentina Counter-UAV Market Value Forecast, 2020 – 2030 (USD Million, AGR %): L Shaped Recovery
FIG.478 Argentina Counter-UAV Market Value Forecast, 2020 – 2030 (USD Million, AGR %): W Shaped Recovery
FIG.479 Argentina Counter-UAV Market by Platform, 2020 – 2030 (USD Million, AGR %)
FIG.480 Argentina Counter-UAV Market by Platform, 2020 – 2030 (USD Million, AGR %): V Shaped Recovery
FIG.481 Argentina Counter-UAV Market by Platform, 2020 – 2030 (USD Million, AGR %): U Shaped Recovery
FIG.482 Argentina Counter-UAV Market by Platform, 2020 – 2030 (USD Million, AGR %): L Shaped Recovery
FIG.483 Argentina Counter-UAV Market by Platform, 2020 – 2030 (USD Million, AGR %): W Shaped Recovery
FIG.484 Argentina Counter-UAV Market by Type, 2020 – 2030 (USD Million, AGR %)
FIG.485 Argentina Counter-UAV Market by Type, 2020 – 2030 (USD Million, AGR %): V Shaped Recovery
FIG.486 Argentina Counter-UAV Market by Type, 2020 – 2030 (USD Million, AGR %): U Shaped Recovery
FIG.487 Argentina Counter-UAV Market by Type, 2020 – 2030 (USD Million, AGR %): L Shaped Recovery
FIG.488 Argentina Counter-UAV Market by Type, 2020 – 2030 (USD Million, AGR %): W Shaped Recovery
FIG.489 Argentina Counter-UAV Market by Technology, 2020 – 2030 (USD Million, AGR %)
FIG.490 Argentina Counter-UAV Market by Technology, 2020 – 2030 (USD Million, AGR %): V Shaped Recovery
FIG.491 Argentina Counter-UAV Market by Technology, 2020 – 2030 (USD Million, AGR %): U Shaped Recovery
FIG.492 Argentina Counter-UAV Market by Technology, 2020 – 2030 (USD Million, AGR %): L Shaped Recovery
FIG.493 Argentina Counter-UAV Market by Technology, 2020 – 2030 (USD Million, AGR %): W Shaped Recovery
FIG.494 Rest of Latin America Counter-UAV Market Value Forecast, 2020 – 2030 (USD Million, AGR %)
FIG.495 Rest of Latin America Counter-UAV Market Value Forecast, 2020 – 2030 (USD Million, AGR %): V Shaped Recovery
FIG.496 Rest of Latin America Counter-UAV Market Value Forecast, 2020 – 2030 (USD Million, AGR %): U Shaped Recovery
FIG.497 Rest of Latin America Counter-UAV Market Value Forecast, 2020 – 2030 (USD Million, AGR %): L Shaped Recovery
FIG.498 Rest of Latin America Counter-UAV Market Value Forecast, 2020 – 2030 (USD Million, AGR %): W Shaped Recovery
FIG.499 Rest of Latin America Counter-UAV Market by Platform, 2020 – 2030 (USD Million, AGR %)
FIG.500 Rest of Latin America Counter-UAV Market by Platform, 2020 – 2030 (USD Million, AGR %): V Shaped Recovery
FIG.501 Rest of Latin America Counter-UAV Market by Platform, 2020 – 2030 (USD Million, AGR %): U Shaped Recovery
FIG.502 Rest of Latin America Counter-UAV Market by Platform, 2020 – 2030 (USD Million, AGR %): L Shaped Recovery
FIG.503 Rest of Latin America Counter-UAV Market by Platform, 2020 – 2030 (USD Million, AGR %): W Shaped Recovery
FIG.504 Rest of Latin America Counter-UAV Market by Type, 2020 – 2030 (USD Million, AGR %)
FIG.505 Rest of Latin America Counter-UAV Market by Type, 2020 – 2030 (USD Million, AGR %): V Shaped Recovery
FIG.506 Rest of Latin America Counter-UAV Market by Type, 2020 – 2030 (USD Million, AGR %): U Shaped Recovery
FIG.507 Rest of Latin America Counter-UAV Market by Type, 2020 – 2030 (USD Million, AGR %): L Shaped Recovery
FIG.508 Rest of Latin America Counter-UAV Market by Type, 2020 – 2030 (USD Million, AGR %): W Shaped Recovery
FIG.509 Rest of Latin America Counter-UAV Market by Technology, 2020 – 2030 (USD Million, AGR %)
FIG.510 Rest of Latin America Counter-UAV Market by Technology, 2020 – 2030 (USD Million, AGR %): V Shaped Recovery
FIG.511 Rest of Latin America Counter-UAV Market by Technology, 2020 – 2030 (USD Million, AGR %): U Shaped Recovery
FIG.512 Rest of Latin America Counter-UAV Market by Technology, 2020 – 2030 (USD Million, AGR %): L Shaped Recovery
FIG.513 Rest of Latin America Counter-UAV Market by Technology, 2020 – 2030 (USD Million, AGR %): W Shaped Recovery
FIG.514 Middle East & Africa Counter-UAV Market Value Forecast, 2020 – 2030 (USD Million, AGR %)
FIG.515 Middle East & Africa Counter-UAV Market Value Forecast, 2020 – 2030 (USD Million, AGR %): V Shaped Recovery
FIG.516 Middle East & Africa Counter-UAV Market Value Forecast, 2020 – 2030 (USD Million, AGR %): U Shaped Recovery
FIG.517 Middle East & Africa Counter-UAV Market Value Forecast, 2020 – 2030 (USD Million, AGR %): L Shaped Recovery
FIG.518 Middle East & Africa Counter-UAV Market Value Forecast, 2020 – 2030 (USD Million, AGR %): W Shaped Recovery
FIG.519 Middle East & Africa Counter-UAV Market Share by Country, 2020, 2025, 2030 (%)
FIG.520 Middle East & Africa Counter-UAV Market by Platform, 2020 – 2030 (USD Million, AGR %)
FIG.521 Middle East & Africa Counter-UAV Market by Platform, 2020 – 2030 (USD Million, AGR %): V Shaped Recovery
FIG.522 Middle East & Africa Counter-UAV Market by Platform, 2020 – 2030 (USD Million, AGR %): U Shaped Recovery
FIG.523 Middle East & Africa Counter-UAV Market by Platform, 2020 – 2030 (USD Million, AGR %): L Shaped Recovery
FIG.524 Middle East & Africa Counter-UAV Market by Platform, 2020 – 2030 (USD Million, AGR %): W Shaped Recovery
FIG.525 Middle East & Africa Counter-UAV Market by Type, 2020 – 2030 (USD Million, AGR %)
FIG.526 Middle East & Africa Counter-UAV Market by Type, 2020 – 2030 (USD Million, AGR %): V Shaped Recovery
FIG.527 Middle East & Africa Counter-UAV Market by Type, 2020 – 2030 (USD Million, AGR %): U Shaped Recovery
FIG.528 Middle East & Africa Counter-UAV Market by Type, 2020 – 2030 (USD Million, AGR %): L Shaped Recovery
FIG.529 Middle East & Africa Counter-UAV Market by Type, 2020 – 2030 (USD Million, AGR %): W Shaped Recovery
FIG.530 Middle East & Africa Counter-UAV Market by Technology, 2020 – 2030 (USD Million, AGR %)
FIG.531 Middle East & Africa Counter-UAV Market by Technology, 2020 – 2030 (USD Million, AGR %): V Shaped Recovery
FIG.532 Middle East & Africa Counter-UAV Market by Technology, 2020 – 2030 (USD Million, AGR %): U Shaped Recovery
FIG.533 Middle East & Africa Counter-UAV Market by Technology, 2020 – 2030 (USD Million, AGR %): L Shaped Recovery
FIG.534 Middle East & Africa Counter-UAV Market by Technology, 2020 – 2030 (USD Million, AGR %): W Shaped Recovery
FIG.535 Saudi Arabia Counter-UAV Market Value Forecast, 2020 – 2030 (USD Million, AGR %)
FIG.536 Saudi Arabia Counter-UAV Market Value Forecast, 2020 – 2030 (USD Million, AGR %): V Shaped Recovery
FIG.537 Saudi Arabia Counter-UAV Market Value Forecast, 2020 – 2030 (USD Million, AGR %): U Shaped Recovery
FIG.538 Saudi Arabia Counter-UAV Market Value Forecast, 2020 – 2030 (USD Million, AGR %): L Shaped Recovery
FIG.539 Saudi Arabia Counter-UAV Market Value Forecast, 2020 – 2030 (USD Million, AGR %): W Shaped Recovery
FIG.540 Saudi Arabia Counter-UAV Market by Platform, 2020 – 2030 (USD Million, AGR %)
FIG.541 Saudi Arabia Counter-UAV Market by Platform, 2020 – 2030 (USD Million, AGR %): V Shaped Recovery
FIG.542 Saudi Arabia Counter-UAV Market by Platform, 2020 – 2030 (USD Million, AGR %): U Shaped Recovery
FIG.543 Saudi Arabia Counter-UAV Market by Platform, 2020 – 2030 (USD Million, AGR %): L Shaped Recovery
FIG.544 Saudi Arabia Counter-UAV Market by Platform, 2020 – 2030 (USD Million, AGR %): W Shaped Recovery
FIG.545 Saudi Arabia Counter-UAV Market by Type, 2020 – 2030 (USD Million, AGR %)
FIG.546 Saudi Arabia Counter-UAV Market by Type, 2020 – 2030 (USD Million, AGR %): V Shaped Recovery
FIG.547 Saudi Arabia Counter-UAV Market by Type, 2020 – 2030 (USD Million, AGR %): U Shaped Recovery
FIG.548 Saudi Arabia Counter-UAV Market by Type, 2020 – 2030 (USD Million, AGR %): L Shaped Recovery
FIG.549 Saudi Arabia Counter-UAV Market by Type, 2020 – 2030 (USD Million, AGR %): W Shaped Recovery
FIG.550 Saudi Arabia Counter-UAV Market by Technology, 2020 – 2030 (USD Million, AGR %)
FIG.551 Saudi Arabia Counter-UAV Market by Technology, 2020 – 2030 (USD Million, AGR %): V Shaped Recovery
FIG.552 Saudi Arabia Counter-UAV Market by Technology, 2020 – 2030 (USD Million, AGR %): U Shaped Recovery
FIG.553 Saudi Arabia Counter-UAV Market by Technology, 2020 – 2030 (USD Million, AGR %): L Shaped Recovery
FIG.554 Saudi Arabia Counter-UAV Market by Technology, 2020 – 2030 (USD Million, AGR %): W Shaped Recovery
FIG.555 Qatar Counter-UAV Market Value Forecast, 2020 – 2030 (USD Million, AGR %)
FIG.556 Qatar Counter-UAV Market Value Forecast, 2020 – 2030 (USD Million, AGR %): V Shaped Recovery
FIG.557 Qatar Counter-UAV Market Value Forecast, 2020 – 2030 (USD Million, AGR %): U Shaped Recovery
FIG.558 Qatar Counter-UAV Market Value Forecast, 2020 – 2030 (USD Million, AGR %): L Shaped Recovery
FIG.559 Qatar Counter-UAV Market Value Forecast, 2020 – 2030 (USD Million, AGR %): W Shaped Recovery
FIG.560 Qatar Counter-UAV Market by Platform, 2020 – 2030 (USD Million, AGR %)
FIG.561 Qatar Counter-UAV Market by Platform, 2020 – 2030 (USD Million, AGR %): V Shaped Recovery
FIG.562 Qatar Counter-UAV Market by Platform, 2020 – 2030 (USD Million, AGR %): U Shaped Recovery
FIG.563 Qatar Counter-UAV Market by Platform, 2020 – 2030 (USD Million, AGR %): L Shaped Recovery
FIG.564 Qatar Counter-UAV Market by Platform, 2020 – 2030 (USD Million, AGR %): W Shaped Recovery
FIG.565 Qatar Counter-UAV Market by Type, 2020 – 2030 (USD Million, AGR %)
FIG.566 Qatar Counter-UAV Market by Type, 2020 – 2030 (USD Million, AGR %): V Shaped Recovery
FIG.567 Qatar Counter-UAV Market by Type, 2020 – 2030 (USD Million, AGR %): U Shaped Recovery
FIG.568 Qatar Counter-UAV Market by Type, 2020 – 2030 (USD Million, AGR %): L Shaped Recovery
FIG.569 Qatar Counter-UAV Market by Type, 2020 – 2030 (USD Million, AGR %): W Shaped Recovery
FIG.570 Qatar Counter-UAV Market by Technology, 2020 – 2030 (USD Million, AGR %)
FIG.571 Qatar Counter-UAV Market by Technology, 2020 – 2030 (USD Million, AGR %): V Shaped Recovery
FIG.572 Qatar Counter-UAV Market by Technology, 2020 – 2030 (USD Million, AGR %): U Shaped Recovery
FIG.573 Qatar Counter-UAV Market by Technology, 2020 – 2030 (USD Million, AGR %): L Shaped Recovery
FIG.574 Qatar Counter-UAV Market by Technology, 2020 – 2030 (USD Million, AGR %): W Shaped Recovery
FIG.575 UAE Counter-UAV Market Value Forecast, 2020 – 2030 (USD Million, AGR %)
FIG.576 UAE Counter-UAV Market Value Forecast, 2020 – 2030 (USD Million, AGR %): V Shaped Recovery
FIG.577 UAE Counter-UAV Market Value Forecast, 2020 – 2030 (USD Million, AGR %): U Shaped Recovery
FIG.578 UAE Counter-UAV Market Value Forecast, 2020 – 2030 (USD Million, AGR %): L Shaped Recovery
FIG.579 UAE Counter-UAV Market Value Forecast, 2020 – 2030 (USD Million, AGR %): W Shaped Recovery
FIG.580 UAE Counter-UAV Market by Platform, 2020 – 2030 (USD Million, AGR %)
FIG.581 UAE Counter-UAV Market by Platform, 2020 – 2030 (USD Million, AGR %): V Shaped Recovery
FIG.582 UAE Counter-UAV Market by Platform, 2020 – 2030 (USD Million, AGR %): U Shaped Recovery
FIG.583 UAE Counter-UAV Market by Platform, 2020 – 2030 (USD Million, AGR %): L Shaped Recovery
FIG.584 UAE Counter-UAV Market by Platform, 2020 – 2030 (USD Million, AGR %): W Shaped Recovery
FIG.585 UAE Counter-UAV Market by Type, 2020 – 2030 (USD Million, AGR %)
FIG.586 UAE Counter-UAV Market by Type, 2020 – 2030 (USD Million, AGR %): V Shaped Recovery
FIG.587 UAE Counter-UAV Market by Type, 2020 – 2030 (USD Million, AGR %): U Shaped Recovery
FIG.588 UAE Counter-UAV Market by Type, 2020 – 2030 (USD Million, AGR %): L Shaped Recovery
FIG.589 UAE Counter-UAV Market by Type, 2020 – 2030 (USD Million, AGR %): W Shaped Recovery
FIG.590 UAE Counter-UAV Market by Technology, 2020 – 2030 (USD Million, AGR %)
FIG.591 UAE Counter-UAV Market by Technology, 2020 – 2030 (USD Million, AGR %): V Shaped Recovery
FIG.592 UAE Counter-UAV Market by Technology, 2020 – 2030 (USD Million, AGR %): U Shaped Recovery
FIG.593 UAE Counter-UAV Market by Technology, 2020 – 2030 (USD Million, AGR %): L Shaped Recovery
FIG.594 UAE Counter-UAV Market by Technology, 2020 – 2030 (USD Million, AGR %): W Shaped Recovery
FIG.595 Iraq Counter-UAV Market Value Forecast, 2020 – 2030 (USD Million, AGR %)
FIG.596 Iraq Counter-UAV Market Value Forecast, 2020 – 2030 (USD Million, AGR %): V Shaped Recovery
FIG.597 Iraq Counter-UAV Market Value Forecast, 2020 – 2030 (USD Million, AGR %): U Shaped Recovery
FIG.598 Iraq Counter-UAV Market Value Forecast, 2020 – 2030 (USD Million, AGR %): L Shaped Recovery
FIG.599 Iraq Counter-UAV Market Value Forecast, 2020 – 2030 (USD Million, AGR %): W Shaped Recovery
FIG.600 Iraq Counter-UAV Market by Platform, 2020 – 2030 (USD Million, AGR %)
FIG.601 Iraq Counter-UAV Market by Platform, 2020 – 2030 (USD Million, AGR %): V Shaped Recovery
FIG.602 Iraq Counter-UAV Market by Platform, 2020 – 2030 (USD Million, AGR %): U Shaped Recovery
FIG.603 Iraq Counter-UAV Market by Platform, 2020 – 2030 (USD Million, AGR %): L Shaped Recovery
FIG.604 Iraq Counter-UAV Market by Platform, 2020 – 2030 (USD Million, AGR %): W Shaped Recovery
FIG.605 Iraq Counter-UAV Market by Type, 2020 – 2030 (USD Million, AGR %)
FIG.606 Iraq Counter-UAV Market by Type, 2020 – 2030 (USD Million, AGR %): V Shaped Recovery
FIG.607 Iraq Counter-UAV Market by Type, 2020 – 2030 (USD Million, AGR %): U Shaped Recovery
FIG.608 Iraq Counter-UAV Market by Type, 2020 – 2030 (USD Million, AGR %): L Shaped Recovery
FIG.609 Iraq Counter-UAV Market by Type, 2020 – 2030 (USD Million, AGR %): W Shaped Recovery
FIG.610 Iraq Counter-UAV Market by Technology, 2020 – 2030 (USD Million, AGR %)
FIG.611 Iraq Counter-UAV Market by Technology, 2020 – 2030 (USD Million, AGR %): V Shaped Recovery
FIG.612 Iraq Counter-UAV Market by Technology, 2020 – 2030 (USD Million, AGR %): U Shaped Recovery
FIG.613 Iraq Counter-UAV Market by Technology, 2020 – 2030 (USD Million, AGR %): L Shaped Recovery
FIG.614 Iraq Counter-UAV Market by Technology, 2020 – 2030 (USD Million, AGR %): W Shaped Recovery
FIG.615 Egypt Counter-UAV Market Value Forecast, 2020 – 2030 (USD Million, AGR %)
FIG.616 Egypt Counter-UAV Market Value Forecast, 2020 – 2030 (USD Million, AGR %): V Shaped Recovery
FIG.617 Egypt Counter-UAV Market Value Forecast, 2020 – 2030 (USD Million, AGR %): U Shaped Recovery
FIG.618 Egypt Counter-UAV Market Value Forecast, 2020 – 2030 (USD Million, AGR %): L Shaped Recovery
FIG.619 Egypt Counter-UAV Market Value Forecast, 2020 – 2030 (USD Million, AGR %): W Shaped Recovery
FIG.620 Egypt Counter-UAV Market by Platform, 2020 – 2030 (USD Million, AGR %): V Shaped Recovery
FIG.621 Egypt Counter-UAV Market by Platform, 2020 – 2030 (USD Million, AGR %): V Shaped Recovery
FIG.622 Egypt Counter-UAV Market by Platform, 2020 – 2030 (USD Million, AGR %): U Shaped Recovery
FIG.623 Egypt Counter-UAV Market by Platform, 2020 – 2030 (USD Million, AGR %): L Shaped Recovery
FIG.624 Egypt Counter-UAV Market by Platform, 2020 – 2030 (USD Million, AGR %): W Shaped Recovery
FIG.625 Egypt Counter-UAV Market by Type, 2020 – 2030 (USD Million, AGR %)
FIG.626 Egypt Counter-UAV Market by Type, 2020 – 2030 (USD Million, AGR %): V Shaped Recovery
FIG.627 Egypt Counter-UAV Market by Type, 2020 – 2030 (USD Million, AGR %): U Shaped Recovery
FIG.628 Egypt Counter-UAV Market by Type, 2020 – 2030 (USD Million, AGR %): L Shaped Recovery
FIG.629 Egypt Counter-UAV Market by Type, 2020 – 2030 (USD Million, AGR %): W Shaped Recovery
FIG.630 Egypt Counter-UAV Market by Technology, 2020 – 2030 (USD Million, AGR %)
FIG.631 Egypt Counter-UAV Market by Technology, 2020 – 2030 (USD Million, AGR %): V Shaped Recovery
FIG.632 Egypt Counter-UAV Market by Technology, 2020 – 2030 (USD Million, AGR %): U Shaped Recovery
FIG.633 Egypt Counter-UAV Market by Technology, 2020 – 2030 (USD Million, AGR %): L Shaped Recovery
FIG.634 Egypt Counter-UAV Market by Technology, 2020 – 2030 (USD Million, AGR %): W Shaped Recovery
FIG.635 Rest of Middle East & Africa Counter-UAV Market Value Forecast, 2020 – 2030 (USD Million, AGR %)
FIG.636 Rest of Middle East & Africa Counter-UAV Market Value Forecast, 2020 – 2030 (USD Million, AGR %): V Shaped Recovery
FIG.637 Rest of Middle East & Africa Counter-UAV Market Value Forecast, 2020 – 2030 (USD Million, AGR %): U Shaped Recovery
FIG.638 Rest of Middle East & Africa Counter-UAV Market Value Forecast, 2020 – 2030 (USD Million, AGR %): L Shaped Recovery
FIG.639 Rest of Middle East & Africa Counter-UAV Market Value Forecast, 2020 – 2030 (USD Million, AGR %): W Shaped Recovery
FIG.640 Rest of Middle East & Africa Counter-UAV Market by Platform, 2020 – 2030 (USD Million, AGR %)
FIG.641 Rest of Middle East & Africa Counter-UAV Market by Platform, 2020 – 2030 (USD Million, AGR %): V Shaped Recovery
FIG.642 Rest of Middle East & Africa Counter-UAV Market by Platform, 2020 – 2030 (USD Million, AGR %): U Shaped Recovery
FIG.643 Rest of Middle East & Africa Counter-UAV Market by Platform, 2020 – 2030 (USD Million, AGR %): L Shaped Recovery
FIG.644 Rest of Middle East & Africa Counter-UAV Market by Platform, 2020 – 2030 (USD Million, AGR %): W Shaped Recovery
FIG.645 Rest of Middle East & Africa Counter-UAV Market by Type, 2020 – 2030 (USD Million, AGR %)
FIG.646 Rest of Middle East & Africa Counter-UAV Market by Type, 2020 – 2030 (USD Million, AGR %): V Shaped Recovery
FIG.647 Rest of Middle East & Africa Counter-UAV Market by Type, 2020 – 2030 (USD Million, AGR %): U Shaped Recovery
FIG.648 Rest of Middle East & Africa Counter-UAV Market by Type, 2020 – 2030 (USD Million, AGR %): L Shaped Recovery
FIG.649 Rest of Middle East & Africa Counter-UAV Market by Type, 2020 – 2030 (USD Million, AGR %): W Shaped Recovery
FIG.650 Rest of Middle East & Africa Counter-UAV Market by Technology, 2020 – 2030 (USD Million, AGR %)
FIG.651 Rest of Middle East & Africa Counter-UAV Market by Technology, 2020 – 2030 (USD Million, AGR %): V Shaped Recovery
FIG.652 Rest of Middle East & Africa Counter-UAV Market by Technology, 2020 – 2030 (USD Million, AGR %): U Shaped Recovery
FIG.653 Rest of Middle East & Africa Counter-UAV Market by Technology, 2020 – 2030 (USD Million, AGR %): L Shaped Recovery
FIG.654 Rest of Middle East & Africa Counter-UAV Market by Technology, 2020 – 2030 (USD Million, AGR %): W Shaped Recovery
FIG.655 Boeing Company.: Financials 2016 – 2019, (USD Million, AGR %)
FIG.656 Boeing Company: Business Segment, 2019 (%)
FIG.657 Boeing Company: Type of Sales, 2019 (%)
FIG.658 Boeing Company: Research and Development Expense (2019)
FIG.659 Airbus Group SE.: Financials 2016 – 2019, (USD Million, AGR %)
FIG.660 Airbus Group SE: Business Segment, 2019 (%)
FIG.661 Airbus Group SE: Market by Region, 2019 (%)
FIG.662 Saab AB.: Financials 2016 – 2019, (USD Million, AGR %)
FIG.663 Saab AB: Business Segment, 2019 (%)
FIG.664 Saab AB: Headcount by Region, 2019 (%)
FIG.665 Thales Group.: Financials 2017 – 2019, (USD Million, AGR %)
FIG.666 Thales Group: Business Segment, 2019 (%)
FIG.667 Thales Group: Headcount by Region, 2019 (%)
FIG.668 Lockheed Martin.: Financials 2016 – 2019, (USD Million, AGR %)
FIG.669 Lockheed Martin: Business Segment, 2019 (%)
FIG.670 Lockheed Martin: Type of Sales, 2019 (%)
FIG.671 Lockheed Martin: Market by Region, 2019 (%)
FIG.672 Israel Aerospace Industries.: Financials 2016 – 2019, (USD Million, AGR %)
FIG.673 Raytheon Company.: Financials 2017 – 2019, (USD Million, AGR %)
FIG.674 Northrop Grumman Corporation.: Financials 2016 – 2019, (USD Million, AGR %)
FIG.675 Northrop Grumman Corporation: Business Segment, 2019 (%)
FIG.676 Northrop Grumman Corporation: Headcount by Region, 2019 (%)
FIG.677 Rafael Advanced Defense Systems.: Financials 2016 – 2019, (USD Million, AGR %)
FIG.678 Rheinmetall AG: Financials 2016 – 2019, (USD Million, AGR %)
FIG.679 Rheinmetall AG: Business Segment, 2019 (%)
FIG.680 Rheinmetall AG: Market by Region, 2019 (%)
FIG.681 Hensoldt GmbH: Market by Region, 2019 (%)
FIG.682 L-3Harris Technologies: Financials 2016 – 2019, (USD Million, AGR %)
FIG.683 L-3Harris Technologies: Business Segment, 2019 (%)
FIG.684 L-3Harris Technologies: Type of Sales, 2019 (%)
List of Tables
Table 1 Counter-UAV Market Size, 2020 – 2030 (USD Million, AGR %, CAGR %)
Table 2 Counter-UAV Market Size by Platform, 2020 – 2030 (USD Million, AGR %, CAGR %)
Table 3 Counter-UAV Market Size by Platform, 2020 – 2030 (USD Million, AGR %, CAGR %): V Shaped Recovery
Table 4 Counter-UAV Market Size by Platform, 2020 – 2030 (USD Million, AGR %, CAGR %): U Shaped Recovery
Table 5 Counter-UAV Market Size by Platform, 2020 – 2030 (USD Million, AGR %, CAGR %): L Shaped Recovery
Table 6 Counter-UAV Market Size by Platform, 2020 – 2030 (USD Million, AGR %, CAGR %): W Shaped Recovery
Table 7 Counter-UAV Market for Defense, 2020-2030 (USD Million, AGR %, CAGR %)
Table 8 Counter-UAV Market for Defense, 2020-2030 (USD Million, AGR %, CAGR %): V Shaped Recovery
Table 9 Counter-UAV Market for Defense, 2020-2030 (USD Million, AGR %, CAGR %): U Shaped Recovery
Table 10 Counter-UAV Market for Defense, 2020-2030 (USD Million, AGR %, CAGR %): L Shaped Recovery
Table 11 Counter-UAV Market for Defense, 2020-2030 (USD Million, AGR %, CAGR %): W Shaped Recovery
Table 12 Counter-UAV Market for Commercial, 2020-2030 (USD Million, AGR %, CAGR %)
Table 13 Counter-UAV Market for Commercial, 2020-2030 (USD Million, AGR %, CAGR %): V Shaped Recovery
Table 14 Counter-UAV Market for Commercial, 2020-2030 (USD Million, AGR %, CAGR %): U Shaped Recovery
Table 15 Counter-UAV Market for Commercial, 2020-2030 (USD Million, AGR %, CAGR %): L Shaped Recovery
Table 16 Counter-UAV Market for Commercial, 2020-2030 (USD Million, AGR %, CAGR %): W Shaped Recovery
Table 17 Counter-UAV Market Size by Type, 2020 – 2030 (USD Million, AGR %, CAGR %)
Table 18 Counter-UAV Market Size by Type, 2020 – 2030 (USD Million, AGR %, CAGR %): V Shaped Recovery
Table 19 Counter-UAV Market Size by Type, 2020 – 2030 (USD Million, AGR %, CAGR %): U Shaped Recovery
Table 20 Counter-UAV Market Size by Type, 2020 – 2030 (USD Million, AGR %, CAGR %): L Shaped Recovery
Table 21 Counter-UAV Market Size by Type, 2020 – 2030 (USD Million, AGR %, CAGR %): W Shaped Recovery
Table 22 Counter-UAV Market for Detection, 2020-2030 (USD Million, AGR %, CAGR %)
Table 23 Counter-UAV Market for Detection, 2020-2030 (USD Million, AGR %, CAGR %): V Shaped Recovery
Table 24 Counter-UAV Market for Detection, 2020-2030 (USD Million, AGR %, CAGR %): U Shaped Recovery
Table 25 Counter-UAV Market for Detection, 2020-2030 (USD Million, AGR %, CAGR %): L Shaped Recovery
Table 26 Counter-UAV Market for Detection, 2020-2030 (USD Million, AGR %, CAGR %): W Shaped Recovery
Table 27 Global Counter-UAV Market Size by Detection Type, 2020 – 2030 (USD Million, AGR %, CAGR %)
Table 28 Global Counter-UAV Market Size by Detection Type, 2020 – 2030 (USD Million, AGR %, CAGR %): V Shaped Recovery
Table 29 Global Counter-UAV Market Size by Detection Type, 2020 – 2030 (USD Million, AGR %, CAGR %): U Shaped Recovery
Table 30 Global Counter-UAV Market Size by Detection Type, 2020 – 2030 (USD Million, AGR %, CAGR %): L Shaped Recovery
Table 31 Global Counter-UAV Market Size by Detection Type, 2020 – 2030 (USD Million, AGR %, CAGR %): W Shaped Recovery
Table 32 Counter-UAV Market for Countermeasure, 2020-2030 (USD Million, AGR %, CAGR %)
Table 33 Counter-UAV Market for Countermeasure, 2020-2030 (USD Million, AGR %, CAGR %): V Shaped Recovery
Table 34 Counter-UAV Market for Countermeasure, 2020-2030 (USD Million, AGR %, CAGR %): U Shaped Recovery
Table 35 Counter-UAV Market for Countermeasure, 2020-2030 (USD Million, AGR %, CAGR %): L Shaped Recovery
Table 36 Counter-UAV Market for Countermeasure, 2020-2030 (USD Million, AGR %, CAGR %): W Shaped Recovery
Table 37 Global Counter-UAV Market Size by Countermeasure Type, 2020 – 2030 (USD Million, AGR %, CAGR %)
Table 38 Global Counter-UAV Market Size by Countermeasure Type, 2020 – 2030 (USD Million, AGR %, CAGR %): V Shaped Recovery
Table 39 Global Counter-UAV Market Size by Countermeasure Type, 2020 – 2030 (USD Million, AGR %, CAGR %): U Shaped Recovery
Table 40 Global Counter-UAV Market Size by Countermeasure Type, 2020 – 2030 (USD Million, AGR %, CAGR %): L Shaped Recovery
Table 41 Global Counter-UAV Market Size by Countermeasure Type, 2020 – 2030 (USD Million, AGR %, CAGR %): W Shaped Recovery
Table 42 Counter-UAV Market Size by Technology, 2020 – 2030 (USD Million, AGR %, CAGR %)
Table 43 Counter-UAV Market Size by Technology, 2020 – 2030 (USD Million, AGR %, CAGR %): V Shaped Recovery
Table 44 Counter-UAV Market Size by Technology, 2020 – 2030 (USD Million, AGR %, CAGR %): U Shaped Recovery
Table 45 Counter-UAV Market Size by Technology, 2020 – 2030 (USD Million, AGR %, CAGR %): L Shaped Recovery
Table 46 Counter-UAV Market Size by Technology, 2020 – 2030 (USD Million, AGR %, CAGR %): W Shaped Recovery
Table 47 Counter-UAV Market for Electronic, 2020-2030 (USD Million, AGR %, CAGR %)
Table 48 Counter-UAV Market for Electronic, 2020-2030 (USD Million, AGR %, CAGR %): V Shaped Recovery
Table 49 Counter-UAV Market for Electronic, 2020-2030 (USD Million, AGR %, CAGR %): U Shaped Recovery
Table 50 Counter-UAV Market for Electronic, 2020-2030 (USD Million, AGR %, CAGR %): L Shaped Recovery
Table 51 Counter-UAV Market for Electronic, 2020-2030 (USD Million, AGR %, CAGR %): W Shaped Recovery
Table 52 Counter-UAV Market for Kinetic, 2020-2030 (USD Million, AGR %, CAGR %)
Table 53 Counter-UAV Market for Kinetic, 2020-2030 (USD Million, AGR %, CAGR %): V Shaped Recovery
Table 54 Counter-UAV Market for Kinetic, 2020-2030 (USD Million, AGR %, CAGR %): U Shaped Recovery
Table 55 Counter-UAV Market for Kinetic, 2020-2030 (USD Million, AGR %, CAGR %): L Shaped Recovery
Table 56 Counter-UAV Market for Kinetic, 2020-2030 (USD Million, AGR %, CAGR %): W Shaped Recovery
Table 57 Global Counter-UAV Market Size by Region, 2020 – 2030 (USD Million, AGR %, CAGR %)
Table 58 Global Counter-UAV Market Size by Region, 2020 – 2030 (USD Million, AGR %, CAGR %): V Shaped Recovery
Table 59 Global Counter-UAV Market Size by Region, 2020 – 2030 (USD Million, AGR %, CAGR %): U Shaped Recovery
Table 60 Global Counter-UAV Market Size by Region, 2020 – 2030 (USD Million, AGR %, CAGR %): L Shaped Recovery
Table 61 Global Counter-UAV Market Size by Region, 2020 – 2030 (USD Million, AGR %, CAGR %): W Shaped Recovery
Table 62 North America Counter-UAV Market, 2020-2030 (USD Million, AGR %, CAGR %)
Table 63 North America Counter-UAV Market, 2020-2030 (USD Million, AGR %, CAGR %): V Shaped Recovery
Table 64 North America Counter-UAV Market, 2020-2030 (USD Million, AGR %, CAGR %): U Shaped Recovery
Table 65 North America Counter-UAV Market, 2020-2030 (USD Million, AGR %, CAGR %): L Shaped Recovery
Table 66 North America Counter-UAV Market, 2020-2030 (USD Million, AGR %, CAGR %): W Shaped Recovery
Table 67 North America Counter-UAV Market Size by Platform, 2020 – 2030 (USD Million, AGR %, CAGR %)
Table 68 North America Counter-UAV Market Size by Platform, 2020 – 2030 (USD Million, AGR %, CAGR %): V Shaped Recovery
Table 69 North America Counter-UAV Market Size by Platform, 2020 – 2030 (USD Million, AGR %, CAGR %): U Shaped Recovery
Table 70 North America Counter-UAV Market Size by Platform, 2020 – 2030 (USD Million, AGR %, CAGR %): L Shaped Recovery
Table 71 North America Counter-UAV Market Size by Platform, 2020 – 2030 (USD Million, AGR %, CAGR %): W Shaped Recovery
Table 72 North America Counter-UAV Market Size by Type, 2020 – 2030 (USD Million, AGR %, CAGR %)
Table 73 North America Counter-UAV Market Size by Type, 2020 – 2030 (USD Million, AGR %, CAGR %): V Shaped Recovery
Table 74 North America Counter-UAV Market Size by Type, 2020 – 2030 (USD Million, AGR %, CAGR %): U Shaped Recovery
Table 75 North America Counter-UAV Market Size by Type, 2020 – 2030 (USD Million, AGR %, CAGR %): L Shaped Recovery
Table 76 North America Counter-UAV Market Size by Type, 2020 – 2030 (USD Million, AGR %, CAGR %): W Shaped Recovery
Table 77 North America Counter-UAV Market Size by Technology, 2020 – 2030 (USD Million, AGR %, CAGR %)
Table 78 North America Counter-UAV Market Size by Technology, 2020 – 2030 (USD Million, AGR %, CAGR %): V Shaped Recovery
Table 79 North America Counter-UAV Market Size by Technology, 2020 – 2030 (USD Million, AGR %, CAGR %): U Shaped Recovery
Table 80 North America Counter-UAV Market Size by Technology, 2020 – 2030 (USD Million, AGR %, CAGR %): L Shaped Recovery
Table 81 North America Counter-UAV Market Size by Type, 2020 – 2030 (USD Million, AGR %, CAGR %): W Shaped Recovery
Table 82 U.S. Counter-UAV Market, 2020-2030 (USD Million, AGR %, CAGR %)
Table 83 U.S. Counter-UAV Market, 2020-2030 (USD Million, AGR %, CAGR %): V Shaped Recovery
Table 84 U.S. Counter-UAV Market, 2020-2030 (USD Million, AGR %, CAGR %): U Shaped Recovery
Table 85 U.S. Counter-UAV Market, 2020-2030 (USD Million, AGR %, CAGR %): L Shaped Recovery
Table 86 U.S. Counter-UAV Market, 2020-2030 (USD Million, AGR %, CAGR %): W Shaped Recovery
Table 87 U.S. Counter-UAV Market Size by Platform, 2020 – 2030 (USD Million, AGR %, CAGR %)
Table 88 U.S. Counter-UAV Market Size by Platform, 2020 – 2030 (USD Million, AGR %, CAGR %): V Shaped Recovery
Table 89 U.S. Counter-UAV Market Size by Platform, 2020 – 2030 (USD Million, AGR %, CAGR %): U Shaped Recovery
Table 90 U.S. Counter-UAV Market Size by Platform, 2020 – 2030 (USD Million, AGR %, CAGR %): L Shaped Recovery
Table 91 U.S. Counter-UAV Market Size by Platform, 2020 – 2030 (USD Million, AGR %, CAGR %): W Shaped Recovery
Table 92 U.S. Counter-UAV Market Size by Type, 2020 – 2030 (USD Million, AGR %, CAGR %)
Table 93 U.S. Counter-UAV Market Size by Type, 2020 – 2030 (USD Million, AGR %, CAGR %): V Shaped Recovery
Table 94 U.S. Counter-UAV Market Size by Type, 2020 – 2030 (USD Million, AGR %, CAGR %): U Shaped Recovery
Table 95 U.S. Counter-UAV Market Size by Type, 2020 – 2030 (USD Million, AGR %, CAGR %): L Shaped Recovery
Table 96 U.S. Counter-UAV Market Size by Type, 2020 – 2030 (USD Million, AGR %, CAGR %): W Shaped Recovery
Table 97 U.S. Counter-UAV Market Size by Technology, 2020 – 2030 (USD Million, AGR %, CAGR %)
Table 98 U.S. Counter-UAV Market Size by Technology, 2020 – 2030 (USD Million, AGR %, CAGR %): V Shaped Recovery
Table 99 U.S. Counter-UAV Market Size by Technology, 2020 – 2030 (USD Million, AGR %, CAGR %): U Shaped Recovery
Table 100 U.S. Counter-UAV Market Size by Technology, 2020 – 2030 (USD Million, AGR %, CAGR %): L Shaped Recovery
Table 101 U.S. Counter-UAV Market Size by Type, 2020 – 2030 (USD Million, AGR %, CAGR %): W Shaped Recovery
Table 102 Canada Counter-UAV Market, 2020-2030 (USD Million, AGR %, CAGR %)
Table 103 Canada Counter-UAV Market, 2020-2030 (USD Million, AGR %, CAGR %): V Shaped Recovery
Table 104 Canada Counter-UAV Market, 2020-2030 (USD Million, AGR %, CAGR %): U Shaped Recovery
Table 105 Canada Counter-UAV Market, 2020-2030 (USD Million, AGR %, CAGR %): L Shaped Recovery
Table 106 Canada Counter-UAV Market, 2020-2030 (USD Million, AGR %, CAGR %): W Shaped Recovery
Table 107 Canada Counter-UAV Market Size by Platform, 2020 – 2030 (USD Million, AGR %, CAGR %)
Table 108 Canada Counter-UAV Market Size by Platform, 2020 – 2030 (USD Million, AGR %, CAGR %): V Shaped Recovery
Table 109 Canada Counter-UAV Market Size by Platform, 2020 – 2030 (USD Million, AGR %, CAGR %): U Shaped Recovery
Table 110 Counter-UAV Market Size by Platform, 2020 – 2030 (USD Million, AGR %, CAGR %): L Shaped Recovery
Table 111 Canada Counter-UAV Market Size by Platform, 2020 – 2030 (USD Million, AGR %, CAGR %): W Shaped Recovery
Table 112 Canada Counter-UAV Market Size by Type, 2020 – 2030 (USD Million, AGR %, CAGR %)
Table 113 Canada Counter-UAV Market Size by Type, 2020 – 2030 (USD Million, AGR %, CAGR %): V Shaped Recovery
Table 114 Canada Counter-UAV Market Size by Type, 2020 – 2030 (USD Million, AGR %, CAGR %): U Shaped Recovery
Table 115 Canada Counter-UAV Market Size by Type, 2020 – 2030 (USD Million, AGR %, CAGR %): L Shaped Recovery
Table 116 Canada Counter-UAV Market Size by Type, 2020 – 2030 (USD Million, AGR %, CAGR %): W Shaped Recovery
Table 117 Canada Counter-UAV Market Size by Technology, 2020 – 2030 (USD Million, AGR %, CAGR %)
Table 118 Canada Counter-UAV Market Size by Technology, 2020 – 2030 (USD Million, AGR %, CAGR %): V Shaped Recovery
Table 119 Canada Counter-UAV Market Size by Technology, 2020 – 2030 (USD Million, AGR %, CAGR %): U Shaped Recovery
Table 120 Canada Counter-UAV Market Size by Technology, 2020 – 2030 (USD Million, AGR %, CAGR %): L Shaped Recovery
Table 121 Canada Counter-UAV Market Size by Type, 2020 – 2030 (USD Million, AGR %, CAGR %): W Shaped Recovery
Table 122 Europe Counter-UAV Market, 2020-2030 (USD Million, AGR %, CAGR %)
Table 123 Europe Counter-UAV Market, 2020-2030 (USD Million, AGR %, CAGR %): V Shaped Recovery
Table 124 Europe Counter-UAV Market, 2020-2030 (USD Million, AGR %, CAGR %): U Shaped Recovery
Table 125 Europe Counter-UAV Market, 2020-2030 (USD Million, AGR %, CAGR %): L Shaped Recovery
Table 126 Europe Counter-UAV Market, 2020-2030 (USD Million, AGR %, CAGR %): W Shaped Recovery
Table 127 Europe Counter-UAV Market Size by Platform, 2020 – 2030 (USD Million, AGR %, CAGR %)
Table 128 Europe Counter-UAV Market Size by Platform, 2020 – 2030 (USD Million, AGR %, CAGR %): V Shaped Recovery
Table 129 Europe Counter-UAV Market Size by Platform, 2020 – 2030 (USD Million, AGR %, CAGR %): U Shaped Recovery
Table 130 Europe Counter-UAV Market Size by Platform, 2020 – 2030 (USD Million, AGR %, CAGR %): L Shaped Recovery
Table 131 Europe Counter-UAV Market Size by Platform, 2020 – 2030 (USD Million, AGR %, CAGR %): W Shaped Recovery
Table 132 Europe Counter-UAV Market Size by Type, 2020 – 2030 (USD Million, AGR %, CAGR %)
Table 133 Europe Counter-UAV Market Size by Type, 2020 – 2030 (USD Million, AGR %, CAGR %): V Shaped Recovery
Table 134 Europe Counter-UAV Market Size by Type, 2020 – 2030 (USD Million, AGR %, CAGR %): U Shaped Recovery
Table 135 Europe Counter-UAV Market Size by Type, 2020 – 2030 (USD Million, AGR %, CAGR %): L Shaped Recovery
Table 136 Europe Counter-UAV Market Size by Type, 2020 – 2030 (USD Million, AGR %, CAGR %): W Shaped Recovery
Table 137 Europe Counter-UAV Market Size by Technology, 2020 – 2030 (USD Million, AGR %, CAGR %)
Table 138 Europe Counter-UAV Market Size by Technology, 2020 – 2030 (USD Million, AGR %, CAGR %): V Shaped Recovery
Table 139 Europe Counter-UAV Market Size by Technology, 2020 – 2030 (USD Million, AGR %, CAGR %): U Shaped Recovery
Table 140 Europe Counter-UAV Market Size by Technology, 2020 – 2030 (USD Million, AGR %, CAGR %): L Shaped Recovery
Table 141 Europe Counter-UAV Market Size by Type, 2020 – 2030 (USD Million, AGR %, CAGR %): W Shaped Recovery
Table 142 UK Counter-UAV Market, 2020-2030 (USD Million, AGR %, CAGR %)
Table 143 UK Counter-UAV Market, 2020-2030 (USD Million, AGR %, CAGR %): V Shaped Recovery
Table 144 UK Counter-UAV Market, 2020-2030 (USD Million, AGR %, CAGR %): U Shaped Recovery
Table 145 UK Counter-UAV Market, 2020-2030 (USD Million, AGR %, CAGR %): L Shaped Recovery
Table 146 UK Counter-UAV Market, 2020-2030 (USD Million, AGR %, CAGR %): W Shaped Recovery
Table 147 UK Counter-UAV Market Size by Platform, 2020 – 2030 (USD Million, AGR %, CAGR %)
Table 148 UK Counter-UAV Market Size by Platform, 2020 – 2030 (USD Million, AGR %, CAGR %): V Shaped Recovery
Table 149 UK Counter-UAV Market Size by Platform, 2020 – 2030 (USD Million, AGR %, CAGR %): U Shaped Recovery
Table 150 UK Counter-UAV Market Size by Platform, 2020 – 2030 (USD Million, AGR %, CAGR %): L Shaped Recovery
Table 151 UK Counter-UAV Market Size by Platform, 2020 – 2030 (USD Million, AGR %, CAGR %): W Shaped Recovery
Table 152 UK Counter-UAV Market Size by Type, 2020 – 2030 (USD Million, AGR %, CAGR %)
Table 153 UK Counter-UAV Market Size by Type, 2020 – 2030 (USD Million, AGR %, CAGR %): V Shaped Recovery
Table 154 UK Counter-UAV Market Size by Type, 2020 – 2030 (USD Million, AGR %, CAGR %): U Shaped Recovery
Table 155 UK Counter-UAV Market Size by Type, 2020 – 2030 (USD Million, AGR %, CAGR %): L Shaped Recovery
Table 156 UK Counter-UAV Market Size by Type, 2020 – 2030 (USD Million, AGR %, CAGR %): W Shaped Recovery
Table 157 UK Counter-UAV Market Size by Technology, 2020 – 2030 (USD Million, AGR %, CAGR %)
Table 158 UK Counter-UAV Market Size by Technology, 2020 – 2030 (USD Million, AGR %, CAGR %): V Shaped Recovery
Table 159 UK Counter-UAV Market Size by Technology, 2020 – 2030 (USD Million, AGR %, CAGR %): U Shaped Recovery
Table 160 UK Counter-UAV Market Size by Technology, 2020 – 2030 (USD Million, AGR %, CAGR %): L Shaped Recovery
Table 161 UK Counter-UAV Market Size by Type, 2020 – 2030 (USD Million, AGR %, CAGR %): W Shaped Recovery
Table 162 Germany Counter-UAV Market, 2020-2030 (USD Million, AGR %, CAGR %)
Table 163 Germany Counter-UAV Market, 2020-2030 (USD Million, AGR %, CAGR %): V Shaped Recovery
Table 164 Germany Counter-UAV Market, 2020-2030 (USD Million, AGR %, CAGR %): U Shaped Recovery
Table 165 Germany Counter-UAV Market, 2020-2030 (USD Million, AGR %, CAGR %): L Shaped Recovery
Table 166 Germany Counter-UAV Market, 2020-2030 (USD Million, AGR %, CAGR %): W Shaped Recovery
Table 167 Germany Counter-UAV Market Size by Platform, 2020 – 2030 (USD Million, AGR %, CAGR %)
Table 168 Germany Counter-UAV Market Size by Platform, 2020 – 2030 (USD Million, AGR %, CAGR %): V Shaped Recovery
Table 169 Germany Counter-UAV Market Size by Platform, 2020 – 2030 (USD Million, AGR %, CAGR %): U Shaped Recovery
Table 170 Germany Counter-UAV Market Size by Platform, 2020 – 2030 (USD Million, AGR %, CAGR %): L Shaped Recovery
Table 171 Germany Counter-UAV Market Size by Platform, 2020 – 2030 (USD Million, AGR %, CAGR %): W Shaped Recovery
Table 172 Germany Counter-UAV Market Size by Type, 2020 – 2030 (USD Million, AGR %, CAGR %)
Table 173 Germany Counter-UAV Market Size by Type, 2020 – 2030 (USD Million, AGR %, CAGR %): V Shaped Recovery
Table 174 Germany Counter-UAV Market Size by Type, 2020 – 2030 (USD Million, AGR %, CAGR %): U Shaped Recovery
Table 175 Germany Counter-UAV Market Size by Type, 2020 – 2030 (USD Million, AGR %, CAGR %): L Shaped Recovery
Table 176 Germany Counter-UAV Market Size by Type, 2020 – 2030 (USD Million, AGR %, CAGR %): W Shaped Recovery
Table 177 Germany Counter-UAV Market Size by Technology, 2020 – 2030 (USD Million, AGR %, CAGR %)
Table 178 Germany Counter-UAV Market Size by Technology, 2020 – 2030 (USD Million, AGR %, CAGR %): V Shaped Recovery
Table 179 Germany Counter-UAV Market Size by Technology, 2020 – 2030 (USD Million, AGR %, CAGR %): U Shaped Recovery
Table 180 Germany Counter-UAV Market Size by Technology, 2020 – 2030 (USD Million, AGR %, CAGR %): L Shaped Recovery
Table 181 Germany Counter-UAV Market Size by Technology, 2020 – 2030 (USD Million, AGR %, CAGR %): W Shaped Recovery
Table 182 France Counter-UAV Market, 2020-2030 (USD Million, AGR %, CAGR %)
Table 183 France Counter-UAV Market, 2020-2030 (USD Million, AGR %, CAGR %): V Shaped Recovery
Table 184 France Counter-UAV Market, 2020-2030 (USD Million, AGR %, CAGR %): U Shaped Recovery
Table 185 France Counter-UAV Market, 2020-2030 (USD Million, AGR %, CAGR %): L Shaped Recovery
Table 186 France Counter-UAV Market, 2020-2030 (USD Million, AGR %, CAGR %): W Shaped Recovery
Table 187 France Counter-UAV Market Size by Platform, 2020 – 2030 (USD Million, AGR %, CAGR %)
Table 188 France Counter-UAV Market Size by Platform, 2020 – 2030 (USD Million, AGR %, CAGR %): V Shaped Recovery
Table 189 France Counter-UAV Market Size by Platform, 2020 – 2030 (USD Million, AGR %, CAGR %): U Shaped Recovery
Table 190 France Counter-UAV Market Size by Platform, 2020 – 2030 (USD Million, AGR %, CAGR %): L Shaped Recovery
Table 191 France Counter-UAV Market Size by Platform, 2020 – 2030 (USD Million, AGR %, CAGR %): W Shaped Recovery
Table 192 France Counter-UAV Market Size by Type, 2020 – 2030 (USD Million, AGR %, CAGR %)
Table 193 France Counter-UAV Market Size by Type, 2020 – 2030 (USD Million, AGR %, CAGR %): V Shaped Recovery
Table 194 France Counter-UAV Market Size by Type, 2020 – 2030 (USD Million, AGR %, CAGR %): U Shaped Recovery
Table 195 France Counter-UAV Market Size by Type, 2020 – 2030 (USD Million, AGR %, CAGR %): L Shaped Recovery
Table 196 France Counter-UAV Market Size by Type, 2020 – 2030 (USD Million, AGR %, CAGR %): W Shaped Recovery
Table 197 France Counter-UAV Market Size by Technology, 2020 – 2030 (USD Million, AGR %, CAGR %)
Table 198 France Counter-UAV Market Size by Technology, 2020 – 2030 (USD Million, AGR %, CAGR %): V Shaped Recovery
Table 199 France Counter-UAV Market Size by Technology, 2020 – 2030 (USD Million, AGR %, CAGR %): U Shaped Recovery
Table 200 France Counter-UAV Market Size by Technology, 2020 – 2030 (USD Million, AGR %, CAGR %): L Shaped Recovery
Table 201 France Counter-UAV Market Size by Technology, 2020 – 2030 (USD Million, AGR %, CAGR %): W Shaped Recovery
Table 202 Italy Counter-UAV Market, 2020-2030 (USD Million, AGR %, CAGR %)
Table 203 Italy Counter-UAV Market, 2020-2030 (USD Million, AGR %, CAGR %): V Shaped Recovery
Table 204 Italy Counter-UAV Market, 2020-2030 (USD Million, AGR %, CAGR %): U Shaped Recovery
Table 205 Italy Counter-UAV Market, 2020-2030 (USD Million, AGR %, CAGR %): L Shaped Recovery
Table 206 Italy Counter-UAV Market, 2020-2030 (USD Million, AGR %, CAGR %): W Shaped Recovery
Table 207 Italy Counter-UAV Market Size by Platform, 2020 – 2030 (USD Million, AGR %, CAGR %)
Table 208 Italy Counter-UAV Market Size by Platform, 2020 – 2030 (USD Million, AGR %, CAGR %): V Shaped Recovery
Table 209 Italy Counter-UAV Market Size by Platform, 2020 – 2030 (USD Million, AGR %, CAGR %): U Shaped Recovery
Table 210 Italy Counter-UAV Market Size by Platform, 2020 – 2030 (USD Million, AGR %, CAGR %): L Shaped Recovery
Table 211 Italy Counter-UAV Market Size by Platform, 2020 – 2030 (USD Million, AGR %, CAGR %): W Shaped Recovery
Table 212 Italy Counter-UAV Market Size by Type, 2020 – 2030 (USD Million, AGR %, CAGR %)
Table 213 Italy Counter-UAV Market Size by Type, 2020 – 2030 (USD Million, AGR %, CAGR %): V Shaped Recovery
Table 214 Italy Counter-UAV Market Size by Type, 2020 – 2030 (USD Million, AGR %, CAGR %): U Shaped Recovery
Table 215 Italy Counter-UAV Market Size by Type, 2020 – 2030 (USD Million, AGR %, CAGR %): L Shaped Recovery
Table 216 Italy Counter-UAV Market Size by Type, 2020 – 2030 (USD Million, AGR %, CAGR %): W Shaped Recovery
Table 217 Italy Counter-UAV Market Size by Technology, 2020 – 2030 (USD Million, AGR %, CAGR %)
Table 218 Italy Counter-UAV Market Size by Technology, 2020 – 2030 (USD Million, AGR %, CAGR %): V Shaped Recovery
Table 219 Italy Counter-UAV Market Size by Technology, 2020 – 2030 (USD Million, AGR %, CAGR %): U Shaped Recovery
Table 220 Italy Counter-UAV Market Size by Technology, 2020 – 2030 (USD Million, AGR %, CAGR %): L Shaped Recovery
Table 221 Italy Counter-UAV Market Size by Type, 2020 – 2030 (USD Million, AGR %, CAGR %): W Shaped Recovery
Table 222 Russia Counter-UAV Market, 2020-2030 (USD Million, AGR %, CAGR %)
Table 223 Russia Counter-UAV Market, 2020-2030 (USD Million, AGR %, CAGR %): V Shaped Recovery
Table 224 Russia Counter-UAV Market, 2020-2030 (USD Million, AGR %, CAGR %): U Shaped Recovery
Table 225 Russia Counter-UAV Market, 2020-2030 (USD Million, AGR %, CAGR %): L Shaped Recovery
Table 226 Russia Counter-UAV Market, 2020-2030 (USD Million, AGR %, CAGR %): W Shaped Recovery
Table 227 Russia Counter-UAV Market Size by Platform, 2020 – 2030 (USD Million, AGR %, CAGR %)
Table 228 Russia Counter-UAV Market Size by Platform, 2020 – 2030 (USD Million, AGR %, CAGR %): V Shaped Recovery
Table 229 Russia Counter-UAV Market Size by Platform, 2020 – 2030 (USD Million, AGR %, CAGR %): U Shaped Recovery
Table 230 Russia Counter-UAV Market Size by Platform, 2020 – 2030 (USD Million, AGR %, CAGR %): L Shaped Recovery
Table 231 Russia Counter-UAV Market Size by Platform, 2020 – 2030 (USD Million, AGR %, CAGR %): W Shaped Recovery
Table 232 Russia Counter-UAV Market Size by Type, 2020 – 2030 (USD Million, AGR %, CAGR %)
Table 233 Russia Counter-UAV Market Size by Type, 2020 – 2030 (USD Million, AGR %, CAGR %): V Shaped Recovery
Table 234 Russia Counter-UAV Market Size by Type, 2020 – 2030 (USD Million, AGR %, CAGR %): U Shaped Recovery
Table 235 Russia Counter-UAV Market Size by Type, 2020 – 2030 (USD Million, AGR %, CAGR %): L Shaped Recovery
Table 236 Russia Counter-UAV Market Size by Type, 2020 – 2030 (USD Million, AGR %, CAGR %): W Shaped Recovery
Table 237 Russia Counter-UAV Market Size by Technology, 2020 – 2030 (USD Million, AGR %, CAGR %)
Table 238 Russia Counter-UAV Market Size by Technology, 2020 – 2030 (USD Million, AGR %, CAGR %): V Shaped Recovery
Table 239 Russia Counter-UAV Market Size by Technology, 2020 – 2030 (USD Million, AGR %, CAGR %): U Shaped Recovery
Table 240 Russia Counter-UAV Market Size by Technology, 2020 – 2030 (USD Million, AGR %, CAGR %): L Shaped Recovery
Table 241 Russia Counter-UAV Market Size by Type, 2020 – 2030 (USD Million, AGR %, CAGR %): W Shaped Recovery
Table 242 Spain Counter-UAV Market, 2020-2030 (USD Million, AGR %, CAGR %)
Table 243 Spain Counter-UAV Market, 2020-2030 (USD Million, AGR %, CAGR %): V Shaped Recovery
Table 244 Spain Counter-UAV Market, 2020-2030 (USD Million, AGR %, CAGR %): U Shaped Recovery
Table 245 Spain Counter-UAV Market, 2020-2030 (USD Million, AGR %, CAGR %): L Shaped Recovery
Table 246 Spain Counter-UAV Market, 2020-2030 (USD Million, AGR %, CAGR %): W Shaped Recovery
Table 247 Spain Counter-UAV Market Size by Platform, 2020 – 2030 (USD Million, AGR %, CAGR %)
Table 248 Spain Counter-UAV Market Size by Platform, 2020 – 2030 (USD Million, AGR %, CAGR %): V Shaped Recovery
Table 249 Spain Counter-UAV Market Size by Platform, 2020 – 2030 (USD Million, AGR %, CAGR %): U Shaped Recovery
Table 250 Spain Counter-UAV Market Size by Platform, 2020 – 2030 (USD Million, AGR %, CAGR %): L Shaped Recovery
Table 251 Spain Counter-UAV Market Size by Platform, 2020 – 2030 (USD Million, AGR %, CAGR %): W Shaped Recovery
Table 252 Spain Counter-UAV Market Size by Type, 2020 – 2030 (USD Million, AGR %, CAGR %)
Table 253 Spain Counter-UAV Market Size by Type, 2020 – 2030 (USD Million, AGR %, CAGR %): V Shaped Recovery
Table 254 Spain Counter-UAV Market Size by Type, 2020 – 2030 (USD Million, AGR %, CAGR %): U Shaped Recovery
Table 255 Spain Counter-UAV Market Size by Type, 2020 – 2030 (USD Million, AGR %, CAGR %): L Shaped Recovery
Table 256 Spain Counter-UAV Market Size by Type, 2020 – 2030 (USD Million, AGR %, CAGR %): W Shaped Recovery
Table 257 Spain Counter-UAV Market Size by Technology, 2020 – 2030 (USD Million, AGR %, CAGR %)
Table 258 Spain Counter-UAV Market Size by Technology, 2020 – 2030 (USD Million, AGR %, CAGR %): V Shaped Recovery
Table 259 Spain Counter-UAV Market Size by Technology, 2020 – 2030 (USD Million, AGR %, CAGR %): U Shaped Recovery
Table 260 Spain Counter-UAV Market Size by Technology, 2020 – 2030 (USD Million, AGR %, CAGR %): L Shaped Recovery
Table 261 Spain Counter-UAV Market Size by Type, 2020 – 2030 (USD Million, AGR %, CAGR %): W Shaped Recovery
Table 262 Rest of Europe Counter-UAV Market, 2020-2030 (USD Million, AGR %, CAGR %)
Table 263 Rest of Europe Counter-UAV Market, 2020-2030 (USD Million, AGR %, CAGR %): V Shaped Recovery
Table 264 Rest of Europe Counter-UAV Market, 2020-2030 (USD Million, AGR %, CAGR %): U Shaped Recovery
Table 265 Rest of Europe Counter-UAV Market, 2020-2030 (USD Million, AGR %, CAGR %): L Shaped Recovery
Table 266 Rest of Europe Counter-UAV Market, 2020-2030 (USD Million, AGR %, CAGR %): W Shaped Recovery
Table 267 Rest of Europe Counter-UAV Market Size by Platform, 2020 – 2030 (USD Million, AGR %, CAGR %)
Table 268 Rest of Europe Counter-UAV Market Size by Platform, 2020 – 2030 (USD Million, AGR %, CAGR %): V Shaped Recovery
Table 269 Rest of Europe Counter-UAV Market Size by Platform, 2020 – 2030 (USD Million, AGR %, CAGR %): U Shaped Recovery
Table 270 Rest of Europe Counter-UAV Market Size by Platform, 2020 – 2030 (USD Million, AGR %, CAGR %): L Shaped Recovery
Table 271 Rest of Europe Counter-UAV Market Size by Platform, 2020 – 2030 (USD Million, AGR %, CAGR %): W Shaped Recovery
Table 272 Rest of Europe Counter-UAV Market Size by Type, 2020 – 2030 (USD Million, AGR %, CAGR %)
Table 273 Rest of Europe Counter-UAV Market Size by Type, 2020 – 2030 (USD Million, AGR %, CAGR %): V Shaped Recovery
Table 274 Rest of Europe Counter-UAV Market Size by Type, 2020 – 2030 (USD Million, AGR %, CAGR %): U Shaped Recovery
Table 275 Rest of Europe Counter-UAV Market Size by Type, 2020 – 2030 (USD Million, AGR %, CAGR %): L Shaped Recovery
Table 276 Rest of Europe Counter-UAV Market Size by Type, 2020 – 2030 (USD Million, AGR %, CAGR %): W Shaped Recovery
Table 277 Rest of Europe Counter-UAV Market Size by Technology, 2020 – 2030 (USD Million, AGR %, CAGR %)
Table 278 Rest of Europe Counter-UAV Market Size by Technology, 2020 – 2030 (USD Million, AGR %, CAGR %): V Shaped Recovery
Table 279 Rest of Europe Counter-UAV Market Size by Technology, 2020 – 2030 (USD Million, AGR %, CAGR %): U Shaped Recovery
Table 280 Rest of Europe Counter-UAV Market Size by Technology, 2020 – 2030 (USD Million, AGR %, CAGR %): L Shaped Recovery
Table 281 Rest of Europe Counter-UAV Market Size by Type, 2020 – 2030 (USD Million, AGR %, CAGR %): W Shaped Recovery
Table 282 Asia Pacific Counter-UAV Market, 2020-2030 (USD Million, AGR %, CAGR %)
Table 283 Asia Pacific Counter-UAV Market, 2020-2030 (USD Million, AGR %, CAGR %): V Shaped Recovery
Table 284 Asia Pacific Counter-UAV Market, 2020-2030 (USD Million, AGR %, CAGR %): U Shaped Recovery
Table 285 Asia Pacific Counter-UAV Market, 2020-2030 (USD Million, AGR %, CAGR %): L Shaped Recovery
Table 286 Asia Pacific Counter-UAV Market, 2020-2030 (USD Million, AGR %, CAGR %): W Shaped Recovery
Table 287 Asia Pacific Counter-UAV Market Size by Platform, 2020 – 2030 (USD Million, AGR %, CAGR %)
Table 288 Asia Pacific Counter-UAV Market Size by Platform, 2020 – 2030 (USD Million, AGR %, CAGR %): V Shaped Recovery
Table 289 Asia Pacific Counter-UAV Market Size by Platform, 2020 – 2030 (USD Million, AGR %, CAGR %): U Shaped Recovery
Table 290 Asia Pacific Counter-UAV Market Size by Platform, 2020 – 2030 (USD Million, AGR %, CAGR %): L Shaped Recovery
Table 291 Asia Pacific Counter-UAV Market Size by Platform, 2020 – 2030 (USD Million, AGR %, CAGR %): W Shaped Recovery
Table 292 Asia Pacific Counter-UAV Market Size by Type, 2020 – 2030 (USD Million, AGR %, CAGR %)
Table 293 Asia Pacific Counter-UAV Market Size by Type, 2020 – 2030 (USD Million, AGR %, CAGR %): V Shaped Recovery
Table 294 Asia Pacific Counter-UAV Market Size by Type, 2020 – 2030 (USD Million, AGR %, CAGR %): U Shaped Recovery
Table 295 Asia Pacific Counter-UAV Market Size by Type, 2020 – 2030 (USD Million, AGR %, CAGR %): L Shaped Recovery
Table 296 Asia Pacific Counter-UAV Market Size by Type, 2020 – 2030 (USD Million, AGR %, CAGR %): W Shaped Recovery
Table 297 Asia Pacific Counter-UAV Market Size by Technology, 2020 – 2030 (USD Million, AGR %, CAGR %)
Table 298 Asia Pacific Counter-UAV Market Size by Technology, 2020 – 2030 (USD Million, AGR %, CAGR %): V Shaped Recovery
Table 299 Asia Pacific Counter-UAV Market Size by Technology, 2020 – 2030 (USD Million, AGR %, CAGR %): U Shaped Recovery
Table 300 Asia Pacific Counter-UAV Market Size by Technology, 2020 – 2030 (USD Million, AGR %, CAGR %): L Shaped Recovery
Table 301 Asia Pacific Counter-UAV Market Size by Type, 2020 – 2030 (USD Million, AGR %, CAGR %): W Shaped Recovery
Table 302 China Counter-UAV Market, 2020-2030 (USD Million, AGR %, CAGR %)
Table 303 China Counter-UAV Market, 2020-2030 (USD Million, AGR %, CAGR %): V Shaped Recovery
Table 304 China Counter-UAV Market, 2020-2030 (USD Million, AGR %, CAGR %): U Shaped Recovery
Table 305 China Counter-UAV Market, 2020-2030 (USD Million, AGR %, CAGR %): L Shaped Recovery
Table 306 China Counter-UAV Market, 2020-2030 (USD Million, AGR %, CAGR %): W Shaped Recovery
Table 307 China Counter-UAV Market Size by Platform, 2020 – 2030 (USD Million, AGR %, CAGR %)
Table 308 China Counter-UAV Market Size by Platform, 2020 – 2030 (USD Million, AGR %, CAGR %): V Shaped Recovery
Table 309 China Counter-UAV Market Size by Platform, 2020 – 2030 (USD Million, AGR %, CAGR %): U Shaped Recovery
Table 310 China Counter-UAV Market Size by Platform, 2020 – 2030 (USD Million, AGR %, CAGR %): L Shaped Recovery
Table 311 China Counter-UAV Market Size by Platform, 2020 – 2030 (USD Million, AGR %, CAGR %): W Shaped Recovery
Table 312 China Counter-UAV Market Size by Type, 2020 – 2030 (USD Million, AGR %, CAGR %)
Table 313 China Counter-UAV Market Size by Type, 2020 – 2030 (USD Million, AGR %, CAGR %): V Shaped Recovery
Table 314 China Counter-UAV Market Size by Type, 2020 – 2030 (USD Million, AGR %, CAGR %): U Shaped Recovery
Table 315 China Counter-UAV Market Size by Type, 2020 – 2030 (USD Million, AGR %, CAGR %): L Shaped Recovery
Table 316 China Counter-UAV Market Size by Type, 2020 – 2030 (USD Million, AGR %, CAGR %): W Shaped Recovery
Table 317 China Counter-UAV Market Size by Technology, 2020 – 2030 (USD Million, AGR %, CAGR %)
Table 318 China Counter-UAV Market Size by Technology, 2020 – 2030 (USD Million, AGR %, CAGR %): V Shaped Recovery
Table 319 China Counter-UAV Market Size by Technology, 2020 – 2030 (USD Million, AGR %, CAGR %): U Shaped Recovery
Table 320 China Counter-UAV Market Size by Technology, 2020 – 2030 (USD Million, AGR %, CAGR %): L Shaped Recovery
Table 321 China Counter-UAV Market Size by Type, 2020 – 2030 (USD Million, AGR %, CAGR %): W Shaped Recovery
Table 322 Japan Counter-UAV Market, 2020-2030 (USD Million, AGR %, CAGR %)
Table 323 Japan Counter-UAV Market, 2020-2030 (USD Million, AGR %, CAGR %): V Shaped Recovery
Table 324 Japan Counter-UAV Market, 2020-2030 (USD Million, AGR %, CAGR %): U Shaped Recovery
Table 325 Japan Counter-UAV Market, 2020-2030 (USD Million, AGR %, CAGR %): L Shaped Recovery
Table 326 Japan Counter-UAV Market, 2020-2030 (USD Million, AGR %, CAGR %): W Shaped Recovery
Table 327 Japan Counter-UAV Market Size by Platform, 2020 – 2030 (USD Million, AGR %, CAGR %)
Table 328 Japan Counter-UAV Market Size by Platform, 2020 – 2030 (USD Million, AGR %, CAGR %): V Shaped Recovery
Table 329 Japan Counter-UAV Market Size by Platform, 2020 – 2030 (USD Million, AGR %, CAGR %): U Shaped Recovery
Table 330 Japan Counter-UAV Market Size by Platform, 2020 – 2030 (USD Million, AGR %, CAGR %): L Shaped Recovery
Table 331 Japan Counter-UAV Market Size by Platform, 2020 – 2030 (USD Million, AGR %, CAGR %): W Shaped Recovery
Table 332 Japan Counter-UAV Market Size by Type, 2020 – 2030 (USD Million, AGR %, CAGR %)
Table 333 Japan Counter-UAV Market Size by Type, 2020 – 2030 (USD Million, AGR %, CAGR %): V Shaped Recovery
Table 334 Japan Counter-UAV Market Size by Type, 2020 – 2030 (USD Million, AGR %, CAGR %): U Shaped Recovery
Table 335 Japan Counter-UAV Market Size by Type, 2020 – 2030 (USD Million, AGR %, CAGR %): L Shaped Recovery
Table 336 Japan Counter-UAV Market Size by Type, 2020 – 2030 (USD Million, AGR %, CAGR %): W Shaped Recovery
Table 337 Japan Counter-UAV Market Size by Technology, 2020 – 2030 (USD Million, AGR %, CAGR %)
Table 338 Japan Counter-UAV Market Size by Technology, 2020 – 2030 (USD Million, AGR %, CAGR %): V Shaped Recovery
Table 339 Japan Counter-UAV Market Size by Technology, 2020 – 2030 (USD Million, AGR %, CAGR %): U Shaped Recovery
Table 340 Japan Counter-UAV Market Size by Technology, 2020 – 2030 (USD Million, AGR %, CAGR %): L Shaped Recovery
Table 341 Japan Counter-UAV Market Size by Type, 2020 – 2030 (USD Million, AGR %, CAGR %): W Shaped Recovery
Table 342 India Counter-UAV Market, 2020-2030 (USD Million, AGR %, CAGR %)
Table 343 India Counter-UAV Market, 2020-2030 (USD Million, AGR %, CAGR %): V Shaped Recovery
Table 344 India Counter-UAV Market, 2020-2030 (USD Million, AGR %, CAGR %): U Shaped Recovery
Table 345 India Counter-UAV Market, 2020-2030 (USD Million, AGR %, CAGR %): L Shaped Recovery
Table 346 India Counter-UAV Market, 2020-2030 (USD Million, AGR %, CAGR %): W Shaped Recovery
Table 347 India Counter-UAV Market Size by Platform, 2020 – 2030 (USD Million, AGR %, CAGR %)
Table 348 India Counter-UAV Market Size by Platform, 2020 – 2030 (USD Million, AGR %, CAGR %): V Shaped Recovery
Table 349 India Counter-UAV Market Size by Platform, 2020 – 2030 (USD Million, AGR %, CAGR %): U Shaped Recovery
Table 350 India Counter-UAV Market Size by Platform, 2020 – 2030 (USD Million, AGR %, CAGR %): L Shaped Recovery
Table 351 India Counter-UAV Market Size by Platform, 2020 – 2030 (USD Million, AGR %, CAGR %): W Shaped Recovery
Table 352 India Counter-UAV Market Size by Type, 2020 – 2030 (USD Million, AGR %, CAGR %)
Table 353 India Counter-UAV Market Size by Type, 2020 – 2030 (USD Million, AGR %, CAGR %): V Shaped Recovery
Table 354 India Counter-UAV Market Size by Type, 2020 – 2030 (USD Million, AGR %, CAGR %): U Shaped Recovery
Table 355 India Counter-UAV Market Size by Type, 2020 – 2030 (USD Million, AGR %, CAGR %): L Shaped Recovery
Table 356 India Counter-UAV Market Size by Type, 2020 – 2030 (USD Million, AGR %, CAGR %): W Shaped Recovery
Table 357 India Counter-UAV Market Size by Technology, 2020 – 2030 (USD Million, AGR %, CAGR %)
Table 358 India Counter-UAV Market Size by Technology, 2020 – 2030 (USD Million, AGR %, CAGR %): V Shaped Recovery
Table 359 India Counter-UAV Market Size by Technology, 2020 – 2030 (USD Million, AGR %, CAGR %): U Shaped Recovery
Table 360 India Counter-UAV Market Size by Technology, 2020 – 2030 (USD Million, AGR %, CAGR %): L Shaped Recovery
Table 361 India Counter-UAV Market Size by Type, 2020 – 2030 (USD Million, AGR %, CAGR %): W Shaped Recovery
Table 362 South Korea Counter-UAV Market, 2020-2030 (USD Million, AGR %, CAGR %)
Table 363 South Korea Counter-UAV Market, 2020-2030 (USD Million, AGR %, CAGR %): V Shaped Recovery
Table 364 South Korea Counter-UAV Market, 2020-2030 (USD Million, AGR %, CAGR %): U Shaped Recovery
Table 365 South Korea Counter-UAV Market, 2020-2030 (USD Million, AGR %, CAGR %): L Shaped Recovery
Table 366 South Korea Counter-UAV Market, 2020-2030 (USD Million, AGR %, CAGR %): W Shaped Recovery
Table 367 South Korea Counter-UAV Market Size by Platform, 2020 – 2030 (USD Million, AGR %, CAGR %)
Table 368 South Korea Counter-UAV Market Size by Platform, 2020 – 2030 (USD Million, AGR %, CAGR %): V Shaped Recovery
Table 369 South Korea Counter-UAV Market Size by Platform, 2020 – 2030 (USD Million, AGR %, CAGR %): U Shaped Recovery
Table 370 South Korea Counter-UAV Market Size by Platform, 2020 – 2030 (USD Million, AGR %, CAGR %): L Shaped Recovery
Table 371 South Korea Counter-UAV Market Size by Platform, 2020 – 2030 (USD Million, AGR %, CAGR %): W Shaped Recovery
Table 372 South Korea Counter-UAV Market Size by Type, 2020 – 2030 (USD Million, AGR %, CAGR %)
Table 373 South Korea Counter-UAV Market Size by Type, 2020 – 2030 (USD Million, AGR %, CAGR %): V Shaped Recovery
Table 374 South Korea Counter-UAV Market Size by Type, 2020 – 2030 (USD Million, AGR %, CAGR %): U Shaped Recovery
Table 375 South Korea Counter-UAV Market Size by Type, 2020 – 2030 (USD Million, AGR %, CAGR %): L Shaped Recovery
Table 376 South Korea Counter-UAV Market Size by Type, 2020 – 2030 (USD Million, AGR %, CAGR %): W Shaped Recovery
Table 377 South Korea Counter-UAV Market Size by Technology, 2020 – 2030 (USD Million, AGR %, CAGR %)
Table 378 South Korea Counter-UAV Market Size by Technology, 2020 – 2030 (USD Million, AGR %, CAGR %): V Shaped Recovery
Table 379 South Korea Counter-UAV Market Size by Technology, 2020 – 2030 (USD Million, AGR %, CAGR %): U Shaped Recovery
Table 380 South Korea Counter-UAV Market Size by Technology, 2020 – 2030 (USD Million, AGR %, CAGR %): L Shaped Recovery
Table 381 South Korea Counter-UAV Market Size by Type, 2020 – 2030 (USD Million, AGR %, CAGR %): W Shaped Recovery
Table 382 Southeast Asia Counter-UAV Market, 2020-2030 (USD Million, AGR %, CAGR %)
Table 383 Southeast Asia Counter-UAV Market, 2020-2030 (USD Million, AGR %, CAGR %): V Shaped Recovery
Table 384 Southeast Asia Counter-UAV Market, 2020-2030 (USD Million, AGR %, CAGR %): U Shaped Recovery
Table 385 Southeast Asia Counter-UAV Market, 2020-2030 (USD Million, AGR %, CAGR %): L Shaped Recovery
Table 386 Southeast Asia Counter-UAV Market, 2020-2030 (USD Million, AGR %, CAGR %): W Shaped Recovery
Table 387 Southeast Asia Counter-UAV Market Size by Platform, 2020 – 2030 (USD Million, AGR %, CAGR %)
Table 388 Southeast Asia Counter-UAV Market Size by Platform, 2020 – 2030 (USD Million, AGR %, CAGR %): V Shaped Recovery
Table 389 Southeast Asia Counter-UAV Market Size by Platform, 2020 – 2030 (USD Million, AGR %, CAGR %): U Shaped Recovery
Table 390 Southeast Asia Counter-UAV Market Size by Platform, 2020 – 2030 (USD Million, AGR %, CAGR %): L Shaped Recovery
Table 391 Southeast Asia Counter-UAV Market Size by Platform, 2020 – 2030 (USD Million, AGR %, CAGR %): W Shaped Recovery
Table 392 Southeast Asia Counter-UAV Market Size by Type, 2020 – 2030 (USD Million, AGR %, CAGR %)
Table 393 Southeast Asia Counter-UAV Market Size by Type, 2020 – 2030 (USD Million, AGR %, CAGR %): V Shaped Recovery
Table 394 Southeast Asia Counter-UAV Market Size by Type, 2020 – 2030 (USD Million, AGR %, CAGR %): U Shaped Recovery
Table 395 Southeast Asia Counter-UAV Market Size by Type, 2020 – 2030 (USD Million, AGR %, CAGR %): L Shaped Recovery
Table 396 Southeast Asia Counter-UAV Market Size by Type, 2020 – 2030 (USD Million, AGR %, CAGR %): W Shaped Recovery
Table 397 Southeast Asia Counter-UAV Market Size by Technology, 2020 – 2030 (USD Million, AGR %, CAGR %)
Table 398 Southeast Asia Counter-UAV Market Size by Technology, 2020 – 2030 (USD Million, AGR %, CAGR %): V Shaped Recovery
Table 399 Southeast Asia Counter-UAV Market Size by Technology, 2020 – 2030 (USD Million, AGR %, CAGR %): U Shaped Recovery
Table 400 Southeast Asia Counter-UAV Market Size by Technology, 2020 – 2030 (USD Million, AGR %, CAGR %): L Shaped Recovery
Table 401 Southeast Asia Counter-UAV Market Size by Type, 2020 – 2030 (USD Million, AGR %, CAGR %): W Shaped Recovery
Table 402 Rest of Asia Pacific Counter-UAV Market, 2020-2030 (USD Million, AGR %, CAGR %)
Table 403 Rest of Asia Pacific Counter-UAV Market, 2020-2030 (USD Million, AGR %, CAGR %): V Shaped Recovery
Table 404 Rest of Asia Pacific Counter-UAV Market, 2020-2030 (USD Million, AGR %, CAGR %): U Shaped Recovery
Table 405 Rest of Asia Pacific Counter-UAV Market, 2020-2030 (USD Million, AGR %, CAGR %): L Shaped Recovery
Table 406 Rest of Asia Pacific Counter-UAV Market, 2020-2030 (USD Million, AGR %, CAGR %): W Shaped Recovery
Table 407 Rest of Asia Pacific Counter-UAV Market Size by Platform, 2020 – 2030 (USD Million, AGR %, CAGR %)
Table 408 Rest of Asia Pacific Counter-UAV Market Size by Platform, 2020 – 2030 (USD Million, AGR %, CAGR %): V Shaped Recovery
Table 409 Rest of Asia Pacific Counter-UAV Market Size by Platform, 2020 – 2030 (USD Million, AGR %, CAGR %): U Shaped Recovery
Table 410 Rest of Asia Pacific Counter-UAV Market Size by Platform, 2020 – 2030 (USD Million, AGR %, CAGR %): L Shaped Recovery
Table 411 Rest of Asia Pacific Counter-UAV Market Size by Platform, 2020 – 2030 (USD Million, AGR %, CAGR %): W Shaped Recovery
Table 412 Rest of Asia Pacific Counter-UAV Market Size by Type, 2020 – 2030 (USD Million, AGR %, CAGR %)
Table 413 Rest of Asia Pacific Counter-UAV Market Size by Type, 2020 – 2030 (USD Million, AGR %, CAGR %): V Shaped Recovery
Table 414 Rest of Asia Pacific Counter-UAV Market Size by Type, 2020 – 2030 (USD Million, AGR %, CAGR %): U Shaped Recovery
Table 415 Rest of Asia Pacific Counter-UAV Market Size by Type, 2020 – 2030 (USD Million, AGR %, CAGR %): L Shaped Recovery
Table 416 Rest of Asia Pacific Counter-UAV Market Size by Type, 2020 – 2030 (USD Million, AGR %, CAGR %): W Shaped Recovery
Table 417 Rest of Asia Pacific Counter-UAV Market Size by Technology, 2020 – 2030 (USD Million, AGR %, CAGR %)
Table 418 Rest of Asia Pacific Counter-UAV Market Size by Technology, 2020 – 2030 (USD Million, AGR %, CAGR %): V Shaped Recovery
Table 419 Rest of Asia Pacific Counter-UAV Market Size by Technology, 2020 – 2030 (USD Million, AGR %, CAGR %): U Shaped Recovery
Table 420 Rest of Asia Pacific Counter-UAV Market Size by Technology, 2020 – 2030 (USD Million, AGR %, CAGR %): L Shaped Recovery
Table 421 Rest of Asia Pacific Counter-UAV Market Size by Type, 2020 – 2030 (USD Million, AGR %, CAGR %): W Shaped Recovery
Table 422 Latin America Counter-UAV Market, 2020-2030 (USD Million, AGR %, CAGR %)
Table 423 Latin America Counter-UAV Market, 2020-2030 (USD Million, AGR %, CAGR %): V Shaped Recovery
Table 424 Latin America Counter-UAV Market, 2020-2030 (USD Million, AGR %, CAGR %): U Shaped Recovery
Table 425 Latin America Counter-UAV Market, 2020-2030 (USD Million, AGR %, CAGR %): L Shaped Recovery
Table 426 Latin America Counter-UAV Market, 2020-2030 (USD Million, AGR %, CAGR %): W Shaped Recovery
Table 427 Latin America Counter-UAV Market Size by Platform, 2020 – 2030 (USD Million, AGR %, CAGR %)
Table 428 Latin America Counter-UAV Market Size by Platform, 2020 – 2030 (USD Million, AGR %, CAGR %): V Shaped Recovery
Table 429 Latin America Counter-UAV Market Size by Platform, 2020 – 2030 (USD Million, AGR %, CAGR %): U Shaped Recovery
Table 430 Latin America Counter-UAV Market Size by Platform, 2020 – 2030 (USD Million, AGR %, CAGR %): L Shaped Recovery
Table 431 Latin America Counter-UAV Market Size by Platform, 2020 – 2030 (USD Million, AGR %, CAGR %): W Shaped Recovery
Table 432 Latin America Counter-UAV Market Size by Type, 2020 – 2030 (USD Million, AGR %, CAGR %)
Table 433 Latin America Counter-UAV Market Size by Type, 2020 – 2030 (USD Million, AGR %, CAGR %): V Shaped Recovery
Table 434 Latin America Counter-UAV Market Size by Type, 2020 – 2030 (USD Million, AGR %, CAGR %): U Shaped Recovery
Table 435 Latin America Counter-UAV Market Size by Type, 2020 – 2030 (USD Million, AGR %, CAGR %): L Shaped Recovery
Table 436 Latin America Counter-UAV Market Size by Type, 2020 – 2030 (USD Million, AGR %, CAGR %): W Shaped Recovery
Table 437 Latin America Counter-UAV Market Size by Technology, 2020 – 2030 (USD Million, AGR %, CAGR %)
Table 438 Latin America Counter-UAV Market Size by Technology, 2020 – 2030 (USD Million, AGR %, CAGR %): V Shaped Recovery
Table 439 Latin America Counter-UAV Market Size by Technology, 2020 – 2030 (USD Million, AGR %, CAGR %): U Shaped Recovery
Table 440 Latin America Counter-UAV Market Size by Technology, 2020 – 2030 (USD Million, AGR %, CAGR %): L Shaped Recovery
Table 441 Latin America Counter-UAV Market Size by Type, 2020 – 2030 (USD Million, AGR %, CAGR %): W Shaped Recovery
Table 442 Brazil Counter-UAV Market, 2020-2030 (USD Million, AGR %, CAGR %)
Table 443 Brazil Counter-UAV Market, 2020-2030 (USD Million, AGR %, CAGR %): V Shaped Recovery
Table 444 Brazil Counter-UAV Market, 2020-2030 (USD Million, AGR %, CAGR %): U Shaped Recovery
Table 445 Brazil Counter-UAV Market, 2020-2030 (USD Million, AGR %, CAGR %): L Shaped Recovery
Table 446 Brazil Counter-UAV Market, 2020-2030 (USD Million, AGR %, CAGR %): W Shaped Recovery
Table 447 Brazil Counter-UAV Market Size by Platform, 2020 – 2030 (USD Million, AGR %, CAGR %)
Table 448 Brazil Counter-UAV Market Size by Platform, 2020 – 2030 (USD Million, AGR %, CAGR %): V Shaped Recovery
Table 449 Brazil Counter-UAV Market Size by Platform, 2020 – 2030 (USD Million, AGR %, CAGR %): U Shaped Recovery
Table 450 Brazil Counter-UAV Market Size by Platform, 2020 – 2030 (USD Million, AGR %, CAGR %): L Shaped Recovery
Table 451 Brazil Counter-UAV Market Size by Platform, 2020 – 2030 (USD Million, AGR %, CAGR %): W Shaped Recovery
Table 452 Brazil Counter-UAV Market Size by Type, 2020 – 2030 (USD Million, AGR %, CAGR %)
Table 453 Brazil Counter-UAV Market Size by Type, 2020 – 2030 (USD Million, AGR %, CAGR %): V Shaped Recovery
Table 454 Brazil Counter-UAV Market Size by Type, 2020 – 2030 (USD Million, AGR %, CAGR %): U Shaped Recovery
Table 455 Brazil Counter-UAV Market Size by Type, 2020 – 2030 (USD Million, AGR %, CAGR %): L Shaped Recovery
Table 456 Brazil Counter-UAV Market Size by Type, 2020 – 2030 (USD Million, AGR %, CAGR %): W Shaped Recovery
Table 457 Brazil Counter-UAV Market Size by Technology, 2020 – 2030 (USD Million, AGR %, CAGR %)
Table 458 Brazil Counter-UAV Market Size by Technology, 2020 – 2030 (USD Million, AGR %, CAGR %): V Shaped Recovery
Table 459 Brazil Counter-UAV Market Size by Technology, 2020 – 2030 (USD Million, AGR %, CAGR %): U Shaped Recovery
Table 460 Brazil Counter-UAV Market Size by Technology, 2020 – 2030 (USD Million, AGR %, CAGR %): L Shaped Recovery
Table 461 Brazil Counter-UAV Market Size by Type, 2020 – 2030 (USD Million, AGR %, CAGR %): W Shaped Recovery
Table 462 Argentina Counter-UAV Market, 2020-2030 (USD Million, AGR %, CAGR %)
Table 463 Argentina Counter-UAV Market, 2020-2030 (USD Million, AGR %, CAGR %): V Shaped Recovery
Table 464 Argentina Counter-UAV Market, 2020-2030 (USD Million, AGR %, CAGR %): U Shaped Recovery
Table 465 Argentina Counter-UAV Market, 2020-2030 (USD Million, AGR %, CAGR %): L Shaped Recovery
Table 466 Argentina Counter-UAV Market, 2020-2030 (USD Million, AGR %, CAGR %): W Shaped Recovery
Table 467 Argentina Counter-UAV Market Size by Platform, 2020 – 2030 (USD Million, AGR %, CAGR %)
Table 468 Argentina Counter-UAV Market Size by Platform, 2020 – 2030 (USD Million, AGR %, CAGR %): V Shaped Recovery
Table 469 Argentina Counter-UAV Market Size by Platform, 2020 – 2030 (USD Million, AGR %, CAGR %): U Shaped Recovery
Table 470 Argentina Counter-UAV Market Size by Platform, 2020 – 2030 (USD Million, AGR %, CAGR %): L Shaped Recovery
Table 471 Argentina Counter-UAV Market Size by Platform, 2020 – 2030 (USD Million, AGR %, CAGR %): W Shaped Recovery
Table 472 Argentina Counter-UAV Market Size by Type, 2020 – 2030 (USD Million, AGR %, CAGR %)
Table 473 Argentina Counter-UAV Market Size by Type, 2020 – 2030 (USD Million, AGR %, CAGR %): V Shaped Recovery
Table 474 Argentina Counter-UAV Market Size by Type, 2020 – 2030 (USD Million, AGR %, CAGR %): U Shaped Recovery
Table 475 Argentina Counter-UAV Market Size by Type, 2020 – 2030 (USD Million, AGR %, CAGR %): L Shaped Recovery
Table 476 Argentina Counter-UAV Market Size by Type, 2020 – 2030 (USD Million, AGR %, CAGR %): W Shaped Recovery
Table 477 Argentina Counter-UAV Market Size by Technology, 2020 – 2030 (USD Million, AGR %, CAGR %)
Table 478 Argentina Counter-UAV Market Size by Technology, 2020 – 2030 (USD Million, AGR %, CAGR %): V Shaped Recovery
Table 479 Argentina Counter-UAV Market Size by Technology, 2020 – 2030 (USD Million, AGR %, CAGR %): U Shaped Recovery
Table 480 Argentina Counter-UAV Market Size by Technology, 2020 – 2030 (USD Million, AGR %, CAGR %): L Shaped Recovery
Table 481 Argentina Counter-UAV Market Size by Type, 2020 – 2030 (USD Million, AGR %, CAGR %): W Shaped Recovery
Table 482 Rest of Latin America Counter-UAV Market, 2020-2030 (USD Million, AGR %, CAGR %)
Table 483 Rest of Latin America Counter-UAV Market, 2020-2030 (USD Million, AGR %, CAGR %): V Shaped Recovery
Table 484 Rest of Latin America Counter-UAV Market, 2020-2030 (USD Million, AGR %, CAGR %): U Shaped Recovery
Table 485 Rest of Latin America Counter-UAV Market, 2020-2030 (USD Million, AGR %, CAGR %): L Shaped Recovery
Table 486 Rest of Latin America Counter-UAV Market, 2020-2030 (USD Million, AGR %, CAGR %): W Shaped Recovery
Table 487 Rest of Latin America Counter-UAV Market Size by Platform, 2020 – 2030 (USD Million, AGR %, CAGR %)
Table 488 Rest of Latin America Counter-UAV Market Size by Platform, 2020 – 2030 (USD Million, AGR %, CAGR %): V Shaped Recovery
Table 489 Rest of Latin America Counter-UAV Market Size by Platform, 2020 – 2030 (USD Million, AGR %, CAGR %): U Shaped Recovery
Table 490 Rest of Latin America Counter-UAV Market Size by Platform, 2020 – 2030 (USD Million, AGR %, CAGR %): L Shaped Recovery
Table 491 Rest of Latin America Counter-UAV Market Size by Platform, 2020 – 2030 (USD Million, AGR %, CAGR %): W Shaped Recovery
Table 492 Rest of Latin America Counter-UAV Market Size by Type, 2020 – 2030 (USD Million, AGR %, CAGR %)
Table 493 Rest of Latin America Counter-UAV Market Size by Type, 2020 – 2030 (USD Million, AGR %, CAGR %): V Shaped Recovery
Table 494 Rest of Latin America Counter-UAV Market Size by Type, 2020 – 2030 (USD Million, AGR %, CAGR %): U Shaped Recovery
Table 495 Rest of Latin America Counter-UAV Market Size by Type, 2020 – 2030 (USD Million, AGR %, CAGR %): L Shaped Recovery
Table 496 Rest of Latin America Counter-UAV Market Size by Type, 2020 – 2030 (USD Million, AGR %, CAGR %): W Shaped Recovery
Table 497 Rest of Latin America Counter-UAV Market Size by Technology, 2020 – 2030 (USD Million, AGR %, CAGR %)
Table 498 Rest of Latin America Counter-UAV Market Size by Technology, 2020 – 2030 (USD Million, AGR %, CAGR %): V Shaped Recovery
Table 499 Rest of Latin America Counter-UAV Market Size by Technology, 2020 – 2030 (USD Million, AGR %, CAGR %): U Shaped Recovery
Table 500 Rest of Latin America Counter-UAV Market Size by Technology, 2020 – 2030 (USD Million, AGR %, CAGR %): L Shaped Recovery
Table 501 Rest of Latin America Counter-UAV Market Size by Type, 2020 – 2030 (USD Million, AGR %, CAGR %): W Shaped Recovery
Table 502 Middle East & Africa Counter-UAV Market, 2020-2030 (USD Million, AGR %, CAGR %)
Table 503 Middle East & Africa Counter-UAV Market, 2020-2030 (USD Million, AGR %, CAGR %): V Shaped Recovery
Table 504 Middle East & Africa Counter-UAV Market, 2020-2030 (USD Million, AGR %, CAGR %): U Shaped Recovery
Table 505 Middle East & Africa Counter-UAV Market, 2020-2030 (USD Million, AGR %, CAGR %): L Shaped Recovery
Table 506 Middle East & Africa Counter-UAV Market, 2020-2030 (USD Million, AGR %, CAGR %): W Shaped Recovery
Table 507 Middle East & Africa Counter-UAV Market Size by Platform, 2020 – 2030 (USD Million, AGR %, CAGR %)
Table 508 Middle East & Africa Counter-UAV Market Size by Platform, 2020 – 2030 (USD Million, AGR %, CAGR %): V Shaped Recovery
Table 509 Middle East & Africa Counter-UAV Market Size by Platform, 2020 – 2030 (USD Million, AGR %, CAGR %): U Shaped Recovery
Table 510 Middle East & Africa Counter-UAV Market Size by Platform, 2020 – 2030 (USD Million, AGR %, CAGR %): L Shaped Recovery
Table 511 Middle East & Africa Counter-UAV Market Size by Platform, 2020 – 2030 (USD Million, AGR %, CAGR %): W Shaped Recovery
Table 512 Middle East & Africa Counter-UAV Market Size by Type, 2020 – 2030 (USD Million, AGR %, CAGR %)
Table 513 Middle East & Africa Counter-UAV Market Size by Type, 2020 – 2030 (USD Million, AGR %, CAGR %): V Shaped Recovery
Table 514 Middle East & Africa Counter-UAV Market Size by Type, 2020 – 2030 (USD Million, AGR %, CAGR %): U Shaped Recovery
Table 515 Middle East & Africa Counter-UAV Market Size by Type, 2020 – 2030 (USD Million, AGR %, CAGR %): L Shaped Recovery
Table 516 Middle East & Africa Counter-UAV Market Size by Type, 2020 – 2030 (USD Million, AGR %, CAGR %): W Shaped Recovery
Table 517 Middle East & Africa Counter-UAV Market Size by Technology, 2020 – 2030 (USD Million, AGR %, CAGR %)
Table 518 Middle East & Africa Counter-UAV Market Size by Technology, 2020 – 2030 (USD Million, AGR %, CAGR %): V Shaped Recovery
Table 519 Middle East & Africa Counter-UAV Market Size by Technology, 2020 – 2030 (USD Million, AGR %, CAGR %): U Shaped Recovery
Table 520 Middle East & Africa Counter-UAV Market Size by Technology, 2020 – 2030 (USD Million, AGR %, CAGR %): L Shaped Recovery
Table 521 Middle East & Africa Counter-UAV Market Size by Type, 2020 – 2030 (USD Million, AGR %, CAGR %): W Shaped Recovery
Table 522 Saudi Arabia Counter-UAV Market, 2020-2030 (USD Million, AGR %, CAGR %)
Table 523 Saudi Arabia Counter-UAV Market, 2020-2030 (USD Million, AGR %, CAGR %): V Shaped Recovery
Table 524 Saudi Arabia Counter-UAV Market, 2020-2030 (USD Million, AGR %, CAGR %): U Shaped Recovery
Table 525 Saudi Arabia Counter-UAV Market, 2020-2030 (USD Million, AGR %, CAGR %): L Shaped Recovery
Table 526 Saudi Arabia Counter-UAV Market, 2020-2030 (USD Million, AGR %, CAGR %): W Shaped Recovery
Table 527 Saudi Arabia Counter-UAV Market Size by Platform, 2020 – 2030 (USD Million, AGR %, CAGR %)
Table 528 Saudi Arabia Counter-UAV Market Size by Platform, 2020 – 2030 (USD Million, AGR %, CAGR %): V Shaped Recovery
Table 529 Saudi Arabia Counter-UAV Market Size by Platform, 2020 – 2030 (USD Million, AGR %, CAGR %): U Shaped Recovery
Table 530 Saudi Arabia Counter-UAV Market Size by Platform, 2020 – 2030 (USD Million, AGR %, CAGR %): L Shaped Recovery
Table 531 Saudi Arabia Counter-UAV Market Size by Platform, 2020 – 2030 (USD Million, AGR %, CAGR %): W Shaped Recovery
Table 532 Saudi Arabia Counter-UAV Market Size by Type, 2020 – 2030 (USD Million, AGR %, CAGR %)
Table 533 Saudi Arabia Counter-UAV Market Size by Type, 2020 – 2030 (USD Million, AGR %, CAGR %): V Shaped Recovery
Table 534 Saudi Arabia Counter-UAV Market Size by Type, 2020 – 2030 (USD Million, AGR %, CAGR %): U Shaped Recovery
Table 535 Saudi Arabia Counter-UAV Market Size by Type, 2020 – 2030 (USD Million, AGR %, CAGR %): L Shaped Recovery
Table 536 Saudi Arabia Counter-UAV Market Size by Type, 2020 – 2030 (USD Million, AGR %, CAGR %): W Shaped Recovery
Table 537 Saudi Arabia Counter-UAV Market Size by Technology, 2020 – 2030 (USD Million, AGR %, CAGR %)
Table 538 Saudi Arabia Counter-UAV Market Size by Technology, 2020 – 2030 (USD Million, AGR %, CAGR %): V Shaped Recovery
Table 539 Saudi Arabia Counter-UAV Market Size by Technology, 2020 – 2030 (USD Million, AGR %, CAGR %): U Shaped Recovery
Table 540 Saudi Arabia Counter-UAV Market Size by Technology, 2020 – 2030 (USD Million, AGR %, CAGR %): L Shaped Recovery
Table 541 Saudi Arabia Counter-UAV Market Size by Type, 2020 – 2030 (USD Million, AGR %, CAGR %): W Shaped Recovery
Table 542 Qatar Counter-UAV Market, 2020-2030 (USD Million, AGR %, CAGR %)
Table 543 Qatar Counter-UAV Market, 2020-2030 (USD Million, AGR %, CAGR %): V Shaped Recovery
Table 544 Qatar Counter-UAV Market, 2020-2030 (USD Million, AGR %, CAGR %): U Shaped Recovery
Table 545 Qatar Counter-UAV Market, 2020-2030 (USD Million, AGR %, CAGR %): L Shaped Recovery
Table 546 Qatar Counter-UAV Market, 2020-2030 (USD Million, AGR %, CAGR %): W Shaped Recovery
Table 547 Qatar Counter-UAV Market Size by Platform, 2020 – 2030 (USD Million, AGR %, CAGR %)
Table 548 Qatar Counter-UAV Market Size by Platform, 2020 – 2030 (USD Million, AGR %, CAGR %): V Shaped Recovery
Table 549 Qatar Counter-UAV Market Size by Platform, 2020 – 2030 (USD Million, AGR %, CAGR %): U Shaped Recovery
Table 550 Qatar Counter-UAV Market Size by Platform, 2020 – 2030 (USD Million, AGR %, CAGR %): L Shaped Recovery
Table 551 Qatar Counter-UAV Market Size by Platform, 2020 – 2030 (USD Million, AGR %, CAGR %): W Shaped Recovery
Table 552 Qatar Counter-UAV Market Size by Type, 2020 – 2030 (USD Million, AGR %, CAGR %)
Table 553 Qatar Counter-UAV Market Size by Type, 2020 – 2030 (USD Million, AGR %, CAGR %): V Shaped Recovery
Table 554 Qatar Counter-UAV Market Size by Type, 2020 – 2030 (USD Million, AGR %, CAGR %): U Shaped Recovery
Table 555 Qatar Counter-UAV Market Size by Type, 2020 – 2030 (USD Million, AGR %, CAGR %): L Shaped Recovery
Table 556 Qatar Counter-UAV Market Size by Type, 2020 – 2030 (USD Million, AGR %, CAGR %): W Shaped Recovery
Table 557 Qatar Counter-UAV Market Size by Technology, 2020 – 2030 (USD Million, AGR %, CAGR %)
Table 558 Qatar Counter-UAV Market Size by Technology, 2020 – 2030 (USD Million, AGR %, CAGR %): V Shaped Recovery
Table 559 Qatar Counter-UAV Market Size by Technology, 2020 – 2030 (USD Million, AGR %, CAGR %): U Shaped Recovery
Table 560 Qatar Counter-UAV Market Size by Technology, 2020 – 2030 (USD Million, AGR %, CAGR %): L Shaped Recovery
Table 561 Qatar Counter-UAV Market Size by Type, 2020 – 2030 (USD Million, AGR %, CAGR %): W Shaped Recovery
Table 562 UAE Counter-UAV Market, 2020-2030 (USD Million, AGR %, CAGR %)
Table 563 UAE Counter-UAV Market, 2020-2030 (USD Million, AGR %, CAGR %): V Shaped Recovery
Table 564 UAE Counter-UAV Market, 2020-2030 (USD Million, AGR %, CAGR %): U Shaped Recovery
Table 565 UAE Counter-UAV Market, 2020-2030 (USD Million, AGR %, CAGR %): L Shaped Recovery
Table 566 UAE Counter-UAV Market, 2020-2030 (USD Million, AGR %, CAGR %): W Shaped Recovery
Table 567 UAE Counter-UAV Market Size by Platform, 2020 – 2030 (USD Million, AGR %, CAGR %)
Table 568 UAE Counter-UAV Market Size by Platform, 2020 – 2030 (USD Million, AGR %, CAGR %): V Shaped Recovery
Table 569 UAE Counter-UAV Market Size by Platform, 2020 – 2030 (USD Million, AGR %, CAGR %): U Shaped Recovery
Table 570 UAE Counter-UAV Market Size by Platform, 2020 – 2030 (USD Million, AGR %, CAGR %): L Shaped Recovery
Table 571 UAE Counter-UAV Market Size by Platform, 2020 – 2030 (USD Million, AGR %, CAGR %): W Shaped Recovery
Table 572 UAE Counter-UAV Market Size by Type, 2020 – 2030 (USD Million, AGR %, CAGR %)
Table 573 UAE Counter-UAV Market Size by Type, 2020 – 2030 (USD Million, AGR %, CAGR %): V Shaped Recovery
Table 574 UAE Counter-UAV Market Size by Type, 2020 – 2030 (USD Million, AGR %, CAGR %): U Shaped Recovery
Table 575 UAE Counter-UAV Market Size by Type, 2020 – 2030 (USD Million, AGR %, CAGR %): L Shaped Recovery
Table 576 UAE Counter-UAV Market Size by Type, 2020 – 2030 (USD Million, AGR %, CAGR %): W Shaped Recovery
Table 577 UAE Counter-UAV Market Size by Technology, 2020 – 2030 (USD Million, AGR %, CAGR %)
Table 578 UAE Counter-UAV Market Size by Technology, 2020 – 2030 (USD Million, AGR %, CAGR %): V Shaped Recovery
Table 579 UAE Counter-UAV Market Size by Technology, 2020 – 2030 (USD Million, AGR %, CAGR %): U Shaped Recovery
Table 580 UAE Counter-UAV Market Size by Technology, 2020 – 2030 (USD Million, AGR %, CAGR %): L Shaped Recovery
Table 581 UAE Counter-UAV Market Size by Type, 2020 – 2030 (USD Million, AGR %, CAGR %): W Shaped Recovery
Table 582 Iraq Counter-UAV Market, 2020-2030 (USD Million, AGR %, CAGR %)
Table 583 Iraq Counter-UAV Market, 2020-2030 (USD Million, AGR %, CAGR %): V Shaped Recovery
Table 584 Iraq Counter-UAV Market, 2020-2030 (USD Million, AGR %, CAGR %): U Shaped Recovery
Table 585 Iraq Counter-UAV Market, 2020-2030 (USD Million, AGR %, CAGR %): L Shaped Recovery
Table 586 Iraq Counter-UAV Market, 2020-2030 (USD Million, AGR %, CAGR %): W Shaped Recovery
Table 587 Iraq Counter-UAV Market Size by Platform, 2020 – 2030 (USD Million, AGR %, CAGR %)
Table 588 Iraq Counter-UAV Market Size by Platform, 2020 – 2030 (USD Million, AGR %, CAGR %): V Shaped Recovery
Table 589 Iraq Counter-UAV Market Size by Platform, 2020 – 2030 (USD Million, AGR %, CAGR %): U Shaped Recovery
Table 590 Iraq Counter-UAV Market Size by Platform, 2020 – 2030 (USD Million, AGR %, CAGR %): L Shaped Recovery
Table 591 Iraq Counter-UAV Market Size by Platform, 2020 – 2030 (USD Million, AGR %, CAGR %): W Shaped Recovery
Table 592 Iraq Counter-UAV Market Size by Type, 2020 – 2030 (USD Million, AGR %, CAGR %)
Table 593 Iraq Counter-UAV Market Size by Type, 2020 – 2030 (USD Million, AGR %, CAGR %): V Shaped Recovery
Table 594 Iraq Counter-UAV Market Size by Type, 2020 – 2030 (USD Million, AGR %, CAGR %): U Shaped Recovery
Table 595 Iraq Counter-UAV Market Size by Type, 2020 – 2030 (USD Million, AGR %, CAGR %): L Shaped Recovery
Table 596 Iraq Counter-UAV Market Size by Type, 2020 – 2030 (USD Million, AGR %, CAGR %): W Shaped Recovery
Table 597 Iraq Counter-UAV Market Size by Technology, 2020 – 2030 (USD Million, AGR %, CAGR %)
Table 598 Iraq Counter-UAV Market Size by Technology, 2020 – 2030 (USD Million, AGR %, CAGR %): V Shaped Recovery
Table 599 Iraq Counter-UAV Market Size by Technology, 2020 – 2030 (USD Million, AGR %, CAGR %): U Shaped Recovery
Table 600 Iraq Counter-UAV Market Size by Technology, 2020 – 2030 (USD Million, AGR %, CAGR %): L Shaped Recovery
Table 601 Iraq Counter-UAV Market Size by Type, 2020 – 2030 (USD Million, AGR %, CAGR %): W Shaped Recovery
Table 602 Egypt Counter-UAV Market, 2020-2030 (USD Million, AGR %, CAGR %)
Table 603 Egypt Counter-UAV Market, 2020-2030 (USD Million, AGR %, CAGR %): V Shaped Recovery
Table 604 Egypt Counter-UAV Market, 2020-2030 (USD Million, AGR %, CAGR %): U Shaped Recovery
Table 605 Egypt Counter-UAV Market, 2020-2030 (USD Million, AGR %, CAGR %): L Shaped Recovery
Table 606 Egypt Counter-UAV Market, 2020-2030 (USD Million, AGR %, CAGR %): W Shaped Recovery
Table 607 Egypt Counter-UAV Market Size by Platform, 2020 – 2030 (USD Million, AGR %, CAGR %)
Table 608 Egypt Counter-UAV Market Size by Platform, 2020 – 2030 (USD Million, AGR %, CAGR %): V Shaped Recovery
Table 609 Egypt Counter-UAV Market Size by Platform, 2020 – 2030 (USD Million, AGR %, CAGR %): U Shaped Recovery
Table 610 Egypt Counter-UAV Market Size by Platform, 2020 – 2030 (USD Million, AGR %, CAGR %): L Shaped Recovery
Table 611 Egypt Counter-UAV Market Size by Platform, 2020 – 2030 (USD Million, AGR %, CAGR %): W Shaped Recovery
Table 612 Egypt Counter-UAV Market Size by Type, 2020 – 2030 (USD Million, AGR %, CAGR %)
Table 613 Egypt Counter-UAV Market Size by Type, 2020 – 2030 (USD Million, AGR %, CAGR %): V Shaped Recovery
Table 614 Egypt Counter-UAV Market Size by Type, 2020 – 2030 (USD Million, AGR %, CAGR %): U Shaped Recovery
Table 615 Egypt Counter-UAV Market Size by Type, 2020 – 2030 (USD Million, AGR %, CAGR %): L Shaped Recovery
Table 616 Egypt Counter-UAV Market Size by Type, 2020 – 2030 (USD Million, AGR %, CAGR %): W Shaped Recovery
Table 617 Egypt Counter-UAV Market Size by Technology, 2020 – 2030 (USD Million, AGR %, CAGR %)
Table 618 Egypt Counter-UAV Market Size by Technology, 2020 – 2030 (USD Million, AGR %, CAGR %): V Shaped Recovery
Table 619 Egypt Counter-UAV Market Size by Technology, 2020 – 2030 (USD Million, AGR %, CAGR %): U Shaped Recovery
Table 620 Egypt Counter-UAV Market Size by Technology, 2020 – 2030 (USD Million, AGR %, CAGR %): L Shaped Recovery
Table 621 Egypt Counter-UAV Market Size by Type, 2020 – 2030 (USD Million, AGR %, CAGR %): W Shaped Recovery
Table 622 Rest of Middle East & Africa Counter-UAV Market, 2020-2030 (USD Million, AGR %, CAGR %)
Table 623 Rest of Middle East & Africa Counter-UAV Market, 2020-2030 (USD Million, AGR %, CAGR %): V Shaped Recovery
Table 624 Rest of Middle East & Africa Counter-UAV Market, 2020-2030 (USD Million, AGR %, CAGR %): U Shaped Recovery
Table 625 Rest of Middle East & Africa Counter-UAV Market, 2020-2030 (USD Million, AGR %, CAGR %): L Shaped Recovery
Table 626 Rest of Middle East & Africa Counter-UAV Market, 2020-2030 (USD Million, AGR %, CAGR %): W Shaped Recovery
Table 627 Rest of Middle East & Africa Counter-UAV Market Size by Platform, 2020 – 2030 (USD Million, AGR %, CAGR %)
Table 628 Rest of Middle East & Africa Counter-UAV Market Size by Platform, 2020 – 2030 (USD Million, AGR %, CAGR %): V Shaped Recovery
Table 629 Rest of Middle East & Africa Counter-UAV Market Size by Platform, 2020 – 2030 (USD Million, AGR %, CAGR %): U Shaped Recovery
Table 630 Rest of Middle East & Africa Counter-UAV Market Size by Platform, 2020 – 2030 (USD Million, AGR %, CAGR %): L Shaped Recovery
Table 631 Rest of Middle East & Africa Counter-UAV Market Size by Platform, 2020 – 2030 (USD Million, AGR %, CAGR %): W Shaped Recovery
Table 632 Rest of Middle East & Africa Counter-UAV Market Size by Type, 2020 – 2030 (USD Million, AGR %, CAGR %)
Table 633 Rest of Middle East & Africa Counter-UAV Market Size by Type, 2020 – 2030 (USD Million, AGR %, CAGR %): V Shaped Recovery
Table 634 Rest of Middle East & Africa Counter-UAV Market Size by Type, 2020 – 2030 (USD Million, AGR %, CAGR %): U Shaped Recovery
Table 635 Rest of Middle East & Africa Counter-UAV Market Size by Type, 2020 – 2030 (USD Million, AGR %, CAGR %): L Shaped Recovery
Table 636 Rest of Middle East & Africa Counter-UAV Market Size by Type, 2020 – 2030 (USD Million, AGR %, CAGR %): W Shaped Recovery
Table 637 Rest of Middle East & Africa Counter-UAV Market Size by Technology, 2020 – 2030 (USD Million, AGR %, CAGR %)
Table 638 Rest of Middle East & Africa Counter-UAV Market Size by Technology, 2020 – 2030 (USD Million, AGR %, CAGR %): V Shaped Recovery
Table 639 Rest of Middle East & Africa Counter-UAV Market Size by Technology, 2020 – 2030 (USD Million, AGR %, CAGR %): U Shaped Recovery
Table 640 Rest of Middle East & Africa Counter-UAV Market Size by Technology, 2020 – 2030 (USD Million, AGR %, CAGR %): L Shaped Recovery
Table 641 Rest of Middle East & Africa Counter-UAV Market Size by Type, 2020 – 2030 (USD Million, AGR %, CAGR %): W Shaped Recovery
Table 642 Leading Counter UAV Companies (Company Name, Revenue, Headquarters)
Table 643 Boeing Company: Headquarter, Founded, Employees, Company Type, Website, Business Segment
Table 644 Boeing Company: Product Portfolio
Table 645 Boeing Company: Recent Expansion, Product Launch, Investment, Merger & Acquisition (2017 – 2019)
Table 646 Boeing Company: SWOT Analysis
Table 647 Airbus Group SE: Headquarter, Founded, Employees, Company Type, Website, Business Segment
Table 648 Airbus Group SE: Product Portfolio
Table 649 Airbus Group SE: Recent Expansion, Product Launch, Investment, Merger & Acquisition (2016 – 2020)
Table 650 Airbus Group SE: SWOT Analysis
Table 651 Saab AB: Headquarter, Founded, Employees, Company Type, Website, Business Segment
Table 652 Saab AB: Product Portfolio
Table 653 Saab AB: Recent Expansion, Product Launch, Investment, Merger & Acquisition (2017 – 2020)
Table 654 Saab AB: SWOT Analysis
Table 655 Thales Group: Headquarter, Founded, Employees, Company Type, Website, Business Segment
Table 656 Thales Group: Product Portfolio
Table 657 Thales Group: Recent Expansion, Product Launch, Investment, Merger & Acquisition (2017 – 2020)
Table 658 Thales Group: SWOT Analysis
Table 659 Lockheed Martin: Headquarter, Founded, Employees, Company Type, Website, Business Segment
Table 660 Lockheed Martin: Product Portfolio
Table 661 Lockheed Martin: Recent Expansion, Product Launch, Investment, Merger & Acquisition (2017 – 2020)
Table 662 Lockheed Martin: SWOT Analysis
Table 663 Israel Aerospace Industries: Headquarter, Founded, Employees, Company Type, Website, Business Segment
Table 664 Israel Aerospace Industries: Product Portfolio
Table 665 Israel Aerospace Industries: Recent Expansion, Product Launch, Investment, Merger & Acquisition (2017 – 2020)
Table 666 Israel Aerospace Industries: SWOT Analysis
Table 667 Raytheon Company: Headquarter, Founded, Employees, Company Type, Website, Business Segment
Table 668 Raytheon Company: Product Portfolio
Table 669 Raytheon Company: Recent Expansion, Product Launch, Investment, Merger & Acquisition (2016 – 2020)
Table 670 Northrop Grumman Corporation: Headquarter, Founded, Employees, Company Type, Website, Business Segment
Table 671 Northrop Grumman Corporation: Product Portfolio
Table 672 Northrop Grumman Corporation: Recent Expansion, Product Launch, Investment, Merger & Acquisition (2017 – 2020)
Table 673 Northrop Grumman Corporation: SWOT Analysis
Table 674 Rafael Advanced Defense Systems: Headquarter, Founded, Employees, Company Type, Website, Business Segment
Table 675 Rafael Advanced Defense Systems: Product Portfolio
Table 676 Rafael Advanced Defense Systems: Recent Expansion, Product Launch, Investment, Merger & Acquisition (2017 – 2020)
Table 677 Rheinmetall AG: Headquarter, Founded, Employees, Company Type, Website, Business Segment
Table 678 Rheinmetall AG: Product Portfolio
Table 679 Rheinmetall AG: Recent Expansion, Product Launch, Investment, Merger & Acquisition (2019 – 2020)
Table 680 Hensoldt GmbH: Headquarter, Founded, Employees, Company Type, Website, Business Segment
Table 681 Hensoldt GmbH: Product Portfolio
Table 682 Hensoldt GmbH: Recent Expansion, Product Launch, Investment, Merger & Acquisition (2017 – 2020)
Table 683 Blighter Surveillance Systems: Headquarter, Founded, Employees, Company Type, Website, Business Segment
Table 684 Blighter Surveillance Systems: Product Portfolio
Table 685 Blighter Surveillance Systems: Recent Expansion, Product Launch, Investment, Merger & Acquisition (2015 – 2019)
Table 686 DroneShield, LLC: Headquarter, Founded, Employees, Company Type, Website, Business Segment
Table 687 DroneShield, LLC: Product Portfolio
Table 688 DroneShield, LLC: Recent Expansion, Product Launch, Investment, Merger & Acquisition (2016 – 2020)
Table 689 Radio Hill Technologies: Headquarter, Founded, Employees, Company Type, Website, Business Segment
Table 690 Radio Hill Technologies: Product Portfolio
Table 691 Radio Hill Technologies: Recent Expansion, Product Launch, Investment, Merger & Acquisition (2017 – 2019)
Table 692 Battelle: Headquarter, Founded, Employees, Company Type, Website, Business Segment
Table 693 Battelle: Product Portfolio
Table 694 Battelle: Recent Expansion, Product Launch, Investment, Merger & Acquisition (2017 – 2019)
Table 695 My Defence: Headquarter, Founded, Employees, Company Type, Website, Business Segment
Table 696 My Defence: Product Portfolio
Table 697 My Defence: Recent Expansion, Product Launch, Investment, Merger & Acquisition (2018 – 2020)
Table 698 White Fox: Headquarter, Founded, Employees, Company Type, Website, Business Segment
Table 699 White Fox: Product Portfolio
Table 700 White Fox: Recent Expansion, Product Launch, Investment, Merger & Acquisition (2018)
Table 701 Department 13: Headquarter, Founded, Employees, Company Type, Website, Business Segment
Table 702 Department 13: Product Portfolio
Table 703 Department 13: Recent Expansion, Product Launch, Investment, Merger & Acquisition (2017 – 2020)
Table 704 Black Sage Technologies: Headquarter, Founded, Employees, Company Type, Website, Business Segment
Table 705 Black Sage Technologies: Product Portfolio
Table 706 Black Sage Technologies: Recent Expansion, Product Launch, Investment, Merger & Acquisition (2019)
Table 707 L-3Harris Technologies: Headquarter, Founded, Employees, Company Type, Website, Business Segment
Table 708 L-3Harris Technologies: Product Portfolio
Table 709 L-3Harris Technologies: Recent Expansion, Product Launch, Investment, Merger & Acquisition (2016 – 2020)
Table 710 Liteye Systems: Headquarter, Founded, Employees, Company Type, Website, Business Segment
Table 711 Liteye Systems: Product Portfolio
Table 712 Liteye Systems: Recent Expansion, Product Launch, Investment, Merger & Acquisition
Table 713 SCG Security & Counterintelligence Group: Headquarter, Founded, Employees, Company Type, Website, Business Segment
Table 714 SCG Security & Counterintelligence Group: Product Portfolio
Table 715 SCG Security & Counterintelligence Group: Recent Expansion, Product Launch, Investment, Merger & Acquisition (2016 – 2020)
Table 716 Theiss UAV Solutions: Headquarter, Founded, Employees, Company Type, Website, Business Segment
Table 717 Theiss UAV Solutions: Product Portfolio
Table 718 Aaronia AG: Headquarter, Founded, Employees, Company Type, Website, Business Segment
Table 719 Aaronia AG: Product Portfolio
Table 720 Aaronia AG: Recent Expansion, Product Launch, Investment, Merger & Acquisition (2018 – 2020)
Table 721 Other Companies Involved in the Counter UAV (C-UAV) Market 2018 (Company, Location)
Companies Profiled in the Report:
Aaronia AG
Airbus Group SE
Battelle
Black Sage Technologies
Blighter Surveillance Systems
Boeing Company
Department 13
DroneShield, LLC
Hensoldt GmbH
Israel Aerospace Industries
L-3Harris Technologies
Liteye Systems
Lockheed Martin
My Defense
Northrop Grumman Corporation
Radio Hill Technologies
Rafael Advanced Defense Systems
Raytheon Company
Rheinmetall AG
Saab AB
Security and Counterintelligence Group
Thales Group
Theiss Aviation
White Fox
List of Companies Mentioned in the Report:
Advanced Ballistic Concepts
Aerialtronics
Aeryon Labs, Inc.
ALSOK
Anti-Drone
ANTIDRONE
API Technologies Corp.
Aveillant
Battelle
BSS Holland BV
CerbAir
Chess Dynamics Ltd
CTS Technology
DCAA
Dedrone Inc
DeTect, Inc.
Domestic Drone Countermeasures LLC
Drone Defence
Drone Labs
DSNA Services
Echo Radar Systems
Gryphon Sensors
Guards From Above
JCPX Development
Kelvin Hughes
Liteye Systems
MALOU Tech
MCTech
OpenWorks Engineering
Robin Radar Systems BV
Sensofusion
SkySoft-ATM
Snake River Shooting Products
Squarehead Technology
SRC, Inc.
TDA Armements SAS
Thales Electronic Systems GmbH
Thales Group
Thales Naval Ltd.
Thales Programas De Electronica Y Comunicaciones S.A.U
Thales Solutions Asia Pte Ltd
Theiss UAV Solutions
TSG IT Advanced Systems Ltd.
UAV Shield
UAVOS
White Fox
WhiteFox Defense Technologies
List of Organizations Mentioned in the Report
Canadian Department of National Defense
China Academy of Aerospace Aerodynamics
Danish Defence and Logistic Organization
Defense Research and Development Canada (DRDC)
Flinders University
German Army
Israeli Defense Ministry
NATO
Royal Air Force
Royal Navy
Royal Saudi Air Force (RSAF)
SA Civil Aviation Authority (SACAA)
Spanish Army
Spanish Defence Ministry
Spanish Directorate- General for Armament and Material
Spanish Navy
Swedish Defence Material Administration (FMV)
Transport Canada
Turkish Armed Forces
U.K.’s Ministry of Defense (MoD)
U.S. Air Force Research Laboratory
U.S. Central Command
US Air Force
US Army
US Department of Homeland Security
Download sample pages
Complete the form below to download your free sample pages for Counter-UAV (C-UAV) Market Report 2020-2030Related reports
-
Military Vetronics Market Report 2021-2031
Military vetronics market has been witnessing strong growth over the past few years on account of increasing procurement of armored...
Full DetailsPublished: 01 January 1970 -
Military Smart Weapons Market Report 2021-2031
Owing to availability of upgrade kits for conventional weapons, increase in investment in advanced missiles defence systems and interceptor missiles,...Full DetailsPublished: 17 June 2021 -
Military Armoured Vehicle Market Report 2020-2030
Military Armoured Vehicle market to total USD 29.9 billion in 2030.
...Full DetailsPublished: 09 March 2020 -
Military Radar System Market Report 2020-2030
The world market for military radar systems is currently undergoing a state of flux due mainly to extensive cuts in...
Full DetailsPublished: 14 July 2020 -

Command and Control (C2) System Market Report 2020-2030
Where is the Command and Control (C2) market heading? If you are involved in this sector you must read this...
Full DetailsPublished: 03 September 2020 -
Fuel Cells for Military Unmanned Aerial Vehicle (UAV) Market Report 2020-2030
Market Trends:
...
- Increased Demand for UAV from ISR
- Increased Military SpendingFull DetailsPublished: 01 January 1970 -

Shoulder Fired Weapons Market Report to 2031
Owing to closure/restricted movements across international borders, there has arisen a challenge in gaining cross-border information for the forces. This...Full DetailsPublished: 01 January 1970 -
Drone Payload Market Report 2020-2030
The Drone Payload Market is segmented on the Type, Application, and Regional basis.
...Full DetailsPublished: 01 January 1970 -

Military Actuators Market Report 2020-2030
It is the competitive pricing standards and the capacity of providers to satisfy customer demands is likely to hamper the...
Full DetailsPublished: 01 January 1970 -

Multirotor UAV Market Report 2020-2030
The Multirotor UAV Market is segmented on the Payload, Application, and Regional basis.
...Full DetailsPublished: 01 January 1970
Download sample pages
Complete the form below to download your free sample pages for Counter-UAV (C-UAV) Market Report 2020-2030Do you have any custom requirements we can help you with?
Any specific country, geo region, market segment or specific company information?
Email us today, we can discuss your needs and see how we can help: jamie.roberts@visiongain.com
Would you like a free report overview of the report of your choice?
If so, please drop an email to Jamie Roberts stating your chosen report title to jamie.roberts@visiongain.com
Visiongain defence reports are compiled using a broad and rich mixture of both primary and secondary information to produce an overall industry outlook. In order to provide our clients with the best product possible, Visiongain analysts reach out to market-leading vendors and industry experts and review a wealth of financial data and product information from a vast range of sources. To find out more about our reports methodology, please email jamie.roberts@visiongain.com
Would you like to get the latest Visiongain defence reports catalogue?
What are the dynamic growth sectors? where are the regional business opportunities?
Which technologies will prevail and who are the leading companies succeeding in these sectors and why?
If you want definitive answers to business critical questions, discover Visiongain’s full range of business intelligence reports.
If so, please email Jamie Roberts on jamie.roberts@visiongain.com or call her today on +44 207 336 6100
ADS Group
Aerial Refueling Systems Advisory Group
Aerospace and Defence Industries Association of Nova Scotia
Aerospace Industries Association
Aerospace Industries Association of Canada
AHS International – The Vertical Flight Technical Society
Air Force Association
Aircraft Electronics Association
Airlift/Tanker Association
American Astronautical Society
American Gear Manufacturers Association
American Institute of Aeronautics and Astronautics
American Logistics Association
American Society of Naval Engineers
AMSUS – The Society of the Federal Health Agencies
Armed Forces Communications and Electronics Association
Armed Forces Communications and Electronics Association
Army Aviation Association of America
ASD – Aerospace & Defence Association of Europe
Association for Unmanned Vehicle Systems International
Association of Aviation Manufacturers of the Czech Republic
Association of Naval Aviation
Association of Old Crows
Association of Polish Aviation Industry
Association of the Defense Industry of the Czech Republic
Association of the United States Army
Association of the United States Navy
Australia Defence Association
Australian Industry & Defence Network
Australian Industry Group Defence Council
Austrian Aeronautics Industries Group
Aviation Distributors and Manufacturers Association
Aviation Suppliers Association
Belgian Security and Defence Industry
Bulgarian Defence Industry Association
Business Executives for National Security
Canadian Association of Defence and Security Industries
Conference of Defense Associations
Council of Defense and Space Industry Associations
Danish Defence & Security Industries Association
Defence Industry Manufacturers Association
Defense Industry Initiative on Business Ethics and Conduct
Defense Industry Offset Association
Defense Orientation Conference Association
Deutsche Gesellschaft fur Wehrtechnik
Federal Association of the German Security and Defence Industry
Federation of Aerospace Enterprises in Ireland
French Aerospace Industries Association
French Land Defence Manufacturers Association (GICAT)
German Aerospace Industries Association
Helicopter Association International
Hellenic Aerospace & Defense Industries Group
Homeland Security & Defense Business Council
International Stability Operations Association
Japan Association of Defense Industry
Korea Defense Industry Association
Marine Corps Association & Foundation
National Aeronautic Association
National Association of Ordnance and Explosive Waste Contractors
National Defense Industrial Association
National Defense Transportation Association
National Guard Association of the U.S.
Navy League of the United States
Netherlands Aerospace Group
New Zealand Defence Industry Association
Portuguese Association of Defense Related Industries & New Technologies Companies
Québec Ground Transportation Cluster
Satellite Industry Association
Society of American Military Engineers
South African Aerospace Maritime and Defence Industries Association
Spanish Aerospace and Defence Association Industries
Submarine Industrial Base Council
Swedish Aerospace Industries
Swedish Security and Defence Industry Association
Swiss Aeronautical Industries Group
The Association of Finnish Defence and Aerospace Industries
The Italian Industries Association for Aerospace Systems and Defence
The Netherlands Defence Manufacturers Association
The Society of Japanese Aerospace Companies
UK AeroSpace, Defence & Security Industries
United Kingdom National Defence Association
Don’t Miss Out!
Latest Defence news
Robotic Warfare Market
The global Robotic Warfare market is projected to grow at a CAGR of 6.7% by 2034
19 July 2024
Cyber Warfare Market
The global Cyber Warfare market is projected to grow at a CAGR of 17.7% by 2034
16 July 2024
Counter-UAV (C-UAV) Market
The global Counter-UAV (C-UAV) market is projected to grow at a CAGR of 29.6% by 2034
08 July 2024
Special Mission Aircraft Market
The global Special Mission Aircraft market is projected to grow at a CAGR of 4.6% by 2034
27 June 2024


