Industries > Automotive > Automotive LiDAR Market Report 2020-2030

Automotive LiDAR Market Report 2020-2030
Forecasts by Technology (Mechanical LiDAR and Solid-State LiDAR), Vehicle Type (Passenger Vehicles, Light Commercial Vehicles, Heavy Commercial Vehicles), Image Type (2D Image LiDAR, 3D Image LiDAR), Application (Robo-taxi, ADAS, Autonomous Vehicle) and Placement (Bumper & Grill, Headlight & Taillight, Roofs and Upper Pillars, and Others). Profiles of Leading LiDAR Companies and Regional and Leading National Market Analysis PLUS COVID-19 Impact Analysis
Automotive LiDAR–our new study reveals trends, R&D progress, and predicted revenues
Where is the Automotive LiDAR market heading? If you are involved in this sector you must read this newly updated report. Visiongain’s report shows you the potential revenues streams to 2030, assessing data, trends, opportunities and business prospects there.
Discover how to stay ahead
Our 490+ page report provides 500+ tables and charts/graphs. Read on to discover the most lucrative areas in the industry and the future market prospects. Our new study lets you assess forecasted sales at overall world market and regional level. See financial results, trends, opportunities, and revenue predictions. Much opportunity remains in this growing Automotive LiDAR Market. See how to exploit the opportunities.
Forecasts to 2030 and other analyses reveal the commercial prospects
• In addition to revenue forecasting to 2030, our new study provides you with recent results, growth rates, and market shares.
• You find original analyses, with business outlooks and developments.
• Discover qualitative analyses (including market dynamics, drivers, opportunities, restraints and challenges), SWOT, PEST, Value Chain Analysis, product profiles and commercial developments.
• Discover COVID-19 Impact Analysis
To access the data contained in this document please email contactus@visiongain.com
Discover sales predictions for the world market and submarkets
By Technology Type
• Mechanical LiDAR
• Solid-State LiDAR
By Vehicle Type
• Passenger Vehicle
• Light Commercial Vehicle
• Heavy Commercial Vehicle
By Image Type
• 2D Image LiDAR
• 3D Image LiDAR
By Application
• Robo-taxi LiDAR
• ADAS LiDAR
• Autonomous Vehicle LiDAR

In addition to the revenue predictions for the overall world market and segments, you will also find revenue forecasts for 4 regional and 14 leading national markets:
• North America
– U.S.
– Canada
• Europe
– Germany
– France
– UK
– Italy
– Spain
– Russia
– Rest of Europe
• Asia Pacific
– China
– Japan
– India
– South Korea
– Rest of Asia Pacific
• LAMEA
– Brazil
– Saudi Arabia
– South Africa
– Rest of LAMEA
The report also includes profiles and for some of the leading companies in the Automotive LiDAR Market, with a focus on this segment of these companies’ operations.
Leading companies and the potential for market growth
Overall world revenue for Automotive LiDAR Market will surpass $xx million in 2020, our work calculates. We predict strong revenue growth through to 2030.
Our work identifies which organizations hold the greatest potential. Discover their capabilities, progress, and commercial prospects, helping you stay ahead.
How the Automotive LiDAR Market report helps you
In summary, our 490+ page report provides you with the following knowledge:
• Revenue forecasts to 2030 for Automotive LiDAR Market, with forecasts By Technology (Mechanical LiDAR and Solid-State LiDAR), Vehicle Type (Passenger Vehicles, light Commercial Vehicles, Heavy Commercial Vehicles), Image Type (2D Image LiDAR, 3D Image LiDAR), Application (Robo-taxi, ADAS, Autonomous Vehicle) and Placement (Bumper & Grill, Headlight & Taillight, Roofs and Upper Pillars and Others) Plus Analysis of Leading Companies each forecasted at a global and regional level– discover the industry’s prospects, finding the most lucrative places for investments and revenues
• Revenue forecasts to 2030 for 4 regional and 14 key national markets – See forecasts for the Automotive LiDAR market in North America, Europe, Asia-Pacific, and LAMEA.
• Prospects for established firms and those seeking to enter the market– including company profiles for 13 of the major companies involved in the Automotive LiDAR Market. Some of the company’s profiles in this report include Continental AG, Aptiv, Panasonic Corporation, Valeo S.A., Robert Bosch, LeddarTech, AEye, Velodyne LiDAR, Luminar Technologies, Quanergy Systems, Infineon Technologies AG, First Sensor, and Texas Instruments.
Find quantitative and qualitative analyses with independent predictions. Receive information that only our report contains, staying informed with this invaluable business intelligence.
Information found nowhere else
With our newly report title, you are less likely to fall behind in knowledge or miss out on opportunities. See how our work could benefit your research, analyses, and decisions.
Visiongain’s study is for everybody needing commercial analyses for the Automotive LiDAR Market and leading companies. You will find data, trends and predictions.
To access the data contained in this document please email contactus@visiongain.com
Buy our report today Automotive LiDAR Market Report 2020-2030: Forecasts by Technology (Mechanical LiDAR and Solid-State LiDAR), Vehicle Type (Passenger Vehicles, Light Commercial Vehicles, Heavy Commercial Vehicles), Image Type (2D Image LiDAR, 3D Image LiDAR), Application (Robo-taxi, ADAS, Autonomous Vehicle) and Placement (Bumper & Grill, Headlight & Taillight, Roofs and Upper Pillars, and Others). Profiles of Leading LiDAR Companies and Regional and Leading National Market Analysis PLUS COVID-19 Impact Analysis. Avoid missing out by staying informed – order our report now.
Visiongain is a trading partner with the US Federal Government
CCR Ref number: KD4R6
Do you have any custom requirements we can help you with? Any need for a specific country, geo region, market segment or specific company information? Contact us today, we can discuss your needs and see how we can help: sara.peerun@visiongain.com
1.1. Why You Should Read This Report
1.2. How This Report Delivers
1.3. Key Questions Answered by This Analytical Report Include:
1.4. Who is This Report For?
1.5. Methodology
1.5.1. Primary Research
1.5.2. Secondary Research
1.5.3. Market Evaluation & Forecasting Methodology
1.6. Frequently Asked Questions (FAQ)
1.7. Associated Visiongain Reports
1.8. About Visiongain
2. Executive Summary
3. Introduction to Automotive LiDAR Market
3.1. Automotive LiDAR Submarkets Definition
3.1.1. Technology
3.2. LiDAR Penetration is Higher in the Premium Car Segment
3.3. Expansion in Mid & Small Car Segment: an opportunity for LiDAR
3.4. A Next Step for LiDAR Adoption
3.5. Top winning strategies
3.5.1. Product Launch
3.5.2. Agreement & Partnership
3.6. Learn How Government Mandates Drives Penetration
3.7. Key Findings
3.7.1. Top Factors Impacting Automotive LiDAR Market
3.7.2. Market Share Analysis, 2019: Automotive LiDAR Market
3.8. Porter’s five force analysis
3.8.1. Low power of suppliers owing to large number of suppliers and undifferentiated product
3.8.2. High power of buyers as negligible switching cost and capacity to perform backward integration
3.8.3. Unavailability of other driver assistance solutions lowers threat of substitution
3.8.4. High threat of new entrants as easy access to distribution channels and supportive regulations
3.8.5. Presence of numerous competitors creates high degree of competition
3.9. SWOT Analysis
3.10. PEST Analysis
3.11. Value Chain Analysis
3.12. Requirements to be met by LiDAR sensor
3.13. Market Dynamics
3.13.1. Drivers
3.13.2. Restraints
3.13.3. Opportunities
4. Coronavirus (COVID-19) Outbreak- Impact Assessment
4.1. Auto Manufacturing
4.2. Auto Sales and Shipment
4.3. Market Beyond: What to expect by COVID-19
4.3.1. Base case (V Shape Growth)
4.3.2. Rapid decline (U shape growth)
4.3.3. Slow recovery (L shape growth)
4.3.4. Critical growth (W shape growth)
5. Global Automotive LiDAR Market 2020-2030
5.1. Global Automotive LiDAR Market Forecast 2020-2030
5.1.1. Automotive LiDAR Market: Recovery Forecasts (V, U, W, L)
5.2. Regional Automotive LiDAR Market Forecast 2020-2030
5.2.1. Regional Automotive LiDAR Market: Recovery Forecasts (V, U, W, L)
6. Global Automotive LiDAR By Technology Submarket Forecast 2020-2030
6.1. Mechanical LiDAR submarket forecast 2020-2030
6.1.1. Global Automotive LiDAR Market for Mechanical LiDAR Segment: Recovery Forecasts (V, U, W, L)
6.2. Solid-State LiDAR submarket forecast 2020-2030
6.2.1. Global Automotive LiDAR Market for Solid-State LiDAR Segment: Recovery Forecasts (V, U, W, L)
7. Global Automotive LiDAR by Image Type Submarket Forecast 2020-2030
7.1. 2D Image LiDAR submarket forecast 2020-2030
7.1.1. Global Automotive LiDAR Market for 2D Image LiDAR Segment: Recovery Forecasts (V, U, W, L)
7.2. 3D Image LiDAR submarket forecast 2020-2030
7.2.1. Global Automotive LiDAR Market for 3D Image LiDAR Segment: Recovery Forecasts (V,U, W, L)
8. Global Automotive LiDAR by Application Submarket Forecast 2020-2030
8.1. LiDAR market by Robo-Taxi application forecast 2020-2030
8.1.1. Global Automotive LiDAR Market for Robo-Taxi Application Segment: Recovery Forecasts (V,U, W, L)
8.2. Automotive LiDAR market by ADAS application forecast 2020-2030
8.2.1. Global Automotive LiDAR Market for ADAS Application Segment: Recovery Forecasts (V, U, W, L)
8.3. Automotive LiDAR market by Autonomous Vehicle application forecast 2020-2030
8.3.1. Global Automotive LiDAR Market for Autonomous Vehicle Application Segment: Recovery Forecasts (V, U, W, L)
9. Global Automotive LiDAR By Vehicle Type Submarket Forecast 2020-2030
9.1. Automotive LiDAR market by Passenger car submarket forecast 2020-2030
9.1.1. Global Automotive LiDAR Market for Passenger car Segment: Recovery Forecasts (V, U, W, L)
9.2. Automotive LiDAR market by LCV submarket forecast 2020-2030
9.2.1. Global Automotive LiDAR Market for LCV Segment: Recovery Forecasts (V, U, W, L)
9.3. Automotive LiDAR market by HCV submarket forecast 2020-2030
9.3.1. Global Automotive LiDAR Market for HCV Segment: Recovery Forecasts (V, U, W, L)
10. Global Automotive LiDAR By Placement Submarket Forecast 2020-2030
10.1. Automotive LiDAR market by Bumper & Grill submarket forecast 2020-2030
10.1.1. Global Automotive LiDAR Market for Bumper & Grill Segment: Recovery Forecasts (V, U, W, L)
10.2. Automotive LiDAR Market by Headlight and Taillight submarket forecast 2020-2030
10.2.1. Global Automotive LiDAR Market for Headlight and Taillight Segment: Recovery Forecasts (V, U, W, L)
10.3. Automotive LiDAR Market by Roofs and Upper Pillars submarket forecast 2020-2030
10.3.1. Global Automotive LiDAR Market for Roofs and Upper Pillars Segment: Recovery Forecasts (V, U, W, L)
10.4. Automotive LiDAR market by Others (Windscreen and Rear View Mirrors) submarket forecast 2020-2030
10.4.1. Global Automotive LiDAR Market for Others Segment: Recovery Forecasts (V, U, W, L)
11. Regional & Leading National Automotive LiDAR Market Forecast 2020-2030
11.1. Leading National Automotive LiDAR Markets Forecast 2020-2030
11.2. Rankings of the Leading National LiDAR Markets 2020, 2025, 2030
11.3. Regional Automotive LiDAR Market Forecast 2020-2030
11.4. Global Automotive LiDAR Market Forecast 2020-2030, Recovery Scenarios (V, U, L, W)
12. North America Automotive LiDAR Market Forecast 2020-2030
12.1. North America Automotive LiDAR Market Forecast by Country, 2020-2030
12.1.1. US Automotive LiDAR Market Forecast 2020-2030
12.1.2. Recovery Scenarios (V, U, W, L): US Automotive LiDAR Market Forecast 2020-2030
12.1.3. Canada Automotive LiDAR Market Forecast 2020-2030
12.1.4. Recovery Scenarios (V, U, W, L): Canada Automotive LiDAR Market Forecast 2020-2030
12.2. North America Automotive LiDAR Market by Technology Forecast 2020-2030
12.2.1. North America Automotive LiDAR Market by Technology Forecast 2020-2030: Recovery Scenario (V, U, L, W)
12.3. North America Automotive LiDAR Market by Image Sub-Market Forecast 2020-2030
12.3.1. North America Automotive LiDAR Market by Image Sub-Market Forecast 2020-2030: Recovery Scenario (V, U, L, W)
12.4. North America Automotive LiDAR Market by Application Sub-Market Forecast 2020-2030
12.4.1. North America Automotive LiDAR Market by Application Sub-Market Forecast 2020-2030: Recovery Scenario (V, U, L, W)
12.5. North America Automotive LiDAR Market by Placement Sub-Market Forecast 2020-2030
12.5.1. North America Automotive LiDAR Market by Placement Sub-Market Forecast 2020-2030: Recovery Scenario (V, U, L, W)
12.6. North America Automotive LiDAR Market by Vehicle Type Sub-Market Forecast 2020-2030
12.6.1. North America Automotive LiDAR Market by Vehicle Type Sub-Market Forecast 2020-2030: Recovery Scenario (V, U, L, W)
13. Europe Automotive LiDAR Market Forecast 2020-2030
13.1. Europe Automotive LiDAR Market Forecast by Country, 2020-2030
13.1.1. Germany Automotive LiDAR Market Forecast 2020-2030
13.1.2. Recovery Scenarios (V, U, W, L): Germany Automotive LiDAR Market Forecast 2020-2030
13.1.3. United Kingdom Automotive LiDAR Market Forecast 2020-2030
13.1.4. Recovery Scenarios (V, U, W, L): UK Automotive LiDAR Market Forecast 2020-2030
13.1.5. France Automotive LiDAR Market Forecast 2020-2030
13.1.6. Recovery Scenarios (V, U, W, L): France Automotive LiDAR Market Forecast 2020-2030
13.1.7. Italy Automotive LiDAR Market Forecast 2020-2030
13.1.8. Recovery Scenarios (V, U, W, L): Italy Automotive LiDAR Market Forecast 2020-2030
13.1.9. Russia Automotive LiDAR Market Forecast 2020-2030
13.1.10. Recovery Scenarios (V, U, W, L): Russia Automotive LiDAR Market Forecast 2020-2030
13.1.11. Rest of Europe Automotive LiDAR Market Forecast 2020-2030
13.1.12. Recovery Scenarios (V, U, W, L): Rest of Europe Automotive LiDAR Market Forecast 2020-2030
13.2. Europe Automotive LiDAR Market by Technology Forecast 2020-2030
13.2.1. Europe Automotive LiDAR Market by Technology Forecast 2020-2030: Recovery Scenario (V, U, L, W)
13.3. Europe Automotive LiDAR Market by Image Type Forecast 2020-2030
13.3.1. Europe Automotive LiDAR Market by Image Type Forecast 2020-2030: Recovery Scenario (V, U, L, W)
13.4. Europe Automotive LiDAR Market by Application Submarket Forecast 2020-2030
13.4.1. Europe Automotive LiDAR Market by Application Sub-Market Forecast 2020-2030: Recovery Scenario (V, U, L, W)
13.5. Europe Automotive LiDAR Market by Placement Forecast 2020-2030
13.5.1. Europe Automotive LiDAR Market by Placement Sub-Market Forecast 2020-2030: Recovery Scenario (V, U, L, W)
13.6. Europe Automotive LiDAR Market by Vehicle Type Forecast 2020-2030
13.6.1. Europe Automotive LiDAR Market by Vehicle Type Sub-Market Forecast 2020-2030: Recovery Scenario (V, U, L, W)
14. Asia-Pacific (APAC) Automotive LiDAR Market Forecast 2020-2030
14.1. APAC Automotive LiDAR Market by Country Forecast 2020-2030
14.1.1. China Automotive LiDAR Market Forecast 2020-2030
14.1.2. Recovery Scenarios (V, U, W, L): China Automotive LiDAR Market Forecast 2020-2030
14.1.3. Japan Automotive LiDAR Market Forecast 2020-2030
14.1.4. Recovery Scenarios (V, U, W, L): Japan Automotive LiDAR Market Forecast 2020-2030
14.1.5. India Automotive LiDAR Market Forecast 2020-2030
14.1.6. Recovery Scenarios (V, U, W, L): India Automotive LiDAR Market Forecast 2020-2030
14.1.7. South Korea Automotive LiDAR Market Forecast 2020-2030
14.1.8. Recovery Scenarios (V, U, W, L): South Korea Automotive LiDAR Market Forecast 2020-2030
14.1.9. Rest of APAC Automotive LiDAR Market Forecast 2020-2030
14.1.10. Recovery Scenarios (V, U, W, L): Rest of APAC Automotive LiDAR Market Forecast 2020-2030
14.2. APAC Automotive LiDAR Market by Technology Type Forecast 2020-2030
14.2.1. APAC Automotive LiDAR Market by Technology Forecast 2020-2030: Recovery Scenario (V, U, L, W)
14.3. APAC Automotive LiDAR Market by Image Type Forecast 2020-2030
14.3.1. APAC Automotive LiDAR Market by Image Type Forecast 2020-2030: Recovery Scenario (V, U, L, W)
14.4. APAC Automotive LiDAR Market by Application Forecast 2020-2030
14.4.1. APAC Automotive LiDAR Market by Application Sub-Market Forecast 2020-2030: Recovery Scenario (V, U, L, W)
14.5. APAC Automotive LiDAR Market by Placement Forecast 2020-2030
14.5.1. APAC Automotive LiDAR Market by Placement Sub-Market Forecast 2020-2030: Recovery Scenario (V, U, L, W)
14.6. APAC Automotive LiDAR Market by Vehicle Type Forecast 2020-2030
14.6.1. APAC Automotive LiDAR Market by Vehicle Type Sub-Market Forecast 2020-2030: Recovery Scenario (V, U, L, W)
15. LAMEA Automotive LiDAR Market Forecast 2020-2030
15.1. LAMEA Automotive LiDAR Market by Country Forecast 2020-2030
15.1.1. Brazil Automotive LiDAR Market Forecast 2020-2030
15.1.2. Recovery Scenarios (V, U, W, L): Brazil Automotive LiDAR Market Forecast 2020-2030
15.1.3. Saudi Arabia Automotive LiDAR Market Forecast 2020-2030
15.1.4. Recovery Scenarios (V, U, W, L): Saudi Arabia Automotive LiDAR Market Forecast 2020-2030
15.1.5. South Africa Automotive LiDAR Market Forecast 2020-2030
15.1.6. Recovery Scenarios (V, U, W, L): South Africa Automotive LiDAR Market Forecast 2020-2030
15.1.7. Rest of LAMEA Automotive LiDAR Market Forecast 2020-2030
15.1.8. Recovery Scenarios (V, U, W, L): Rest of LAMEA Automotive LiDAR Market Forecast 2020-2030
15.2. LAMEA Automotive LiDAR Market by Technology Type Forecast 2020-2030
15.2.1. LAMEA Automotive LiDAR Market by Technology Forecast 2020-2030: Recovery Scenario (V, U, L, W)
15.3. LAMEA Automotive LiDAR Market by Image Type Forecast 2020-2030
15.3.1. LAMEA Automotive LiDAR Market by Image Type Forecast 2020-2030: Recovery Scenario (V, U, L, W)
15.4. LAMEA Automotive LiDAR Market by Application Forecast 2020-2030
15.4.1. LAMEA Automotive LiDAR Market by Application Sub-Market Forecast 2020-2030: Recovery Scenario (V, U, L, W)
15.5. LAMEA Automotive LiDAR Market by Placement Forecast 2020-2030
15.5.1. LAMEA Automotive LiDAR Market by Placement Sub-Market Forecast 2020-2030: Recovery Scenario (V, U, L, W)
15.6. LAMEA Automotive LiDAR Market by Vehicle Type Forecast 2020-2030
15.6.1. LAMEA Automotive LiDAR Market by Vehicle Type Sub-Market Forecast 2020-2030: Recovery Scenario (V, U, L, W)
16. Leading Automotive LiDAR Companies
16.1. Continental AG
16.1.1. Continental AG: Company Overview
16.1.2. Continental AG: Financials 2015-2019
16.1.3. Continental AG Products
16.1.4. Continental’s Role in the Automotive LiDAR Market
16.1.5. Continental’s Future Outlook
16.1.6. Continental AG: Recent Developments
16.2. Aptiv Company Overview
16.2.1. Aptiv: Company Overview
16.2.2. Aptiv: Financials 2015-2019
16.2.3. Aptiv Products
16.2.4. Aptiv’s Role in the Automotive LiDAR Market
16.2.5. Aptiv Future Outlook
16.2.6. Aptiv: Recent Developments
16.3. Panasonic Corporation
16.3.1. Panasonic Corporation: Company Overview
16.3.2. Panasonic : Financials 2015-2019
16.3.3. Panasonic Products
16.3.4. Panasonic’s Role in the Automotive LiDAR Market
16.3.5. Panasonic Future Outlook
16.3.6. Panasonic: Recent Developments
16.4. Valeo S.A.
16.4.1. Valeo S.A.: Company Overview
16.4.2. Valeo S.A.: Financials 2015-2019
16.4.3. Valeo’s Role in the Automotive LiDAR Market
16.4.4. Valeo S.A Products
16.4.5. Valeo’s Future Outlook
16.4.6. Valeo S.A.: Recent Developments
16.5. Robert Bosch
16.5.1. Bosch: Company Overview
16.5.2. Bosch: Financials 2015-2019
16.5.3. Bosch Role in the Automotive LiDAR Market
16.5.4. Bosch Products
16.5.5. Bosch Future Outlook
16.5.6. Bosch: Recent Developments
16.6. LeddarTech
16.6.1. LeddarTech: Company Overview
16.6.2. LeddarTech Role in the Automotive LiDAR Market
16.6.3. LeddarTech Products
16.6.4. LeddarTech Future Outlook
16.6.5. LeddarTech: Recent Developments
16.7. AEye
16.7.1. AEye: Company Overview
16.7.2. AEye Role in the Automotive LiDAR Market
16.7.3. AEye Products
16.7.4. AEye Future Outlook
16.7.5. AEye: Recent Developments
16.8. Velodyne LIDAR, Inc.
16.8.1. Velodyne LIDAR: Company Overview
16.8.2. Velodyne LIDAR Role in the Automotive LiDAR Market
16.8.3. Velodyne LIDAR Products
16.8.4. Velodyne LIDAR Future Outlook
16.8.5. Velodyne LIDAR: Recent Developments
16.9. Luminar Technologies
16.9.1. Luminar Technologies: Company Overview
16.9.2. Luminar Technologies Products
16.9.3. Luminar: Recent Developments
16.10. Quanergy Systems Inc.
16.10.1. Quanergy Systems: Company Overview
16.10.2. Quanergy Systems Products / Services
16.10.3. Quanergy Systems: Recent Developments
16.11. Infineon Technologies AG
16.11.1. Infineon Technologies AG: Company Overview
16.11.2. Infineon Technologies: Financials 2015-2019
16.11.3. Infineon Technologies Products
16.11.4. Infineon Technologies: Recent Developments
16.12. First Sensor
16.12.1. First Sensor: Company Overview
16.12.2. First Sensor: Financials 2015-2019
16.12.3. First Sensor Products
16.12.4. First Sensor: Recent Developments
16.13. Texas Instruments
16.13.1. Texas Instruments: Company Overview
16.13.2. Texas Instruments: Financials 2015-2019
16.13.3. Texas Instruments Products
16.13.4. Texas Instruments: Recent Developments
17. Conclusions
18. Glossary
List of Tables
Table 1 Global Automotive LiDAR Market, 2019-2030 (US$ million, CAGR %)
Table 2 Future US and Euro NCAP Developments
Table 3 Global Automotive LiDAR Market SWOT Analysis
Table 4 Global Automotive LiDAR Market Forecast, COVID V shaped Scenario 2020-2030 (US$ million, AGR %, CAGR %)
Table 5 Global Automotive LiDAR Market Forecast, COVID U shaped Scenario 2020-2030 (US$ million, AGR %, CAGR %)
Table 6 Global Automotive LiDAR Market Forecast, COVID L shaped Scenario 2020-2030 (US$ million, AGR %, CAGR %)
Table 7 Global Automotive LiDAR Market Forecast, COVID W shaped Scenario 2020-2030 (US$ million, AGR %, CAGR %)
Table 8 Global Automotive LiDAR Market Forecast by, 2020-2030 (US$ million, AGR %, CAGR %)
Table 9 Global Automotive LiDAR Market Forecast, COVID V shaped Scenario 2020-2030 (US$ million, AGR %, CAGR %)
Table 10 Global Automotive LiDAR Market Forecast, COVID U shaped Scenario 2020-2030 (US$ million, AGR %, CAGR %)
Table 11 Global Automotive LiDAR Market Forecast, COVID L shaped Scenario 2020-2030 (US$ million, AGR %, CAGR %)
Table 12 Global Automotive LiDAR Market Forecast, COVID W shaped Scenario 2020-2030 (US$ million, AGR %, CAGR %)
Table 13 Regional Automotive LiDAR Market Forecast 2020-2030 ($mn, AGR %, CAGR%)
Table 14 Global Automotive LiDAR Market by Region, 2020, 2025, 2030 (CAGR %)
Table 15 “V” Shaped Recovery: Global Automotive LiDAR Market Forecast by Region, 2020-2030 (US$ million, AGR %)
Table 16 “U” Shaped Recovery: Global Automotive LiDAR Market Forecast by Region, 2020-2030 (US$ million, AGR %)
Table 17 “L” Shaped Recovery: Global Automotive LiDAR Market Forecast by Region, 2020-2030 (US$ million, AGR %)
Table 18 “W” Shaped Recovery: Global Automotive LiDAR Market Forecast by Region, 2020-2030 (US$ million, AGR %)
Table 19 Global Automotive LiDAR Market Forecast by Technology, 2020- 2030 (US$ million, AGR%, CAGR%)
Table 20 Global Automotive LiDAR Market by Technology, 2020, 2025, 2030 (CAGR %)
Table 21 Global Automotive Mechanical LiDAR Market Forecast, by Region, 2020- 2030 (US$ million, AGR%, CAGR%)
Table 22 Global Mechanical LiDAR Market by Region, 2020, 2025, 2030 (CAGR %)
Table 23 “V” Shaped Recovery: Global Automotive LiDAR Market for Mechanical LiDAR Segment, Revenue Forecast 2020-2030 (US$ million, AGR%, CAGR%)
Table 24 “U” Shaped Recovery: Global Automotive LiDAR Market for Mechanical LiDAR Segment, Revenue Forecast 2020-2030 (US$ million, AGR%, CAGR%)
Table 25 “L” Shaped Recovery: Global Automotive LiDAR Market for Mechanical LiDAR Segment, Revenue Forecast 2020-2030 (US$ million, AGR%, CAGR%)
Table 26 “W” Shaped Recovery: Global Automotive LiDAR Market for Mechanical LiDAR Segment, Revenue Forecast 2020-2030 (US$ million, AGR%, CAGR%)
Table 27 Global Automotive Solid-State LiDAR Market Forecast, by Region, 2020- 2030 (US$ million, AGR%, CAGR%)
Table 28 Global Solid State LiDAR Market by Region, 2020, 2025, 2030 (CAGR %)
Table 29 “V” Shaped Recovery: Global Automotive LiDAR Market for Solid-State LiDAR Segment, Revenue Forecast 2020-2030 (US$ million, AGR%, CAGR%)
Table 30 “U” Shaped Recovery: Global Automotive LiDAR Market for Solid-State LiDAR Segment, Revenue Forecast 2020-2030 (US$ million, AGR%, CAGR%)
Table 31 “L” Shaped Recovery: Global Automotive LiDAR Market for Solid-State LiDAR Segment, Revenue Forecast 2020-2030 (US$ million, AGR%, CAGR%)
Table 32 “W” Shaped Recovery: Global Automotive LiDAR Market for Solid-State LiDAR Segment, Revenue Forecast 2020-2030 (US$ million, AGR%, CAGR%)
Table 33 Global Automotive LiDAR Market Forecast, by Image Type, 2020- 2030 (US$ million, AGR%, CAGR%)
Table 34 Global Automotive LiDAR Market by Image Type, 2020, 2025, 2030 (CAGR %)
Table 35 Global Automotive 2D Image LiDAR Market Forecast, by Region, 2020- 2030 (Revenue USD million, AGR, CAGR)
Table 36 Global 2D Image Type LiDAR Market by Region, 2020, 2025, 2030 (CAGR %)
Table 37 “V” Shaped Recovery: Global Automotive LiDAR Market for 2D Image LiDAR Segment, Revenue Forecast 2020-2030 (US$ million, AGR%, CAGR%)
Table 38 “U” Shaped Recovery: Global Automotive LiDAR Market for 2D Image LiDAR Segment, Revenue Forecast 2020-2030 (US$ million, AGR%, CAGR%)
Table 39 “L” Shaped Recovery: Global Automotive LiDAR Market for 2D Image LiDAR Segment, Revenue Forecast 2020-2030 (US$ million, AGR%, CAGR%)
Table 40 “W” Shaped Recovery: Global Automotive LiDAR Market for 2D Image LiDAR Segment, Revenue Forecast 2020-2030 (US$ million, AGR%, CAGR%)
Table 41 Global Automotive 3D Image LiDAR Market Forecast, by Region, 2020- 2030 (US$ million, AGR%, CAGR%)
Table 42 Global 3D Image Type LiDAR Market by Region, 2020, 2025, 2030 (CAGR %)
Table 43 “V” Shaped Recovery: Global Automotive LiDAR Market for 3D Image LiDAR Segment, Revenue Forecast 2020-2030 (US$ million, AGR%, CAGR%)
Table 44 “U” Shaped Recovery: Global Automotive LiDAR Market for 3D Image LiDAR Segment, Revenue Forecast 2020-2030 (US$ million, AGR%, CAGR%)
Table 45 “L” Shaped Recovery: Global Automotive LiDAR Market for 3D Image LiDAR Segment, Revenue Forecast 2020-2030 (US$ million, AGR%, CAGR%)
Table 46 “W” Shaped Recovery: Global Automotive LiDAR Market for 3D Image LiDAR Segment, Revenue Forecast 2020-2030 (US$ million, AGR%, CAGR%)
Table 47 Global Automotive LiDAR Market Forecast, by Application, 2020- 2030 (US$ million, AGR%, CAGR%)
Table 48 Global Automotive LiDAR Market by Application, 2020, 2025, 2030 (CAGR %)
Table 49 Global Robo-taxi LiDAR Market Forecast, by Region, 2020- 2030 (US$ million, AGR%, CAGR%)
Table 50 Global Robo-taxi LiDAR Market by Region, 2020, 2025, 2030 (CAGR %)
Table 51 “V” Shaped Recovery: Global Automotive LiDAR Market for Robo-Taxi Application Segment, Revenue Forecast 2020-2030 (US$ million, AGR%, CAGR%)
Table 52 “U” Shaped Recovery: Global Automotive LiDAR Market for Robo-Taxi Application Segment, Revenue Forecast 2020-2030 (US$ million, AGR%, CAGR%)
Table 53 “L” Shaped Recovery: Global Automotive LiDAR Market for Robo-Taxi Application Segment, Revenue Forecast 2020-2030 (US$ million, AGR%, CAGR%)
Table 54 “W” Shaped Recovery: Global Automotive LiDAR Market for Robo-Taxi Application Segment, Revenue Forecast 2020-2030 (US$ million, AGR%, CAGR%)
Table 55 Global ADAS LiDAR Market Forecast, by Region, 2020- 2030 (US$ million, AGR%, CAGR%)
Table 56 Global ADAS LiDAR Market by Region, 2020, 2025, 2030 (CAGR %)
Table 57 “V” Shaped Recovery: Global Automotive LiDAR Market for ADAS Application Segment, Revenue Forecast 2020-2030 (US$ million, AGR%, CAGR%)
Table 58 “U” Shaped Recovery: Global Automotive LiDAR Market for ADAS Application Segment, Revenue Forecast 2020-2030 (US$ million, AGR%, CAGR%)
Table 59 “L” Shaped Recovery: Global Automotive LiDAR Market for ADAS Application Segment, Revenue Forecast 2020-2030 (US$ million, AGR%, CAGR%)
Table 60 “W” Shaped Recovery: Global Automotive LiDAR Market for ADAS Application Segment, Revenue Forecast 2020-2030 (US$ million, AGR%, CAGR%)
Table 61 Global Autonomous Vehicle LiDAR Market Forecast, by Region, 2020- 2030 (US$ million, AGR%, CAGR%)
Table 62 Global Autonomous Vehicle LiDAR Market by Region, 2020, 2025, 2030 (CAGR %)
Table 63 “V” Shaped Recovery: Global Automotive LiDAR Market for Autonomous Vehicle Application Segment, Revenue Forecast 2020-2030 (US$ million, AGR%, CAGR%)
Table 64 “U” Shaped Recovery: Global Automotive LiDAR Market for Autonomous Vehicle Application Segment, Revenue Forecast 2020-2030 (US$ million, AGR%, CAGR%)
Table 65 “L” Shaped Recovery: Global Automotive LiDAR Market for Autonomous Vehicle Application Segment, Revenue Forecast 2020-2030 (US$ million, AGR%, CAGR%)
Table 66 “W” Shaped Recovery: Global Automotive LiDAR Market for Autonomous Vehicle Application Segment, Revenue Forecast 2020-2030 (US$ million, AGR%, CAGR%)
Table 67 Global Automotive LiDAR Market Forecast, by Vehicle Type, 2020- 2030 (US$ million, AGR%, CAGR%)
Table 68 Global Automotive LiDAR Market by Vehicle Type, 2020, 2025, 2030 (CAGR %)
Table 69 Global Passenger Cars LiDAR Market Forecast, by Region, 2020- 2030 (US$ million, AGR%, CAGR%)
Table 70 Global Passenger Cars LiDAR Market by Region, 2020, 2025, 2030 (CAGR %)
Table 71 “V” Shaped Recovery: Global Automotive LiDAR Market for Passenger car Segment, Revenue Forecast 2020-2030 (US$ million, AGR%, CAGR%)
Table 72 “U” Shaped Recovery: Global Automotive LiDAR Market for Passenger car Segment, Revenue Forecast 2020-2030 (US$ million, AGR%, CAGR%)
Table 73 “L” Shaped Recovery: Global Automotive LiDAR Market for Passenger car Segment, Revenue Forecast 2020-2030 (US$ million, AGR%, CAGR%)
Table 74 “W” Shaped Recovery: Global Automotive LiDAR Market for Passenger car Segment, Revenue Forecast 2020-2030 (US$ million, AGR%, CAGR%)
Table 75 Global LCV LiDAR Market Forecast, by Region, 2020- 2030 (US$ million, AGR%, CAGR%)
Table 76 Global LCV LiDAR Market by Region, 2020, 2025, 2030 (CAGR %)
Table 77 “V” Shaped Recovery: Global Automotive LiDAR Market for LCV Segment, Revenue Forecast 2020-2030 (US$ million, AGR%, CAGR%)
Table 78 “U” Shaped Recovery: Global Automotive LiDAR Market for LCV Segment, Revenue Forecast 2020-2030 (US$ million, AGR%, CAGR%)
Table 79 “L” Shaped Recovery: Global Automotive LiDAR Market for LCV Segment, Revenue Forecast 2020-2030 (US$ million, AGR%, CAGR%)
Table 80 “W” Shaped Recovery: Global Automotive LiDAR Market for LCV Segment, Revenue Forecast 2020-2030 (US$ million, AGR%, CAGR%)
Table 81 Global HCV LiDAR Market Forecast, by Region, 2020- 2030 (US$ million, AGR%, CAGR%)
Table 82 Global HCV LiDAR Market by Region, 2020, 2025, 2030 (CAGR %)
Table 83 “V” Shaped Recovery: Global Automotive LiDAR Market for HCV Segment, Revenue Forecast 2020-2030 (US$ million, AGR%, CAGR%)
Table 84 “U” Shaped Recovery: Global Automotive LiDAR Market for HCV Segment, Revenue Forecast 2020-2030 (US$ million, AGR%, CAGR%)
Table 85 “L” Shaped Recovery: Global Automotive LiDAR Market for HCV Segment, Revenue Forecast 2020-2030 (US$ million, AGR%, CAGR%)
Table 86 “W” Shaped Recovery: Global Automotive LiDAR Market for HCV Segment, Revenue Forecast 2020-2030 (US$ million, AGR%, CAGR%)
Table 87 Global Automotive LiDAR Market Forecast, by Placement Submarket, 2020- 2030 (US$ million, AGR%, CAGR%)
Table 88 Global Automotive LiDAR Market by Placement Submarket, 2020, 2025, 2030 (CAGR %)
Table 89 Global Bumper & Grill LiDAR Market Forecast, by Region, 2020- 2030 (US$ million, AGR%, CAGR%)
Table 90 Global Bumper & Grill LiDAR Market by Region, 2020, 2025, 2030 (CAGR %)
Table 91 “V” Shaped Recovery: Global Automotive LiDAR Market for Bumper & Grill Segment, Revenue Forecast 2020-2030 (US$ million, AGR%, CAGR%)
Table 92 “U” Shaped Recovery: Global Automotive LiDAR Market for Bumper & Grill Segment, Revenue Forecast 2020-2030 (US$ million, AGR%, CAGR%)
Table 93 “L” Shaped Recovery: Global Automotive LiDAR Market for Bumper & Grill Segment, Revenue Forecast 2020-2030 (US$ million, AGR%, CAGR%)
Table 94 “W” Shaped Recovery: Global Automotive LiDAR Market for Bumper & Grill Segment, Revenue Forecast 2020-2030 (US$ million, AGR%, CAGR%)
Table 95 Global Headlight & Taillight LiDAR Market Forecast, by Region, 2020- 2030 (US$ million, AGR%, CAGR%)
Table 96 Global Headlight & Taillight LiDAR Market by Region, 2020, 2025, 2030 (CAGR %)
Table 97 “V” Shaped Recovery: Global Automotive LiDAR Market for Headlight and Taillight Segment, Revenue Forecast 2020-2030 (US$ million, AGR%, CAGR%)
Table 98 “U” Shaped Recovery: Global Automotive LiDAR Market for Headlight and Taillight Segment, Revenue Forecast 2020-2030 (US$ million, AGR%, CAGR%)
Table 99 “L” Shaped Recovery: Global Automotive LiDAR Market for Headlight and Taillight Segment, Revenue Forecast 2020-2030 (US$ million, AGR%, CAGR%)
Table 100 “W” Shaped Recovery: Global Automotive LiDAR Market for Headlight and Taillight Segment, Revenue Forecast 2020-2030 (US$ million, AGR%, CAGR%)
Table 101 Global Roofs and Upper Pillars LiDAR Market Forecast, by Region, 2020- 2030 (US$ million, AGR%, CAGR%)
Table 102 Global Roofs and Upper Pillars LiDAR Market by Region, 2020, 2025, 2030 (CAGR %)
Table 103 “V” Shaped Recovery: Global Automotive LiDAR Market for Roofs and Upper Pillars Segment, Revenue Forecast 2020-2030 (US$ million, AGR%, CAGR%)
Table 104 “U” Shaped Recovery: Global Automotive LiDAR Market for Roofs and Upper Pillars Segment, Revenue Forecast 2020-2030 (US$ million, AGR%, CAGR%)
Table 105 “L” Shaped Recovery: Global Automotive LiDAR Market for Roofs and Upper Pillars Segment, Revenue Forecast 2020-2030 (US$ million, AGR%, CAGR%)
Table 106 “W” Shaped Recovery: Global Automotive LiDAR Market for Roofs and Upper Pillars Segment, Revenue Forecast 2020-2030 (US$ million, AGR%, CAGR%)
Table 107 Global Other Location LiDAR Market Forecast, by Region, 2020- 2030 (US$ million, AGR%, CAGR%)
Table 108 Global Other Location LiDAR Market by Region, 2020, 2025, 2030 (CAGR %)
Table 109 “V” Shaped Recovery: Global Automotive LiDAR Market for Others Segment, Revenue Forecast 2020-2030 (US$ million, AGR%, CAGR%)
Table 110 “U” Shaped Recovery: Global Automotive LiDAR Market for Others Segment, Revenue Forecast 2020-2030 (US$ million, AGR%, CAGR%)
Table 111 “L” Shaped Recovery: Global Automotive LiDAR Market for Others Segment, Revenue Forecast 2020-2030 (US$ million, AGR%, CAGR%)
Table 112 “W” Shaped Recovery: Global Automotive LiDAR Market for Others Segment, Revenue Forecast 2020-2030 (US$ million, AGR%, CAGR%)
Table 113 Leading National Automotive LiDAR Markets Forecast, 2020-2030 (US$ billion, AGR %, CAGR %)
Table 114 Global Rankings of the Leading National Automotive LiDAR Market 2020, 2025, 2030 by Revenue ($mn)
Table 115 Regional Automotive LiDAR Market Forecast 2020-2030 ($mn, AGR %)
Table 116 “V” Shaped Recovery: Global Automotive LiDAR Market Forecast by Region, 2020-2030 (US$ million, AGR %)
Table 117 “U” Shaped Recovery: Global Automotive LiDAR Market Forecast by Region, 2020-2030 (US$ million, AGR %)
Table 118 “L” Shaped Recovery: Global Automotive LiDAR Market Forecast by Region, 2020-2030 (US$ million, AGR %)
Table 119 “W” Shaped Recovery: Global Automotive LiDAR Market Forecast by Region, 2020-2030 (US$ million, AGR %)
Table 120 US Automotive LiDAR Market Forecast 2020-2030 ($mn, AGR%, CAGR %)
Table 121 “V” Shaped Recovery: US Automotive LiDAR Market Forecast 2020-2030 ($mn, AGR%, CAGR %)
Table 122 “U” Shaped Recovery: US Automotive LiDAR Market Forecast 2020-2030 ($mn, AGR%, CAGR %)
Table 123 “W” Shaped Recovery: US Automotive LiDAR Market Forecast 2020-2030 ($mn, AGR%, CAGR %)
Table 124 “L” Shaped Recovery: US Automotive LiDAR Market Forecast 2020-2030 ($mn, AGR%, CAGR %)
Table 125 Canada Automotive LiDAR Market Forecast 2020-2030 ($mn, AGR%, CAGR %)
Table 126 “V” Shaped Recovery: Canada Automotive LiDAR Market Forecast 2020-2030 ($mn, AGR%, CAGR %)
Table 127 “U” Shaped Recovery: Canada Automotive LiDAR Market Forecast 2020-2030 ($mn, AGR%, CAGR %)
Table 128 “W” Shaped Recovery: Canada Automotive LiDAR Market Forecast 2020-2030 ($mn, AGR%, CAGR %)
Table 129 “L” Shaped Recovery: Canada Automotive LiDAR Market Forecast 2020-2030 ($mn, AGR%, CAGR %)
Table 130 North America Automotive LiDAR Market Forecast, by Technology Submarket, 2020- 2030 (US$ million, AGR%, CAGR%)
Table 131 North America Automotive LiDAR Market by Technology Submarket, 2020, 2025, 2030 (CAGR %)
Table 132 “V” Shaped Recovery: North America Automotive LiDAR Market Forecast by Technology Type, 2020-2030 (US$ million, AGR %)
Table 133 “U” SHAPED RECOVERY: NORTH AMERICA AUTOMOTIVE LIDAR MARKET FORECAST BY TECHNOLOGY TYPE, 2020-2030 (US$ MILLION, AGR %)
Table 134 “L” SHAPED RECOVERY: NORTH AMERICA AUTOMOTIVE LIDAR MARKET FORECAST BY TECHNOLOGY TYPE, 2020-2030 (US$ MILLION, AGR %)
Table 135 “W” SHAPED RECOVERY: NORTH AMERICA AUTOMOTIVE LIDAR MARKET FORECAST BY TECHNOLOGY TYPE, 2020-2030 (US$ MILLION, AGR %)
Table 136 North America Automotive LiDAR Market Forecast, by Image Submarket, 2020- 2030 (US$ million, AGR%, CAGR%)
Table 137 North America Automotive LiDAR Market by Image Submarket, 2020, 2025, 2030 (CAGR %)
Table 138 “V” SHAPED RECOVERY: NORTH AMERICA AUTOMOTIVE LIDAR MARKET FORECAST BY IMAGE TYPE, 2020-2030 (US$ MILLION, AGR %)
Table 139 “U” SHAPED RECOVERY: NORTH AMERICA AUTOMOTIVE LIDAR MARKET FORECAST BY IMAGE TYPE, 2020-2030 (US$ MILLION, AGR %)
Table 140 “L” SHAPED RECOVERY: NORTH AMERICA AUTOMOTIVE LIDAR MARKET FORECAST BY IMAGE TYPE, 2020-2030 (US$ MILLION, AGR %)
Table 141 “W” SHAPED RECOVERY: NORTH AMERICA AUTOMOTIVE LIDAR MARKET FORECAST BY IMAGE TYPE, 2020-2030 (US$ MILLION, AGR %)
Table 142 North America Automotive LiDAR Market Forecast, by Application Submarket, 2020- 2030 (US$ million, AGR%, CAGR%)
Table 143 North America Automotive LiDAR Market by Application Submarket, 2020, 2025, 2030 (CAGR %)
Table 144 “V” Shaped Recovery: North America Automotive LiDAR Market Forecast by Application, 2020-2030 (US$ million, AGR %)
Table 145 “U” Shaped Recovery: North America Automotive LiDAR Market Forecast by Application, 2020-2030 (US$ million, AGR %)
Table 146 “L” Shaped Recovery: North America Automotive LiDAR Market Forecast by Application, 2020-2030 (US$ million, AGR %)
Table 147 “W” Shaped Recovery: North America Automotive LiDAR Market Forecast by Application, 2020-2030 (US$ million, AGR %)
Table 148 North America Automotive LiDAR Market Forecast, by Placement Submarket, 2020- 2030 (US$ million, AGR%, CAGR%)
Table 149 North America Automotive LiDAR Market by Placement Submarket, 2020, 2025, 2030 (CAGR %)
Table 150 “V” Shaped Recovery: North America Automotive LiDAR Market Forecast by Placement Type, 2020-2030 (US$ million, AGR %)
Table 151 “U” Shaped Recovery: North America Automotive LiDAR Market Forecast by Placement Type, 2020-2030 (US$ million, AGR %)
Table 152 “L” Shaped Recovery: North America Automotive LiDAR Market Forecast by Placement Type, 2020-2030 (US$ million, AGR %)
Table 153 “W” Shaped Recovery: North America Automotive LiDAR Market Forecast by Placement Type, 2020-2030 (US$ million, AGR %)
Table 154 North America Automotive LiDAR Market Forecast, by Vehicle Type, 2020- 2030 (US$ million, AGR%, CAGR%)
Table 155 North America Automotive LiDAR Market by Vehicle Type, 2020, 2025, 2030 (CAGR %)
Table 156 “V” Shaped Recovery: North America Automotive LiDAR Market Forecast by Vehicle Type, 2020-2030 (US$ million, AGR %)
Table 157 “U” Shaped Recovery: North America Automotive LiDAR Market Forecast by Vehicle Type, 2020-2030 (US$ million, AGR %)
Table 158 “L” Shaped Recovery: North America Automotive LiDAR Market Forecast by Vehicle Type, 2020-2030 (US$ million, AGR %)
Table 159 “W” Shaped Recovery: North America Automotive LiDAR Market Forecast by Vehicle Type, 2020-2030 (US$ million, AGR %)
Table 160 Germany Automotive LiDAR Market Forecast 2020-2030 ($mn, AGR%, CAGR %)
Table 161 “V” Shaped Recovery: Germany Automotive LiDAR Market Forecast 2020-2030 ($mn, AGR%, CAGR %)
Table 162 “U” Shaped Recovery: Germany Automotive LiDAR Market Forecast 2020-2030 ($mn, AGR%, CAGR %)
Table 163 “W” Shaped Recovery: Germany Automotive LiDAR Market Forecast 2020-2030 ($mn, AGR%, CAGR %)
Table 164 “L” Shaped Recovery: Germany Automotive LiDAR Market Forecast 2020-2030 ($mn, AGR%, CAGR %)
Table 165 UK Automotive LiDAR Market Forecast 2020-2030 ($mn, AGR%, CAGR %)
Table 166 “V” Shaped Recovery: UK Automotive LiDAR Market Forecast 2020-2030 ($mn, AGR%, CAGR %)
Table 167 “U” Shaped Recovery: UK Automotive LiDAR Market Forecast 2020-2030 ($mn, AGR%, CAGR %)
Table 168 “W” Shaped Recovery: UK Automotive LiDAR Market Forecast 2020-2030 ($mn, AGR%, CAGR %)
Table 169 “L” Shaped Recovery: UK Automotive LiDAR Market Forecast 2020-2030 ($mn, AGR%, CAGR %)
Table 170 France Automotive LiDAR Market Forecast 2020-2030 ($mn, AGR%, CAGR %)
Table 171 “V” Shaped Recovery: France Automotive LiDAR Market Forecast 2020-2030 ($mn, AGR%, CAGR %)
Table 172 “U” Shaped Recovery: France Automotive LiDAR Market Forecast 2020-2030 ($mn, AGR%, CAGR %)
Table 173 “W” Shaped Recovery: France Automotive LiDAR Market Forecast 2020-2030 ($mn, AGR%, CAGR %)
Table 174 “L” Shaped Recovery: France Automotive LiDAR Market Forecast 2020-2030 ($mn, AGR%, CAGR %)
Table 175 Italy Automotive LiDAR Market Forecast 2020-2030 ($mn, AGR%, CAGR %)
Table 176 “V” Shaped Recovery: Italy Automotive LiDAR Market Forecast 2020-2030 ($mn, AGR%, CAGR %)
Table 177 “U” Shaped Recovery: Italy Automotive LiDAR Market Forecast 2020-2030 ($mn, AGR%, CAGR %)
Table 178 “W” Shaped Recovery: Italy Automotive LiDAR Market Forecast 2020-2030 ($mn, AGR%, CAGR %)
Table 179 “L” Shaped Recovery: Italy Automotive LiDAR Market Forecast 2020-2030 ($mn, AGR%, CAGR %)
Table 180 Russia Automotive LiDAR Market Forecast 2020-2030 ($mn, AGR%, CAGR %)
Table 181 “V” Shaped Recovery: Russia Automotive LiDAR Market Forecast 2020-2030 ($mn, AGR%, CAGR %)
Table 182 “U” Shaped Recovery: Russia Automotive LiDAR Market Forecast 2020-2030 ($mn, AGR%, CAGR %)
Table 183 “W” Shaped Recovery: Russia Automotive LiDAR Market Forecast 2020-2030 ($mn, AGR%, CAGR %)
Table 184 “L” Shaped Recovery: Russia Automotive LiDAR Market Forecast 2020-2030 ($mn, AGR%, CAGR %)
Table 185 ROE Automotive LiDAR Market Forecast 2020-2030 ($mn, AGR%, CAGR %)
Table 186 “V” Shaped Recovery: Rest of Europe Automotive LiDAR Market Forecast 2020-2030 ($mn, AGR%, CAGR %)
Table 187 “U” Shaped Recovery: Rest of Europe Automotive LiDAR Market Forecast 2020-2030 ($mn, AGR%, CAGR %)
Table 188 “W” Shaped Recovery: Rest of Europe Automotive LiDAR Market Forecast 2020-2030 ($mn, AGR%, CAGR %)
Table 189 “L” Shaped Recovery: Rest of Europe Automotive LiDAR Market Forecast 2020-2030 ($mn, AGR%, CAGR %)
Table 190 Europe Automotive LiDAR Market Forecast, by Technology Submarket, 2020- 2030 (US$ million, AGR%, CAGR%)
Table 191 Europe Automotive LiDAR Market by Technology Submarket, 2020, 2025, 2030 (CAGR %)
Table 192 “V” Shaped Recovery: Europe Automotive LiDAR Market Forecast by Technology Type, 2020-2030 (US$ million, AGR %)
Table 193 “U” SHAPED RECOVERY: EUROPE AUTOMOTIVE LIDAR MARKET FORECAST BY TECHNOLOGY TYPE, 2020-2030 (US$ MILLION, AGR %)
Table 194 “L” SHAPED RECOVERY: EUROPE AUTOMOTIVE LIDAR MARKET FORECAST BY TECHNOLOGY TYPE, 2020-2030 (US$ MILLION, AGR %)
Table 195 “W” SHAPED RECOVERY: EUROPE AUTOMOTIVE LIDAR MARKET FORECAST BY TECHNOLOGY TYPE, 2020-2030 (US$ MILLION, AGR %)
Table 196 Europe Automotive LiDAR Market Forecast, by Image Submarket, 2020- 2030 (US$ million, AGR%, CAGR%)
Table 197 Europe Automotive LiDAR Market by Image Submarket, 2020, 2025, 2030 (CAGR %)
Table 198 “V” SHAPED RECOVERY: EUROPE AUTOMOTIVE LIDAR MARKET FORECAST BY IMAGE TYPE, 2020-2030 (US$ MILLION, AGR %)
Table 199 “U” SHAPED RECOVERY: EUROPE AUTOMOTIVE LIDAR MARKET FORECAST BY IMAGE TYPE, 2020-2030 (US$ MILLION, AGR %)
Table 200 “L” SHAPED RECOVERY: EUROPE AUTOMOTIVE LIDAR MARKET FORECAST BY IMAGE TYPE, 2020-2030 (US$ MILLION, AGR %)
Table 201 “W” SHAPED RECOVERY: EUROPE AUTOMOTIVE LIDAR MARKET FORECAST BY IMAGE TYPE, 2020-2030 (US$ MILLION, AGR %)
Table 202 Europe Automotive LiDAR Market Forecast, by Application Submarket, 2020- 2030 (US$ million, AGR%, CAGR%)
Table 203 Europe Automotive LiDAR Market by Application Submarket, 2020, 2025, 2030 (CAGR %)
Table 204 “V” Shaped Recovery: Europe Automotive LiDAR Market Forecast by Application, 2020-2030 (US$ million, AGR %)
Table 205 “U” Shaped Recovery: Europe Automotive LiDAR Market Forecast by Application, 2020-2030 (US$ million, AGR %)
Table 206 “L” Shaped Recovery: Europe Automotive LiDAR Market Forecast by Application, 2020-2030 (US$ million, AGR %)
Table 207 “W” Shaped Recovery: Europe Automotive LiDAR Market Forecast by Application, 2020-2030 (US$ million, AGR %)
Table 208 Europe Automotive LiDAR Market Forecast, by Placement Submarket, 2020- 2030 (US$ million, AGR%, CAGR%)
Table 209 Europe Automotive LiDAR Market by Placement Submarket, 2020, 2025, 2030 (CAGR %)
Table 210 “V” Shaped Recovery: Europe Automotive LiDAR Market Forecast by Placement Type, 2020-2030 (US$ million, AGR %)
Table 211 “U” Shaped Recovery: Europe Automotive LiDAR Market Forecast by Placement Type, 2020-2030 (US$ million, AGR %)
Table 212 “L” Shaped Recovery: Europe Automotive LiDAR Market Forecast by Placement Type, 2020-2030 (US$ million, AGR %)
Table 213 “W” Shaped Recovery: Europe Automotive LiDAR Market Forecast by Placement Type, 2020-2030 (US$ million, AGR %)
Table 214 Europe Automotive LiDAR Market Forecast, by Vehicle Type, 2020- 2030 (US$ million, AGR%, CAGR%)
Table 215 Europe Automotive LiDAR Market by Vehicle Type, 2020, 2025, 2030 (CAGR %)
Table 216 “V” Shaped Recovery: Europe Automotive LiDAR Market Forecast by Vehicle Type, 2020-2030 (US$ million, AGR %)
Table 217 “U” Shaped Recovery: Europe Automotive LiDAR Market Forecast by Vehicle Type, 2020-2030 (US$ million, AGR %)
Table 218 “L” Shaped Recovery: Europe Automotive LiDAR Market Forecast by Vehicle Type, 2020-2030 (US$ million, AGR %)
Table 219 “W” Shaped Recovery: Europe Automotive LiDAR Market Forecast by Vehicle Type, 2020-2030 (US$ million, AGR %)
Table 220 China Automotive LiDAR Market Forecast 2020-2030 ($mn, AGR%, CAGR %)
Table 221 “V” Shaped Recovery: China Automotive LiDAR Market Forecast 2020-2030 ($mn, AGR%, CAGR %)
Table 222 “U” Shaped Recovery: China Automotive LiDAR Market Forecast 2020-2030 ($mn, AGR%, CAGR %)
Table 223 “W” Shaped Recovery: China Automotive LiDAR Market Forecast 2020-2030 ($mn, AGR%, CAGR %)
Table 224 “L” Shaped Recovery: China Automotive LiDAR Market Forecast 2020-2030 ($mn, AGR%, CAGR %)
Table 225 Japan Automotive LiDAR Market Forecast 2020-2030 ($mn, AGR%, CAGR %)
Table 226 “V” Shaped Recovery: Japan Automotive LiDAR Market Forecast 2020-2030 ($mn, AGR%, CAGR %)
Table 227 “U” Shaped Recovery: Japan Automotive LiDAR Market Forecast 2020-2030 ($mn, AGR%, CAGR %)
Table 228 “W” Shaped Recovery: Japan Automotive LiDAR Market Forecast 2020-2030 ($mn, AGR%, CAGR %)
Table 229 “L” Shaped Recovery: Japan Automotive LiDAR Market Forecast 2020-2030 ($mn, AGR%, CAGR %)
Table 230 India Automotive LiDAR Market Forecast 2020-2030 ($mn, AGR%, CAGR %)
Table 231 “V” Shaped Recovery: India Automotive LiDAR Market Forecast 2020-2030 ($mn, AGR%, CAGR %)
Table 232 “U” Shaped Recovery: India Automotive LiDAR Market Forecast 2020-2030 ($mn, AGR%, CAGR %)
Table 233 “W” Shaped Recovery: India Automotive LiDAR Market Forecast 2020-2030 ($mn, AGR%, CAGR %)
Table 234 “L” Shaped Recovery: India Automotive LiDAR Market Forecast 2020-2030 ($mn, AGR%, CAGR %)
Table 235 South Korea Automotive LiDAR Market Forecast 2020-2030 ($mn, AGR%, CAGR %)
Table 236 “V” Shaped Recovery: South Korea Automotive LiDAR Market Forecast 2020-2030 ($mn, AGR%, CAGR %)
Table 237 “U” Shaped Recovery: South Korea Automotive LiDAR Market Forecast 2020-2030 ($mn, AGR%, CAGR %)
Table 238 “W” Shaped Recovery: South Korea Automotive LiDAR Market Forecast 2020-2030 ($mn, AGR%, CAGR %)
Table 239 “L” Shaped Recovery: South Korea Automotive LiDAR Market Forecast 2020-2030 ($mn, AGR%, CAGR %)
Table 240 Rest of APAC Automotive LiDAR Market Forecast 2020-2030 ($mn, AGR%, CAGR %)
Table 241 “V” Shaped Recovery: Rest of APAC Automotive LiDAR Market Forecast 2020-2030 ($mn, AGR%, CAGR %)
Table 242 “U” Shaped Recovery: Rest of APAC Automotive LiDAR Market Forecast 2020-2030 ($mn, AGR%, CAGR %)
Table 243 “W” Shaped Recovery: Rest of APAC Automotive LiDAR Market Forecast 2020-2030 ($mn, AGR%, CAGR %)
Table 244 “L” Shaped Recovery: Rest of APAC Automotive LiDAR Market Forecast 2020-2030 ($mn, AGR%, CAGR %)
Table 245 APAC Automotive LiDAR Market Forecast, by Technology Submarket, 2020- 2030 (US$ million, AGR%, CAGR%)
Table 246 APAC Automotive LiDAR Market by Technology Submarket, 2020, 2025, 2030 (CAGR %)
Table 247 “V” Shaped Recovery: APAC Automotive LiDAR Market Forecast by Technology Type, 2020-2030 (US$ million, AGR %)
Table 248 “U” SHAPED RECOVERY: APAC AUTOMOTIVE LIDAR MARKET FORECAST BY TECHNOLOGY TYPE, 2020-2030 (US$ MILLION, AGR %)
Table 249 “L” SHAPED RECOVERY: APAC AUTOMOTIVE LIDAR MARKET FORECAST BY TECHNOLOGY TYPE, 2020-2030 (US$ MILLION, AGR %)
Table 250 “W” SHAPED RECOVERY: APAC AUTOMOTIVE LIDAR MARKET FORECAST BY TECHNOLOGY TYPE, 2020-2030 (US$ MILLION, AGR %)
Table 251 APAC Automotive LiDAR Market Forecast, by Image Submarket, 2020- 2030 (US$ million, AGR%, CAGR%)
Table 252 APAC Automotive LiDAR Market by Image Submarket, 2020, 2025, 2030 (CAGR %)
Table 253 “V” SHAPED RECOVERY: APAC AUTOMOTIVE LIDAR MARKET FORECAST BY IMAGE TYPE, 2020-2030 (US$ MILLION, AGR %)
Table 254 “U” SHAPED RECOVERY: APAC AUTOMOTIVE LIDAR MARKET FORECAST BY IMAGE TYPE, 2020-2030 (US$ MILLION, AGR %)
Table 255 “L” SHAPED RECOVERY: APAC AUTOMOTIVE LIDAR MARKET FORECAST BY IMAGE TYPE, 2020-2030 (US$ MILLION, AGR %)
Table 256 “W” SHAPED RECOVERY: APAC AUTOMOTIVE LIDAR MARKET FORECAST BY IMAGE TYPE, 2020-2030 (US$ MILLION, AGR %)
Table 257 APAC Automotive LiDAR Market Forecast, by Application Submarket, 2020- 2030 (US$ million, AGR%, CAGR%)
Table 258 APAC Automotive LiDAR Market by Application Submarket, 2020, 2025, 2030 (CAGR %)
Table 259 “V” Shaped Recovery: APAC Automotive LiDAR Market Forecast by Application, 2020-2030 (US$ million, AGR %)
Table 260 “U” Shaped Recovery: APAC Automotive LiDAR Market Forecast by Application, 2020-2030 (US$ million, AGR %)
Table 261 “L” Shaped Recovery: APAC Automotive LiDAR Market Forecast by Application, 2020-2030 (US$ million, AGR %)
Table 262 “W” Shaped Recovery: APAC Automotive LiDAR Market Forecast by Application, 2020-2030 (US$ million, AGR %)
Table 263 APAC Automotive LiDAR Market Forecast, by Placement Submarket, 2020- 2030 (US$ million, AGR%, CAGR%)
Table 264 APAC Automotive LiDAR Market by Placement Submarket, 2020, 2025, 2030 (CAGR %)
Table 265 “V” Shaped Recovery: APAC Automotive LiDAR Market Forecast by Placement Type, 2020-2030 (US$ million, AGR %)
Table 266 “U” Shaped Recovery: APAC Automotive LiDAR Market Forecast by Placement Type, 2020-2030 (US$ million, AGR %)
Table 267 “L” Shaped Recovery: APAC Automotive LiDAR Market Forecast by Placement Type, 2020-2030 (US$ million, AGR %)
Table 268 “W” Shaped Recovery: APAC Automotive LiDAR Market Forecast by Placement Type, 2020-2030 (US$ million, AGR %)
Table 269 APAC Automotive LiDAR Market Forecast, by Vehicle Type, 2020- 2030 (US$ million, AGR%, CAGR%)
Table 270 APAC Automotive LiDAR Market by Vehicle Type, 2020, 2025, 2030 (CAGR %)
Table 271 “V” Shaped Recovery: APAC Automotive LiDAR Market Forecast by Vehicle Type, 2020-2030 (US$ million, AGR %)
Table 272 “U” Shaped Recovery: APAC Automotive LiDAR Market Forecast by Vehicle Type, 2020-2030 (US$ million, AGR %)
Table 273 “L” Shaped Recovery: APAC Automotive LiDAR Market Forecast by Vehicle Type, 2020-2030 (US$ million, AGR %)
Table 274 “W” Shaped Recovery: APAC Automotive LiDAR Market Forecast by Vehicle Type, 2020-2030 (US$ million, AGR %)
Table 275 Brazil Automotive LiDAR Market Forecast 2020-2030 ($mn, AGR%, CAGR %)
Table 276 “V” Shaped Recovery: Brazil Automotive LiDAR Market Forecast 2020-2030 ($mn, AGR%, CAGR %)
Table 277 “U” Shaped Recovery: Brazil Automotive LiDAR Market Forecast 2020-2030 ($mn, AGR%, CAGR %)
Table 278 “W” Shaped Recovery: Brazil Automotive LiDAR Market Forecast 2020-2030 ($mn, AGR%, CAGR %)
Table 279 “L” Shaped Recovery: Brazil Automotive LiDAR Market Forecast 2020-2030 ($mn, AGR%, CAGR %)
Table 280 Saudi Arabia Automotive LiDAR Market Forecast 2020-2030 ($mn, AGR%, CAGR %)
Table 281 “V” Shaped Recovery: Saudi Arabia Automotive LiDAR Market Forecast 2020-2030 ($mn, AGR%, CAGR %)
Table 282 “U” Shaped Recovery: Saudi Arabia Automotive LiDAR Market Forecast 2020-2030 ($mn, AGR%, CAGR %)
Table 283 “W” Shaped Recovery: Saudi Arabia Automotive LiDAR Market Forecast 2020-2030 ($mn, AGR%, CAGR %)
Table 284 “L” Shaped Recovery: Saudi Arabia Automotive LiDAR Market Forecast 2020-2030 ($mn, AGR%, CAGR %)
Table 285 South Africa Automotive LiDAR Market Forecast 2020-2030 ($mn, AGR%, CAGR %)
Table 286 “V” Shaped Recovery: South Africa Automotive LiDAR Market Forecast 2020-2030 ($mn, AGR%, CAGR %)
Table 287 “U” Shaped Recovery: South Africa Automotive LiDAR Market Forecast 2020-2030 ($mn, AGR%, CAGR %)
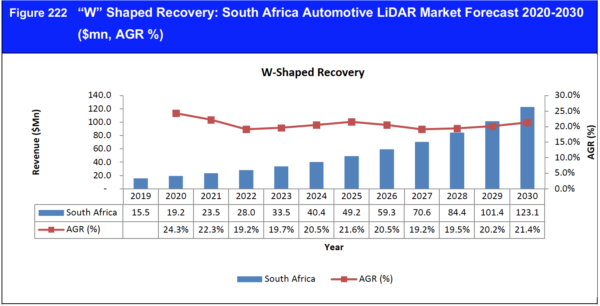
Table 288 “W” Shaped Recovery: South Africa Automotive LiDAR Market Forecast 2020-2030 ($mn, AGR%, CAGR %)
Table 289 “L” Shaped Recovery: South Africa Automotive LiDAR Market Forecast 2020-2030 ($mn, AGR%, CAGR %)
Table 290 Rest of LAMEA Automotive LiDAR Market Forecast 2020-2030 ($mn, AGR%, CAGR %)
Table 291 “V” Shaped Recovery: Rest of LAMEA Automotive LiDAR Market Forecast 2020-2030 ($mn, AGR%, CAGR %)
Table 292 “U” Shaped Recovery: Rest of LAMEA Automotive LiDAR Market Forecast 2020-2030 ($mn, AGR%, CAGR %)
Table 293 “W” Shaped Recovery: Rest of LAMEA Automotive LiDAR Market Forecast 2020-2030 ($mn, AGR%, CAGR %)
Table 294 “L” Shaped Recovery: Rest of LAMEA Automotive LiDAR Market Forecast 2020-2030 ($mn, AGR%, CAGR %)
Table 295 LAMEA Automotive LiDAR Market Forecast, by Technology Submarket, 2020- 2030 (US$ million, AGR%, CAGR%)
Table 296 LAMEA Automotive LiDAR Market by Technology Submarket, 2020, 2025, 2030 (CAGR %)
Table 297 “V” Shaped Recovery: LAMEA Automotive LiDAR Market Forecast by Technology Type, 2020-2030 (US$ million, AGR %)
Table 298 “U” SHAPED RECOVERY: LAMEA AUTOMOTIVE LIDAR MARKET FORECAST BY TECHNOLOGY TYPE, 2020-2030 (US$ MILLION, AGR %)
Table 299 “L” SHAPED RECOVERY: LAMEA AUTOMOTIVE LIDAR MARKET FORECAST BY TECHNOLOGY TYPE, 2020-2030 (US$ MILLION, AGR %)
Table 300 “W” SHAPED RECOVERY: LAMEA AUTOMOTIVE LIDAR MARKET FORECAST BY TECHNOLOGY TYPE, 2020-2030 (US$ MILLION, AGR %)
Table 301 LAMEA Automotive LiDAR Market Forecast, by Image Submarket, 2020- 2030 (US$ million, AGR%, CAGR%)
Table 302 LAMEA Automotive LiDAR Market by Image Submarket, 2020, 2025, 2030 (CAGR %)
Table 303 “V” SHAPED RECOVERY: LAMEA AUTOMOTIVE LIDAR MARKET FORECAST BY IMAGE TYPE, 2020-2030 (US$ MILLION, AGR %)
Table 304 “U” SHAPED RECOVERY: LAMEA AUTOMOTIVE LIDAR MARKET FORECAST BY IMAGE TYPE, 2020-2030 (US$ MILLION, AGR %)
Table 305 “L” SHAPED RECOVERY: LAMEA AUTOMOTIVE LIDAR MARKET FORECAST BY IMAGE TYPE, 2020-2030 (US$ MILLION, AGR %)
Table 306 “W” SHAPED RECOVERY: LAMEA AUTOMOTIVE LIDAR MARKET FORECAST BY IMAGE TYPE, 2020-2030 (US$ MILLION, AGR %)
Table 307 LAMEA Automotive LiDAR Market Forecast, by Application Submarket, 2020- 2030 (US$ million, AGR%, CAGR%)
Table 308 LAMEA Automotive LiDAR Market by Application Submarket, 2020, 2025, 2030 (CAGR %)
Table 309 “V” Shaped Recovery: LAMEA Automotive LiDAR Market Forecast by Application, 2020-2030 (US$ million, AGR %)
Table 310 “U” Shaped Recovery: LAMEA Automotive LiDAR Market Forecast by Application, 2020-2030 (US$ million, AGR %)
Table 311 “L” Shaped Recovery: LAMEA Automotive LiDAR Market Forecast by Application, 2020-2030 (US$ million, AGR %)
Table 312 “W” Shaped Recovery: LAMEA Automotive LiDAR Market Forecast by Application, 2020-2030 (US$ million, AGR %)
Table 313 LAMEA Automotive LiDAR Market Forecast, by Placement Submarket, 2020- 2030 (US$ million, AGR%, CAGR%)
Table 314 LAMEA Automotive LiDAR Market by Placement Submarket, 2020, 2025, 2030 (CAGR %)
Table 315 “V” Shaped Recovery: LAMEA Automotive LiDAR Market Forecast by Placement Type, 2020-2030 (US$ million, AGR %)
Table 316 “U” Shaped Recovery: LAMEA Automotive LiDAR Market Forecast by Placement Type, 2020-2030 (US$ million, AGR %)
Table 317 “L” Shaped Recovery: LAMEA Automotive LiDAR Market Forecast by Placement Type, 2020-2030 (US$ million, AGR %)
Table 318 “W” Shaped Recovery: LAMEA Automotive LiDAR Market Forecast by Placement Type, 2020-2030 (US$ million, AGR %)
Table 319 LAMEA Automotive LiDAR Market Forecast, by Vehicle Type, 2020- 2030 (US$ million, AGR%, CAGR%)
Table 320 LAMEA Automotive LiDAR Market by Vehicle Type, 2020, 2025, 2030 (CAGR %)
Table 321 “V” Shaped Recovery: LAMEA Automotive LiDAR Market Forecast by Vehicle Type, 2020-2030 (US$ million, AGR %)
Table 322 “U” Shaped Recovery: LAMEA Automotive LiDAR Market Forecast by Vehicle Type, 2020-2030 (US$ million, AGR %)
Table 323 “L” Shaped Recovery: LAMEA Automotive LiDAR Market Forecast by Vehicle Type, 2020-2030 (US$ million, AGR %)
Table 324 “W” Shaped Recovery: LAMEA Automotive LiDAR Market Forecast by Vehicle Type, 2020-2030 (US$ million, AGR %)
Table 325 Continental AG: Key Details 2020 (CEO, Headquarter, Founded, No. of Employees, Company Type, Website, Business Segment)
Table 326 Continental AG: Products
Table 327 Continental AG: Recent Developments
Table 328 Aptiv: Key Details 2020 (CEO, Headquarter, Founded, No. of Employees, Company Type, Website, Business Segment)
Table 329 Aptiv: Products
Table 330 Aptiv: Recent Developments
Table 331 Panasonic: Key Details 2020 (CEO, Headquarter, Founded, No. of Employees, Company Type, Website, Business Segment)
Table 332 Panasonic: Products
Table 333 Panasonic: Recent Developments
Table 334 Valeo S.A. : Key Details 2020 (CEO, Headquarter, Founded, No. of Employees, Company Type, Website, Business Segment)
Table 335 Valeo S.A.: Products
Table 336 Valeo S.A.: Recent Developments
Table 337 Bosch : Key Details 2020 (CEO, Headquarter, Founded, No. of Employees, Company Type, Website, Business Segment)
Table 338 Bosch: Products
Table 339 Bosch.: Recent Developments
Table 340 LeddarTech : Key Details 2020 (CEO, Headquarter, Founded, No. of Employees, Company Type, Website, Business Segment)
Table 341 LeddarTech: Products
Table 342 LeddarTech.: Recent Developments
Table 343 AEye: Key Details 2020 (CEO, Headquarter, Founded, No. of Employees, Company Type, Website, Business Segment)
Table 344 AEye: Products
Table 345 AEye: Recent Developments
Table 346 Velodyne LIDAR : Key Details 2020 (CEO, Headquarter, Founded, No. of Employees, Company Type, Website, Business Segment)
Table 347 Velodyne LIDAR: Products
Table 348 Velodyne LIDAR: Recent Developments
Table 349 Luminar Technologies: Key Details 2020 (CEO, Headquarter, Founded, No. of Employees, Company Type, Website, Business Segment)
Table 350 Luminar Technologies: Products
Table 351 Luminar Technologies: Recent Developments (Date, Development, Details)
Table 352 Quanergy Systems: Key Details 2020 (CEO, Headquarter, Founded, No. of Employees, Company Type, Website, Business Segment)
Table 353 Quanergy Systems: Products/Services
Table 354 Quanergy Systems: Recent Developments (Date, Development, Details)
Table 355 Infineon Technologies AG: Key Details 2020 (CEO, Headquarter, Founded, No. of Employees, Company Type, Website, Business Segment)
Table 356 Infineon Technologies: Products
Table 357 Infineon Technologies: Recent Developments
Table 358 First Sensor: Key Details 2020 (CEO, Headquarter, Founded, No. of Employees, Company Type, Website, Business Segment)
Table 359 First Sensor: Products
Table 360 First Sensor: Recent Developments
Table 361 Texas Instruments: Key Details 2020 (CEO, Headquarter, Founded, No. of Employees, Company Type, Website, Business Segment)
Table 362 Texas Instruments: Products
Table 363 Texas Instruments: Recent Developments
List of Figures
Figure 1 Journey to Driverless Cars
Figure 2 Factors Impacting Automotive LiDAR adoption
Figure 3 Market Share Analysis, 2019: Automotive LiDAR Market
Figure 4 Porter’s Five Forces Analysis
Figure 5 Value chain analysis
Figure 6 Global Automotive LiDAR Market Dynamics
Figure 7 Global Automotive LiDAR Market Forecast, COVID V shaped Scenario 2020-2030 (US$ million, AGR %)
Figure 8 Global Automotive LiDAR Market Forecast, COVID U shaped Scenario 2020-2030 (US$ million, AGR %)
Figure 9 Global Automotive LiDAR Market Forecast, COVID L shaped Scenario 2020-2030 (US$ million, AGR %)
Figure 10 Global Automotive LiDAR Market Forecast, COVID W shaped Scenario 2020-2030 (US$ million, AGR %)
Figure 11 Global Automotive LiDAR Market Forecast, 2020-2030 (US$ million, AGR %)
Figure 12 Global Automotive LiDAR Market Forecast, COVID V shaped Scenario 2020-2030 (US$ million, AGR %)
Figure 13 Global Automotive LiDAR Market Forecast, COVID U shaped Scenario 2020-2030 (US$ million, AGR %)
Figure 14 Global Automotive LiDAR Market Forecast, COVID L shaped Scenario 2020-2030 (US$ million, AGR %)
Figure 15 Global Automotive LiDAR Market Forecast, COVID W shaped Scenario 2020-2030 (US$ million, AGR %)
Figure 16 Regional Automotive LiDAR Market Forecast, 2020-2030 (US$ million, AGR %)
Figure 17 Regional Automotive LiDAR Market Forecast, 2020-2030 (US$ million, AGR %)
Figure 18 Global Automotive LiDAR Market Share by Technology, 2020, 2025, 2030 (%)
Figure 19 Global Automotive LiDAR Market Forecast by Technology, 2020-2030 (US$ billion)
Figure 20 “V” Shaped Recovery: Global Automotive LiDAR Market for Mechanical LiDAR Segment, Revenue Forecast 2020-2030 (US$ million, AGR%)
Figure 21 “U” Shaped Recovery: Global Automotive LiDAR Market for Mechanical LiDAR Segment, Revenue Forecast 2020-2030 (US$ million, AGR%)
Figure 22 “L” Shaped Recovery: Global Automotive LiDAR Market for Mechanical LiDAR Segment, Revenue Forecast 2020-2030 (US$ million, AGR%)
Figure 23 “W” Shaped Recovery: Global Automotive LiDAR Market for Mechanical LiDAR Segment, Revenue Forecast 2020-2030 (US$ million, AGR%)
Figure 24 “V” Shaped Recovery: Global Automotive LiDAR Market for Solid-State LiDAR Segment, Revenue Forecast 2020-2030 (US$ million, AGR%)
Figure 25 “U” Shaped Recovery: Global Automotive LiDAR Market for Solid-State LiDAR Segment, Revenue Forecast 2020-2030 (US$ million, AGR%)
Figure 26 “L” Shaped Recovery: Global Automotive LiDAR Market for Solid-State LiDAR Segment, Revenue Forecast 2020-2030 (US$ million, AGR%)
Figure 27 “W” Shaped Recovery: Global Automotive LiDAR Market for Solid-State LiDAR Segment, Revenue Forecast 2020-2030 (US$ million, AGR%)
Figure 28 Global Automotive LiDAR Market Share by Image Type, 2020, 2025, 2030 (%)
Figure 29 Global Automotive LiDAR Market Forecast by Image Type, 2020-2030 (US$ billion)
Figure 30 “V” Shaped Recovery: Global Automotive LiDAR Market for 2D Image LiDAR Segment, Revenue Forecast 2020-2030 (US$ million, AGR%)
Figure 31 “U” Shaped Recovery: Global Automotive LiDAR Market for 2D Image LiDAR Segment, Revenue Forecast 2020-2030 (US$ million, AGR%)
Figure 32 “L” Shaped Recovery: Global Automotive LiDAR Market for 2D Image LiDAR Segment, Revenue Forecast 2020-2030 (US$ million, AGR%)
Figure 33 “W” Shaped Recovery: Global Automotive LiDAR Market for 2D Image LiDAR Segment, Revenue Forecast 2020-2030 (US$ million, AGR%)
Figure 34 “V” Shaped Recovery: Global Automotive LiDAR Market for 3D Image LiDAR Segment, Revenue Forecast 2020-2030 (US$ million, AGR%)
Figure 35 “U” Shaped Recovery: Global Automotive LiDAR Market for 3D Image LiDAR Segment, Revenue Forecast 2020-2030 (US$ million, AGR%)
Figure 36 “L” Shaped Recovery: Global Automotive LiDAR Market for 3D Image LiDAR Segment, Revenue Forecast 2020-2030 (US$ million, AGR%)
Figure 37 “W” Shaped Recovery: Global Automotive LiDAR Market for 3D Image LiDAR Segment, Revenue Forecast 2020-2030 (US$ million, AGR%)
Figure 38 Global Automotive LiDAR Market Share by Application, 2020, 2025, 2030 (%)
Figure 39 Global Automotive LiDAR Market Forecast by Application, 2020-2030 (US$ million)
Figure 40 “V” Shaped Recovery: Global Automotive LiDAR Market for Robo-Taxi Application Segment, Revenue Forecast 2020-2030 (US$ million, AGR%)
Figure 41 “U” Shaped Recovery: Global Automotive LiDAR Market for Robo-Taxi Application Segment, Revenue Forecast 2020-2030 (US$ million, AGR%)
Figure 42 “L” Shaped Recovery: Global Automotive LiDAR Market for Robo-Taxi Application Segment, Revenue Forecast 2020-2030 (US$ million, AGR%)
Figure 43 “W” Shaped Recovery: Global Automotive LiDAR Market for Robo-Taxi Application Segment, Revenue Forecast 2020-2030 (US$ million, AGR%)
Figure 44 “V” Shaped Recovery: Global Automotive LiDAR Market for ADAS Application Segment, Revenue Forecast 2020-2030 (US$ million, AGR%)
Figure 45 “U” Shaped Recovery: Global Automotive LiDAR Market for ADAS Application Segment, Revenue Forecast 2020-2030 (US$ million, AGR%)
Figure 46 “L” Shaped Recovery: Global Automotive LiDAR Market for ADAS Application Segment, Revenue Forecast 2020-2030 (US$ million, AGR%)
Figure 47 “W” Shaped Recovery: Global Automotive LiDAR Market for ADAS Application Segment, Revenue Forecast 2020-2030 (US$ million, AGR%)
Figure 48 “V” Shaped Recovery: Global Automotive LiDAR Market for Autonomous Vehicle Application Segment, Revenue Forecast 2020-2030 (US$ million, AGR%)
Figure 49 “U” Shaped Recovery: Global Automotive LiDAR Market for Autonomous Vehicle Application Segment, Revenue Forecast 2020-2030 (US$ million, AGR%)
Figure 50 “L” Shaped Recovery: Global Automotive LiDAR Market for Autonomous Vehicle Application Segment, Revenue Forecast 2020-2030 (US$ million, AGR%)
Figure 51 “W” Shaped Recovery: Global Automotive LiDAR Market for Autonomous Vehicle Application Segment, Revenue Forecast 2020-2030 (US$ million, AGR%)
Figure 52 Global Automotive LiDAR Market Share by Application, 2020, 2025, 2030 (%)
Figure 53 Global Automotive LiDAR Market Forecast by Vehicle Type, 2020-2030 (US$ million)
Figure 54 “V” Shaped Recovery: Global Automotive LiDAR Market for Passenger car Segment, Revenue Forecast 2020-2030 (US$ million, AGR%)
Figure 55 “U” Shaped Recovery: Global Automotive LiDAR Market for Passenger car Segment, Revenue Forecast 2020-2030 (US$ million, AGR%)
Figure 56 “L” Shaped Recovery: Global Automotive LiDAR Market for Passenger car Segment, Revenue Forecast 2020-2030 (US$ million, AGR%)
Figure 57 “W” Shaped Recovery: Global Automotive LiDAR Market for Passenger car Segment, Revenue Forecast 2020-2030 (US$ million, AGR%)
Figure 58 “V” Shaped Recovery: Global Automotive LiDAR Market for LCV Segment, Revenue Forecast 2020-2030 (US$ million, AGR%)
Figure 59 “U” Shaped Recovery: Global Automotive LiDAR Market for LCV Segment, Revenue Forecast 2020-2030 (US$ million, AGR%)
Figure 60 “L” Shaped Recovery: Global Automotive LiDAR Market for LCV Segment, Revenue Forecast 2020-2030 (US$ million, AGR%)
Figure 61 “W” Shaped Recovery: Global Automotive LiDAR Market for LCV Segment, Revenue Forecast 2020-2030 (US$ million, AGR%)
Figure 62 “V” Shaped Recovery: Global Automotive LiDAR Market for HCV Segment, Revenue Forecast 2020-2030 (US$ million, AGR%)
Figure 63 “U” Shaped Recovery: Global Automotive LiDAR Market for HCV Segment, Revenue Forecast 2020-2030 (US$ million, AGR%)
Figure 64 “L” Shaped Recovery: Global Automotive LiDAR Market for HCV Segment, Revenue Forecast 2020-2030 (US$ million, AGR%)
Figure 65 “W” Shaped Recovery: Global Automotive LiDAR Market for HCV Segment, Revenue Forecast 2020-2030 (US$ million, AGR%)
Figure 66 Global Automotive LiDAR Market Share by Placement Submarket, 2020, 2025, 2030 (%)
Figure 67 Global Automotive LiDAR Market Forecast by Placement Submarket, 2020-2030 (US$ million)
Figure 68 “V” Shaped Recovery: Global Automotive LiDAR Market for Bumper & Grill Segment, Revenue Forecast 2020-2030 (US$ million, AGR%)
Figure 69 “U” Shaped Recovery: Global Automotive LiDAR Market for Bumper & Grill Segment, Revenue Forecast 2020-2030 (US$ million, AGR%)
Figure 70 “L” Shaped Recovery: Global Automotive LiDAR Market for Bumper & Grill Segment, Revenue Forecast 2020-2030 (US$ million, AGR%)
Figure 71 “W” Shaped Recovery: Global Automotive LiDAR Market for Bumper & Grill Segment, Revenue Forecast 2020-2030 (US$ million, AGR%)
Figure 72 “V” Shaped Recovery: Global Automotive LiDAR Market for Headlight and Taillight Segment, Revenue Forecast 2020-2030 (US$ million, AGR%)
Figure 73 “U” Shaped Recovery: Global Automotive LiDAR Market for Headlight and Taillight Segment, Revenue Forecast 2020-2030 (US$ million, AGR%)
Figure 74 “L” Shaped Recovery: Global Automotive LiDAR Market for Headlight and Taillight Segment, Revenue Forecast 2020-2030 (US$ million, AGR%)
Figure 75 “W” Shaped Recovery: Global Automotive LiDAR Market for Headlight and Taillight Segment, Revenue Forecast 2020-2030 (US$ million, AGR%)
Figure 76 “V” Shaped Recovery: Global Automotive LiDAR Market for Roofs and Upper Pillars Segment, Revenue Forecast 2020-2030 (US$ million, AGR%)
Figure 77 “U” Shaped Recovery: Global Automotive LiDAR Market for Roofs and Upper Pillars Segment, Revenue Forecast 2020-2030 (US$ million, AGR%)
Figure 78 “L” Shaped Recovery: Global Automotive LiDAR Market for Roofs and Upper Pillars Segment, Revenue Forecast 2020-2030 (US$ million, AGR%)
Figure 79 “W” Shaped Recovery: Global Automotive LiDAR Market for Roofs and Upper Pillars Segment, Revenue Forecast 2020-2030 (US$ million, AGR%)
Figure 80 “V” Shaped Recovery: Global Automotive LiDAR Market for Others Segment, Revenue Forecast 2020-2030 (US$ million, AGR%)
Figure 81 “U” Shaped Recovery: Global Automotive LiDAR Market for Others Segment, Revenue Forecast 2020-2030 (US$ million, AGR%)
Figure 82 “L” Shaped Recovery: Global Automotive LiDAR Market for Others Segment, Revenue Forecast 2020-2030 (US$ million, AGR%)
Figure 83 “W” Shaped Recovery: Global Automotive LiDAR Market for Others Segment, Revenue Forecast 2020-2030 (US$ million, AGR%)
Figure 84 Regional Automotive LiDAR Market Forecast, 2020-2030 (US$ million, AGR %)
Figure 85 US Automotive LiDAR Market Forecast 2020-2030 ($mn, AGR %)
Figure 86 “V” Shaped Recovery: US Automotive LiDAR Market Forecast 2020-2030 ($mn, AGR %)
Figure 87 “U” Shaped Recovery: US Automotive LiDAR Market Forecast 2020-2030 ($mn, AGR %)
Figure 88 “W” Shaped Recovery: US Automotive LiDAR Market Forecast 2020-2030 ($mn, AGR %)
Figure 89 “L” Shaped Recovery: US Automotive LiDAR Market Forecast 2020-2030 ($mn, AGR %)
Figure 90 Canada Automotive LiDAR Market Forecast, 2020-2030 (US$ million, AGR %)
Figure 91 “V” Shaped Recovery: Canada Automotive LiDAR Market Forecast 2020-2030 ($mn, AGR %)
Figure 92 “U” Shaped Recovery: Canada Automotive LiDAR Market Forecast 2020-2030 ($mn, AGR %)
Figure 93 “W” Shaped Recovery: Canada Automotive LiDAR Market Forecast 2020-2030 ($mn, AGR %)
Figure 94 “L” Shaped Recovery: Canada Automotive LiDAR Market Forecast 2020-2030 ($mn, AGR %)
Figure 95 North America Automotive LiDAR Market by Technology Revenue Forecast, V Shaped Recovery
Figure 96 North America Automotive LiDAR Market by Technology Revenue Forecast, U Shaped Recovery
Figure 97 North America Automotive LiDAR Market by Technology Revenue Forecast, L Shaped Recovery
Figure 98 North America Automotive LiDAR Market by Technology Revenue Forecast, W Shaped Recovery
Figure 99 North America Automotive LiDAR Market by Image Revenue Forecast, V Shaped Recovery
Figure 100 North America Automotive LiDAR Market by Image Revenue Forecast, U Shaped Recovery
Figure 101 North America Automotive LiDAR Market by Image Revenue Forecast, L Shaped Recovery
Figure 102 North America Automotive LiDAR Market by Image Revenue Forecast, W Shaped Recovery
Figure 103 North America Automotive LiDAR Market by Application Revenue Forecast, V Shaped Recovery
Figure 104 North America Automotive LiDAR Market by Application Revenue Forecast, U Shaped Recovery
Figure 105 North America Automotive LiDAR Market by Application Revenue Forecast, L Shaped Recovery
Figure 106 North America Automotive LiDAR Market by Application Revenue Forecast, W Shaped Recovery
Figure 107 North America Automotive LiDAR Market by Placement Revenue Forecast, V Shaped Recovery
Figure 108 North America Automotive LiDAR Market by Placement Revenue Forecast, U Shaped Recovery
Figure 109 North America Automotive LiDAR Market by Placement Revenue Forecast, L Shaped Recovery
Figure 110 North America Automotive LiDAR Market by Placement Revenue Forecast, W Shaped Recovery
Figure 111 North America Automotive LiDAR Market by Vehicle Type Revenue Forecast, V Shaped Recovery
Figure 112 North America Automotive LiDAR Market by Vehicle Type Revenue Forecast, U Shaped Recovery
Figure 113 North America Automotive LiDAR Market by Vehicle Type Revenue Forecast, L Shaped Recovery
Figure 114 North America Automotive LiDAR Market by Vehicle Type Revenue Forecast, W Shaped Recovery
Figure 115 Germany Automotive LiDAR Market Forecast 2020-2030 ($bn, AGR %)
Figure 116 “V” Shaped Recovery: Germany Automotive LiDAR Market Forecast 2020-2030 ($mn, AGR %)
Figure 117 “U” Shaped Recovery: Germany Automotive LiDAR Market Forecast 2020-2030 ($mn, AGR %)
Figure 118 “W” Shaped Recovery: Germany Automotive LiDAR Market Forecast 2020-2030 ($mn, AGR %)
Figure 119 “L” Shaped Recovery: Germany Automotive LiDAR Market Forecast 2020-2030 ($mn, AGR %)
Figure 120 UK Automotive LiDAR Market Forecast, 2020-2030 (US$ million, AGR %)
Figure 121 “V” Shaped Recovery: UK Automotive LiDAR Market Forecast 2020-2030 ($mn, AGR %)
Figure 122 “U” Shaped Recovery: UK Automotive LiDAR Market Forecast 2020-2030 ($mn, AGR %)
Figure 123 “W” Shaped Recovery: UK Automotive LiDAR Market Forecast 2020-2030 ($mn, AGR %)
Figure 124 “L” Shaped Recovery: UK Automotive LiDAR Market Forecast 2020-2030 ($mn, AGR %)
Figure 125 France Automotive LiDAR Market Forecast, 2020-2030 (US$ million, AGR %)
Figure 126 “V” Shaped Recovery: France Automotive LiDAR Market Forecast 2020-2030 ($mn, AGR %)
Figure 127 “U” Shaped Recovery: France Automotive LiDAR Market Forecast 2020-2030 ($mn, AGR %)
Figure 128 “W” Shaped Recovery: France Automotive LiDAR Market Forecast 2020-2030 ($mn, AGR %)
Figure 129 “L” Shaped Recovery: France Automotive LiDAR Market Forecast 2020-2030 ($mn, AGR %)
Figure 130 Italy Automotive LiDAR Market Forecast, 2020-2030 (US$ million, AGR %)
Figure 131 “V” Shaped Recovery: Italy Automotive LiDAR Market Forecast 2020-2030 ($mn, AGR %)
Figure 132 “U” Shaped Recovery: Italy Automotive LiDAR Market Forecast 2020-2030 ($mn, AGR %)
Figure 133 “W” Shaped Recovery: Italy Automotive LiDAR Market Forecast 2020-2030 ($mn, AGR %)
Figure 134 “L” Shaped Recovery: Italy Automotive LiDAR Market Forecast 2020-2030 ($mn, AGR %)
Figure 135 Russia Automotive LiDAR Market Forecast, 2020-2030 (US$ million, AGR %)
Figure 136 “V” Shaped Recovery: Russia Automotive LiDAR Market Forecast 2020-2030 ($mn, AGR %)
Figure 137 “U” Shaped Recovery: Russia Automotive LiDAR Market Forecast 2020-2030 ($mn, AGR %)
Figure 138 “W” Shaped Recovery: Russia Automotive LiDAR Market Forecast 2020-2030 ($mn, AGR %)
Figure 139 “L” Shaped Recovery: Russia Automotive LiDAR Market Forecast 2020-2030 ($mn, AGR %)
Figure 140 ROE Automotive LiDAR Market Forecast, 2020-2030 (US$ million, AGR %)
Figure 141 “V” Shaped Recovery: Rest of Europe Automotive LiDAR Market Forecast 2020-2030 ($mn, AGR %)
Figure 142 “U” Shaped Recovery: Rest of Europe Automotive LiDAR Market Forecast 2020-2030 ($mn, AGR %)
Figure 143 “W” Shaped Recovery: Rest of Europe Automotive LiDAR Market Forecast 2020-2030 ($mn, AGR %)
Figure 144 “L” Shaped Recovery: Rest of Europe Automotive LiDAR Market Forecast 2020-2030 ($mn, AGR %)
Figure 145 Europe Automotive LiDAR Market by Technology Revenue Forecast, V Shaped Recovery
Figure 146 Europe Automotive LiDAR Market by Technology Revenue Forecast, U Shaped Recovery
Figure 147 Europe Automotive LiDAR Market by Technology Revenue Forecast, L Shaped Recovery
Figure 148 Europe Automotive LiDAR Market by Technology Revenue Forecast, W Shaped Recovery
Figure 149 Europe Automotive LiDAR Market by Image Revenue Forecast, V Shaped Recovery
Figure 150 Europe Automotive LiDAR Market by Image Revenue Forecast, U Shaped Recovery
Figure 151 Europe Automotive LiDAR Market by Image Revenue Forecast, L Shaped Recovery
Figure 152 Europe Automotive LiDAR Market by Image Revenue Forecast, W Shaped Recovery
Figure 153 Europe Automotive LiDAR Market by Application Revenue Forecast, V Shaped Recovery
Figure 154 Europe Automotive LiDAR Market by Application Revenue Forecast, U Shaped Recovery
Figure 155 Europe Automotive LiDAR Market by Application Revenue Forecast, L Shaped Recovery
Figure 156 Europe Automotive LiDAR Market by Application Revenue Forecast, W Shaped Recovery
Figure 157 Europe Automotive LiDAR Market by Placement Revenue Forecast, V Shaped Recovery
Figure 158 Europe Automotive LiDAR Market by Placement Revenue Forecast, U Shaped Recovery
Figure 159 Europe Automotive LiDAR Market by Placement Revenue Forecast, L Shaped Recovery
Figure 160 Europe Automotive LiDAR Market by Placement Revenue Forecast, W Shaped Recovery
Figure 161 Europe Automotive LiDAR Market by Vehicle Type Revenue Forecast, V Shaped Recovery
Figure 162 Europe Automotive LiDAR Market by Vehicle Type Revenue Forecast, U Shaped Recovery
Figure 163 Europe Automotive LiDAR Market by Vehicle Type Revenue Forecast, L Shaped Recovery
Figure 164 Europe Automotive LiDAR Market by Vehicle Type Revenue Forecast, W Shaped Recovery
Figure 165 China Automotive LiDAR Market Forecast, 2020-2030 (US$ million, AGR %)
Figure 166 “V” Shaped Recovery: China Automotive LiDAR Market Forecast 2020-2030 ($mn, AGR %)
Figure 167 “U” Shaped Recovery: China Automotive LiDAR Market Forecast 2020-2030 ($mn, AGR %)
Figure 168 “W” Shaped Recovery: China Automotive LiDAR Market Forecast 2020-2030 ($mn, AGR %)
Figure 169 “L” Shaped Recovery: China Automotive LiDAR Market Forecast 2020-2030 ($mn, AGR %)
Figure 170 Japan Automotive LiDAR Market Forecast, 2020-2030 (US$ million, AGR %)
Figure 171 “V” Shaped Recovery: Japan Automotive LiDAR Market Forecast 2020-2030 ($mn, AGR %)
Figure 172 “U” Shaped Recovery: Japan Automotive LiDAR Market Forecast 2020-2030 ($mn, AGR %)
Figure 173 “W” Shaped Recovery: Japan Automotive LiDAR Market Forecast 2020-2030 ($mn, AGR %)
Figure 174 “L” Shaped Recovery: Japan Automotive LiDAR Market Forecast 2020-2030 ($mn, AGR %)
Figure 175 India Automotive LiDAR Market Forecast, 2020-2030 (US$ million, AGR %)
Figure 176 “V” Shaped Recovery: India Automotive LiDAR Market Forecast 2020-2030 ($mn, AGR %)
Figure 177 “U” Shaped Recovery: India Automotive LiDAR Market Forecast 2020-2030 ($mn, AGR %)
Figure 178 “W” Shaped Recovery: India Automotive LiDAR Market Forecast 2020-2030 ($mn, AGR %)
Figure 179 “L” Shaped Recovery: India Automotive LiDAR Market Forecast 2020-2030 ($mn, AGR %)
Figure 180 South Korea Automotive LiDAR Market Forecast, 2020-2030 (US$ million, AGR %)
Figure 181 “V” Shaped Recovery: South Korea Automotive LiDAR Market Forecast 2020-2030 ($mn, AGR %)
Figure 182 “U” Shaped Recovery: South Korea Automotive LiDAR Market Forecast 2020-2030 ($mn, AGR %)
Figure 183 “W” Shaped Recovery: South Korea Automotive LiDAR Market Forecast 2020-2030 ($mn, AGR %)
Figure 184 “L” Shaped Recovery: South Korea Automotive LiDAR Market Forecast 2020-2030 ($mn, AGR %)
Figure 185 Rest of APAC Automotive LiDAR Market Forecast, 2020-2030 (US$ million, AGR %)
Figure 186 “V” Shaped Recovery: Rest of APAC Automotive LiDAR Market Forecast 2020-2030 ($mn, AGR %)
Figure 187 “U” Shaped Recovery: Rest of APAC Automotive LiDAR Market Forecast 2020-2030 ($mn, AGR %)
Figure 188 “W” Shaped Recovery: Rest of APAC Automotive LiDAR Market Forecast 2020-2030 ($mn, AGR %)
Figure 189 “L” Shaped Recovery: Rest of APAC Automotive LiDAR Market Forecast 2020-2030 ($mn, AGR %)
Figure 190 APAC Automotive LiDAR Market by Technology Revenue Forecast, V Shaped Recovery
Figure 191 APAC Automotive LiDAR Market by Technology Revenue Forecast, U Shaped Recovery
Figure 192 APAC Automotive LiDAR Market by Technology Revenue Forecast, L Shaped Recovery
Figure 193 APAC Automotive LiDAR Market by Technology Revenue Forecast, W Shaped Recovery
Figure 194 APAC Automotive LiDAR Market by Image Revenue Forecast, V Shaped Recovery
Figure 195 APAC Automotive LiDAR Market by Image Revenue Forecast, U Shaped Recovery
Figure 196 APAC Automotive LiDAR Market by Image Revenue Forecast, L Shaped Recovery
Figure 197 APAC Automotive LiDAR Market by Image Revenue Forecast, W Shaped Recovery
Figure 198 APAC Automotive LiDAR Market by Application Revenue Forecast, V Shaped Recovery
Figure 199 APAC Automotive LiDAR Market by Application Revenue Forecast, U Shaped Recovery
Figure 200 APAC Automotive LiDAR Market by Application Revenue Forecast, L Shaped Recovery
Figure 201 APAC Automotive LiDAR Market by Application Revenue Forecast, W Shaped Recovery
Figure 202 APAC Automotive LiDAR Market by Placement Revenue Forecast, V Shaped Recovery
Figure 203 APAC Automotive LiDAR Market by Placement Revenue Forecast, U Shaped Recovery
Figure 204 APAC Automotive LiDAR Market by Placement Revenue Forecast, L Shaped Recovery
Figure 205 APAC Automotive LiDAR Market by Placement Revenue Forecast, W Shaped Recovery
Figure 206 APAC Automotive LiDAR Market by Vehicle Type Revenue Forecast, V Shaped Recovery
Figure 207 APAC Automotive LiDAR Market by Vehicle Type Revenue Forecast, U Shaped Recovery
Figure 208 APAC Automotive LiDAR Market by Vehicle Type Revenue Forecast, L Shaped Recovery
Figure 209 APAC Automotive LiDAR Market by Vehicle Type Revenue Forecast, W Shaped Recovery
Figure 210 Brazil Automotive LiDAR Market Forecast, 2020-2030 (US$ million, AGR %)
Figure 211 “V” Shaped Recovery: Brazil Automotive LiDAR Market Forecast 2020-2030 ($mn, AGR %)
Figure 212 “U” Shaped Recovery: Brazil Automotive LiDAR Market Forecast 2020-2030 ($mn, AGR %)
Figure 213 “W” Shaped Recovery: Brazil Automotive LiDAR Market Forecast 2020-2030 ($mn, AGR %)
Figure 214 “L” Shaped Recovery: Brazil Automotive LiDAR Market Forecast 2020-2030 ($mn, AGR %)
Figure 215 Saudi Arabia Automotive LiDAR Market Forecast, 2020-2030 (US$ million, AGR %)
Figure 216 “V” Shaped Recovery: Saudi Arabia Automotive LiDAR Market Forecast 2020-2030 ($mn, AGR %)
Figure 217 “U” Shaped Recovery: Saudi Arabia Automotive LiDAR Market Forecast 2020-2030 ($mn, AGR %)
Figure 218 “W” Shaped Recovery: Saudi Arabia Automotive LiDAR Market Forecast 2020-2030 ($mn, AGR %)
Figure 219 “L” Shaped Recovery: Saudi Arabia Automotive LiDAR Market Forecast 2020-2030 ($mn, AGR %)
Figure 220 South Africa Automotive LiDAR Market Forecast, 2020-2030 (US$ million, AGR %)
Figure 221 “V” Shaped Recovery: South Africa Automotive LiDAR Market Forecast 2020-2030 ($mn, AGR %)
Figure 222 “U” Shaped Recovery: South Africa Automotive LiDAR Market Forecast 2020-2030 ($mn, AGR %)
Figure 223 “W” Shaped Recovery: South Africa Automotive LiDAR Market Forecast 2020-2030 ($mn, AGR %)
Figure 224 “L” Shaped Recovery: South Africa Automotive LiDAR Market Forecast 2020-2030 ($mn, AGR %)
Figure 225 Rest of LAMEA Automotive LiDAR Market Forecast, 2020-2030 (US$ million, AGR %)
Figure 226 “V” Shaped Recovery: Rest of LAMEA Automotive LiDAR Market Forecast 2020-2030 ($mn, AGR %)
Figure 227 “U” Shaped Recovery: Rest of LAMEA Automotive LiDAR Market Forecast 2020-2030 ($mn, AGR %)
Figure 228 “W” Shaped Recovery: Rest of LAMEA Automotive LiDAR Market Forecast 2020-2030 ($mn, AGR %)
Figure 229 “L” Shaped Recovery: Rest of LAMEA Automotive LiDAR Market Forecast 2020-2030 ($mn, AGR %)
Figure 230 LAMEA Automotive LiDAR Market by Technology Revenue Forecast, V Shaped Recovery
Figure 231 LAMEA Automotive LiDAR Market by Technology Revenue Forecast, U Shaped Recovery
Figure 232 LAMEA Automotive LiDAR Market by Technology Revenue Forecast, L Shaped Recovery
Figure 233 LAMEA Automotive LiDAR Market by Technology Revenue Forecast, W Shaped Recovery
Figure 234 LAMEA Automotive LiDAR Market by Image Revenue Forecast, V Shaped Recovery
Figure 235 LAMEA Automotive LiDAR Market by Image Revenue Forecast, U Shaped Recovery
Figure 236 LAMEA Automotive LiDAR Market by Image Revenue Forecast, L Shaped Recovery
Figure 237 LAMEA Automotive LiDAR Market by Image Revenue Forecast, W Shaped Recovery
Figure 238 LAMEA Automotive LiDAR Market by Application Revenue Forecast, V Shaped Recovery
Figure 239 LAMEA Automotive LiDAR Market by Application Revenue Forecast, U Shaped Recovery
Figure 240 LAMEA Automotive LiDAR Market by Application Revenue Forecast, L Shaped Recovery
Figure 241 LAMEA Automotive LiDAR Market by Application Revenue Forecast, W Shaped Recovery
Figure 242 LAMEA Automotive LiDAR Market by Placement Revenue Forecast, V Shaped Recovery
Figure 243 LAMEA Automotive LiDAR Market by Placement Revenue Forecast, U Shaped Recovery
Figure 244 LAMEA Automotive LiDAR Market by Placement Revenue Forecast, L Shaped Recovery
Figure 245 LAMEA Automotive LiDAR Market by Placement Revenue Forecast, W Shaped Recovery
Figure 246 LAMEA Automotive LiDAR Market by Vehicle Type Revenue Forecast, V Shaped Recovery
Figure 247 LAMEA Automotive LiDAR Market by Vehicle Type Revenue Forecast, U Shaped Recovery
Figure 248 LAMEA Automotive LiDAR Market by Vehicle Type Revenue Forecast, L Shaped Recovery
Figure 249 LAMEA Automotive LiDAR Market by Vehicle Type Revenue Forecast, W Shaped Recovery
Figure 250 Continental AG: Financials, 2015-2019 (US$ million, AGR %)
Figure 251 Aptiv: Financials, 2015-2019 (US$ million, AGR %)
Figure 252 Panasonic: Financials, 2015-2019 (US$ million, AGR %)
Figure 253 Valeo S.A.: Financials, 2015-2019 (US$ million, AGR %)
Figure 254 Bosch.: Financials, 2015-2019 (US$ million, AGR %)
Figure 255 Infineon Technologies: Financials, 2015-2019 (US$ million, AGR %)
Figure 256 First Sensor: Financials, 2015-2019 (US$ million, AGR %)
Figure 257 Texas Instruments: Financials, 2015-2019 (US$ million, AGR %)
Aptiv
Continental AG
First Sensor
Infineon Technologies AG
LeddarTech
Luminar Technologies
Panasonic Corporation
Quanergy Systems
Robert Bosch
Texas Instruments
Valeo S.A.
Velodyne LiDAR
List of Associations
Alliance of Automobile Manufacturers (USA)
Association of Russian Automakers
Audio Video Bridging (AVB)
China Association of Automobile Manufacturers
European Association of Automotive Suppliers
European Automobile Manufacturers’ Association
European Council for Automotive Research and Development
Former Society of Automotive Engineers
German Association of the Automotive Industry
In-Vehicle Infotainment (IVI)
International Organization of Motor Vehicle Manufacturers
Italian Association of the Automotive Industry
Japan Automobile Manufacturers Association
Download sample pages
Complete the form below to download your free sample pages for Automotive LiDAR Market Report 2020-2030Related reports
-

Automotive Bushing Market Report 2020-2030
The automotive bushing market is about to enter a period of phenomenal growth and innovation. The next ten years will...
Full DetailsPublished: 01 January 1970 -

Autonomous Trucks Market Report 2020-2030
Visiongain anticipates that the Global Autonomous Trucks Market is projected to surpass US$7,328.6 million in 2030 while growing at a...
Full DetailsPublished: 30 April 2020 -

Automotive Relay Market 2020-2030
Automotive plug-in relay market is expected to grow at a CAGR of 7% to reach a market size of $3.87bn...
Full DetailsPublished: 18 March 2020 -

Predictive Vehicle Technology Market Report 2020-2030
Predictive Vehicle Technology market driven by technological advancements is set to grow to US$132.54 billion by 2030.
...Full DetailsPublished: 11 May 2020 -

Automotive Plastics Market Report 2021-2031
The global automotive plastics market is driven by factors such as increasing demand of automotive vehicles across the globe, growing...Full DetailsPublished: 24 November 2020 -

Electric Vehicle Supply Equipment (EVSE) Market Report 2020-2030
The latest report from business intelligence provider company name offers comprehensive analysis of the global Electric Vehicle Supply Equipment market....
Full DetailsPublished: 06 May 2020 -

Automotive Fuel Cell Market Report 2020-2030
The Passenger Vehicles segment is expected in particular to flourish in the next few years because of growth in the...
Full DetailsPublished: 08 June 2020 -

Automotive Over the Air (OTA) Updates Market Report 2020-2030
As part of the broader $1,823.4 automotive over the air (OTA) updates market space, there are massive revenue streams within...
Full DetailsPublished: 23 March 2020 -

Automotive Hypervisor Market Report 2020-2030
The global market for automotive hypervisor is projected to grow with a CAGR of 29.1% during the forecast period from...
Full DetailsPublished: 01 January 1970 -

Unmanned Surface Vehicle (USV) Market Report 2020-2030
Unmanned Surface Vehicle market to total USD 2 billion in 2030 post COVID-19.
...Full DetailsPublished: 01 May 2020
Download sample pages
Complete the form below to download your free sample pages for Automotive LiDAR Market Report 2020-2030Do you have any custom requirements we can help you with?
Any specific country, geo region, market segment or specific company information?
Email us today, we can discuss your needs and see how we can help: jamie.roberts@visiongain.com
Would you like a free report overview of the report of your choice?
If so, please drop an email to Jamie Roberts stating your chosen report title to jamie.roberts@visiongain.com
Visiongain automotive reports are compiled using a broad and rich mixture of both primary and secondary information to produce an overall industry outlook. In order to provide our clients with the best product possible product, we do not rely on any one single source of information. Visiongain analysts reach out to market-leading vendors and automotive industry experts but also review a wealth of financial data and product information from a vast range of sources. To find out more about our reports methodology please email jamie.roberts@visiongain.com
Would you like to get the latest Visiongain automotive reports catalogue?
What are the dynamic growth sectors? where are the regional business opportunities?
Which technologies will prevail and who are the leading companies succeeding in these sectors and why?
If you want definitive answers to business critical questions, discover Visiongain’s full range of business intelligence reports.
If so, please email Jamie Roberts on jamie.roberts@visiongain.com or call her today on +44 207 336 6100
Alliance of Automobile Manufacturers (USA)
Association of Russian Automakers
Audio Video Bridging (AVB)
China Association Of Automoblie Manufacturers
European Association of Automotive Suppliers
European Automobile Manufacturers’ Association
European Council for Automotive Research and Development
Former Society of Automotive Engineers
German Association of the Automotive Industry
International Organization of Motor Vehicle Manufacturers
In-Vehicle Infotainment (IVI)
Italian Association of the Automotive Industry
Japan Automobile Manufacturers Association
One-Pair Ether-Net
Society of Indian Automobile Manufacturers (SIAM)
Society of Motor Manufacturers and Traders
The International Council For Clean Transport
US National Highway Traffic Safety Administration
Don’t Miss Out!
Latest Automotive news
Hydrogen Vehicle Market
The global Hydrogen Vehicle market was valued at US$23.34 billion in 2023 and is projected to grow at a CAGR of 22.7% during the forecast period 2024-2034.
17 May 2024
Autonomous Vehicle Market
The global Autonomous Vehicle market was valued at US$35.4 billion in 2023 and is projected to grow at a CAGR of 22.7% during the forecast period 2024-2034.
16 May 2024
Automotive Infotainment Market
The global Automotive Infotainment market is estimated at US$20.2 billion in 2023 and is projected to grow at a CAGR of 6.3% during the forecast period 2024-2034.
14 May 2024
Automotive Cyber Security Market
The global Automotive Cyber Security market was valued at US$2,991.6 million in 2024 and is projected to grow at a CAGR of 19.4% during the forecast period 2024-2034.
13 May 2024


