Industries > Automotive > Automotive Fuel Cell Market Report 2020-2030
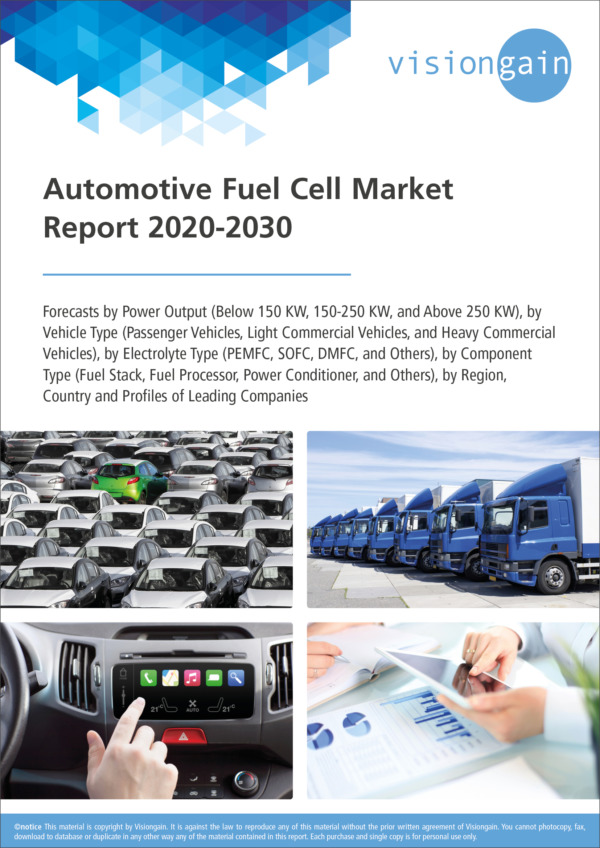
Automotive Fuel Cell Market Report 2020-2030
Forecasts by Power Output (Below 150 KW, 150-250 KW, and Above 250 KW), by Vehicle Type (Passenger Vehicles, Light Commercial Vehicles, and Heavy Commercial Vehicles), by Electrolyte Type (PEMFC, SOFC, DMFC, and Others), by Component Type (Fuel Stack, Fuel Processor, Power Conditioner, and Others), by Region, Country and Profiles of Leading Companies
Why is the global automotive fuel cell market important right now?
As part of the broader $xyz million automotive fuel cell market space, there are massive revenue streams within Above 250 KW segment to tap into. This report shows you where these business opportunities are.
The growing automotive industry and increasing demand for fuel cell vehicles, has led Visiongain to publish this timely report.
The Passenger Vehicles segment is expected in particular to flourish in the next few years because of growth in the digitalization and modernization of fuel cell vehicles and increase in sale of passenger vehicles.
What are the global Automotive Fuel cell market prospects?
Visiongain’s definitive new report assesses that the automotive fuel cell market will reach $xyz mn in 2019. The performance of the industry is forecast to accelerate, with an anticipated CAGR of xyz% for the five-year period 2020-2025, which is expected to drive the industry to a value of $xyz mn by the end of 2025.
To access the data contained in this document please email contactus@visiongain.com
Visiongain’s timely 316 page report reveals how best to compete in this lucrative market space and maximize your company’s potential.
This report includes data analysis and invaluable insight into how COVID-19 will affect your industry. Access this report today.
This report addresses the pertinent issues:
• Where are the most lucrative market prospects?
• Who are the leadings companies and what does the competitive landscape look like?
• What are the regional, technical and regulatory barriers to market entry?
• What are the technological issues and roadmap driving the market?
• Why is the market prospering and how can you fully exploit this?
• When will the market fully mature and why?
Research and analysis highlights
• Independent, impartial and objective analysis
• 424 tables, charts and graphs illustrating the global automotive fuel cell market prospects
• Global automotive fuel cell market forecast and analysis 2020-2030
• 3 automotive fuel cell submarket forecasts by power output covering the period 2020-2030
• 3 automotive fuel cell submarket forecasts by vehicle type from 2020-2030
• 4 automotive fuel cell submarket forecasts by electrolyte type from 2020-2030
• 4 automotive fuel cell submarket forecasts by component type from 2020-2030
• 17 leading national automotive fuel cell market forecasts from 2020-2030
• Analysis of the automotive fuel cell set to become mandatory in North America
• Porter’s Five Forces analysis
• Profiles of 10 leading companies, involved with automotive fuel cell with key financial metrics:
– Ballard Power Systems
– Ceres Power
– Hydrogenics Corporation
– ITM Power Plc
– Nedstack Fuel Cell Technology BV
– Nuvera Fuel Cells, LLC
– SFC Energy AG
– Plug Power Inc.
– Proton Power Systems PLC
– PowerCell Sweden AB
And there’s more.
How this report will benefit you
• You have almost certainly an excess of conflicting and yet unclear information – you want one definitive report to base your business decisions upon – this visiongain report provides that clarity
• Our insightful report speaks to your needs for definitive market data, objective impartial analysis and immediate clear conclusions – to allow you to formulate clear decisive business strategies
• You need the information now in an easily digestible form – this is where this visiongain reports excels
• Forecasts give you a crucial advantage. That knowledge of the future is central to your strategic decision making.
• Knowledge is vital to you and your business. You need every piece of evidence to inform your crucial investment decisions – let visiongain give you that clear advantage
• Without this vital report, you will fall behind your competitors
Who should read this report?
• Anyone within the value chain.
• Contractors
• Suppliers
• Technologists
• Government agencies
• Banks
• Business development managers
• Marketing managers
• Investors
• Consultancies
Don’t miss out on this business advantage
This information is not available elsewhere. With our report you are less likely to fall behind in knowledge or miss opportunity. Discover how the report benefits your research, analyses, and decisions. Also see how you save time and receive recognition for commercial insight.
Visiongain’s study is for everybody needing commercial analyses for the automotive fuel cell market and leading companies. Find data, trends and predictions. Get our report today global automotive fuel cell market. Please order our report now.
To access the data contained in this document please email contactus@visiongain.com
Buy our report today Automotive Fuel Cell Market Report 2020-2030: Forecasts by Power Output (Below 150 KW, 150-250 KW, and Above 250 KW), by Vehicle Type (Passenger Vehicles, Light Commercial Vehicles, and Heavy Commercial Vehicles), by Electrolyte Type (PEMFC, SOFC, DMFC, and Others), by Component Type (Fuel Stack, Fuel Processor, Power Conditioner, and Others), by Region, Country and Profiles of Leading Companies. Avoid missing out by staying informed – order our report now.
Visiongain is a trading partner with the US Federal Government
CCR Ref number: KD4R6
Do you have any custom requirements we can help you with? Any need for specific country, geo region, market segment or specific company information? Contact us today, we can discuss your needs and see how we can help: sara.peerun@visiongain.com
1. Report Overview
1.1. Global Automotive Fuel Cell Market Overview
1.2. Why You Should Read This Report
1.3. How This Report Delivers
1.4. Key Questions Answered by This Analytical Report Include:
1.5. Who is This Report For?
1.6. Methodology
1.6.1. Primary Research
1.6.2. Secondary Research
1.6.3. Market Evaluation & Forecasting Methodology
1.7. Frequently Asked Questions (FAQ)
1.8. Associated Visiongain Reports
1.9. About Visiongain
2. Introduction to the Automotive Fuel Cell Market
2.1. Global Automotive Fuel Cell Market Structure
2.2. Automotive Fuel Cell Market Definition
2.3. How Fuel Cells Work
2.4. Key Components of a Hydrogen Fuel Cell Electric Car
2.5. Commercial Available Fuel Cell Vehicles
2.6. Automotive Fuel Cell Submarket Definition by Electrolyte Type
2.6.1. Proton-exchange Membrane Fuel Cell (PEMFC)
2.6.2. Solid Oxide Fuel Cell (SOFC)
2.6.3. Direct Methanol Fuel Cell (DMFC)
2.6.4. Other Electrolyte Type
2.7. Automotive Fuel Cell Submarket Definition by Component Type
2.7.1. Fuel Stack
2.7.2. Fuel Processor
2.7.3. Power Conditioner
2.7.4. Other Component Type
2.8. Automotive Fuel Cell Submarket Definition by Vehicle Type
2.8.1. Passenger Vehicles
2.8.2. Light Commercial Vehicles
2.8.3. Heavy Commercial Vehicles
3. Global Automotive Fuel Cell Market Dynamics
3.1. Global Automotive Fuel Cell Market Overview
3.2. Global Automotive Fuel Cell Market Drivers & Restraints 2020
3.2.1. Global Automotive Fuel Cell Market Drivers 2020
3.2.2. Global Automotive Fuel Cell Market Restraints 2020
3.2.3. Global Automotive Fuel Cell Market Trends and Opportunities 2020
3.3. Global Automotive Fuel Cell Market Value Chain Analysis
3.4. Global Automotive Fuel Cell Market Five Forces Analysis
4. Global Automotive Fuel Cell Market by Electrolyte Type Forecast 2020-2030
5. Global Automotive Fuel Cell Market by Component Type Forecast 2020-2030
6. Global Automotive Fuel Cell Market by Power Output Forecast 2020-2030
7. Global Automotive Fuel Cell Market by Vehicle Type Forecast 2020-2030
8. Regional & Leading National Automotive Fuel Cell Market Forecast 2020-2030
8.1. North America Automotive Fuel Cell Market 2020-2030
8.1.1. Overview of the North America Automotive Fuel Cell Market 2020-2030
8.1.2. North America Automotive Fuel Cell Market by Electrolyte Type Forecast 2020-2030
8.1.3. North America Automotive Fuel Cell Market by Component Type Forecast 2020-2030
8.1.4. North America Automotive Fuel Cell Market by Power Output Forecast 2020-2030
8.1.5. North America Automotive Fuel Cell Market by Vehicle Type 2020-2030 8.1.6. North America Automotive Fuel Cell Market by County 2020-2030
8.2. Europe Automotive Fuel Cell Market 2020-2030
8.2.1. Overview of the Europe Automotive Fuel Cell Market 2020-2030
8.2.2. Europe Automotive Fuel Cell Market by Electrolyte Type Forecast 2020-2030
8.2.3. Europe Automotive Fuel Cell Market by Component Type Forecast 2020-2030
8.2.4. Europe Automotive Fuel Cell Market by Power Output Forecast 2020-2030
8.2.5. Europe Automotive Fuel Cell Market by Vehicle Type 2020-2030
8.2.6. Europe Automotive Fuel Cell Market by County 2020-2030
8.3. APAC Automotive Fuel Cell Market 2020-2030
8.3.1. Overview of the APAC Automotive Fuel Cell Market 2020-2030
8.3.2. APAC Automotive Fuel Cell Market by Electrolyte Type Forecast 2020-2030
8.3.3. APAC Automotive Fuel Cell Market by Component Type Forecast 2020-2030
8.3.4. APAC Automotive Fuel Cell Market by Power Output Forecast 2020-2030
8.3.5. APAC Automotive Fuel Cell Market by Vehicle Type 2020-2030
8.3.6. APAC Automotive Fuel Cell Market by County 2020-2030
9. SWOT Analysis of the Automotive Fuel Cell Market 2020-2030
10. Leading Automotive Fuel Cell Companies
10.1. Ballard Power Systems Inc.
10.1.1. Ballard Power Systems Inc. Company Introduction
10.1.2. Ballard Power Systems Inc. Automotive Fuel Cell Portfolio
10.1.3. Ballard Power Systems Inc. Financial Analysis
10.1.4. Ballard Power Systems Inc. Recent Developments
10.2. Cares Power Ltd.
10.2.1. Cares Power Ltd. Company Introduction
10.2.2. Cares Power Ltd. Automotive Fuel Cell Products Portfolio
10.2.3. Cares Power Ltd. Financial Analysis
10.2.4. Cares Power Ltd. Recent Developments
10.3. Hydrogenics Corporation
10.3.1. Hydrogenics Corporation Company Introduction
10.3.2. Hydrogenics Corporation Automotive Fuel Cell Products Portfolio
10.3.3. Hydrogenics Corporation Financial Analysis
10.3.4. Hydrogenics Corporation Recent Developments
10.4. ITM Power Plc
10.4.1. ITM Power Plc Company Introduction
10.4.2. ITM Power Plc Automotive Fuel Cell Product Portfolio
10.4.3. ITM Power Plc Financial Analysis
10.4.4. ITM Power Plc Recent Developments
10.5. Nedstack Fuel Cell Technology BV
10.5.1. Nedstack Fuel Cell Technology BV Company Introduction
10.5.2. Nedstack Fuel Cell Technology BV Automotive Fuel Cell Product Portfolio
10.5.3. Nedstack Fuel Cell Technology BV Recent Developments
10.6. Nuvera Fuel Cells, LLC
10.6.1. Nuvera Fuel Cells, LLC Company Introduction
10.6.2. Nuvera Fuel Cells, LLC Automotive Fuel Cell Product Portfolio
10.6.3. Nuvera Fuel Cells, LLC Recent Developments
10.7. SFC Energy AG
10.7.1. SFC Energy AG Company Introduction
10.7.2. SFC Energy AG Automotive Fuel Cell Product Portfolio
10.7.3. SFC Energy AG Financial Analysis
10.8. Plug Power Inc.
10.8.1. Plug Power Inc. Company Introduction
10.8.2. Plug Power Inc. Automotive Fuel Cell Product Portfolio
10.8.3. Plug Power Inc. Financial Analysis
10.8.4. Plug Power Inc. Recent Developments
10.9. Proton Power Systems PLC
10.9.1. Proton Power Systems PLC Company Introduction
10.9.2. Proton Power Systems PLC Automotive Fuel Cell Product Portfolio
10.9.3. Proton Power Systems PLC Financial Analysis
10.9.4. Proton Power Systems PLC Recent Developments
10.10. PowerCell Sweden AB
10.10.1. PowerCell Sweden AB Company Introduction
10.10.2. PowerCell Sweden AB Automotive Fuel Cell Product Portfolio
10.10.3. PowerCell Sweden AB Financial Analysis
10.10.4. PowerCell Sweden AB Recent Developments
10.11. Other Automotive Fuel Cell Market Players
11. Conclusions and Recommendations
11.1. Leading Segment in the Global Automotive Fuel Cell Market by Electrolyte Type
11.2. Leading Segment in the Global Automotive Fuel Cell Market by Component Type
11.3. Leading Segment in the Global Automotive Fuel Cell Market by Power Output
11.4. Leading Segment in the Global Automotive Fuel Cell Market by Vehicle Type
11.5. Leading Regional Market in the Global Automotive Fuel Cell Market
11.6. Leading Country in the Global Automotive Fuel Cell Market
11.7. Leading Companies in the Global Automotive Fuel Cell Market
11.8. Key Strategies for Success in the Global Automotive Fuel Cell Market
11.8.1. Merger & Acquisition
11.8.2. New Product Development
11.9. Key Drivers and Challenges in the Global Automotive Fuel Cell Market
11.10. Recommendations
12. Glossary
Associated Visiongain Reports
Visiongain Report Sales Order Form
Appendix A About Visiongain
Appendix B Visiongain report evaluation form
List of Tables
Table 2.1 Hydrogen Refilling Stations Around the World, 2019
Table 3.1 Global Automotive Fuel Cell Market Revenue and AGR Analysis & Forecast Before COVID-19 (US$ Million, AGR%, CAGR%), 2020-2030
Table 3.2 Global Automotive Fuel Cell Market Revenue and AGR Analysis & Forecast After COVID-19 (V Shaped Recovery) (US$ Million, AGR%, CAGR%), 2020-2030
Table 3.3 Global Automotive Fuel Cell Market Revenue and AGR Analysis & Forecast After COVID-19 (U Shaped Recovery) (US$ Million, AGR%, CAGR%), 2020-2030
Table 3.4 Global Automotive Fuel Cell Market Revenue and AGR Analysis & Forecast After COVID-19 (L Shaped Recovery) (US$ Million, AGR%, CAGR%), 2020-2030
Table 3.5 Global Automotive Fuel Cell Market Revenue and AGR Analysis & Forecast After COVID-19 (W Shaped Recovery) (US$ Million, AGR%, CAGR%), 2020-2030
Table 3.6 2016 Relative Price of Fuel Cell Bus Components
Table 4.1 Global Automotive Fuel Cell Market, By Electrolyte Type, 2020-2030 Before COVID-19 (US$ Million, AGR %)
Table 4.2 Global Automotive Fuel Cell Market, By Electrolyte Type, 2020-2030 After COVID-19 (V Shaped) (US$ Million, AGR %)
Table 4.3 Global Automotive Fuel Cell Market, By Electrolyte Type, 2020-2030 After COVID-19 (U Shaped) (US$ Million, AGR %)
Table 4.4 Global Automotive Fuel Cell Market, By Electrolyte Type, 2020-2030 After COVID-19 (L Shaped) (US$ Million, AGR %)
Table 4.5 Global Automotive Fuel Cell Market, By Electrolyte Type, 2020-2030 After COVID-19 (W Shaped) (US$ Million, AGR %)
Table 5.1 Global Automotive Fuel Cell Market, By Component Type, 2020-2030 Before COVID-19 (US$ Million, AGR %)
Table 5.2 Global Automotive Fuel Cell Market, By Component Type, 2020-2030 After COVID-19 (V Shaped) (US$ Million, AGR %)
Table 5.3 Global Automotive Fuel Cell Market, By Component Type, 2020-2030 After COVID-19 (U Shaped) (US$ Million, AGR %)
Table 5.4 Global Automotive Fuel Cell Market, By Component Type, 2020-2030 After COVID-19 (L Shaped) (US$ Million, AGR %)
Table 5.5 Global Automotive Fuel Cell Market, By Component Type, 2020-2030 After COVID-19 (W Shaped) (US$ Million, AGR %)
Table 6.1 Global Automotive Fuel Cell Market, By Power Output, 2020-2030 Before COVID-19 (US$ Million, AGR %)
Table 6.2 Global Automotive Fuel Cell Market, By Power Output, 2020-2030 After COVID-19 (V Shaped) (US$ Million, AGR %)
Table 6.3 Global Automotive Fuel Cell Market, By Power Output, 2020-2030 After COVID-19 (U Shaped) (US$ Million, AGR %)
Table 6.4 Global Automotive Fuel Cell Market, By Power Output, 2020-2030 After COVID-19 (L Shaped) (US$ Million, AGR %)
Table 6.5 Global Automotive Fuel Cell Market, By Power Output, 2020-2030 After COVID-19 (W Shaped) (US$ Million, AGR %)
Table 7.1 Global Automotive Fuel Cell Market, By Vehicle Type, 2020-2030 Before COVID-19 (US$ Million, AGR %)
Table 7.2 Global Automotive Fuel Cell Market, By Vehicle Type, 2020-2030 After COVID-19 (V Shaped) (US$ Million, AGR %)
Table 7.3 Global Automotive Fuel Cell Market, By Vehicle Type, 2020-2030 After COVID-19 (U Shaped) (US$ Million, AGR %)
Table 7.4 Global Automotive Fuel Cell Market, By Vehicle Type, 2020-2030 After COVID-19 (L Shaped) (US$ Million, AGR %)
Table 7.5 Global Automotive Fuel Cell Market, By Vehicle Type, 2020-2030 After COVID-19 (W Shaped) (US$ Million, AGR %)
Table 8.1 Regional & National Automotive Fuel Cell Market Forecast Before COVID-19 2020-2030 (US$ Million, AGR %, CAGR %)
Table 8.2 Regional Automotive Fuel Cell Market Value CAGR from 2020-2025, 2025-2030, 2020-2030 (%) Before COVID-19
Table 8.3 North America Automotive Fuel Cell Market Revenue Analysis & Forecast Before COVID-19 (US$ Million AGR%, CAGR%), 2020-2030
Table 8.4 North America Automotive Fuel Cell Market Revenue Analysis & Forecast After COVID-19 (V Shaped) (US$ Million AGR%, CAGR%), 2020-2030
Table 8.5 North America Automotive Fuel Cell Market Revenue Analysis & Forecast After COVID-19 (U Shaped) (US$ Million AGR%, CAGR%), 2020-2030
Table 8.6 North America Automotive Fuel Cell Market Revenue Analysis & Forecast After COVID-19 (L Shaped) (US$ Million AGR%, CAGR%), 2020-2030
Table 8.7 North America Automotive Fuel Cell Market Revenue Analysis & Forecast After COVID-19 (W Shaped) (US$ Million AGR%, CAGR%), 2020-2030
Table 8.8 North America Automotive Fuel Cell Market, By Electrolyte Type, 2020-2030 Before COVID-19 (US$ Million, AGR %)
Table 8.9 North America Automotive Fuel Cell Market, By Electrolyte Type, 2020-2030 After COVID-19 (V Shaped) (US$ Million, AGR %)
Table 8.10 North America Automotive Fuel Cell Market, By Electrolyte Type, 2020-2030 After COVID-19 (U Shaped) (US$ Million, AGR %)
Table 8.11 North America Automotive Fuel Cell Market, By Electrolyte Type, 2020-2030 After COVID-19 (L Shaped) (US$ Million, AGR %)
Table 8.12 North America Automotive Fuel Cell Market, By Electrolyte Type, 2020-2030 After COVID-19 (W Shaped) (US$ Million, AGR %)
Table 8.13 North America Automotive Fuel Cell Market, By Component Type, 2020-2030 Before COVID-19 (US$ Million, AGR %)
Table 8.14 North America Automotive Fuel Cell Market, By Component Type, 2020-2030 After COVID-19 (V Shaped) (US$ Million, AGR %)
Table 8.15 North America Automotive Fuel Cell Market, By Component Type, 2020-2030 After COVID-19 (U Shaped) (US$ Million, AGR %)
Table 8.16 North America Automotive Fuel Cell Market, By Component Type, 2020-2030 After COVID-19 (L Shaped) (US$ Million, AGR %)
Table 8.17 North America Automotive Fuel Cell Market, By Component Type, 2020-2030 After COVID-19 (W Shaped) (US$ Million, AGR %)
Table 8.18 North America Automotive Fuel Cell Market, By Power Output, 2020-2030 Before COVID-19 (US$ Million, AGR %)
Table 8.19 North America Automotive Fuel Cell Market, By Power Output, 2020-2030 After COVID-19 (V Shaped) (US$ Million, AGR %)
Table 8.20 North America Automotive Fuel Cell Market, By Power Output, 2020-2030 After COVID-19 (U Shaped) (US$ Million, AGR %)
Table 8.21 North America Automotive Fuel Cell Market, By Power Output, 2020-2030 After COVID-19 (L Shaped) (US$ Million, AGR %)
Table 8.22 North America Automotive Fuel Cell Market, By Power Output, 2020-2030 After COVID-19 (W Shaped) (US$ Million, AGR %)
Table 8.23 North America Automotive Fuel Cell Market, By Vehicle Type, 2020-2030 Before COVID-19 (US$ Million, AGR %)
Table 8.24 North America Automotive Fuel Cell Market, By Vehicle Type, 2020-2030 After COVID-19 (V Shaped) (US$ Million, AGR %)
Table 8.25 North America Automotive Fuel Cell Market, By Vehicle Type, 2020-2030 After COVID-19 (U Shaped) (US$ Million, AGR %)
Table 8.26 North America Automotive Fuel Cell Market, By Vehicle Type, 2020-2030 After COVID-19 (L Shaped) (US$ Million, AGR %)
Table 8.27 North America Automotive Fuel Cell Market, By Vehicle Type, 2020-2030 After COVID-19 (W Shaped) (US$ Million, AGR %)
Table 8.28 North America Automotive Fuel Cell Market, By Country, 2020-2030 Before COVID-19 (US$ Million, AGR %)
Table 8.29 North America Automotive Fuel Cell Market, By Country, 2020-2030 After COVID-19 (V Shaped) (US$ Million, AGR %)
Table 8.30 North America Automotive Fuel Cell Market, By Country, 2020-2030 After COVID-19 (U Shaped) (US$ Million, AGR %)
Table 8.31 North America Automotive Fuel Cell Market, By Country, 2020-2030 After COVID-19 (L Shaped) (US$ Million, AGR %)
Table 8.32 North America Automotive Fuel Cell Market, By Country, 2020-2030 After COVID-19 (W Shaped) (US$ Million, AGR %)
Table 8.33 Europe Automotive Fuel Cell Market Revenue Analysis & Forecast Before COVID-19 (US$ Million AGR%, CAGR%), 2020-2030
Table 8.34 Europe Automotive Fuel Cell Market Revenue Analysis & Forecast After COVID-19 (V Shaped) (US$ Million AGR%, CAGR%), 2020-2030
Table 8.35 Europe Automotive Fuel Cell Market Revenue Analysis & Forecast After COVID-19 (U Shaped) (US$ Million AGR%, CAGR%), 2020-2030
Table 8.36 Europe Automotive Fuel Cell Market Revenue Analysis & Forecast After COVID-19 (L Shaped) (US$ Million AGR%, CAGR%), 2020-2030
Table 8.37 Europe Automotive Fuel Cell Market Revenue Analysis & Forecast After COVID-19 (W Shaped) (US$ Million AGR%, CAGR%), 2020-2030
Table 8.38 Europe Automotive Fuel Cell Market, By Electrolyte Type, 2020-2030 Before COVID-19 (US$ Million, AGR %)
Table 8.39 Europe Automotive Fuel Cell Market, By Electrolyte Type, 2020-2030 After COVID-19 (V Shaped) (US$ Million, AGR %)
Table 8.40 Europe Automotive Fuel Cell Market, By Electrolyte Type, 2020-2030 After COVID-19 (U Shaped) (US$ Million, AGR %)
Table 8.40 Europe Automotive Fuel Cell Market, By Electrolyte Type, 2020-2030 After COVID-19 (U Shaped) (US$ Million, AGR %)
Table 8.42 Europe Automotive Fuel Cell Market, By Electrolyte Type, 2020-2030 After COVID-19 (W Shaped) (US$ Million, AGR %)
Table 8.43 Europe Automotive Fuel Cell Market, By Component Type, 2020-2030 Before COVID-19 (US$ Million, AGR %)
Table 8.44 Europe Automotive Fuel Cell Market, By Component Type, 2020-2030 After COVID-19 (V Shaped) (US$ Million, AGR %)
Table 8.45 Europe Automotive Fuel Cell Market, By Component Type, 2020-2030 After COVID-19 (U Shaped) (US$ Million, AGR %)
Table 8.46 Europe Automotive Fuel Cell Market, By Component Type, 2020-2030 After COVID-19 (L Shaped) (US$ Million, AGR %)
Table 8.47 Europe Automotive Fuel Cell Market, By Component Type, 2020-2030 After COVID-19 (W Shaped) (US$ Million, AGR %)
Table 4.48 Europe Automotive Fuel Cell Market, By Power Output, 2020-2030 Before COVID-19 (US$ Million, AGR %)
Table 8.49 Europe Automotive Fuel Cell Market, By Power Output, 2020-2030 After COVID-19 (V Shaped) (US$ Million, AGR %)
Table 8.50 Europe Automotive Fuel Cell Market, By Power Output, 2020-2030 After COVID-19 (U Shaped) (US$ Million, AGR %)
Table 8.51 Europe Automotive Fuel Cell Market, By Power Output, 2020-2030 After COVID-19 (L Shaped) (US$ Million, AGR %)
Table 8.52 Europe Automotive Fuel Cell Market, By Power Output, 2020-2030 After COVID-19 (W Shaped) (US$ Million, AGR %)
Table 8.53 Europe Automotive Fuel Cell Market, By Vehicle Type, 2020-2030 Before COVID-19 (US$ Million, AGR %)
Table 8.54 Europe Automotive Fuel Cell Market, By Vehicle Type, 2020-2030 After COVID-19 (V Shaped) (US$ Million, AGR %)
Table 8.55 Europe Automotive Fuel Cell Market, By Vehicle Type, 2020-2030 After COVID-19 (U Shaped) (US$ Million, AGR %)
Table 8.56 Europe Automotive Fuel Cell Market, By Vehicle Type, 2020-2030 After COVID-19 (L Shaped) (US$ Million, AGR %)
Table 8.57 Europe Automotive Fuel Cell Market, By Vehicle Type, 2020-2030 After COVID-19 (W Shaped) (US$ Million, AGR %)
Table 8.58 Europe Automotive Fuel Cell Market, By Country, 2020-2030 Before COVID-19 (US$ Million, AGR %)
Table 8.59 Europe Automotive Fuel Cell Market, By Country, 2020-2030 After COVID-19 (V Shaped) (US$ Million, AGR %)
Table 8.60 Europe Automotive Fuel Cell Market, By Country, 2020-2030 After COVID-19 (U Shaped) (US$ Million, AGR %)
Table 8.61 Europe Automotive Fuel Cell Market, By Country, 2020-2030 After COVID-19 (L Shaped) (US$ Million, AGR %)
Table 8.62 Europe Automotive Fuel Cell Market, By Country, 2020-2030 After COVID-19 (W Shaped) (US$ Million, AGR %)
Table 8.63 APAC Automotive Fuel Cell Market Revenue Analysis & Forecast Before COVID-19 (US$ Million AGR%, CAGR%), 2020-2030
Table 8.64 APAC Automotive Fuel Cell Market Revenue Analysis & Forecast After COVID-19 (V Shaped) (US$ Million AGR%, CAGR%), 2020-2030
Table 8.65 APAC Automotive Fuel Cell Market Revenue Analysis & Forecast After COVID-19 (U Shaped) (US$ Million AGR%, CAGR%), 2020-2030
Table 8.66 APAC Automotive Fuel Cell Market Revenue Analysis & Forecast After COVID-19 (L Shaped) (US$ Million AGR%, CAGR%), 2020-2030
Table 8.67 APAC Automotive Fuel Cell Market Revenue Analysis & Forecast After COVID-19 (W Shaped) (US$ Million AGR%, CAGR%), 2020-2030
Table 8.68 APAC Automotive Fuel Cell Market, By Electrolyte Type, 2020-2030 Before COVID-19 (US$ Million, AGR %)
Table 8.69 APAC Automotive Fuel Cell Market, By Electrolyte Type, 2020-2030 After COVID-19 (V Shaped) (US$ Million, AGR %)
Table 8.70 APAC Automotive Fuel Cell Market, By Electrolyte Type, 2020-2030 After COVID-19 (U Shaped) (US$ Million, AGR %)
Table 8.71 APAC Automotive Fuel Cell Market, By Electrolyte Type, 2020-2030 After COVID-19 (L Shaped) (US$ Million, AGR %)
Table 8.72 APAC Automotive Fuel Cell Market, By Electrolyte Type, 2020-2030 After COVID-19 (W Shaped) (US$ Million, AGR %)
Table 8.73 APAC Automotive Fuel Cell Market, By Component Type, 2020-2030 Before COVID-19 (US$ Million, AGR %)
Table 8.74 APAC Automotive Fuel Cell Market, By Component Type, 2020-2030 After COVID-19 (V Shaped) (US$ Million, AGR %)
Table 8.75 APAC Automotive Fuel Cell Market, By Component Type, 2020-2030 After COVID-19 (U Shaped) (US$ Million, AGR %)
Table 8.76 APAC Automotive Fuel Cell Market, By Component Type, 2020-2030 After COVID-19 (L Shaped) (US$ Million, AGR %)
Table 8.77 APAC Automotive Fuel Cell Market, By Component Type, 2020-2030 After COVID-19 (W Shaped) (US$ Million, AGR %)
Table 8.78 APAC Automotive Fuel Cell Market, By Power Output, 2020-2030 Before COVID-19 (US$ Million, AGR %)
Table 8.79 APAC Automotive Fuel Cell Market, By Power Output, 2020-2030 After COVID-19 (V Shaped) (US$ Million, AGR %)
Table 8.80 APAC Automotive Fuel Cell Market, By Power Output, 2020-2030 After COVID-19 (U Shaped) (US$ Million, AGR %)
Table 8.81 APAC Automotive Fuel Cell Market, By Power Output, 2020-2030 After COVID-19 (L Shaped) (US$ Million, AGR %)
Table 8.82 APAC Automotive Fuel Cell Market, By Power Output, 2020-2030 After COVID-19 (W Shaped) (US$ Million, AGR %)
Table 8.83 APAC Automotive Fuel Cell Market, By Vehicle Type, 2020-2030 Before COVID-19 (US$ Million, AGR %)
Table 8.84 APAC Automotive Fuel Cell Market, By Vehicle Type, 2020-2030 After COVID-19 (V Shaped) (US$ Million, AGR %)
Table 8.85 APAC Automotive Fuel Cell Market, By Vehicle Type, 2020-2030 After COVID-19 (U Shaped) (US$ Million, AGR %)
Table 8.86 APAC Automotive Fuel Cell Market, By Vehicle Type, 2020-2030 After COVID-19 (L Shaped) (US$ Million, AGR %)
Table 8.87 APAC Automotive Fuel Cell Market, By Vehicle Type, 2020-2030 After COVID-19 (W Shaped) (US$ Million, AGR %)
Table 8.88 APAC Automotive Fuel Cell Market, By Country, 2020-2030 Before COVID-19 (US$ Million, AGR %)
Table 8.89 APAC Automotive Fuel Cell Market, By Country, 2020-2030 After COVID-19 (V Shaped) (US$ Million, AGR %)
Table 8.90 APAC Automotive Fuel Cell Market, By Country, 2020-2030 After COVID-19 (U Shaped) (US$ Million, AGR %)
Table 8.91 APAC Automotive Fuel Cell Market, By Country, 2020-2030 After COVID-19 (L Shaped) (US$ Million, AGR %)
Table 8.92 APAC Automotive Fuel Cell Market, By Country, 2020-2030 After COVID-19 (W Shaped) (US$ Million, AGR %)
Table 9.1 Global Automotive Fuel Cell Market SWOT Analysis 2020-2030
Table 10.1 Ballard Power Systems Inc. (Company Details)
Table 10.2 Ballard Power Systems Inc. Automotive Fuel Cell Portfolio
Table 10.3 Ballard Power Systems Inc. Revenue (USD million) and AGR (%), 2017 - 2019
Table 10.4 Cares Power Ltd. (Company Details)
Table 10.5 Cares Power Ltd. Revenue (USD million) and AGR (%), 2016 - 2019
Table 10.6 Hydrogenics Corporation (Company Details)
Table 10.7 Hydrogenics Corporation Revenue (USD million) and AGR (%), 2017 - 2018
Table 10.8 ITM Power Plc (Company Details)
Table 10.9 ITM Power Plc Revenue (USD million) and AGR (%), 2016 - 2019
Table 10.10 Nedstack Fuel Cell Technology BV (Company Details)
Table 10.11 Nuvera Fuel Cells, LLC (Company Details)
Table 10.12 SFC Energy AG (Company Details)
Table 10.13 SFC Energy AG Revenue (USD million) and AGR (%), 2016 - 2019
Table 10.14 Plug Power Inc. (Company Details)
Table 10.15 Plug Power Inc. Revenue (USD million) and AGR (%), 2016 - 2019
Table 10.16 Proton Power Systems PLC (Company Details)
Table 10.17 Proton Power Systems PLC Revenue (USD million) and AGR (%), 2016 - 2018
Table 10.18 PowerCell Sweden AB (Company Details)
Table 10.19 PowerCell Sweden AB Revenue (USD million) and AGR (%), 2016 - 2019
List of Figures
Figure 2.1 Market Segmentation of Global Automotive Fuel Cell Market
Figure 2.2 How Do Fuel Cell Electric Vehicles Work Using Hydrogen?
Figure 2.3 PEMFC
Figure 2.4 SOFC
Figure 2.5 DMFC
Figure 3.1 Global Automotive Fuel Cell Market Forecast (US$ Million), 2029-2030
Figure 3.2 Global Automotive Fuel Cell Market AGR Forecast (AGR %), 2020-2030
Figure 3.3 Global Automotive Fuel Cell Market Drivers & Restraints 2020
Figure 3.4 Toyota FCEV Sales Unit, Global v/s Japan, 2016-2019
Figure 3.5 Fuel Cell Vehicle Sales Units, 2019-2024
Figure 3.6 Global Electric Vehicle Sales Volume Forecast in Million Units, 2018-2030
Figure 3.7 Global Electric Vehicle Sales Volume Forecast by Vehicle Type in Million Units, 2018-2030
Figure 3.8 Global Electric Vehicles Sales Volume Share by Region, 2018 (%)
Figure 3.9 Hydrogen Mobility Europe Project
Figure 3.10 The Fuel Cell Life Cycle and Value Chain
Figure: 3.11 Five Forces Analysis of Global Automotive Fuel Cell Market 2020-2030
Figure 4.1 Global Automotive Fuel Cell Market by Electrolyte Type, Value AGR Forecast 2020-2030 (AGR %) Before COVID-19
Figure 4.2 Global Automotive Fuel Cell Market by Electrolyte Type, Value AGR Forecast 2020-2030 (AGR %) After COVID-19 (V Shaped)
Figure 4.3 Global Automotive Fuel Cell Market by Electrolyte Type, Value AGR Forecast 2020-2030 (AGR %) After COVID-19 (U Shaped)
Figure 4.4 Global Automotive Fuel Cell Market by Electrolyte Type, Value AGR Forecast 2020-2030 (AGR %) After COVID-19 (L Shaped)
Figure 4.5 Global Automotive Fuel Cell Market by Electrolyte Type, Value AGR Forecast 2020-2030 (AGR %) After COVID-19 (W Shaped)
Figure 4.6 Global Automotive Fuel Cell Market by Electrolyte Type Forecast 2020-2030 (US$ Million, Global AGR %) Before COVID-19
Figure 4.7 Global Automotive Fuel Cell Market by Electrolyte Type Forecast 2020-2030 (US$ Million, Global AGR %) After COVID-19 (V Shaped)
Figure 4.8 Global Automotive Fuel Cell Market by Electrolyte Type Forecast 2020-2030 (US$ Million, Global AGR %) After COVID-19 (U Shaped)
Figure 4.9 Global Automotive Fuel Cell Market by Electrolyte Type Forecast 2020-2030 (US$ Million, Global AGR %) After COVID-19 (L Shaped)
Figure 4.10 Global Automotive Fuel Cell Market by Electrolyte Type Forecast 2020-2030 (US$ Million, Global AGR %) After COVID-19 (W Shaped)
Figure 4.11 Global Automotive Fuel Cell Market by Electrolyte Type, Value CAGR, 2020-2030 (CAGR %) Before COVID-19
Figure 4.12 Global Automotive Fuel Cell Market by Electrolyte Type, Value CAGR, 2020-2030 (CAGR %) After COVID-19 (V Shaped)
Figure 4.13 Global Automotive Fuel Cell Market by Electrolyte Type, Value CAGR, 2020-2030 (CAGR %) After COVID-19 (U Shaped)
Figure 4.14 Global Automotive Fuel Cell Market by Electrolyte Type, Value CAGR, 2020-2030 (CAGR %) After COVID-19 (L Shaped)
Figure 4.15 Global Automotive Fuel Cell Market by Electrolyte Type, Value CAGR, 2020-2030 (CAGR %) After COVID-19 (W Shaped)
Figure 4.16 Global Automotive Fuel Cell Market by Electrolyte Type Value Share Forecast 2019, 2025, 2030 (%) Before COVID-19
Figure 5.1 Global Automotive Fuel Cell Market by Component Type, Value AGR Forecast 2020-2030 (AGR %) Before COVID-19
Figure 5.2 Global Automotive Fuel Cell Market by Component Type, Value AGR Forecast 2020-2030 (AGR %) After COVID-19 (V Shaped)
Figure 5.3 Global Automotive Fuel Cell Market by Component Type, Value AGR Forecast 2020-2030 (AGR %) After COVID-19 (U Shaped)
Figure 5.4 Global Automotive Fuel Cell Market by Component Type, Value AGR Forecast 2020-2030 (AGR %) After COVID-19 (L Shaped)
Figure 5.5 Global Automotive Fuel Cell Market by Component Type, Value AGR Forecast 2020-2030 (AGR %) After COVID-19 (W Shaped)
Figure 5.6 Global Automotive Fuel Cell Market by Component Type Forecast 2020-2030 (US$ Million, Global AGR %) Before COVID-19
Figure 5.7 Global Automotive Fuel Cell Market by Component Type Forecast 2020-2030 (US$ Million, Global AGR %) After COVID-19 (V Shaped)
Figure 5.8 Global Automotive Fuel Cell Market by Component Type Forecast 2020-2030 (US$ Million, Global AGR %) After COVID-19 (U Shaped)
Figure 5.9 Global Automotive Fuel Cell Market by Component Type Forecast 2020-2030 (US$ Million, Global AGR %) After COVID-19 (L Shaped)
Figure 5.10 Global Automotive Fuel Cell Market by Component Type Forecast 2020-2030 (US$ Million, Global AGR %) After COVID-19 (W Shaped)
Figure 5.11 Global Automotive Fuel Cell Market by Component Type, Value CAGR, 2020-2030 (CAGR %) Before COVID-19
Figure 5.12 Global Automotive Fuel Cell Market by Component Type, Value CAGR, 2020-2030 (CAGR %) After COVID-19 (V Shaped)
Figure 5.13 Global Automotive Fuel Cell Market by Component Type, Value CAGR, 2020-2030 (CAGR %) After COVID-19 (U Shaped)
Figure 5.14 Global Automotive Fuel Cell Market by Component Type, Value CAGR, 2020-2030 (CAGR %) After COVID-19 (L Shaped)
Figure 5.15 Global Automotive Fuel Cell Market by Component Type, Value CAGR, 2020-2030 (CAGR %) After COVID-19 (W Shaped)
Figure 5.16 Global Automotive Fuel Cell Market by Component Type Value Share Forecast 2019, 2025, 2030 (%) Before COVID-19
Figure 6.1 Global Automotive Fuel Cell Market by Power Output, Value AGR Forecast 2020-2030 (AGR %) Before COVID-19
Figure 6.2 Global Automotive Fuel Cell Market by Power Output, Value AGR Forecast 2020-2030 (AGR %) After COVID-19 (V Shaped)
Figure 6.3 Global Automotive Fuel Cell Market by Power Output, Value AGR Forecast 2020-2030 (AGR %) After COVID-19 (U Shaped)
Figure 6.4 Global Automotive Fuel Cell Market by Power Output, Value AGR Forecast 2020-2030 (AGR %) After COVID-19 (L Shaped)
Figure 6.5 Global Automotive Fuel Cell Market by Power Output, Value AGR Forecast 2020-2030 (AGR %) After COVID-19 (W Shaped)
Figure 6.6 Global Automotive Fuel Cell Market by Power Output Forecast 2020-2030 (US$ Million, Global AGR %) Before COVID-19
Figure 6.7 Global Automotive Fuel Cell Market by Power Output Forecast 2020-2030 (US$ Million, Global AGR %) After COVID-19 (V Shaped)
Figure 6.8 Global Automotive Fuel Cell Market by Power Output Forecast 2020-2030 (US$ Million, Global AGR %) After COVID-19 (U Shaped)
Figure 6.9 Global Automotive Fuel Cell Market by Power Output Forecast 2020-2030 (US$ Million, Global AGR %) After COVID-19 (L Shaped)
Figure 6.10 Global Automotive Fuel Cell Market by Power Output Forecast 2020-2030 (US$ Million, Global AGR %) After COVID-19 (W Shaped)
Figure 6.11 Global Automotive Fuel Cell Market by Power Output, Value CAGR, 2020-2030 (CAGR %) Before COVID-19
Figure 6.12 Global Automotive Fuel Cell Market by Power Output, Value CAGR, 2020-2030 (CAGR %) After COVID-19 (V Shaped)
Figure 6.13 Global Automotive Fuel Cell Market by Power Output, Value CAGR, 2020-2030 (CAGR %) After COVID-19 (U Shaped)
Figure 6.14 Global Automotive Fuel Cell Market by Power Output, Value CAGR, 2020-2030 (CAGR %) After COVID-19 (L Shaped)
Figure 6.15 Global Automotive Fuel Cell Market by Power Output, Value CAGR, 2020-2030 (CAGR %) After COVID-19 (W Shaped)
Figure 6.16 Global Automotive Fuel Cell Market by Power Output Value Share Forecast 2019, 2025, 2030 (%) Before COVID-19
Figure 7.1 Global Automotive Fuel Cell Market by Vehicle Type, Value AGR Forecast 2020-2030 (AGR %) Before COVID-19
Figure 7.2 Global Automotive Fuel Cell Market by Vehicle Type, Value AGR Forecast 2020-2030 (AGR %) After COVID-19 (V Shaped)
Figure 7.3 Global Automotive Fuel Cell Market by Vehicle type, Value AGR Forecast 2020-2030 (AGR %) After COVID-19 (U Shaped)
Figure 7.4 Global Automotive Fuel Cell Market by Vehicle Type, Value AGR Forecast 2020-2030 (AGR %) After COVID-19 (L Shaped)
Figure 7.5 Global Automotive Fuel Cell Market by Vehicle Type, Value AGR Forecast 2020-2030 (AGR %) After COVID-19 (W Shaped)
Figure 7.6 Global Automotive Fuel Cell Market by Vehicle Type Forecast 2020-2030 (US$ Million, Global AGR %) Before COVID-19
Figure 7.7 Global Automotive Fuel Cell Market by Vehicle Type Forecast 2020-2030 (US$ Million, Global AGR %) After COVID-19 (V Shaped)
Figure 7.8 Global Automotive Fuel Cell Market by Vehicle Type Forecast 2020-2030 (US$ Million, Global AGR %) After COVID-19 (U Shaped)
Figure 7.9 Global Automotive Fuel Cell Market by Vehicle Type Forecast 2020-2030 (US$ Million, Global AGR %) After COVID-19 (L Shaped)
Figure 7.10 Global Automotive Fuel Cell Market by Vehicle Type Forecast 2020-2030 (US$ Million, Global AGR %) After COVID-19 (W Shaped)
Figure 7.11 Global Automotive Fuel Cell Market by Vehicle Type, Value CAGR, 2020-2030 (CAGR %) Before COVID-19
Figure 7.12 Global Automotive Fuel Cell Market by Vehicle Type, Value CAGR, 2020-2030 (CAGR %) After COVID-19 (V Shaped)
Figure 7.13 Global Automotive Fuel Cell Market by Vehicle Type, Value CAGR, 2020-2030 (CAGR %) After COVID-19 (U Shaped)
Figure 7.14 Global Automotive Fuel Cell Market by Vehicle Type, Value CAGR, 2020-2030 (CAGR %) After COVID-19 (L Shaped)
Figure 7.15 Global Automotive Fuel Cell Market by Vehicle Type, Value CAGR, 2020-2030 (CAGR %) After COVID-19 (W Shaped)
Figure 7.16 Global Automotive Fuel Cell Market by Vehicle Type Value Share Forecast 2019, 2025, 2030 (%) Before COVID
Figure 7.17 Global Fuel Cell Car Sales, 2019 (Units)
Figure 8.1 Global Automotive Fuel Cell Market by Country, Value CAGR, 2020-2030 (CAGR %) Before COVID-19
Figure 8.2 Global Automotive Fuel Cell Market by Region Value Share Forecast 2019, 2025, 2030 (%) Before COVID-19
Figure 8.3 North America Automotive Fuel Cell Market Revenue Analysis & Forecast (US$ Million, AGR%), 2020-2030 Before COVID-19
Figure 8.4 North America Automotive Fuel Cell Market Revenue Analysis & Forecast (US$ Million, AGR%), 2020-2030 After COVID-19 (V Shaped)
Figure 8.5 North America Automotive Fuel Cell Market Revenue Analysis & Forecast (US$ Million, AGR%), 2020-2030 After COVID-19 (U Shaped)
Figure 8.6 North America Automotive Fuel Cell Market Revenue Analysis & Forecast (US$ Million, AGR%), 2020-2030 After COVID-19 (L Shaped)
Figure 8.7 North America Automotive Fuel Cell Market Revenue Analysis & Forecast (US$ Million, AGR%), 2020-2030 After COVID-19 (W Shaped)
Figure 8.8 North America Automotive Fuel Cell Market by Electrolyte Type Forecast 2020-2030 (US$ Million, North America AGR %) Before COVID-19
Figure 8.9 North America Automotive Fuel Cell Market by Electrolyte Type Forecast 2020-2030 (US$ Million, North America AGR %) After COVID-19 (V Shaped)
Figure 8.10 North America Automotive Fuel Cell Market by Electrolyte Type Forecast 2020-2030 (US$ Million, North America AGR %) After COVID-19 (U Shaped)
Figure 8.11 North America Automotive Fuel Cell Market by Electrolyte Type Forecast 2020-2030 (US$ Million, North America AGR %) After COVID-19 (L Shaped)
Figure 8.12 North America Automotive Fuel Cell Market by Electrolyte Type Forecast 2020-2030 (US$ Million, North America AGR %) After COVID-19 (W Shaped)
Figure 8.13 North America Automotive Fuel Cell Market by Electrolyte Type, Value CAGR, 2020-2025, 2025-2030, 2020-2030 (CAGR %) Before COVID-19
Figure 8.14 North America Automotive Fuel Cell Market by Electrolyte Type, Value CAGR, 2020-2025, 2025-2030, 2020-2030 (CAGR %) After COVID-19 (V Shaped)
Figure 8.15 North America Automotive Fuel Cell Market by Electrolyte Type, Value CAGR, 2020-2025, 2025-2030, 2020-2030 (CAGR %) After COVID-19 (U Shaped)
Figure 8.16 North America Automotive Fuel Cell Market by Electrolyte Type, Value CAGR, 2020-2025, 2025-2030, 2020-2030 (CAGR %) After COVID-19 (L Shaped)
Figure 8.17 North America Automotive Fuel Cell Market by Electrolyte Type, Value CAGR, 2020-2025, 2025-2030, 2020-2030 (CAGR %) After COVID-19 (W Shaped)
Figure 8.18 North America Automotive Fuel Cell Market by Electrolyte Type Value Share Forecast 2019, 2025, 2030 (%) Before COVID-19
Figure 8.19 North America Automotive Fuel Cell Market by Component Type Forecast 2020-2030 (US$ Million, North America AGR %) Before COVID-19
Figure 8.20 North America Automotive Fuel Cell Market by Component Type Forecast 2020-2030 (US$ Million, North America AGR %) After COVID-19 (V Shaped)
Figure 8.21 North America Automotive Fuel Cell Market by Component Type Forecast 2020-2030 (US$ Million, North America AGR %) After COVID-19 (U Shaped)
Figure 8.22 North America Automotive Fuel Cell Market by Component Type Forecast 2020-2030 (US$ Million, North America AGR %) After COVID-19 (L Shaped)
Figure 8.23 North America Automotive Fuel Cell Market by Component Type Forecast 2020-2030 (US$ Million, North America AGR %) After COVID-19 (W Shaped)
Figure 8.24 North America Automotive Fuel Cell Market by Component Type, Value CAGR, 2020-2025, 2025-2030, 2020-2030 (CAGR %) Before COVID-19
Figure 8.25 North America Automotive Fuel Cell Market by Component Type, Value CAGR, 2020-2025, 2025-2030, 2020-2030 (CAGR %) After COVID-19 (V Shaped)
Figure 8.26 North America Automotive Fuel Cell Market by Component Type, Value CAGR, 2020-2025, 2025-2030, 2020-2030 (CAGR %) After COVID-19 (U Shaped)
Figure 8.27 North America Automotive Fuel Cell Market by Component Type, Value CAGR, 2020-2025, 2025-2030, 2020-2030 (CAGR %) After COVID-19 (L Shaped)
Figure 8.28 North America Automotive Fuel Cell Market by Component Type, Value CAGR, 2020-2025, 2025-2030, 2020-2030 (W Shaped)
Figure 8.29 North America Automotive Fuel Cell Market by Power Output Forecast 2020-2030 (US$ Million, North America AGR %) Before COVID-19
Figure 8.30 North America Automotive Fuel Cell Market by Power Output Forecast 2020-2030 (US$ Million, North America AGR %) After COVID-19 (V Shaped)
Figure 8.31 North America Automotive Fuel Cell Market by Power Output Forecast 2020-2030 (US$ Million, North America AGR %) After COVID-19 (U Shaped)
Figure 8.32 North America Automotive Fuel Cell Market by Power Output Forecast 2020-2030 (US$ Million, North America AGR %) After COVID-19 (L Shaped)
Figure 8.33 North America Automotive Fuel Cell Market by Power Output Forecast 2020-2030 (US$ Million, North America AGR %) After COVID-19 (W Shaped)
Figure 8.34 North America Automotive Fuel Cell Market by Power Output, Value CAGR, 2020-2030 (CAGR %) Before COVID-19
Figure 8.35 North America Automotive Fuel Cell Market by Power Output, Value CAGR, 2020-2030 (CAGR %) After COVID-19 (V Shaped)
Figure 8.36 North America Automotive Fuel Cell Market by Power Output, Value CAGR, 2020-2030 (CAGR %) After COVID-19 (U Shaped)
Figure 8.37 North America Automotive Fuel Cell Market by Power Output, Value CAGR, 2020-2030 (CAGR %) After COVID-19 (L Shaped)
Figure 8.38 North America Automotive Fuel Cell Market by Power Output, Value CAGR, 2020-2030 (CAGR %) After COVID-19 (W Shaped)
Figure 8.39 North America Automotive Fuel Cell Market by Power Output Value Share Forecast 2019, 2025, 2030 (%) Before COVID-19
Figure 8.40 North America Automotive Fuel Cell Market by Vehicle Type Forecast 2020-2030 (US$ Million, North America AGR %) Before COVID-19
Figure 8.41 North America Automotive Fuel Cell Market by Vehicle Type Forecast 2020-2030 (US$ Million, North America AGR %) After COVID-19 (V Shaped)
Figure 8.42 North America Automotive Fuel Cell Market by Vehicle Type Forecast 2020-2030 (US$ Million, North America AGR %) After COVID-19 (U Shaped)
Figure 8.43 North America Automotive Fuel Cell Market by Vehicle Type Forecast 2020-2030 (US$ Million, North America AGR %) After COVID-19 (L Shaped)
Figure 8.44 North America Automotive Fuel Cell Market by Vehicle Type Forecast 2020-2030 (US$ Million, North America AGR %) After COVID-19 (W Shaped)
Figure 8.45 North America Automotive Fuel Cell Market by Vehicle Type, Value CAGR, 2020-2025, 2025-2030, 2020-2030 (CAGR %) Before COVID-19
Figure 8.46 North America Automotive Fuel Cell Market by Vehicle Type, Value CAGR, 2020-2025, 2025-2030, 2020-2030 (CAGR %) After COVID-19 (V Shaped)
Figure 8.47 North America Automotive Fuel Cell Market by Vehicle Type, Value CAGR, 2020-2025, 2025-2030, 2020-2030 (CAGR %) After COVID-19 (U Shaped)
Figure 8.48 North America Automotive Fuel Cell Market by Vehicle Type, Value CAGR, 2020-2025, 2025-2030, 2020-2030 (CAGR %) After COVID-19 (L Shaped)
Figure 8.49 North America Automotive Fuel Cell Market by Vehicle Type, Value CAGR, 2020-2025, 2025-2030, 2020-2030 (CAGR %) After COVID-19 (W Shaped)
Figure 8.50 North America Automotive Fuel Cell Market by Vehicle Type Value Share Forecast 2019, 2025, 2030 (%) Before COVID
Figure 8.51 North America Automotive Fuel Cell Market by Country Forecast 2020-2030 (US$ Million, North America AGR %) Before COVID-19
Figure 7.52 North America Automotive Fuel Cell Market by Country Forecast 2020-2030 (US$ Million, North America AGR %) After COVID-19 (V Shaped)
Figure 8.53 North America Automotive Fuel Cell Market by Country Forecast 2020-2030 (US$ Million, North America AGR %) After COVID-19 (U Shaped)
Figure 8.54 North America Automotive Fuel Cell Market by Country Forecast 2020-2030 (US$ Million, North America AGR %) After COVID-19 (L Shaped)
Figure 8.55 North America Automotive Fuel Cell Market by Country Forecast 2020-2030 (US$ Million, North America AGR %) After COVID-19 (W Shaped)
Figure 8.56 North America Automotive Fuel Cell Market by Country, Value CAGR, 2020-2025, 2025-2030, 2020-2030 (CAGR %) Before COVID-19
Figure 8.57 North America Automotive Fuel Cell Market by Country, Value CAGR, 2020-2025, 2025-2030, 2020-2030 (CAGR %) After COVID-19 (V Shaped)
Figure 8.58 North America Automotive Fuel Cell Market by Country, Value CAGR, 2020-2025, 2025-2030, 2020-2030 (CAGR %) After COVID-19 (U Shaped)
Figure 8.59 North America Automotive Fuel Cell Market by Country, Value CAGR, 2020-2025, 2025-2030, 2020-2030 (CAGR %) After COVID-19 (L Shaped)
Figure 8.60 North America Automotive Fuel Cell Market by Country, Value CAGR, 2020-2025, 2025-2030, 2020-2030 (CAGR %) After COVID-19 (W Shaped)
Figure 8.61 North America Automotive Fuel Cell Market by Country Value Share Forecast 2019, 2025, 2030 (%) Before COVID-19
Figure 8.62 Europe Automotive Fuel Cell Market Revenue Analysis & Forecast (US$ Million, AGR%), 2020-2030 Before COVID-19
Figure 8.63 Europe Automotive Fuel Cell Market Revenue Analysis & Forecast (US$ Million, AGR%), 2020-2030 After COVID-19 (V Shaped)
Figure 8.64 Europe Automotive Fuel Cell Market Revenue Analysis & Forecast (US$ Million, AGR%), 2020-2030 After COVID-19 (U Shaped)
Figure 8.65 Europe Automotive Fuel Cell Market Revenue Analysis & Forecast (US$ Million, AGR%), 2020-2030 After COVID-19 (L Shaped)
Figure 8.66 Europe Automotive Fuel Cell Market Revenue Analysis & Forecast (US$ Million, AGR%), 2020-2030 After COVID-19 (W Shaped)
Figure 8.67 Europe Automotive Fuel Cell Market by Electrolyte Type Forecast 2020-2030 (US$ Million, Europe AGR %) Before COVID-19
Figure 8.68 Europe Automotive Fuel Cell Market by Electrolyte Type Forecast 2020-2030 (US$ Million, Europe AGR %) After COVID-19 (V Shaped)
Figure 8.69 Europe Automotive Fuel Cell Market by Electrolyte Type Forecast 2020-2030 (US$ Million, Europe AGR %) After COVID-19 (U Shaped)
Figure 8.70 Europe Automotive Fuel Cell Market by Electrolyte Type Forecast 2020-2030 (US$ Million, Europe AGR %) After COVID-19 (L Shaped)
Figure 8.71 Europe Automotive Fuel Cell Market by Electrolyte Type Forecast 2020-2030 (US$ Million, Europe AGR %) After COVID-19 (W Shaped)
Figure 8.72 Europe Automotive Fuel Cell Market by Electrolyte Type, Value CAGR, 2020-2025, 2025-2030, 2020-2030 (CAGR %) Before COVID-19
Figure 8.73 Europe Automotive Fuel Cell Market by Electrolyte Type, Value CAGR, 2020-2025, 2025-2030, 2020-2030 (CAGR %) After COVID-19 (V Shaped)
Figure 8.74 Europe Automotive Fuel Cell Market by Electrolyte Type, Value CAGR, 2020-2025, 2025-2030, 2020-2030 (CAGR %) After COVID-19 (U Shaped)
Figure 8.75 Europe Automotive Fuel Cell Market by Electrolyte Type, Value CAGR, 2020-2025, 2025-2030, 2020-2030 (CAGR %) After COVID-19 (L Shaped)
Figure 8.76 Europe Automotive Fuel Cell Market by Electrolyte Type, Value CAGR, 2020-2025, 2025-2030, 2020-2030 (CAGR %) After COVID-19 (W Shaped)
Figure 8.77 Europe Automotive Fuel Cell Market by Electrolyte Type Value Share Forecast 2019, 2025, 2030 (%) Before COVID-19
Figure 8.78 Europe Automotive Fuel Cell Market by Component Type Forecast 2020-2030 (US$ Million, Europe AGR %) Before COVID-19
Figure 8.79 Europe Automotive Fuel Cell Market by Component Type Forecast 2020-2030 (US$ Million, Europe AGR %) After COVID-19 (V Shaped)
Figure 8.80 Europe Automotive Fuel Cell Market by Component Type Forecast 2020-2030 (US$ Million, Europe AGR %) After COVID-19 (U Shaped)
Figure 8.81 Europe Automotive Fuel Cell Market by Component Type Forecast 2020-2030 (US$ Million, Europe AGR %) After COVID-19 (L Shaped)
Figure 8.82 Europe Automotive Fuel Cell Market by Component Type Forecast 2020-2030 (US$ Million, Europe AGR %) After COVID-19 (W Shaped)
Figure 8.83 Europe Automotive Fuel Cell Market by Component Type, Value CAGR, 2020-2025, 2025-2030, 2020-2030 (CAGR %) Before COVID-19
Figure 8.84 Europe Automotive Fuel Cell Market by Component Type, Value CAGR, 2020-2025, 2025-2030, 2020-2030 (CAGR %) After COVID-19 (V Shaped)
Figure 8.85 Europe Automotive Fuel Cell Market by Component Type, Value CAGR, 2020-2025, 2025-2030, 2020-2030 (CAGR %) After COVID-19 (U Shaped)
Figure 8.86 Europe Automotive Fuel Cell Market by Component Type, Value CAGR, 2020-2025, 2025-2030, 2020-2030 (CAGR %) After COVID-19 (L Shaped)
Figure 8.87 Europe Automotive Fuel Cell Market by Component Type, Value CAGR, 2020-2025, 2025-2030, 2020-2030 (W Shaped)
Figure 8.88 Europe Automotive Fuel Cell Market by Power Output Forecast 2020-2030 (US$ Million, Europe AGR %) Before COVID-19
Figure 8.89 Europe Automotive Fuel Cell Market by Power Output Forecast 2020-2030 (US$ Million, Europe AGR %) After COVID-19 (V Shaped)
Figure 8.90 Europe Automotive Fuel Cell Market by Power Output Forecast 2020-2030 (US$ Million, Europe AGR %) After COVID-19 (U Shaped)
Figure 8.91 Europe Automotive Fuel Cell Market by Power Output Forecast 2020-2030 (US$ Million, Europe AGR %) After COVID-19 (L Shaped)
Figure 8.92 Europe Automotive Fuel Cell Market by Power Output Forecast 2020-2030 (US$ Million, Europe AGR %) After COVID-19 (W Shaped)
Figure 8.93 Europe Automotive Fuel Cell Market by Power Output, Value CAGR, 2020-2030 (CAGR %) Before COVID-19
Figure 8.94 Europe Automotive Fuel Cell Market by Power Output, Value CAGR, 2020-2030 (CAGR %) After COVID-19 (V Shaped)
Figure 8.95 Europe Automotive Fuel Cell Market by Power Output, Value CAGR, 2020-2030 (CAGR %) After COVID-19 (U Shaped)
Figure 8.96 Europe Automotive Fuel Cell Market by Power Output, Value CAGR, 2020-2030 (CAGR %) After COVID-19 (L Shaped)
Figure 8.97 Europe Automotive Fuel Cell Market by Power Output, Value CAGR, 2020-2030 (CAGR %) After COVID-19 (W Shaped)
Figure 8.98 Europe Automotive Fuel Cell Market by Power Output Value Share Forecast 2019, 2025, 2030 (%) Before COVID-19
Figure 8.99 Europe Automotive Fuel Cell Market by Vehicle Type Forecast 2020-2030 (US$ Million, Europe AGR %) Before COVID-19
Figure 8.100 Europe Automotive Fuel Cell Market by Vehicle Type Forecast 2020-2030 (US$ Million, Europe AGR %) After COVID-19 (V Shaped)
Figure 8.101 Europe Automotive Fuel Cell Market by Vehicle Type Forecast 2020-2030 (US$ Million, Europe AGR %) After COVID-19 (U Shaped)
Figure 8.102 Europe Automotive Fuel Cell Market by Vehicle Type Forecast 2020-2030 (US$ Million, Europe AGR %) After COVID-19 (L Shaped)
Figure 8.103 Europe Automotive Fuel Cell Market by Vehicle Type Forecast 2020-2030 (US$ Million, Europe AGR %) After COVID-19 (W Shaped)
Figure 8.104 Europe Automotive Fuel Cell Market by Vehicle Type, Value CAGR, 2020-2025, 2025-2030, 2020-2030 (CAGR %) Before COVID-19
Figure 8.105 Europe Automotive Fuel Cell Market by Vehicle Type, Value CAGR, 2020-2025, 2025-2030, 2020-2030 (CAGR %) After COVID-19 (V Shaped)
Figure 8.106 Europe Automotive Fuel Cell Market by Vehicle Type, Value CAGR, 2020-2025, 2025-2030, 2020-2030 (CAGR %) After COVID-19 (U Shaped)
Figure 8.107 Europe Automotive Fuel Cell Market by Vehicle Type, Value CAGR, 2020-2025, 2025-2030, 2020-2030 (CAGR %) After COVID-19 (L Shaped)
Figure 8.108 Europe Automotive Fuel Cell Market by Vehicle Type, Value CAGR, 2020-2025, 2025-2030, 2020-2030 (CAGR %) After COVID-19 (W Shaped)
Figure 8.109 Europe Automotive Fuel Cell Market by Vehicle Type Value Share Forecast 2019, 2025, 2030 (%) Before COVID-19
Figure 8.110 Europe Automotive Fuel Cell Market by Country Forecast 2020-2030 (US$ Million, Europe AGR %) Before COVID-19
Figure 8.111 Europe Automotive Fuel Cell Market by Country Forecast 2020-2030 (US$ Million, Europe AGR %) After COVID-19 (V Shaped)
Figure 8.112 Europe Automotive Fuel Cell Market by Country Forecast 2020-2030 (US$ Million, Europe AGR %) After COVID-19 (U Shaped)
Figure 8.113 Europe Automotive Fuel Cell Market by Country Forecast 2020-2030 (US$ Million, Europe AGR %) After COVID-19 (L Shaped)
Figure 8.114 Europe Automotive Fuel Cell Market by Country Forecast 2020-2030 (US$ Million, Europe AGR %) After COVID-19 (W Shaped)
Figure 8.115 Europe Automotive Fuel Cell Market by Country, Value CAGR, 2020-2030 (CAGR %) Before COVID-19
Figure 8.116 Europe Automotive Fuel Cell Market by Country, Value CAGR, 2020-2030 (CAGR %) After COVID-19 (V Shaped)
Figure 8.117 Europe Automotive Fuel Cell Market by Country, Value CAGR, 2020-2030 (CAGR %) After COVID-19 (U Shaped)
Figure 8.118 Europe Automotive Fuel Cell Market by Country, Value CAGR, 2020-2030 (CAGR %) After COVID-19 (L Shaped)
Figure 8.119 Europe Automotive Fuel Cell Market by Country, Value CAGR, 2020-2030 (CAGR %) After COVID-19 (W Shaped)
Figure 8.120 Europe Automotive Fuel Cell Market by Country Value Share Forecast 2019, 2025, 2030 (%) Before COVID-19
Figure 8.121 APAC Automotive Fuel Cell Market Revenue Analysis & Forecast (US$ Million, AGR%), 2020-2030 Before COVID-19
Figure 8.122 APAC Automotive Fuel Cell Market Revenue Analysis & Forecast (US$ Million, AGR%), 2020-2030 After COVID-19 (V Shaped)
Figure 8.123 APAC Automotive Fuel Cell Market Revenue Analysis & Forecast (US$ Million, AGR%), 2020-2030 After COVID-19 (U Shaped)
Figure 8.124 APAC Automotive Fuel Cell Market Revenue Analysis & Forecast (US$ Million, AGR%), 2020-2030 After COVID-19 (L Shaped)
Figure 8.125 APAC Automotive Fuel Cell Market Revenue Analysis & Forecast (US$ Million, AGR%), 2020-2030 After COVID-19 (W Shaped)
Figure 8.126 APAC Automotive Fuel Cell Market by Electrolyte Type Forecast 2020-2030 (US$ Million, APAC AGR %) Before COVID-19
Figure 8.127 APAC Automotive Fuel Cell Market by Electrolyte Type Forecast 2020-2030 (US$ Million, APAC AGR %) After COVID-19 (V Shaped)
Figure 8.128 APAC Automotive Fuel Cell Market by Electrolyte Type Forecast 2020-2030 (US$ Million, APAC AGR %) After COVID-19 (U Shaped)
Figure 8.129 APAC Automotive Fuel Cell Market by Electrolyte Type Forecast 2020-2030 (US$ Million, APAC AGR %) After COVID-19 (L Shaped)
Figure 8.130 APAC Automotive Fuel Cell Market by Electrolyte Type Forecast 2020-2030 (US$ Million, APAC AGR %) After COVID-19 (W Shaped)
Figure 8.131 APAC Automotive Fuel Cell Market by Electrolyte Type, Value CAGR, 2020-2025, 2025-2030, 2020-2030 (CAGR %) Before COVID-19
Figure 8.132 APAC Automotive Fuel Cell Market by Electrolyte Type, Value CAGR, 2020-2025, 2025-2030, 2020-2030 (CAGR %) After COVID-19 (V Shaped)
Figure 8.133 APAC Automotive Fuel Cell Market by Electrolyte Type, Value CAGR, 2020-2025, 2025-2030, 2020-2030 (CAGR %) After COVID-19 (U Shaped)
Figure 8.134 APAC Automotive Fuel Cell Market by Electrolyte Type, Value CAGR, 2020-2025, 2025-2030, 2020-2030 (CAGR %) After COVID-19 (L Shaped)
Figure 8.135 APAC Automotive Fuel Cell Market by Electrolyte Type, Value CAGR, 2020-2025, 2025-2030, 2020-2030 (CAGR %) After COVID-19 (W Shaped)
Figure 8.136 APAC Automotive Fuel Cell Market by Electrolyte Type Value Share Forecast 2019, 2025, 2030 (%) Before COVID-19
Figure 8.137 APAC Automotive Fuel Cell Market by Component Type Forecast 2020-2030 (US$ Million, APAC AGR %) Before COVID-19
Figure 8.138 APAC Automotive Fuel Cell Market by Component Type Forecast 2020-2030 (US$ Million, APAC AGR %) After COVID-19 (V Shaped)
Figure 8.139 APAC Automotive Fuel Cell Market by Component Type Forecast 2020-2030 (US$ Million, APAC AGR %) After COVID-19 (U Shaped)
Figure 8.140 APAC Automotive Fuel Cell Market by Component Type Forecast 2020-2030 (US$ Million, APAC AGR %) After COVID-19 (L Shaped)
Figure 8.141 APAC Automotive Fuel Cell Market by Component Type Forecast 2020-2030 (US$ Million, APAC AGR %) After COVID-19 (W Shaped)
Figure 8.142 APAC Automotive Fuel Cell Market by Component Type, Value CAGR, 2020-2025, 2025-2030, 2020-2030 (CAGR %) Before COVID-19
Figure 8.143 APAC Automotive Fuel Cell Market by Component Type, Value CAGR, 2020-2025, 2025-2030, 2020-2030 (CAGR %) After COVID-19 (V Shaped)
Figure 8.144 APAC Automotive Fuel Cell Market by Component Type, Value CAGR, 2020-2025, 2025-2030, 2020-2030 (CAGR %) After COVID-19 (U Shaped)
Figure 8.145 APAC Automotive Fuel Cell Market by Component Type, Value CAGR, 2020-2025, 2025-2030, 2020-2030 (CAGR %) After COVID-19 (L Shaped)
Figure 8.146 APAC Automotive Fuel Cell Market by Component Type, Value CAGR, 2020-2025, 2025-2030, 2020-2030 (W Shaped)
Figure 8.147 APAC Automotive Fuel Cell Market by Power Output Forecast 2020-2030 (US$ Million, APAC AGR %) Before COVID-19
Figure 8.148 APAC Automotive Fuel Cell Market by Power Output Forecast 2020-2030 (US$ Million, APAC AGR %) After COVID-19 (V Shaped)
Figure 8.149 APAC Automotive Fuel Cell Market by Power Output Forecast 2020-2030 (US$ Million, APAC AGR %) After COVID-19 (U Shaped)
Figure 8.150 APAC Automotive Fuel Cell Market by Power Output Forecast 2020-2030 (US$ Million, APAC AGR %) After COVID-19 (L Shaped)
Figure 8.151 APAC Automotive Fuel Cell Market by Power Output Forecast 2020-2030 (US$ Million, APAC AGR %) After COVID-19 (W Shaped)
Figure 8.152 APAC Automotive Fuel Cell Market by Power Output, Value CAGR, 2020-2030 (CAGR %) Before COVID-19
Figure 8.153 APAC Automotive Fuel Cell Market by Power Output, Value CAGR, 2020-2030 (CAGR %) After COVID-19 (V Shaped)
Figure 8.154 APAC Automotive Fuel Cell Market by Power Output, Value CAGR, 2020-2030 (CAGR %) After COVID-19 (U Shaped)
Figure 8.155 APAC Automotive Fuel Cell Market by Power Output, Value CAGR, 2020-2030 (CAGR %) After COVID-19 (L Shaped)
Figure 8.156 APAC Automotive Fuel Cell Market by Power Output, Value CAGR, 2020-2030 (CAGR %) After COVID-19 (W Shaped)
Figure 8.157 APAC Automotive Fuel Cell Market by Power Output Value Share Forecast 2019, 2025, 2030 (%) Before COVID-19
Figure 8.158 APAC Automotive Fuel Cell Market by Vehicle Type Forecast 2020-2030 (US$ Million, APAC AGR %) Before COVID-19
Figure 8.159 APAC Automotive Fuel Cell Market by Vehicle Type Forecast 2020-2030 (US$ Million, APAC AGR %) After COVID-19 (V Shaped)
Figure 8.160 APAC Automotive Fuel Cell Market by Vehicle Type Forecast 2020-2030 (US$ Million, APAC AGR %) After COVID-19 (U Shaped)
Figure 8.161 APAC Automotive Fuel Cell Market by Vehicle Type Forecast 2020-2030 (US$ Million, APAC AGR %) After COVID-19 (L Shaped)
Figure 8.162 APAC Automotive Fuel Cell Market by Vehicle Type Forecast 2020-2030 (US$ Million, APAC AGR %) After COVID-19 (W Shaped)
Figure 8.163 APAC Automotive Fuel Cell Market by Vehicle Type, Value CAGR, 2020-2025, 2025-2030, 2020-2030 (CAGR %) Before COVID-19
Figure 8.164 APAC Automotive Fuel Cell Market by Vehicle Type, Value CAGR, 2020-2025, 2025-2030, 2020-2030 (CAGR %) After COVID-19 (V Shaped)
Figure 8.165 APAC Automotive Fuel Cell Market by Vehicle Type, Value CAGR, 2020-2025, 2025-2030, 2020-2030 (CAGR %) After COVID-19 (U Shaped)
Figure 8.166 APAC Automotive Fuel Cell Market by Vehicle Type, Value CAGR, 2020-2025, 2025-2030, 2020-2030 (CAGR %) After COVID-19 (L Shaped)
Figure 8.167 APAC Automotive Fuel Cell Market by Vehicle Type, Value CAGR, 2020-2025, 2025-2030, 2020-2030 (CAGR %) After COVID-19 (W Shaped)
Figure 8.168 APAC Automotive Fuel Cell Market by Vehicle Type Value Share Forecast 2019, 2025, 2030 (%) Before COVID-19
Figure 8.169 APAC Automotive Fuel Cell Market by Country Forecast 2020-2030 (US$ Million, Europe AGR %) Before COVID-19
Figure 8.170 APAC Automotive Fuel Cell Market by Country Forecast 2020-2030 (US$ Million, Europe AGR %) After COVID-19 (V Shaped)
Figure 8.171 APAC Automotive Fuel Cell Market by Country Forecast 2020-2030 (US$ Million, Europe AGR %) After COVID-19 (U Shaped)
Figure 8.172 APAC Automotive Fuel Cell Market by Country Forecast 2020-2030 (US$ Million, Europe AGR %) After COVID-19 (L Shaped)
Figure 8.173 APAC Automotive Fuel Cell Market by Country Forecast 2020-2030 (US$ Million, Europe AGR %) After COVID-19 (W Shaped)
Figure 8.174 APAC Automotive Fuel Cell Market by Country, Value CAGR, 2020-2030 (CAGR %) Before COVID-19
Figure 8.175 APAC Automotive Fuel Cell Market by Country, Value CAGR, 2020-2030 (CAGR %) After COVID-19 (V Shaped)
Figure 8.176 APAC Automotive Fuel Cell Market by Country, Value CAGR, 2020-2030 (CAGR %) After COVID-19 (U Shaped)
Figure 8.177 APAC Automotive Fuel Cell Market by Country, Value CAGR, 2020-2030 (CAGR %) After COVID-19 (L Shaped)
Figure 8.178 APAC Automotive Fuel Cell Market by Country, Value CAGR, 2020-2030 (CAGR %) After COVID-19 (W Shaped)
Figure 8.179 APAC Automotive Fuel Cell Market by Country Value Share Forecast 2019, 2025, 2030 (%) Before COVID-19
Figure 10.1 Ballard Power Systems Inc. Revenue, 2017 - 2019 (USD million)
Figure 10.2 Cares Power Ltd. Revenue, 2016 - 2019 (USD million)
Figure 10.3 Hydrogenics Corporation Revenue, 2017 - 2018 (USD Billion)
Figure 10.4 Hydrogenics Corporation Revenue Share, by Region, 2018 (%)
Figure 10.5 Hydrogenics Corporation Revenue Share, by Segment, 2018 (%)
Figure 10.6 ITM Power Plc Revenue, 2016 - 2019 (USD Billion)
Figure 10.7 ITM Power Plc Revenue Share, by Region, 2018 and 2019 (%)
Figure 10.8 ITM Power Plc Revenue Share, by Segment, 2018 and 2019 (%)
Figure 10.9 SFC Energy AG Revenue, 2016 - 2018 (USD million)
Figure 10.10 SFC Energy AG Revenue Share, by Business Segment, 2018 and 2019 (%)
Figure 10.11 SFC Energy AG Revenue Share, by Region, 2018 and 2019 (%)
Figure 10.12 Plug Power Inc. Revenue, 2016- 2019 (USD million)
Figure 10.13 Plug Power Inc. Revenue Share, by Business Segment, 2018 and 2019 (%)
Figure 10.14 Proton Power Systems PLC Revenue, 2016 - 2018 (USD million)
Figure 10.15 Proton Power Systems PLC Revenue Share, by Region, 2017 and 2018 (%)
Figure 10.16 PowerCell Sweden AB Revenue, 2016 - 2019 (USD million)
Figure 10.17 PowerCell Sweden AB Revenue Share, by Business Segment, 2018 and 2019 (%)
Figure 10.18 PowerCell Sweden AB Revenue Share, by Region, 2018 and 2019 (%)
Figure 11.1 Global Automotive Fuel Cell Market by Electrolyte Type Value Share 2020 (%)
Figure 11.2 Global Automotive Fuel Cell Market by Component Type Value Share 2020 (%)
Figure 11.3 Global Automotive Fuel Cell Market by Power Output Value Share 2020 (%)
Figure 11.4 Global Automotive Fuel Cell Market by Vehicle Type Value Share 2020 (%)
Figure 11.5 Global Automotive Fuel Cell Market by Region Value Share 2020 (%)
Figure 11.6 Global Automotive Fuel Cell Market by Countries Value Share 2020 (%)
Ballard Power Systems
Bosch
Ceres Power
Dana Incorporated
Delphi Technologies
Doosan Fuel Cell America
Elringklinger AG
Fuel Cell System Manufacturing LLC
FuelCell Energy
Hydrogenics Corporation
Hyundai Kefico Corporation
Intelligent Energy
ITM Power Plc
Nedstack Fuel Cell Technology BV
NUVERA
Panasonic
Plug Power Inc.
Powercell
PowerCell Sweden AB
Proton Power Systems plc
SFC Energy AG
Sunrise Power Co., LTD.
Swiss Hydrogen Power
Symbio
Toray Industries
Organisations mentioned
European Union
German Association of the Automotive Industry (VDA)
NASA
OICA
The U.S. Department of Energy
Download sample pages
Complete the form below to download your free sample pages for Automotive Fuel Cell Market Report 2020-2030
Related reports
-

Automotive Camera Market Report 2020-2030
Increase in demand for advanced driver assistance system in vehicles, growing development for driver comfort system, government mandates for the...
Full DetailsPublished: 01 January 1970 -

Automotive Blockchain Market Report 2020-2030
The global market for automotive blockchain is projected to grow with a CAGR of 31.1% during the forecast period from...
Full DetailsPublished: 01 January 1970 -

Automotive Cyber Security Market Report 2018-2028
The Automotive Cyber Security Market Report 2018-2028: evaluates the market drivers and technological solutions essential to the protection of the...
Full DetailsPublished: 18 June 2018 -
Flat Lithium-ion Battery Market Report 2020-2030
Factors Driving the Market Growth:
- Growth in E-Commerce Industry
- Development of Battery-Operated Equipment for Mining Industry
- Replacement...Full DetailsPublished: 01 January 1970 -
Lithium-Ion Battery Market Report 2020-2030
Visiongain values the lithium-ion battery market at $43.8bn in 2019.
...Full DetailsPublished: 30 March 2020 -

Automotive Chassis Market Report 2020-2030
The global market for automotive chassis is expected to grow with the healthy CAGR of 5.1% during the forecast period...
Full DetailsPublished: 01 January 1970 -

Lithium Iron Phosphate Battery Market Report 2020-2030
Are you aware that global Lithium Iron Phosphate Battery market spending reached $7,284.4 million in 2019? ...Full DetailsPublished: 27 March 2020 -
Gigafactory Market Report 2020-2030
Recent rapid improvements in lithium-ion (Li-ion) battery costs and performance, coupled with growing demand for electric vehicles (EVs) and increased...
Full DetailsPublished: 09 September 2020 -

Battery Management System Market Report 2019-2029
This latest report by business intelligence provider Visiongain assesses that Battery Management System Market spending will reach $3.87 bn in...
Full DetailsPublished: 01 January 1970 -

Automotive Software Market Report 2020-2030
As part of the broader $19.55 billion automotive software market space, there are massive revenue streams within Telematics Systems segment...
Full DetailsPublished: 23 April 2020
Download sample pages
Complete the form below to download your free sample pages for Automotive Fuel Cell Market Report 2020-2030
Do you have any custom requirements we can help you with?
Any specific country, geo region, market segment or specific company information?
Email us today, we can discuss your needs and see how we can help: jamie.roberts@visiongain.com
Would you like a free report overview of the report of your choice?
If so, please drop an email to Jamie Roberts stating your chosen report title to jamie.roberts@visiongain.com
Visiongain automotive reports are compiled using a broad and rich mixture of both primary and secondary information to produce an overall industry outlook. In order to provide our clients with the best product possible product, we do not rely on any one single source of information. Visiongain analysts reach out to market-leading vendors and automotive industry experts but also review a wealth of financial data and product information from a vast range of sources. To find out more about our reports methodology please email jamie.roberts@visiongain.com
Would you like to get the latest Visiongain automotive reports catalogue?
What are the dynamic growth sectors? where are the regional business opportunities?
Which technologies will prevail and who are the leading companies succeeding in these sectors and why?
If you want definitive answers to business critical questions, discover Visiongain’s full range of business intelligence reports.
If so, please email Jamie Roberts on jamie.roberts@visiongain.com or call her today on +44 207 336 6100
Alliance of Automobile Manufacturers (USA)
Association of Russian Automakers
Audio Video Bridging (AVB)
China Association Of Automoblie Manufacturers
European Association of Automotive Suppliers
European Automobile Manufacturers’ Association
European Council for Automotive Research and Development
Former Society of Automotive Engineers
German Association of the Automotive Industry
International Organization of Motor Vehicle Manufacturers
In-Vehicle Infotainment (IVI)
Italian Association of the Automotive Industry
Japan Automobile Manufacturers Association
One-Pair Ether-Net
Society of Indian Automobile Manufacturers (SIAM)
Society of Motor Manufacturers and Traders
The International Council For Clean Transport
US National Highway Traffic Safety Administration
Latest Automotive news
Visiongain Publishes Connected Vehicle Market Report 2024-2034
The global Connected Vehicle market was valued at US$82.67 billion in 2023 and is projected to grow at a CAGR of 14.7% during the forecast period 2024-2034.
24 April 2024
Visiongain Publishes Automotive Electronics Market Report 2024-2034
The global Automotive Electronics market was valued at US$270.7 million in 2023 and is projected to grow at a CAGR of 8.7% during the forecast period 2024-2034.
15 April 2024
Visiongain Publishes Automobile AI and Generative Design Market Report 2024-2034
The global Automobile AI and Generative Design market was valued at US$630.7 million in 2023 and is projected to grow at a CAGR of 19% during the forecast period 2024-2034.
02 April 2024
Visiongain Publishes Vehicle to Grid (V2G) Market Report 2024-2034
The global Vehicle to Grid (V2G) market was valued at US$3,391 million in 2023 and is projected to grow at a CAGR of 27.6% during the forecast period 2024-2034.
08 March 2024
