The Active Pharmaceutical Ingredients (APIs) Market Report 2023-2033: This report will prove invaluable to leading firms striving for new revenue pockets if they wish to better understand the industry and its underlying dynamics. It will be useful for companies that would like to expand into different industries or to expand their existing operations in a new region.
Active Pharmaceutical Ingredients Market is being Transformed by Increasing Demand for Generics
Generics play a vital role in improving healthcare access, particularly in developing countries where brand-name drugs can be costly. Many governments actively promote the use of generic drugs to reduce healthcare expenditures and enhance access to medications for their citizens. The aging global population increases the demand for medications for chronic conditions, with generic drugs often being prescribed for such cases. Growing middle-class populations in emerging economies drive increased healthcare expenditures, resulting in a higher demand for affordable medications. Governments and regulatory bodies have actively encouraged the use of generics and facilitated easier approval processes, further stimulating demand.
High Manufacturing Cost will Limit the Growth Potential
The high manufacturing cost associated with active pharmaceutical ingredients may hamper API market growth. The raw materials used are API-specific, so the quality of the raw material components used in the API development process is critical. Designing a new chemistry for each API project is tedious and complicated. Furthermore, the drug substance manufacturing process is a complex mechanism involving a wide range of chemical and biological processes. The API manufacturers often employ set regulations to determine the size and strength of an API in a certain medication. These factors drive the cost of API manufacturing processes and may hinder API market growth for the foreseeable future.
What Questions Should You Ask before Buying a Market Research Report?
• How is the Active Pharmaceutical Ingredients Market evolving?
• What is driving and restraining the Active Pharmaceutical Ingredients Market?
• How will each Active Pharmaceutical Ingredients submarket segment grow over the forecast period and how much revenue will these submarkets account for in 2033?
• How will the market shares for each Active Pharmaceutical Ingredients submarket develop from 2023 to 2033?
• What will be the main driver for the overall market from 2023 to 2033?
• Will leading Active Pharmaceutical Ingredients Markets broadly follow the macroeconomic dynamics, or will individual national markets outperform others?
• How will the market shares of the national markets change by 2033 and which geographical region will lead the market in 2033?
• Who are the leading players and what are their prospects over the forecast period?
• What are the Active Pharmaceutical Ingredients projects for these leading companies?
• How will the industry evolve during the period between 2023 and 2033? What are the implications of Active Pharmaceutical Ingredients projects taking place now and over the next 10 years?
• Is there a greater need for product commercialisation to further scale the Active Pharmaceutical Ingredients Market?
• Where is the Active Pharmaceutical Ingredients Market heading and how can you ensure you are at the forefront of the market?
• What are the best investment options for new product and service lines?
• What are the key prospects for moving companies into a new growth path and C-suite?
You need to discover how this will impact the Active Pharmaceutical Ingredients Market today, and over the next 10 years:
• Our 267-page report provides 98 tables and 167 charts/graphs exclusively to you.
• The report highlights key lucrative areas in the industry so you can target them – NOW.
• It contains in-depth analysis of global, regional and national sales and growth.
• It highlights for you the key successful trends, changes and revenue projections made by your competitors.
This report tells you TODAY how the Active Pharmaceutical Ingredients Market will develop in the next 10 years, and in line with the variations in COVID-19 economic recession and bounce. This market is more critical now than at any point over the last 10 years.
Forecasts to 2033 and other analyses reveal commercial prospects
• In addition to revenue forecasting to 2033, our new study provides you with recent results, growth rates, and market shares.
• You will find original analyses, with business outlooks and developments.
• Discover qualitative analyses (including market dynamics, drivers, opportunities, restraints and challenges), cost structure, impact of rising Active Pharmaceutical Ingredients prices and recent developments.
This report includes data analysis and invaluable insight into how COVID-19 will affect the industry and your company. Four COVID-19 recovery patterns and their impact, namely, “V”, “L”, “W” and “U” are discussed in this report.
Segments Covered in the Report
Therapeutic Application
• Oncology
• Anti-diabetics
• Pulmonology
• Immuno-suppressants
• Neurology
• Cardiology
• Ophthalmology
• Orthopedic
• Others
Synthesis Type
• Synthetic
• Biotech
Manufacturer
• Merchant API
• Captive API
Drug Type
• Branded
• Generic

In addition to the revenue predictions for the overall world market and segments, you will also find revenue forecasts for four regional and 20 leading national markets:
North America
• U.S.
• Canada
Europe
• Germany
• UK
• France
• Spain
• Italy
• Rest of Europe
Asia Pacific
• China
• Japan
• India
• Australia
• South Korea
• Rest of Asia Pacific
Latin America
• Brazil
• Mexico
• Rest of Latin America
MEA
• GCC
• South Africa
• Rest of MEA
Need industry data? Please contact us today.
Leading companies profiled in the report
• Aarti Drugs Ltd.
• Aurobindo Pharma
• Biocon
• Cipla Inc.
• Divi’s Laboratories Limited
• Dr. Reddy’s Laboratories Ltd.
• EUROAPI
• HIKAL Ltd.
• Merck & Co., Inc.
• Teva Pharmaceutical Industries Ltd.
Overall world revenue for Active Pharmaceutical Ingredients Market, 2023 to 2033 in terms of value the market will surpass US$235 billion in 2023, our work calculates. We predict strong revenue growth through to 2033. Our work identifies which organizations hold the greatest potential. Discover their capabilities, progress, and commercial prospects, helping you stay ahead.
How will the Active Pharmaceutical Ingredients Market, 2023 to 2033 report help you?
In summary, our 260+ page report provides you with the following knowledge:
• Revenue forecasts to 2033 for Active Pharmaceutical Ingredients Market with forecasts for therapeutic application, synthesis type, manufacturer, and drug type, each forecast at a global and regional level – discover the industry’s prospects, finding the most lucrative places for investments and revenues.
• Revenue forecasts to 2033 for five regional and 20 key national markets – See forecasts for the Active Pharmaceutical Ingredients Market, 2023 to 2033 market in North America, Europe, Asia-Pacific, Latin America, and MEA. Also forecasted is the market in the US, Canada, Mexico, Brazil, Germany, France, UK, Italy, China, India, Japan, and Australia among other prominent economies.
• Prospects for established firms and those seeking to enter the market – including company profiles for 10 of the major companies involved in the Active Pharmaceutical Ingredients Market, 2023 to 2033.
Find quantitative and qualitative analyses with independent predictions. Receive information that only our report contains, staying informed with invaluable business intelligence.
Information found nowhere else
With our new report, you are less likely to fall behind in knowledge or miss out on opportunities. See how our work could benefit your research, analyses, and decisions. Visiongain’s study is for everybody needing commercial analyses for the Active Pharmaceutical Ingredients Market, 2023 to 2033, market-leading companies. You will find data, trends and predictions.
To access the data contained in this document please email contactus@visiongain.com
Buy our report today Active Pharmaceutical Ingredients (APIs) Market Report 2023-2033: Forecasts by Therapeutic Application (Oncology, Anti-diabetics, Pulmonology, Immuno-suppressants, Neurology, Cardiology, Orthopaedic, Others), by Synthesis Type (Synthetic, Biotech), by Manufacturer (Merchant API, Captive API), by Drug Type (Branded, Generic) AND Regional and Leading National Market Analysis PLUS Analysis of Leading Companies AND COVID-19 Impact and Recovery Pattern Analysis. Avoid missing out by staying informed – order our report now.
Visiongain is a trading partner with the US Federal Government
CCR Ref number: KD4R6
Do you have any custom requirements we can help you with? Any need for a specific country, geo region, market segment or specific company information? Contact us today, we can discuss your needs and see how we can help: contactus@visiongain.com
1 Report Overview
1.1 Objectives of the Study
1.2 Introduction to Active Pharmaceutical Ingredients Market
1.3 What This Report Delivers
1.4 Why You Should Read This Report
1.5 Key Questions Answered by This Analytical Report
1.6 Who is This Report for?
1.7 Methodology
1.7.1 Market Definitions
1.7.2 Market Evaluation & Forecasting Methodology
1.7.3 Data Validation
1.7.3.1 Primary Research
1.7.3.2 Secondary Research
1.8 Frequently Asked Questions (FAQs)
1.9 Associated Visiongain Reports
1.10 About Visiongain
2 Executive Summary
3 Market Overview
3.1 Key Findings
3.2 Market Dynamics
3.2.1 Market Driving Factors
3.2.1.1 Growing Prevalence of Chronic Diseases
3.2.1.2 Rising Drug Research and Development Activities
3.2.1.3 Increasing Demand for Generics
3.2.1.4 Increasing Uptake of Biopharmaceuticals
3.2.2 Market Restraining Factors
3.2.2.1 Unfavourable Drug Price Control Policies
3.2.2.2 High Manufacturing Costs
3.2.3 Market Opportunities
3.2.3.1 Increasing Demand for Specialty APIs
3.2.3.2 Growing Preference for Personalized Medicines
3.3 COVID-19 Impact Analysis
3.4 Porter’s Five Forces Analysis
3.4.1 Bargaining Power of Suppliers
3.4.2 Bargaining Power of Buyers
3.4.3 Competitive Rivalry
3.4.4 Threat from Substitutes
3.4.5 Threat of New Entrants
3.5 PEST Analysis
4 Active Pharmaceutical Ingredients Market Analysis by Therapeutic Application
4.1 Key Findings
4.2 Therapeutic Application Segment: Market Attractiveness Index
4.3 Active Pharmaceutical Ingredients Market Size Estimation and Forecast by Therapeutic Application
4.4 Oncology
4.4.1 Market Size by Region, 2023-2033 (US$ Billion)
4.4.2 Market Share by Region, 2023 & 2033 (%)
4.5 Anti-diabetics
4.5.1 Market Size by Region, 2023-2033 (US$ Billion)
4.5.2 Market Share by Region, 2023 & 2033 (%)
4.6 Pulmonology
4.6.1 Market Size by Region, 2023-2033 (US$ Billion)
4.6.2 Market Share by Region, 2023 & 2033 (%)
4.7 Immuno-suppressants
4.7.1 Market Size by Region, 2023-2033 (US$ Billion)
4.7.2 Market Share by Region, 2023 & 2033 (%)
4.8 Neurology
4.8.1 Market Size by Region, 2023-2033 (US$ Billion)
4.8.2 Market Share by Region, 2023 & 2033 (%)
4.9 Cardiology
4.9.1 Market Size by Region, 2023-2033 (US$ Billion)
4.9.2 Market Share by Region, 2023 & 2033 (%)
4.10 Ophthalmology
4.10.1 Market Size by Region, 2023-2033 (US$ Billion)
4.10.2 Market Share by Region, 2023 & 2033 (%)
4.11 Orthopaedic
4.11.1 Market Size by Region, 2023-2033 (US$ Billion)
4.11.2 Market Share by Region, 2023 & 2033 (%)
4.12 Others
4.12.1 Market Size by Region, 2023-2033 (US$ Billion)
4.12.2 Market Share by Region, 2023 & 2033 (%)
5 Active Pharmaceutical Ingredients Market Analysis by Synthesis Type
5.1 Key Findings
5.2 Synthesis Type Segment: Market Attractiveness Index
5.3 Active Pharmaceutical Ingredients Market Size Estimation and Forecast by Synthesis Type
5.4 Synthetic
5.4.1 Market Size by Region, 2023-2033 (US$ Billion)
5.4.2 Market Share by Region, 2023 & 2033 (%)
5.5 Biotech
5.5.1 Market Size by Region, 2023-2033 (US$ Billion)
5.5.2 Market Share by Region, 2023 & 2033 (%)
6 Active Pharmaceutical Ingredients Market Analysis by Manufacturer
6.1 Key Findings
6.2 Manufacturer Segment: Market Attractiveness Index
6.3 Active Pharmaceutical Ingredients Market Size Estimation and Forecast by Manufacturer
6.4 Merchant API
6.4.1 Market Size by Region, 2023-2033 (US$ Billion)
6.4.2 Market Share by Region, 2023 & 2033 (%)
6.5 Captive API
6.5.1 Market Size by Region, 2023-2033 (US$ Billion)
6.5.2 Market Share by Region, 2023 & 2033 (%)
7 Active Pharmaceutical Ingredients Market Analysis by Drug Type
7.1 Key Findings
7.2 Drug Type Segment: Market Attractiveness Index
7.3 Active Pharmaceutical Ingredients Market Size Estimation and Forecast by Drug Type
7.4 Branded
7.4.1 Market Size by Region, 2023-2033 (US$ Billion)
7.4.2 Market Share by Region, 2023 & 2033 (%)
7.5 Generic
7.5.1 Market Size by Region, 2023-2033 (US$ Billion)
7.5.2 Market Share by Region, 2023 & 2033 (%)
8 Active Pharmaceutical Ingredients Market Analysis by Region
8.1 Key Findings
8.2 Regional Market Size Estimation and Forecast
9 North America Active Pharmaceutical Ingredients Market Analysis
9.1 Key Findings
9.2 North America Active Pharmaceutical Ingredients Market Attractiveness Index
9.3 North America Active Pharmaceutical Ingredients Market by Country, 2023, 2028 & 2033 (US$ Billion)
9.4 North America Active Pharmaceutical Ingredients Market Size Estimation and Forecast by Country
9.5 North America Active Pharmaceutical Ingredients Market Size Estimation and Forecast by Therapeutic Application
9.6 North America Active Pharmaceutical Ingredients Market Size Estimation and Forecast by Synthesis Type
9.7 North America Active Pharmaceutical Ingredients Market Size Estimation and Forecast by Manufacturer
9.8 North America Active Pharmaceutical Ingredients Market Size Estimation and Forecast by Drug Type
9.9 U.S. Active Pharmaceutical Ingredients Market Analysis
9.10 Canada Active Pharmaceutical Ingredients Market Analysis
10 Europe Active Pharmaceutical Ingredients Market Analysis
10.1 Key Findings
10.2 Europe Active Pharmaceutical Ingredients Market Attractiveness Index
10.3 Europe Active Pharmaceutical Ingredients Market by Country, 2023, 2028 & 2033 (US$ Billion)
10.4 Europe Active Pharmaceutical Ingredients Market Size Estimation and Forecast by Country
10.5 Europe Active Pharmaceutical Ingredients Market Size Estimation and Forecast by Therapeutic Application
10.6 Europe Active Pharmaceutical Ingredients Market Size Estimation and Forecast by Synthesis Type
10.7 Europe Active Pharmaceutical Ingredients Market Size Estimation and Forecast by Manufacturer
10.8 Europe Active Pharmaceutical Ingredients Market Size Estimation and Forecast by Drug Type
10.9 Germany Active Pharmaceutical Ingredients Market Analysis
10.10 France Active Pharmaceutical Ingredients Market Analysis
10.11 UK Active Pharmaceutical Ingredients Market Analysis
10.12 Italy Active Pharmaceutical Ingredients Market Analysis
10.13 Spain Active Pharmaceutical Ingredients Market Analysis
10.14 Russia Active Pharmaceutical Ingredients Market Analysis
10.15 Rest of Europe Active Pharmaceutical Ingredients Market Analysis
11 Asia Pacific Active Pharmaceutical Ingredients Market Analysis
11.1 Key Findings
11.2 Asia Pacific Active Pharmaceutical Ingredients Market Attractiveness Index
11.3 Asia Pacific Active Pharmaceutical Ingredients Market by Country, 2023, 2028 & 2033 (US$ Billion)
11.4 Asia Pacific Active Pharmaceutical Ingredients Market Size Estimation and Forecast by Country
11.5 Asia Pacific Active Pharmaceutical Ingredients Market Size Estimation and Forecast by Therapeutic Application
11.6 Asia Pacific Active Pharmaceutical Ingredients Market Size Estimation and Forecast by Synthesis Type
11.7 Asia Pacific Active Pharmaceutical Ingredients Market Size Estimation and Forecast by Manufacturer
11.8 Asia Pacific Active Pharmaceutical Ingredients Market Size Estimation and Forecast by Drug Type
11.9 Japan Active Pharmaceutical Ingredients Market Analysis
11.10 China Active Pharmaceutical Ingredients Market Analysis
11.11 India Active Pharmaceutical Ingredients Market Analysis
11.12 Australia Active Pharmaceutical Ingredients Market Analysis
11.13 South Korea Active Pharmaceutical Ingredients Market Analysis
11.14 Rest of Asia Pacific Active Pharmaceutical Ingredients Market Analysis
12 Latin America Active Pharmaceutical Ingredients Market Analysis
12.1 Key Findings
12.2 Latin America Active Pharmaceutical Ingredients Market Attractiveness Index
12.3 Latin America Active Pharmaceutical Ingredients Market by Country, 2023, 2028 & 2033 (US$ Billion)
12.4 Latin America Active Pharmaceutical Ingredients Market Size Estimation and Forecast by Country
12.5 Latin America Active Pharmaceutical Ingredients Market Size Estimation and Forecast by Therapeutic Application
12.6 Latin America Active Pharmaceutical Ingredients Market Size Estimation and Forecast by Synthesis Type
12.7 Latin America Active Pharmaceutical Ingredients Market Size Estimation and Forecast by Manufacturer
12.8 Latin America Active Pharmaceutical Ingredients Market Size Estimation and Forecast by Drug Type
12.9 Brazil Active Pharmaceutical Ingredients Market Analysis
12.10 Mexico Active Pharmaceutical Ingredients Market Analysis
12.11 Rest of Latin America Active Pharmaceutical Ingredients Market Analysis
13 MEA Active Pharmaceutical Ingredients Market Analysis
13.1 Key Findings
13.2 MEA Active Pharmaceutical Ingredients Market Attractiveness Index
13.3 MEA Active Pharmaceutical Ingredients Market by Country, 2023, 2028 & 2033 (US$ Billion)
13.4 MEA Active Pharmaceutical Ingredients Market Size Estimation and Forecast by Country
13.5 MEA Active Pharmaceutical Ingredients Market Size Estimation and Forecast by Therapeutic Application
13.6 MEA Active Pharmaceutical Ingredients Market Size Estimation and Forecast by Synthesis Type
13.7 MEA Active Pharmaceutical Ingredients Market Size Estimation and Forecast by Manufacturer
13.8 MEA Active Pharmaceutical Ingredients Market Size Estimation and Forecast by Drug Type
13.9 GCC Active Pharmaceutical Ingredients Market Analysis
13.10 South Africa Active Pharmaceutical Ingredients Market Analysis
13.11 Rest of MEA Active Pharmaceutical Ingredients Market Analysis
14 Company Profiles
14.1 Competitive Landscape, 2022
14.2 Strategic Outlook
14.3 Aarti Drugs Ltd.
14.3.1 Company Snapshot
14.3.2 Company Overview
14.3.3 Financial Analysis
14.3.3.1 Net Revenue, 2017-2022
14.3.3.2 R&D, 2017-2022
14.3.3.3 Regional Market Shares, 2022
14.3.4 Product Benchmarking
14.4 Aurobindo Pharma
14.4.1 Company Snapshot
14.4.2 Company Overview
14.4.3 Financial Analysis
14.4.3.1 Net Revenue, 2017-2022
14.4.3.2 R&D, 2017-2022
14.4.3.3 Regional Market Shares, 2022
14.4.4 Product Benchmarking
14.5 Biocon
14.5.1 Company Snapshot
14.5.2 Company Overview
14.5.3 Financial Analysis
14.5.3.1 Net Revenue, 2017-2022
14.5.3.2 R&D, 2017-2022
14.5.3.3 Regional Market Shares, 2022
14.5.4 Product Benchmarking
14.5.5 Strategic Outlook
14.6 Cipla Inc.
14.6.1 Company Snapshot
14.6.2 Company Overview
14.6.3 Financial Analysis
14.6.3.1 Net Revenue, 2017-2022
14.6.3.2 R&D, 2017-2022
14.6.3.3 Regional Market Shares, 2022
14.6.4 Product Benchmarking
14.6.5 Strategic Outlook
14.7 Divi's Laboratories Limited
14.7.1 Company Snapshot
14.7.2 Company Overviews
14.7.3 Financial Analysis
14.7.3.1 Net Revenue, 2017-2022
14.7.3.2 R&D, 2017-2022
14.7.3.3 Regional Market Shares, 2022
14.7.4 Product Benchmarking
14.8 Dr. Reddy’s Laboratories Ltd.
14.8.1 Company Snapshot
14.8.2 Company Overview
14.8.3 Financial Analysis
14.8.3.1 Net Revenue, 2017-2022
14.8.3.2 R&D, 2017-2022
14.8.3.3 Regional Market Shares, 2022
14.8.4 Product Benchmarking
14.8.5 Strategic Outlook
14.9 EUROAPI
14.9.1 Company Snapshot
14.9.2 Company Overview
14.9.3 Financial Analysis
14.9.3.1 Net Revenue, 2017-2022
14.9.3.2 R&D, 2017-2022
14.9.4 Product Benchmarking
14.9.5 Strategic Outlook
14.10 HIKAL Ltd.
14.10.1 Company Snapshot
14.10.2 Company Overview
14.10.3 Financial Analysis
14.10.3.1 Net Revenue, 2017-2022
14.10.3.2 R&D, 2017-2022
14.10.4 Product Benchmarking
14.10.5 Strategic Outlook
14.11 Merck & Co., Inc.
14.11.1 Company Snapshot
14.11.2 Company Overview
14.11.3 Financial Analysis
14.11.3.1 Net Revenue, 2017-2022
14.11.3.2 R&D, 2017-2022
14.11.3.3 Regional Market Shares, 2022
14.11.4 Product Benchmarking
14.11.5 Strategic Outlook
14.12 Teva Pharmaceutical Industries Ltd.
14.12.1 Company Snapshot
14.12.2 Company Overview
14.12.3 Financial Analysis
14.12.3.1 Net Revenue, 2017-2022
14.12.3.2 R&D, 2017-2022
14.12.3.3 Regional Market Shares, 2022
14.12.4 Product Benchmarking
15 Conclusion and Recommendations
15.1 Concluding Remarks from Visiongain
15.2 Recommendations for Market Players
List of Tables
Table 1 Active Pharmaceutical Ingredients Market Snapshot, 2023 & 2033 (US$ Billion, CAGR %)
Table 2 Active Pharmaceutical Ingredients Market Forecast by Region, 2023-2033 (US$ Billion, AGR%, CAGR%): “V” Shaped Recovery
Table 3 Active Pharmaceutical Ingredients Market Forecast by Region, 2023-2033 (US$ Billion, AGR%, CAGR%): “U” Shaped Recovery
Table 4 Active Pharmaceutical Ingredients Market Forecast by Region, 2023-2033 (US$ Billion, AGR%, CAGR%): “W” Shaped Recovery
Table 5 Active Pharmaceutical Ingredients Market Forecast by Region, 2023-2033 (US$ Billion, AGR%, CAGR%): “L” Shaped Recovery
Table 6 Active Pharmaceutical Ingredients Market Forecast by Therapeutic Application, 2023-2033 (US$ Billion, AGR%, CAGR %)
Table 7 Oncology Segment Market Forecast by Region, 2023-2033 (US$ Billion, AGR%, CAGR %)
Table 8 Anti-diabetics Segment Market Forecast by Region, 2023-2033 (US$ Billion, AGR%, CAGR %)
Table 9 Pulmonology Segment Market Forecast by Region, 2023-2033 (US$ Billion, AGR%, CAGR %)
Table 10 Immuno-suppressants Segment Market Forecast by Region, 2023-2033 (US$ Billion, AGR%, CAGR %)
Table 11 Neurology Segment Market Forecast by Region, 2023-2033 (US$ Billion, AGR%, CAGR %)
Table 12 Cardiology Segment Market Forecast by Region, 2023-2033 (US$ Billion, AGR%, CAGR %)
Table 13 Ophthalmology Segment Market Forecast by Region, 2023-2033 (US$ Billion, AGR%, CAGR %)
Table 14 Orthopaedic Segment Market Forecast by Region, 2023-2033 (US$ Billion, AGR%, CAGR %)
Table 15 Others Segment Market Forecast by Region, 2023-2033 (US$ Billion, AGR%, CAGR %)
Table 16 Active Pharmaceutical Ingredients Market Forecast by Synthesis Type, 2023-2033 (US$ Billion, AGR%, CAGR%)
Table 17 Synthetic Segment Market Forecast by Region, 2023-2033 (US$ Billion, AGR%, CAGR%)
Table 18 Biotech Segment Market Forecast by Region, 2023-2033 (US$ Billion, AGR%, CAGR%)
Table 19 Active Pharmaceutical Ingredients Market Manufacturer, 2023-2033 (US$ Billion, AGR%, CAGR%)
Table 20 Merchant API Market Forecast by Region, 2023-2033 (US$ Billion, AGR%, CAGR%)
Table 21 Captive API Market Forecast by Region, 2023-2033 (US$ Billion, AGR%, CAGR%)
Table 22 Active Pharmaceutical Ingredients Market Drug Type, 2023-2033 (US$ Billion, AGR%, CAGR%)
Table 23 Branded Market Forecast by Region, 2023-2033 (US$ Billion, AGR%, CAGR%)
Table 24 Generic Market Forecast by Region, 2023-2033 (US$ Billion, AGR%, CAGR%)
Table 25 Active Pharmaceutical Ingredients Market Forecast by Region, 2023-2033 (US$ Billion, AGR%, CAGR%)
Table 26 North America Active Pharmaceutical Ingredients Market Forecast by Country, 2023-2033 (US$ Billion, AGR%, CAGR %)
Table 27 Active Pharmaceutical Ingredients Market Forecast by Therapeutic Application, 2023-2033 (US$ Billion, AGR%, CAGR %)
Table 28 North America Active Pharmaceutical Ingredients Market Forecast by Synthesis Type, 2023-2033 (US$ Billion, AGR%, CAGR%)
Table 29 Active Pharmaceutical Ingredients Market Manufacturer, 2023-2033 (US$ Billion, AGR%, CAGR%)
Table 30 North America Active Pharmaceutical Ingredients Market Drug Type, 2023-2033 (US$ Billion, AGR%, CAGR%)
Table 31 U.S. Active Pharmaceutical Ingredients Market Forecast, 2023-2033 (US$ Billion, AGR%, CAGR%)
Table 32 Canada Active Pharmaceutical Ingredients Market Forecast, 2023-2033 (US$ Billion, AGR%, CAGR %)
Table 33 Europe Active Pharmaceutical Ingredients Market Forecast by Country, 2023-2033 (US$ Billion, AGR%, CAGR%)
Table 34 Europe Active Pharmaceutical Ingredients Market Forecast by Therapeutic Application, 2023-2033 (US$ Billion, AGR%, CAGR %)
Table 35 Active Pharmaceutical Ingredients Market Forecast by Synthesis Type, 2023-2033 (US$ Billion, AGR%, CAGR%)
Table 36 Active Pharmaceutical Ingredients Market Manufacturer, 2023-2033 (US$ Billion, AGR%, CAGR%)
Table 37 Europe Active Pharmaceutical Ingredients Market Drug Type, 2023-2033 (US$ Billion, AGR%, CAGR%)
Table 38 Germany Active Pharmaceutical Ingredients Market Forecast, 2023-2033 (US$ Billion, AGR%, CAGR %)
Table 39 France Active Pharmaceutical Ingredients Market Forecast, 2023-2033 (US$ Billion, AGR%, CAGR %)
Table 40 UK Active Pharmaceutical Ingredients Market Forecast, 2023-2033 (US$ Billion, AGR%, CAGR%)
Table 41 Italy Active Pharmaceutical Ingredients Market Forecast, 2023-2033 (US$ Billion, AGR%, CAGR %)
Table 42 Spain Active Pharmaceutical Ingredients Market Forecast, 2023-2033 (US$ Billion, AGR%, CAGR%)
Table 43 Russia Active Pharmaceutical Ingredients Market Forecast, 2023-2033 (US$ Billion, AGR%, CAGR%)
Table 44 Rest of Europe Active Pharmaceutical Ingredients Market Forecast, 2023-2033 (US$ Billion, AGR%, CAGR%)
Table 45 Asia Pacific Active Pharmaceutical Ingredients Market Forecast by Country, 2023-2033 (US$ Billion, AGR%, CAGR%)
Table 46 Active Pharmaceutical Ingredients Market Forecast by Therapeutic Application, 2023-2033 (US$ Billion, AGR%, CAGR %)
Table 47 Active Pharmaceutical Ingredients Market Forecast by Synthesis Type, 2023-2033 (US$ Billion, AGR%, CAGR%)
Table 48 Active Pharmaceutical Ingredients Market Manufacturer, 2023-2033 (US$ Billion, AGR%, CAGR%)
Table 49 Asia Pacific Active Pharmaceutical Ingredients Market Drug Type, 2023-2033 (US$ Billion, AGR%, CAGR%)
Table 50 Japan Active Pharmaceutical Ingredients Market Forecast, 2023-2033 (US$ Billion, AGR%, CAGR%)
Table 51 China Active Pharmaceutical Ingredients Market Forecast, 2023-2033 (US$ Billion, AGR%, CAGR%)
Table 52 India Active Pharmaceutical Ingredients Market Forecast, 2023-2033 (US$ Billion, AGR%, CAGR %)
Table 53 Australia Active Pharmaceutical Ingredients Market Forecast, 2023-2033 (US$ Billion, AGR%, CAGR %)
Table 54 South Korea Active Pharmaceutical Ingredients Market Forecast, 2023-2033 (US$ Billion, AGR%, CAGR%)
Table 55 Rest of Asia Pacific Active Pharmaceutical Ingredients Market Forecast, 2023-2033 (US$ Billion, AGR%, CAGR %)
Table 56 Latin America Active Pharmaceutical Ingredients Market Forecast by Country, 2023-2033 (US$ Billion, AGR%, CAGR%)
Table 57 Active Pharmaceutical Ingredients Market Forecast by Therapeutic Application, 2023-2033 (US$ Billion, AGR%, CAGR %)
Table 58 Active Pharmaceutical Ingredients Market Forecast by Synthesis Type, 2023-2033 (US$ Billion, AGR%, CAGR%)
Table 59 Active Pharmaceutical Ingredients Market Manufacturer, 2023-2033 (US$ Billion, AGR%, CAGR%)
Table 60 Latin America Active Pharmaceutical Ingredients Market Drug Type, 2023-2033 (US$ Billion, AGR%, CAGR%)
Table 61 Brazil Active Pharmaceutical Ingredients Market Forecast, 2023-2033 (US$ Billion, AGR%, CAGR %)
Table 62 Mexico Active Pharmaceutical Ingredients Market Forecast, 2023-2033 (US$ Billion, AGR%, CAGR%)
Table 63 Rest of Latin America Active Pharmaceutical Ingredients Market Forecast, 2023-2033 (US$ Billion, AGR%, CAGR%)
Table 64 MEA Active Pharmaceutical Ingredients Market Forecast by Country, 2023-2033 (US$ Billion, AGR%, CAGR%)
Table 65 Active Pharmaceutical Ingredients Market Forecast by Therapeutic Application, 2023-2033 (US$ Billion, AGR%, CAGR %)
Table 66 Active Pharmaceutical Ingredients Market Forecast by Synthesis Type, 2023-2033 (US$ Billion, AGR%, CAGR%)
Table 67 Active Pharmaceutical Ingredients Market Manufacturer, 2023-2033 (US$ Billion, AGR%, CAGR%)
Table 68 MEA Active Pharmaceutical Ingredients Market Drug Type, 2023-2033 (US$ Billion, AGR%, CAGR%)
Table 69 GCC Active Pharmaceutical Ingredients Market Forecast, 2023-2033 (US$ Billion, AGR%, CAGR%)
Table 70 South Africa Active Pharmaceutical Ingredients Market Forecast, 2023-2033 (US$ Billion, AGR%, CAGR%)
Table 71 Rest of MEA Active Pharmaceutical Ingredients Market Forecast, 2023-2033 (US$ Billion, AGR%, CAGR %)
Table 72 Strategic Outlook
Table 73 Aarti Drugs Ltd.: Key Details, (CEO, HQ, Revenue, Founded, No. of Employees, Company Type, Website, Business Segment)
Table 74 Aarti Drugs Ltd.: Product Benchmarking
Table 75 Aurobindo Pharma: Key Details, (CEO, HQ, Revenue, Founded, No. of Employees, Company Type, Website, Business Segment)
Table 76 Aurobindo Pharma: Product Benchmarking
Table 77 Biocon: Key Details, (CEO, HQ, Revenue, Founded, No. of Employees, Company Type, Website, Business Segment)
Table 78 Biocon: Product Benchmarking
Table 79 Biocon: Strategic Outlook
Table 80 Cipla Inc.: Key Details, (CEO, HQ, Revenue, Founded, No. of Employees, Company Type, Website, Business Segment)
Table 81 Cipla Inc.: Product Benchmarking
Table 82 Cipla Inc.: Strategic Outlook
Table 83 Divi's Laboratories Limited: Key Details, (CEO, HQ, Revenue, Founded, No. of Employees, Company Type, Website, Business Segment)
Table 84 Divi's Laboratories Limited: Product Benchmarking
Table 85 Dr. Reddy’s Laboratories Ltd.: Key Details, (CEO, HQ, Revenue, Founded, No. of Employees, Company Type, Website, Business Segment)
Table 86 Dr. Reddy’s Laboratories Ltd.: Product Benchmarking
Table 87 Dr. Reddy’s Laboratories Ltd.: Strategic Outlook
Table 88 EUROAPI: Key Details, (CEO, HQ, Revenue, Founded, No. of Employees, Company Type, Website, Business Segment)
Table 89 EUROAPI: Product Benchmarking
Table 90 EUROAPI: Strategic Outlook
Table 91 HIKAL Ltd.: Key Details, (CEO, HQ, Revenue, Founded, No. of Employees, Company Type, Website, Business Segment)
Table 92 HIKAL Ltd.: Product Benchmarking
Table 93 HIKAL Ltd.: Strategic Outlook
Table 94 Merck & Co., Inc.: Key Details, (CEO, HQ, Revenue, Founded, No. of Employees, Company Type, Website, Business Segment)
Table 95 Merck & Co., Inc.: Product Benchmarking
Table 96 Merck & Co., Inc.: Strategic Outlook
Table 97 Teva Pharmaceutical Industries Ltd.: Key Details, (CEO, HQ, Revenue, Founded, No. of Employees, Company Type, Website, Business Segment)
Table 98 Teva Pharmaceutical Industries Ltd.: Product Benchmarking
List of Figures
Figure 1 Active Pharmaceutical Ingredients Market Segmentation
Figure 2 Active Pharmaceutical Ingredients Market by Therapeutic Application: Market Attractiveness Index
Figure 3 Active Pharmaceutical Ingredients Market by Synthesis Type: Market Attractiveness Index
Figure 4 Active Pharmaceutical Ingredients Market by Manufacturer: Market Attractiveness Index
Figure 5 Active Pharmaceutical Ingredients Market by Drug Type: Market Attractiveness Index
Figure 6 Active Pharmaceutical Ingredients Market Attractiveness Index by Region
Figure 7 Active Pharmaceutical Ingredients Market: Market Dynamics
Figure 8 Active Pharmaceutical Ingredients Market by Region, 2023-2033 (US$ Billion, AGR %): “V” Shaped Recovery
Figure 9 Active Pharmaceutical Ingredients Market by Region, 2023-2033 (US$ Billion, AGR %): “U” Shaped Recovery
Figure 10 Active Pharmaceutical Ingredients Market by Region, 2023-2033 (US$ Billion, AGR %): “W” Shaped Recovery
Figure 11 Active Pharmaceutical Ingredients Market by Region, 2023-2033 (US$ Billion, AGR %): “L” Shaped Recovery
Figure 12 Active Pharmaceutical Ingredients Market: Porter’s Five Forces Analysis
Figure 13 Active Pharmaceutical Ingredients Market: PEST Analysis
Figure 14 Active Pharmaceutical Ingredients Market by Therapeutic Application: Market Attractiveness Index
Figure 15 Active Pharmaceutical Ingredients Market Forecast by Therapeutic Application, 2023-2033 (US$ Billion, AGR %)
Figure 16 Active Pharmaceutical Ingredients Market Share Forecast by Therapeutic Application, 2023, 2028, 2033 (%)
Figure 17 Oncology Segment Market Forecast by Region, 2023-2033 (US$ Billion, AGR %)
Figure 18 Oncology Segment Market Share Forecast by Region, 2023 & 2033 (%)
Figure 19 Anti-diabetics Segment Market Forecast by Region, 2023-2033 (US$ Billion, AGR %)
Figure 20 Anti-diabetics Segment Market Share Forecast by Region, 2023 & 2033 (%)
Figure 21 Pulmonology Segment Market Forecast by Region, 2023-2033 (US$ Billion, AGR %)
Figure 22 Pulmonology Segment Market Share Forecast by Region, 2023 & 2033 (%)
Figure 23 Immuno-suppressants Segment Market Forecast by Region, 2023-2033 (US$ Billion, AGR %)
Figure 24 Immuno-suppressants Segment Market Share Forecast by Region, 2023 & 2033 (%)
Figure 25 Neurology Segment Market Forecast by Region, 2023-2033 (US$ Billion, AGR %)
Figure 26 Neurology Segment Market Share Forecast by Region, 2023 & 2033 (%)
Figure 27 Cardiology Segment Market Forecast by Region, 2023-2033 (US$ Billion, AGR %)
Figure 28 Cardiology Segment Market Share Forecast by Region, 2023 & 2033 (%)
Figure 29 Ophthalmology Segment Market Forecast by Region, 2023-2033 (US$ Billion, AGR %)
Figure 30 Ophthalmology Segment Market Share Forecast by Region, 2023 & 2033 (%)
Figure 31 Orthopaedic Segment Market Forecast by Region, 2023-2033 (US$ Billion, AGR %)
Figure 32 Orthopaedic Segment Market Share Forecast by Region, 2023 & 2033 (%)
Figure 33 Others Segment Market Forecast by Region, 2023-2033 (US$ Billion, AGR %)
Figure 34 Others Segment Market Share Forecast by Region, 2023 & 2033 (%)
Figure 35 Active Pharmaceutical Ingredients Market by Synthesis Type: Market Attractiveness Index
Figure 36 Active Pharmaceutical Ingredients Market Forecast by Synthesis Type, 2023-2033 (US$ Billion, AGR %)
Figure 37 Active Pharmaceutical Ingredients Market Share Forecast by Synthesis Type, 2023, 2028, 2033 (%)
Figure 38 Synthetic Segment Market Forecast by Region, 2023-2033 (US$ Billion, AGR %)
Figure 39 Synthetic Segment Market Share Forecast by Region, 2023 & 2033 (%)
Figure 40 Biotech Segment Market Forecast by Region, 2023-2033 (US$ Billion, AGR %)
Figure 41 Biotech Segment Market Share Forecast by Region, 2023 & 2033 (%)
Figure 42 Active Pharmaceutical Ingredients Market by Manufacturer: Market Attractiveness Index
Figure 43 Active Pharmaceutical Ingredients Market Forecast by Manufacturer, 2023-2033 (US$ Billion, AGR %)
Figure 44 Active Pharmaceutical Ingredients Market Share Forecast by Manufacturer, 2023, 2028, 2033 (%)
Figure 45 Merchant API Segment Market Forecast by Region, 2023-2033 (US$ Billion, AGR %)
Figure 46 Merchant API Segment Market Share Forecast by Region, 2023 & 2033 (%)
Figure 47 Captive API Market Forecast by Region, 2023-2033 (US$ Billion, AGR %)
Figure 48 Captive API Market Share Forecast by Region, 2023 & 2033 (%)
Figure 49 Active Pharmaceutical Ingredients Market by Drug Type: Market Attractiveness Index
Figure 50 Active Pharmaceutical Ingredients Market Forecast by Drug Type, 2023-2033 (US$ Billion, AGR %)
Figure 51 Active Pharmaceutical Ingredients Market Share Forecast by Drug Type, 2023, 2028, 2033 (%)
Figure 52 Branded Segment Market Forecast by Region, 2023-2033 (US$ Billion, AGR %)
Figure 53 Branded Segment Market Share Forecast by Region, 2023 & 2033 (%)
Figure 54 Generic Market Forecast by Region, 2023-2033 (US$ Billion, AGR %)
Figure 55 Generic Market Share Forecast by Region, 2023 & 2033 (%)
Figure 56 Active Pharmaceutical Ingredients Market Forecast by Region 2023 and 2033 (Revenue, CAGR %)
Figure 57 Active Pharmaceutical Ingredients Market Share Forecast by Region 2023, 2028, 2033 (%)
Figure 58 Active Pharmaceutical Ingredients Market by Region, 2023-2033 (US$ Billion, AGR %)
Figure 59 North America Active Pharmaceutical Ingredients Market Attractiveness Index
Figure 60 North America Active Pharmaceutical Ingredients Market by Region, 2023, 2028 & 2033 (US$ Billion)
Figure 61 North America Active Pharmaceutical Ingredients Market Forecast by Country, 2023-2033 (US$ Billion, AGR %)
Figure 62 North America Active Pharmaceutical Ingredients Market Share Forecast by Country, 2023 & 2033 (%)
Figure 63 North America Active Pharmaceutical Ingredients Market Forecast by Therapeutic Application, 2023-2033 (US$ Billion, AGR %)
Figure 64 North America Active Pharmaceutical Ingredients Market Share Forecast by Therapeutic Application, 2023 & 2033 (%)
Figure 65 North America Active Pharmaceutical Ingredients Market Forecast by Synthesis Type, 2023-2033 (US$ Billion, AGR %)
Figure 66 North America Active Pharmaceutical Ingredients Market Share Forecast by Synthesis Type, 2023 & 2033 (%)
Figure 67 North America Active Pharmaceutical Ingredients Market Forecast by Manufacturer, 2023-2033 (US$ Billion, AGR %)
Figure 68 North America Active Pharmaceutical Ingredients Market Share Forecast by Manufacturer, 2023 & 2033 (%)
Figure 69 North America Active Pharmaceutical Ingredients Market Forecast by Drug Type, 2023-2033 (US$ Billion, AGR %)
Figure 70 North America Active Pharmaceutical Ingredients Market Share Forecast by Drug Type, 2023 & 2033 (%)
Figure 71 U.S. Active Pharmaceutical Ingredients Market Forecast, 2023-2033 (US$ Billion, AGR %)
Figure 72 Canada Active Pharmaceutical Ingredients Market Forecast, 2023-2033 (US$ Billion, AGR %)
Figure 73 Europe Active Pharmaceutical Ingredients Market Attractiveness Index
Figure 74 Europe Active Pharmaceutical Ingredients Market by Region, 2023, 2028 & 2033 (US$ Billion)
Figure 75 Europe Active Pharmaceutical Ingredients Market Forecast by Country, 2023-2033 (US$ Billion, AGR %)
Figure 76 Europe Active Pharmaceutical Ingredients Market Share Forecast by Country, 2023 & 2033 (%)
Figure 77 Europe Active Pharmaceutical Ingredients Market Forecast by Therapeutic Application, 2023-2033 (US$ Billion, AGR %)
Figure 78 Europe Active Pharmaceutical Ingredients Market Share Forecast by Therapeutic Application, 2023 & 2033 (%)
Figure 79 Europe Active Pharmaceutical Ingredients Market Forecast by Synthesis Type, 2023-2033 (US$ Billion, AGR %)
Figure 80 Europe Active Pharmaceutical Ingredients Market Share Forecast by Synthesis Type, 2023 & 2033 (%)
Figure 81 Europe Active Pharmaceutical Ingredients Market Forecast by Manufacturer, 2023-2033 (US$ Billion, AGR %)
Figure 82 Europe Active Pharmaceutical Ingredients Market Share Forecast by Manufacturer, 2023 & 2033 (%)
Figure 83 Europe Active Pharmaceutical Ingredients Market Forecast by Drug Type, 2023-2033 (US$ Billion, AGR %)
Figure 84 Europe Active Pharmaceutical Ingredients Market Share Forecast by Drug Type, 2023 & 2033 (%)
Figure 85 Germany Active Pharmaceutical Ingredients Market Forecast, 2023-2033 (US$ Billion, AGR %)
Figure 86 France Active Pharmaceutical Ingredients Market Forecast, 2023-2033 (US$ Billion, AGR %)
Figure 87 UK Active Pharmaceutical Ingredients Market Forecast, 2023-2033 (US$ Billion, AGR %)
Figure 88 Italy Active Pharmaceutical Ingredients Market Forecast, 2023-2033 (US$ Billion, AGR %)
Figure 89 Spain Active Pharmaceutical Ingredients Market Forecast, 2023-2033 (US$ Billion, AGR %)
Figure 90 Russia Active Pharmaceutical Ingredients Market Forecast, 2023-2033 (US$ Billion, AGR %)
Figure 91 Rest of Europe Active Pharmaceutical Ingredients Market Forecast, 2023-2033 (US$ Billion, AGR %)
Figure 92 Asia Pacific Active Pharmaceutical Ingredients Market Attractiveness Index
Figure 93 Asia Pacific Active Pharmaceutical Ingredients Market by Region, 2023, 2028 & 2033 (US$ Billion)
Figure 94 Asia Pacific Active Pharmaceutical Ingredients Market Forecast by Country, 2023-2033 (US$ Billion, AGR %)
Figure 95 Asia Pacific Active Pharmaceutical Ingredients Market Share Forecast by Country, 2023 & 2033 (%)
Figure 96 Asia Pacific Active Pharmaceutical Ingredients Market Forecast by Therapeutic Application, 2023-2033 (US$ Billion, AGR %)
Figure 97 Asia Pacific Active Pharmaceutical Ingredients Market Share Forecast by Therapeutic Application, 2023 & 2033 (%)
Figure 98 Asia Pacific Active Pharmaceutical Ingredients Market Forecast by Synthesis Type, 2023-2033 (US$ Billion, AGR %)
Figure 99 Asia Pacific Active Pharmaceutical Ingredients Market Share Forecast by Synthesis Type, 2023 & 2033 (%)
Figure 100 Asia Pacific Active Pharmaceutical Ingredients Market Forecast by Manufacturer, 2023-2033 (US$ Billion, AGR %)
Figure 101 Asia Pacific Active Pharmaceutical Ingredients Market Share Forecast by Manufacturer, 2023 & 2033 (%)
Figure 102 Asia Pacific Active Pharmaceutical Ingredients Market Forecast by Drug Type, 2023-2033 (US$ Billion, AGR %)
Figure 103 Asia Pacific Active Pharmaceutical Ingredients Market Share Forecast by Drug Type, 2023 & 2033 (%)
Figure 104 Japan Active Pharmaceutical Ingredients Market Forecast, 2023-2033 (US$ Billion, AGR %)
Figure 105 China Active Pharmaceutical Ingredients Market Forecast, 2023-2033 (US$ Billion, AGR %)
Figure 106 India Active Pharmaceutical Ingredients Market Forecast, 2023-2033 (US$ Billion, AGR %)
Figure 107 Australia Active Pharmaceutical Ingredients Market Forecast, 2023-2033 (US$ Billion, AGR %)
Figure 108 South Korea Active Pharmaceutical Ingredients Market Forecast, 2023-2033 (US$ Billion, AGR %)
Figure 109 Rest of Asia Pacific Active Pharmaceutical Ingredients Market Forecast, 2023-2033 (US$ Billion, AGR %)
Figure 110 Latin America Active Pharmaceutical Ingredients Market Attractiveness Index
Figure 111 Latin America Active Pharmaceutical Ingredients Market by Region, 2023, 2028 & 2033 (US$ Billion)
Figure 112 Latin America Active Pharmaceutical Ingredients Market Forecast by Country, 2023-2033 (US$ Billion, AGR %)
Figure 113 Latin America Active Pharmaceutical Ingredients Market Share Forecast by Country, 2023 & 2033 (%)
Figure 114 Latin America Active Pharmaceutical Ingredients Market Forecast by Therapeutic Application, 2023-2033 (US$ Billion, AGR %)
Figure 115 Latin America Active Pharmaceutical Ingredients Market Share Forecast by Therapeutic Application, 2023 & 2033 (%)
Figure 116 Latin America Active Pharmaceutical Ingredients Market Forecast by Synthesis Type, 2023-2033 (US$ Billion, AGR %)
Figure 117 Latin America Active Pharmaceutical Ingredients Market Share Forecast by Synthesis Type, 2023 & 2033 (%)
Figure 118 Latin America Active Pharmaceutical Ingredients Market Forecast by Manufacturer, 2023-2033 (US$ Billion, AGR %)
Figure 119 Latin America Active Pharmaceutical Ingredients Market Share Forecast by Manufacturer, 2023 & 2033 (%)
Figure 120 Latin America Active Pharmaceutical Ingredients Market Forecast by Drug Type, 2023-2033 (US$ Billion, AGR %)
Figure 121 Latin America Active Pharmaceutical Ingredients Market Share Forecast by Drug Type, 2023 & 2033 (%)
Figure 122 Brazil Active Pharmaceutical Ingredients Market Forecast, 2023-2033 (US$ Billion, AGR %)
Figure 123 Mexico Active Pharmaceutical Ingredients Market Forecast, 2023-2033 (US$ Billion, AGR %)
Figure 124 Rest of Latin America Active Pharmaceutical Ingredients Market Forecast, 2023-2033 (US$ Billion, AGR %)
Figure 125 MEA Active Pharmaceutical Ingredients Market Attractiveness Index
Figure 126 MEA Active Pharmaceutical Ingredients Market by Region, 2023, 2028 & 2033 (US$ Billion)
Figure 127 MEA Active Pharmaceutical Ingredients Market Forecast by Country, 2023-2033 (US$ Billion, AGR %)
Figure 128 MEA Active Pharmaceutical Ingredients Market Share Forecast by Country, 2023 & 2033 (%)
Figure 129 MEA Active Pharmaceutical Ingredients Market Forecast by Therapeutic Application, 2023-2033 (US$ Billion, AGR %)
Figure 130 MEA Active Pharmaceutical Ingredients Market Share Forecast by Therapeutic Application, 2023 & 2033 (%)
Figure 131 MEA Active Pharmaceutical Ingredients Market Forecast by Synthesis Type, 2023-2033 (US$ Billion, AGR %)
Figure 132 MEA Active Pharmaceutical Ingredients Market Share Forecast by Synthesis Type, 2023 & 2033 (%)
Figure 133 MEA Active Pharmaceutical Ingredients Market Forecast by Manufacturer, 2023-2033 (US$ Billion, AGR %)
Figure 134 MEA Active Pharmaceutical Ingredients Market Share Forecast by Manufacturer, 2023 & 2033 (%)
Figure 135 MEA Active Pharmaceutical Ingredients Market Forecast by Drug Type, 2023-2033 (US$ Billion, AGR %)
Figure 136 MEA Active Pharmaceutical Ingredients Market Share Forecast by Drug Type, 2023 & 2033 (%)
Figure 137 GCC Active Pharmaceutical Ingredients Market Forecast, 2023-2033 (US$ Billion, AGR %)
Figure 138 South Africa Active Pharmaceutical Ingredients Market Forecast, 2023-2033 (US$ Billion, AGR %)
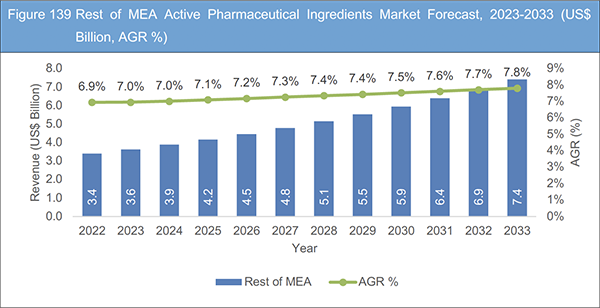
Figure 139 Rest of MEA Active Pharmaceutical Ingredients Market Forecast, 2023-2033 (US$ Billion, AGR %)
Figure 140 Aarti Drugs Ltd.: Net Revenue, 2017-2022 (US$ Million, AGR%)
Figure 141 Aarti Drugs Ltd.: R&D, 2017-2022 (US$ Million, AGR%)
Figure 142 Aarti Drugs Ltd.: Regional Market Shares, 2022
Figure 143 Aurobindo Pharma: Net Revenue, 2017-2022 (US$ Million, AGR %)
Figure 144 Aurobindo Pharma: R&D, 2017-2022 (US$ Million, AGR%)
Figure 145 Aurobindo Pharma: Regional Market Shares, 2022
Figure 146 Biocon: Net Revenue, 2017-2022 (US$ Million, AGR%)
Figure 147 Biocon: R&D, 2017-2022 (US$ Million, AGR%)
Figure 148 Biocon: Regional Market Shares, 2022
Figure 149 Cipla Ltd: Net Revenue, 2017-2022 (US$ Million, AGR%)
Figure 150 Cipla Ltd: R&D, 2017-2022 (US$ Million, AGR %)
Figure 151 Cipla Inc.: Regional Market Shares, 2022
Figure 152 Divi's Laboratories Limited: Net Revenue, 2017-2022 (US$ Million, AGR%)
Figure 153 Divi's Laboratories Limited: R&D, 2017-2022 (US$ Million, AGR%)
Figure 154 Divi's Laboratories Limited: Regional Market Shares, 2022
Figure 155 Dr. Reddy’s Laboratories Ltd.: Net Revenue, 2017-2022 (US$ Million, AGR%)
Figure 156 Dr. Reddy’s Laboratories Ltd.: R&D, 2017-2022 (US$ Million, AGR%)
Figure 157 Dr. Reddy’s Laboratories Ltd.: Regional Market Shares, 2022
Figure 158 EUROAPI: Net Revenue, 2019-2022 (US$ Million, AGR%)
Figure 159 EUROAPI: R&D, 2021-2022 (US$ Million, AGR%)
Figure 160 HIKAL Ltd.: Net Revenue, 2017-2022 (US$ Million, AGR%)
Figure 161 HIKAL Ltd.: R&D, 2017-2022 (US$ Million, AGR%)
Figure 162 Merck & Co., Inc.: Net Revenue, 2017-2022 (US$ Million, AGR%)
Figure 163 Merck & Co., Inc.: R&D, 2017-2022 (US$ Million, AGR%)
Figure 164 Merck & Co., Inc.: Regional Market Shares, 2022
Figure 165 Teva Pharmaceutical Industries Ltd.: Net Revenue, 2017-2022 (US$ Million, AGR%)
Figure 166 Teva Pharmaceutical Industries Ltd.: R&D, 2017-2022 (US$ Million, AGR%)
Figure 167 Teva Pharmaceutical Industries Ltd.: Regional Market Shares, 2022
List of Companies Profiled in the Report
Aarti Drugs Ltd.
Aurobindo Pharma
Biocon
Cipla Inc.
Divi's Laboratories Limited
Dr. Reddy’s Laboratories Ltd.
EUROAPI
HIKAL Ltd.
Merck & Co., Inc.
Teva Pharmaceutical Industries Ltd.
List of Other Companies Mentioned in the Report
Abbott Laboratories
Apex Labs Ltd
Bluebird Bio, Inc
Boehringer Ingelheim GmbH
GlaxoSmithKline plc
Lonza Group AG
Novartis AG
Orion Labs
Otsuka Chemical Co., Ltd.
Pfizer Inc.
Qilu Pharmaceutical Co., Ltd
Sun Pharmaceuticals Ltd
List of Associations Mentioned in the Report
American Cancer Society
American Diabetes Association
European Medicines Agency (EMA)
Food and Drug Administration (FDA)
French National Agency for Medicines and Health Products Safety (ANSM)
German Federal Institute for Drugs and Medical Devices (BfArM)
International Council of Chemical Associations (ICCA).
Medicines and Healthcare Products Regulatory Agency (MHRA)
National Health Surveillance Agency (ANVISA)
United Nations Food and Agriculture Organization (FAO)
World Health Organization (WHO)
 Market Report 2023-2033")