Industries > Aviation > Airport Security Market Report 2020-2030

Airport Security Market Report 2020-2030
Forecasts by System (Biometric System, Alert and Cyber Security System E-fence and Ground Surveillance Radar System, E-tag System, Others), by End-use (Terminal Side, Air Side, Land Side), by Application (Surveillance, Access Control, Perimeter Security, Screening, Cyber Security, Others), by Region (North America, Europe, Asia Pacific, Latin America, Middle East & Africa) Plus Analysis of Leading Airport Security Companies and COVID-19 Recovery Scenarios
Airports, aviation and security are key in this COVID-19 pandemic situation?
The industry is in enormous flux. Airports and aviation face unprecedented difficulties. The battle against COVID-19 is not just a race for profit or market growth, but a battle for survival and a key indicator in the global economy. Testing of passengers and visitors, tracing systems etc., have all added another layer of difficulty to the already complicated system of airport management and security. How can airports survive?
You need to discover how this will impact the market today, and over the next 10 years:
• Our in-depth, dedicated 450+ page report contains more than 630 tables and diagrams.
• Delivers best-benefit areas for short- to long-term Airport Security future prospects
• Analyses, for you, global, regional and national sales
• Highlights successful results, trends, changes and revenue projections
• Tells you how to profit best from airport security technologies today.
This report tells you:
• How key players in the Airport Security market are strategically increasing/ decreasing/ holding their positions?
• What are the funding trends in the Airport Security market?
• Development scenarios and global confidence regarding airport security
• Technological and structural changes occurring in the security industry and how they effect you
• Growth assessments within the airport security industry during the forecast timeline?
This report includes data analysis and invaluable insight into how COVID-19 will affect your industry. Access this report today.
To access the data contained in this document please email contactus@visiongain.com
Discover how to stay ahead
Our 452 page report provides 305 tables and 326 charts/graphs. Read on to discover the most lucrative areas in the industry and the future market prospects. Our new study lets you assess forecasted sales at overall world market and regional level. See financial results, trends, opportunities, and revenue predictions. Much opportunity remains in this growing Airport Security Market. See how to exploit the opportunities.
Key factors this report answers for you include:
• Dealing securely with the increasing number of airports globally
• The Evolving Nature of Security Threats to Civil Aviation
• Protection of infrastructure and productivity
Forecasts to 2030 and other analyses reveal the commercial prospects
• In addition to revenue forecasting to 2030, our new study provides you with recent results, growth rates, and market shares.
• You find original analyses, with business outlooks and developments.
• Discover qualitative analyses (including market dynamics, drivers, opportunities, restraints and challenges), product profiles and commercial developments.
Discover sales predictions for the world market and submarkets
Airport Security Market by System
• Biometric System
• Alert and Cyber Security System
• E-fence and Ground Surveillance Radar System
• E-tag System
• Others
Airport Security Market by Application
• Surveillance
• Access Control
• Perimeter Security
• Screening
• Cyber Security
• Others
Airport Security Market by End-User
• Terminal Side
• Air Side
• Land Side

In addition to the revenue predictions for the overall world market and segments, you will also find revenue forecasts for 5 regional and 19 leading national markets:
• North America:
• U.S.
• Canada
• Europe:
• Germany
• France
• United Kingdom
• Italy
• Spain
• Russia
• Rest of Europe
• Asia Pacific:
• China
• Japan
• India
• Australia
• South Korea
• Southeast Asia
• Rest of Asia Pacific
• Latin America:
• Brazil
• Mexico
• Argentina
• Rest of Latin America
• Middle East and Africa:
• GCC
• South Africa
• Rest of Middle East and Africa
Need industry data? Please contact us today.
The report also includes profiles and for some of the leading companies in the Airport Security Market, with a focus on this segment of these companies’ operations.
How the Airport Security Market report helps you
In summary, our 450+ page report provides you with the following knowledge:
• Revenue forecasts to 2030 for Airport Security Market, with forecasts for System, Application, and End-User, each forecasted at a global and regional level– discover the industry’s prospects, finding the most lucrative places for investments and revenues
• Revenue forecasts to 2030 for 5 regional and 19 key national markets – See forecasts for the Airport Security market in North America, Europe, Asia-Pacific, Latin America, and Middle East & Africa. Also forecasted is the market in the US, Canada, Argentina, Brazil, Mexico, Germany, France, UK, Italy, Spain, Russia, China, India, Japan, Australia, South Korea, Southeast Asia, South Africa, and GCC among other prominent economies.
• Prospects for established firms and those seeking to enter the market– including company profiles for 10 of the major companies involved in the Airport Security Market.
Key companies operating in Airport Security industry are given below:
• Bruker Corporation
• CEIA SpA
• G4S Plc
• L3Harris Technologies
• OT-Morpho (IDEMIA)
• Nuctech Company
• OSI Systems
• Securitas AB
• Smiths Group
• SITA, Hitachi, Ltd.
• Thales SA
• The Brink’s Co.
• Siemens AG
• Magal Security Systems.
Find quantitative and qualitative analyses with independent predictions. Receive information that only our report contains, staying informed with this invaluable business intelligence.
Information found nowhere else
With our newly report title, you are less likely to fall behind in knowledge or miss out on opportunities. See how our work could benefit your research, analyses, and decisions. Visiongain’s study is for everybody needing commercial analyses for the Airport Security Market and leading companies. You will find data, trends and predictions.
To access the data contained in this document please email contactus@visiongain.com
Buy our report today Airport Security Market Report 2020-2030: Forecasts by System (Biometric System, Alert and Cyber Security System E-fence and Ground Surveillance Radar System, E-tag System, Others), by End-use (Terminal Side, Air Side, Land Side), by Application (Surveillance, Access Control, Perimeter Security, Screening, Cyber Security, Others), by Region (North America, Europe, Asia Pacific, Latin America, Middle East & Africa) Plus Analysis of Leading Airport Security Companies and COVID-19 Recovery Scenarios. Avoid missing out by staying informed – order our report now.
Visiongain is a trading partner with the US Federal Government
CCR Ref number: KD4R6
Do you have any custom requirements we can help you with? Any need for a specific country, geo region, market segment or specific company information? Contact us today, we can discuss your needs and see how we can help: sara.peerun@visiongain.com
1.1. Global Airport Security Market Overview
1.2. Why You Should Read This Report
1.3. How This Report Delivers
1.4. Key Questions Answered by This Analytical Report
1.5. Who Is This Report For?
1.6. Methodology
1.6.1. Primary Research
1.6.2. Secondary Research
1.6.3. Market Evaluation & Forecasting Methodology
1.7. Frequently Asked Questions (FAQ)
1.8. Associated Visiongain Reports
1.9. About Visiongain
2. Airport Security: Executive Summary
3. Airport Security Market: Introduction
3.1. Airport Security Technology
3.1.1. Engineering, Project Management Assistance, Project Contracting Assistance
3.1.1.1. Audit, consulting and engineering
3.1.1.2. Modelling and simulation
3.1.1.3. Integration and overall project management
3.1.1.4. Training
3.1.2. Air Transport Security
3.1.2.1. Individual security screening
3.1.2.2. Security screening for hand and hold luggage
3.1.2.3. Security screening for freight, catering and mail
3.1.2.4. Counter-narcotics activities
3.1.3. Platform Protection
3.1.3.1. Surveillance
3.1.3.2. Anti-intrusion fences and systems
3.1.3.3. Surveillance and neutralization robots
3.1.3.4. Protecting physical access routes
3.1.3.5. Personal access control
3.1.3.6. Tracking
3.1.3.7. Means of intervention
3.1.4. Airport Building Protection
3.1.4.1. Status Sensors
3.1.4.2. Video analysis and sensor fusion
3.1.5. Operations
3.1.5.1. Communications and co-operation
3.1.5.2. Hypervision and integrated control centre
3.1.5.3. Data protection
3.2. Airport Council International (ACI) Practices
3.2.1. General
3.2.2. States’ Responsibility for Aviation Security
3.2.3. Airport Security Programmes
3.2.4. Quality Control of Airport Security Programmes
3.2.5. Preventive Security Measures
3.2.6. Measures Relating to Access Control
3.2.7. Measures Relating to Aircraft
3.2.8. Measures Relating to Passengers and Their Cabin Baggage
3.2.9. Measures Relating to Hold Baggage
3.2.10. Measures Relating to Cargo, Mail and Other Goods
4. Airport Security Market Outlook
4.1. Airport Security Industry
4.2. Increasing Number of Airports Globally
4.3. Rising Passenger Volume and Cargo Movements
4.4. The Evolving Nature of Security Threats to Civil Aviation
4.5. Common Airport Security Challenges
4.6. Airline Industry
4.7. Airport Security Industry: SWOT Analysis
4.7.1. Strength - Increasing cyber-attacks in civil aviation industry
4.7.2. Weakness - Asset protection and efficiency are the two biggest challenges for the airport industry
4.7.3. Opportunities - Increasing airport construction
4.7.4. Threats - The COVID-19 crisis has grounded airlines and halted air travel all over the world
4.8. Airport Security Industry: PESTEL Model
4.9. COVID Impact on Aviation and Airport Security Industry
5. Airport Security Market by System
5.1. Airport Security Market Outlook by System
5.1.1. Airport Security Market Outlook by System: V Shaped Recovery
5.1.2. Airport Security Market Outlook by System: U Shaped Recovery
5.1.3. Airport Security Market Outlook by System: L Shaped Recovery
5.1.4. Airport Security Market Outlook by System: W Shaped Recovery
5.2. Biometric System Accounted for Largest Market Share in Airport Security Industry
5.3. Alert and Cyber Security System are Expected to be the Fastest Growing Security Systems
5.4. How E-fence and Ground Surveillance Radar System Helps in Securing Airport Security?
5.5. Importance of E-tag System
5.6. Other Systems
6. Airport Security Market by Application
6.1. Airport Security Market Outlook by Application
6.1.1. Airport Security Market Outlook by Application: V Shaped Recovery
6.1.2. Airport Security Market Outlook by Application: U Shaped Recovery
6.1.3. Airport Security Market Outlook by Application: L Shaped Recovery
6.1.4. Airport Security Market Outlook by Application: W Shaped Recovery
6.2. Need of Surveillance Systems at the Airports
6.3. Technological enhancement in Airport Security for Access Control Application
6.4. Perimeter Security Breaches at the Airport
6.5. How Airport Screening Works?
6.6. Importance of Cyber Security at the Airport
6.7. Other Applications
7. Airport Security Market by End-Use
7.1. Airport Security Market Outlook by End-Use
7.1.1. Airport Security Market Outlook by End-Use: V Shaped Recovery
7.1.2. Airport Security Market Outlook by End-Use: U Shaped Recovery
7.1.3. Airport Security Market Outlook by End-Use: L Shaped Recovery
7.1.4. Airport Security Market Outlook by End-Use: W Shaped Recovery
7.2. Airport Security Systems in Terminal Side
7.3. Importance of Airport Security in Air Side Protection
7.4. Necessity of Land Side Security at the Airport
8. Airport Security Market by Region
8.1. Airport Security Market Outlook by Region
8.1.1. Airport Security Market Outlook by Region: V Shaped Recovery
8.1.2. Airport Security Market Outlook by Region: U Shaped Recovery
8.1.3. Airport Security Market Outlook by Region: L Shaped Recovery
8.1.4. Airport Security Market Outlook by Region: W Shaped Recovery
8.2. North America - Presence of well-established electronic and security component manufacturers
8.2.1. North America Airport Security Market by System
8.2.2. North America Airport Security Market by Application
8.2.3. North America Airport Security Market by End-User
8.2.4. U.S. - The United States continues to be the primary growth driver for the aerospace & defense industry
8.2.5. U.S.: Key Indicators
8.2.5.1. Total Number of Airports
8.2.5.2. Air Transport
8.2.5.3. Past Security Incidents
8.2.6. Canada - One of the most successful and safest civil aviation Programmes in the world.
8.2.7. Canada: Key Indicators
8.2.7.1. Total Number of Airports
8.2.7.2. Air Transport
8.2.7.3. Past Security Incidents
8.3. Europe - Technological advancement in security equipment’s
8.3.1. Europe Airport Security Market by System
8.3.2. Europe Airport Security Market by Application
8.3.3. Europe Airport Security Market by End-User
8.3.4. UK - The Defense and Security Accelerator (DASA) is making more funding available for innovations that enhance aviation security measures
8.3.5. UK: Key Indicators
8.3.5.1. Total Number of Airports
8.3.5.2. Air Transport
8.3.5.3. Past Security Incidents
8.3.6. Spain - The Spanish airport authority Aena is remodeling its Adolfo Suárez Madrid-Barajas facility
8.3.7. Spain: Key Indicators
8.3.7.1. Total Number of Airports
8.3.7.2. Air Transport
8.3.7.3. Past Security Incidents
8.3.8. Italy - Italy is an important European market for airport and ground support equipment
8.3.9. Italy: Key Indicators
8.3.9.1. Total Number of Airports
8.3.9.2. Air Transport
8.3.9.3. Past Security Incidents
8.3.10. Germany – Increasing number of passengers and volume of cargo in Germany
8.3.11. Germany: Key Indicators
8.3.11.1. Total Number of Airports
8.3.11.2. Air Transport
8.3.11.3. Past Security Incidents
8.3.12. France – Strong Aerospace & Defense Industry
8.3.13. France: Key Indicators
8.3.13.1. Total Number of Airports
8.3.13.2. Air Transport
8.3.13.3. Past Security Incidents
8.3.14. Russia
8.3.15. Russia: Key Indicators
8.3.15.1. Total Number of Airports
8.3.15.2. Air Transport
8.3.15.3. Past Security Incidents
8.3.16. Rest of Europe
8.4. Asia Pacific - Growing tourism in Singapore, Malaysia, Indonesia, and Thailand
8.4.1. Asia Pacific Airport Security Market by System
8.4.2. Asia Pacific Airport Security Market by Application
8.4.3. Asia Pacific Airport Security Market by End-User
8.4.4. China - China, the fastest-growing aviation market globally, could require 8,090 aircraft over the next 20 years
8.4.5. China: Key Indicators
8.4.5.1. Total Number of Airports
8.4.5.2. Air Transport
8.4.5.3. Past Security Incidents
8.4.6. Japan - Japan’s passenger traffic is expected to grow at about 3.0 percent over the next 20 years
8.4.7. Japan: Key Indicators
8.4.7.1. Total Number of Airports
8.4.7.2. Air Transport
8.4.7.3. Past Security Incidents
8.4.8. India - India is expected to become the world’s third largest aviation market by 2030
8.4.9. India: Key Indicators
8.4.9.1. Total Number of Airports
8.4.9.2. Air Transport
8.4.9.3. Past Security Incidents
8.4.10. Australia - Aviation is expected to remain a positive factor for Australian tourism
8.4.11. Australia: Key Indicators
8.4.11.1. Total Number of Airports
8.4.11.2. Air Transport
8.4.11.3. Past Security Incidents
8.4.12. South Korea - South Korea’s Incheon Airport Introduces the World’s First AI Based Security Screening System
8.4.13. South Korea: Key Indicators
8.4.13.1. Total Number of Airports
8.4.13.2. Air Transport
8.4.13.3. Past Security Incidents
8.4.14. Southeast Asia - Asean’s airlines are poised for rapid expansion over the next two decades
8.4.15. Rest of Asia Pacific
8.5. Latin America - Increasing number of under construction airport projects in Argentina and Mexico
8.5.1. Latin America Airport Security Market by System
8.5.2. Latin America Airport Security Market by Application
8.5.3. Latin America Airport Security Market by End-User
8.5.4. Brazil - As of December 2019, Brazil had the highest market share in the Latin America aviation market
8.5.5. Brazil: Key Indicators
8.5.5.1. Total Number of Airports
8.5.5.2. Air Transport
8.5.5.3. Past Security Incidents
8.5.6. Argentina – Impact of COVID-19 on the Argentina Air Transport Sector
8.5.7. Argentina: Key Indicators
8.5.7.1. Total Number of Airports
8.5.7.2. Air Transport
8.5.7.3. Past Security Incidents
8.5.8. Mexico - Importance of collaboration between Industry and Government
8.5.9. Mexico: Key Indicators
8.5.9.1. Total Number of Airports
8.5.9.2. Air Transport
8.5.9.3. Past Security Incidents
8.5.10. Rest of Latin America
8.6. Middle East & Africa - Increasing terrorist and drone attacks in Middle East & African Countries
8.6.1. Middle East & Africa Airport Security Market by System
8.6.2. Middle East & Africa Airport Security Market by Application
8.6.3. Middle East & Africa Airport Security Market by End-User
8.6.4. GCC - Increasing infrastructure development in in Bahrain, Saudi Arabia, United Arab Emirates, Kuwait, and Qatar
8.6.5. South Africa - Developing indigenous products and technologies
8.6.6. South Africa: Key Indicators
8.6.6.1. Total Number of Airports
8.6.6.2. Air Transport
8.6.6.3. Past Security Incidents
8.6.7. Rest of Middle East & Africa
9. Company Profiles
9.1. Bruker Corporation
9.1.1. Company Overview
9.1.2. Product Benchmarking
9.1.3. Bruker Corporation: Airport Security Selected Recent Contracts / Projects / Programmes
9.1.4. Financials
9.1.5. Recent News
9.2. CEIA SpA
9.2.1. Company Overview
9.2.2. Product Offering
9.2.3. CEIA SpA: Airport Security Selected Recent Contracts / Projects / Programmes
9.3. G4S plc
9.3.1. Company Overview
9.3.2. Product Offering
9.3.3. G4S PLC: Airport Security Selected Recent Contracts / Projects / Programmes
9.3.4. Financials
9.3.5. Recent News
9.4. L3Harris Technologies Inc
9.4.1. Company Overview
9.4.2. Product Offering
9.4.3. L3Harris Technologies Inc: Airport Security Selected Recent Contracts / Projects / Programmes
9.4.4. Financials
9.4.5. Recent News
9.5. OT-Morpho (IDEMIA)
9.5.1. Company Overview
9.5.2. Product Offering
9.5.3. OT-Morpho (IDEMIA): Airport Security Selected Recent Contracts / Projects / Programmes
9.6. Nuctech Company Ltd
9.6.1. Company Overview
9.6.2. Product Offering
9.6.3. Nuctech Company Ltd: Airport Security Selected Recent Contracts / Projects / Programmes
9.7. OSI Systems
9.7.1. Company Overview
9.7.2. Product Offering
9.7.3. OSI Systems: Airport Security Selected Recent Contracts / Projects / Programmes
9.7.4. Financials
9.7.5. Recent News
9.8. Securitas AB
9.8.1. Company Overview
9.8.2. Product Offering
9.8.3. Financials
9.8.4. Recent News
9.9. Smiths Detection (Smiths Group Plc Division)
9.9.1. Company Overview
9.9.2. Product Offering
9.9.3. Financials
9.9.4. Recent News
9.10. SITA
9.10.1. Company Overview
9.10.2. Product Offering
9.10.3. SITA: Airport Security Selected Recent Contracts / Projects / Programmes
9.10.4. Recent News
9.11. Hitachi
9.11.1. Company Overview
9.11.2. Product Offering
9.11.3. Hitachi: Airport Security Selected Recent Contracts / Projects / Programmes
9.11.4. Financials
9.11.5. Recent News
9.12. Thales SA
9.12.1. Company Overview
9.12.2. Product Offering
9.12.3. Thales SA: Airport Security Selected Recent Contracts / Projects / Programmes
9.12.4. Financials
9.13. The Brinks Co.
9.13.1. Company Overview
9.13.2. Product Offering
9.13.3. Financials
9.14. Siemens AG
9.14.1. Company Overview
9.14.2. Product Offering
9.14.3. Siemens AG: Airport Security Selected Recent Contracts / Projects / Programmes
9.14.4. Financials
9.14.5. Recent News
9.15. Magal Security Systems
9.15.1. Company Overview
9.15.2. Product Offering
9.15.3. Financials
9.16. Honeywell International
9.16.1. Company Overview
9.16.2. Financials
9.16.3. Recent News
9.17. Analogic Corporation
9.17.1. Company Overview
9.17.2. Product Offering
9.17.3. Analogic Corporation: Airport Security Selected Recent Contracts / Projects / Programmes
9.17.4. Recent News
10. Conclusion & Recommendations
10.1. Conclusion
10.2. Recommendations
11. Glossary
List of Figures
FIG.1 Airport Security Industry: Segmentation and Scope
FIG.2 Expenditure on airport infrastructure as of October 2019, by region and type (USD Bn)
FIG.3 Global Air Traffic Passenger Demand Annual Growth, 2010 – 2019 (%)
FIG.4 Porter’s Five Forces on Airline Industry
FIG.5 Airport Security Industry – SWOT Analysis
FIG.6 Global Airport Security Market Size by System, 2020 – 2030 (USD Million, AGR %)
FIG.7 Global Airport Security Market Size by System, 2020 – 2030 (USD Million, AGR %): V Shaped Recovery
FIG.8 Global Airport Security Market Size by System, 2020 – 2030 (USD Million, AGR %): U Shaped Recovery
FIG.9 Global Airport Security Market Size by System, 2020 – 2030 (USD Million, AGR %): L Shaped Recovery
FIG.10 Global Airport Security Market Size by System, 2020 – 2030 (USD Million, AGR %): W Shaped Recovery
FIG.11 Global Airport Security Market Share by System, 2020, 2025, 2030 (%)
FIG.12 Airport Security for Biometric System Market Value Forecast, 2020 – 2030 (USD Million, AGR %)
FIG.13 Airport Security for Biometric System Market Value Forecast, 2020 – 2030 (USD Million, AGR %): V Shaped Recovery
FIG.14 Airport Security for Biometric System Market Value Forecast, 2020 – 2030 (USD Million, AGR %): U Shaped Recovery
FIG.15 Airport Security for Biometric System Market Value Forecast, 2020 – 2030 (USD Million, AGR %): L Shaped Recovery
FIG.16 Airport Security for Biometric System Market Value Forecast, 2020 – 2030 (USD Million, AGR %): W Shaped Recovery
FIG.17 Airport Security for Alert and Cyber Security System Market Value Forecast, 2020 – 2030 (USD Million, AGR %)
FIG.18 Airport Security for Alert and Cyber Security System Market Value Forecast, 2020 – 2030 (USD Million, AGR %): V Shaped Recovery
FIG.19 Airport Security for Alert and Cyber Security System Market Value Forecast, 2020 – 2030 (USD Million, AGR %): U Shaped Recovery
FIG.20 Airport Security for Alert and Cyber Security System Market Value Forecast, 2020 – 2030 (USD Million, AGR %): L Shaped Recovery
FIG.21 Airport Security for Alert and Cyber Security System Market Value Forecast, 2020 – 2030 (USD Million, AGR %): W Shaped Recovery
FIG.22 Airport Security for E-fence and Ground Surveillance Radar System Market Value Forecast, 2020 – 2030 (USD Million, AGR %)
FIG.23 Airport Security for E-fence and Ground Surveillance Radar System Market Value Forecast, 2020 – 2030 (USD Million, AGR %): V Shaped Recovery
FIG.24 Airport Security for E-fence and Ground Surveillance Radar System Market Value Forecast, 2020 – 2030 (USD Million, AGR %): U Shaped Recovery
FIG.25 Airport Security for E-fence and Ground Surveillance Radar System Market Value Forecast, 2020 – 2030 (USD Million, AGR %): L Shaped Recovery
FIG.26 Airport Security for E-fence and Ground Surveillance Radar System Market Value Forecast, 2020 – 2030 (USD Million, AGR %): W Shaped Recovery
FIG.27 Airport Security for E-tag System Market Value Forecast, 2020 – 2030 (USD Million, AGR %)
FIG.28 Airport Security for E-tag System Market Value Forecast, 2020 – 2030 (USD Million, AGR %): V Shaped Recovery
FIG.29 Airport Security for E-tag System Market Value Forecast, 2020 – 2030 (USD Million, AGR %): U Shaped Recovery
FIG.30 Airport Security for E-tag System Market Value Forecast, 2020 – 2030 (USD Million, AGR %): L Shaped Recovery
FIG.31 Airport Security for E-tag System Market Value Forecast, 2020 – 2030 (USD Million, AGR %): W Shaped Recovery
FIG.32 Airport Security for Other Systems Market Value Forecast, 2020 – 2030 (USD Million, AGR %)
FIG.33 Airport Security for Other Systems Market Value Forecast, 2020 – 2030 (USD Million, AGR %): V Shaped Recovery
FIG.34 Airport Security for Other Systems Market Value Forecast, 2020 – 2030 (USD Million, AGR %): U Shaped Recovery
FIG.35 Airport Security for Other Systems Market Value Forecast, 2020 – 2030 (USD Million, AGR %): L Shaped Recovery
FIG.36 Airport Security for Other Systems Market Value Forecast, 2020 – 2030 (USD Million, AGR %): W Shaped Recovery
FIG.37 Global Airport Security Market Size by Application, 2020 – 2030 (USD Million, AGR %)
FIG.38 Global Airport Security Market Size by Application, 2020 – 2030 (USD Million, AGR %): V Shaped Recovery
FIG.39 Global Airport Security Market Size by Application, 2020 – 2030 (USD Million, AGR %): U Shaped Recovery
FIG.40 Global Airport Security Market Size by Application, 2020 – 2030 (USD Million, AGR %): L Shaped Recovery
FIG.41 Global Airport Security Market Size by Application, 2020 – 2030 (USD Million, AGR %): W Shaped Recovery
FIG.42 Global Airport Security Market Share by Application, 2020, 2025, 2030 (%)
FIG.43 Airport Security for Surveillance Market Value Forecast, 2020 – 2030 (USD Million, AGR %)
FIG.44 Airport Security for Surveillance Market Value Forecast, 2020 – 2030 (USD Million, AGR %): V Shaped Recovery
FIG.45 Airport Security for Surveillance Market Value Forecast, 2020 – 2030 (USD Million, AGR %): U Shaped Recovery
FIG.46 Airport Security for Surveillance Market Value Forecast, 2020 – 2030 (USD Million, AGR %): L Shaped Recovery
FIG.47 Airport Security for Surveillance Market Value Forecast, 2020 – 2030 (USD Million, AGR %): W Shaped Recovery
FIG.48 Airport Security for Access Control Market Value Forecast, 2020 – 2030 (USD Million, AGR %)
FIG.49 Airport Security for Access Control Market Value Forecast, 2020 – 2030 (USD Million, AGR %): V Shaped Recovery
FIG.50 Airport Security for Access Control Market Value Forecast, 2020 – 2030 (USD Million, AGR %): U Shaped Recovery
FIG.51 Airport Security for Access Control Market Value Forecast, 2020 – 2030 (USD Million, AGR %): L Shaped Recovery
FIG.52 Airport Security for Access Control Market Value Forecast, 2020 – 2030 (USD Million, AGR %): W Shaped Recovery
FIG.53 Airport Security for Perimeter Security Market Value Forecast, 2020 – 2030 (USD Million, AGR %)
FIG.54 Airport Security for Perimeter Security Market Value Forecast, 2020 – 2030 (USD Million, AGR %): V Shaped Recovery
FIG.55 Airport Security for Perimeter Security Market Value Forecast, 2020 – 2030 (USD Million, AGR %): U Shaped Recovery
FIG.56 Airport Security for Perimeter Security Market Value Forecast, 2020 – 2030 (USD Million, AGR %): L Shaped Recovery
FIG.57 Airport Security for Perimeter Security Market Value Forecast, 2020 – 2030 (USD Million, AGR %): W Shaped Recovery
FIG.58 Airport Security for Screening Market Value Forecast, 2020 – 2030 (USD Million, AGR %)
FIG.59 Airport Security for Screening Market Value Forecast, 2020 – 2030 (USD Million, AGR %): V Shaped Recovery
FIG.60 Airport Security for Screening Market Value Forecast, 2020 – 2030 (USD Million, AGR %): U Shaped Recovery
FIG.61 Airport Security for Screening Market Value Forecast, 2020 – 2030 (USD Million, AGR %): L Shaped Recovery
FIG.62 Airport Security for Screening Market Value Forecast, 2020 – 2030 (USD Million, AGR %): W Shaped Recovery
FIG.63 Airport Security for Cyber Security Market Value Forecast, 2020 – 2030 (USD Million, AGR %)
FIG.64 Airport Security for Cyber Security Market Value Forecast, 2020 – 2030 (USD Million, AGR %): V Shaped Recovery
FIG.65 Airport Security for Cyber Security Market Value Forecast, 2020 – 2030 (USD Million, AGR %): U Shaped Recovery
FIG.66 Airport Security for Cyber Security Market Value Forecast, 2020 – 2030 (USD Million, AGR %): L Shaped Recovery
FIG.67 Airport Security for Cyber Security Market Value Forecast, 2020 – 2030 (USD Million, AGR %): W Shaped Recovery
FIG.68 Airport Security for Other Applications Market Value Forecast, 2020 – 2030 (USD Million, AGR %)
FIG.69 Airport Security for Other Applications Market Value Forecast, 2020 – 2030 (USD Million, AGR %): V Shaped Recovery
FIG.70 Airport Security for Other Applications Market Value Forecast, 2020 – 2030 (USD Million, AGR %): U Shaped Recovery
FIG.71 Airport Security for Other Applications Market Value Forecast, 2020 – 2030 (USD Million, AGR %): L Shaped Recovery
FIG.72 Airport Security for Other Applications Market Value Forecast, 2020 – 2030 (USD Million, AGR %): W Shaped Recovery
FIG.73 Global Airport Security Market Size by End-Use, 2020 – 2030 (USD Million, AGR %)
FIG.74 Global Airport Security Market Size by End-Use, 2020 – 2030 (USD Million, AGR %): V Shaped Recovery
FIG.75 Global Airport Security Market Size by End-Use, 2020 – 2030 (USD Million, AGR %): U Shaped Recovery
FIG.76 Global Airport Security Market Size by End-Use, 2020 – 2030 (USD Million, AGR %): L Shaped Recovery
FIG.77 Global Airport Security Market Size by End-Use, 2020 – 2030 (USD Million, AGR %): W Shaped Recovery
FIG.78 Global Airport Security Market Share by End-Use, 2020, 2025, 2030 (%)
FIG.79 Global Airport Security Market Value Forecast for Terminal Side, 2020 – 2030 (USD Million, AGR %)
FIG.80 Global Airport Security Market Value Forecast for Terminal Side, 2020 – 2030 (USD Million, AGR %): V Shaped Recovery
FIG.81 Global Airport Security Market Value Forecast for Terminal Side, 2020 – 2030 (USD Million, AGR %): U Shaped Recovery
FIG.82 Global Airport Security Market Value Forecast for Terminal Side, 2020 – 2030 (USD Million, AGR %): L Shaped Recovery
FIG.83 Global Airport Security Market Value Forecast for Terminal Side, 2020 – 2030 (USD Million, AGR %): W Shaped Recovery
FIG.84 Global Airport Security Market Value Forecast for Air Side, 2020 – 2030 (USD Million, AGR %)
FIG.85 Global Airport Security Market Value Forecast for Air Side, 2020 – 2030 (USD Million, AGR %): V Shaped Recovery
FIG.86 Global Airport Security Market Value Forecast for Air Side, 2020 – 2030 (USD Million, AGR %): U Shaped Recovery
FIG.87 Global Airport Security Market Value Forecast for Air Side, 2020 – 2030 (USD Million, AGR %): L Shaped Recovery
FIG.88 Global Airport Security Market Value Forecast for Air Side, 2020 – 2030 (USD Million, AGR %): W Shaped Recovery
FIG.89 Global Airport Security Market Value Forecast for Land Side, 2020 – 2030 (USD Million, AGR %)
FIG.90 Global Airport Security Market Value Forecast for Land Side, 2020 – 2030 (USD Million, AGR %): V Shaped Recovery
FIG.91 Global Airport Security Market Value Forecast for Land Side, 2020 – 2030 (USD Million, AGR %): U Shaped Recovery
FIG.92 Global Airport Security Market Value Forecast for Land Side, 2020 – 2030 (USD Million, AGR %): L Shaped Recovery
FIG.93 Global Airport Security Market Value Forecast for Land Side, 2020 – 2030 (USD Million, AGR %): W Shaped Recovery
FIG.94 Global Airport Security Market Size by Region, 2020 – 2030 (USD Million, AGR %)
FIG.95 Global Airport Security Market Size by Region, 2020 – 2030 (USD Million, AGR %): V Shaped Recovery
FIG.96 Global Airport Security Market Size by Region, 2020 – 2030 (USD Million, AGR %): U Shaped Recovery
FIG.97 Global Airport Security Market Size by Region, 2020 – 2030 (USD Million, AGR %): L Shaped Recovery
FIG.98 Global Airport Security Market Size by Region, 2020 – 2030 (USD Million, AGR %): W Shaped Recovery
FIG.99 Global Airport Security Market Share by Region, 2020, 2025, 2030 (%)
FIG.100 North America Airport Security Market Value Forecast, 2020 – 2030 (USD Million, AGR %)
FIG.101 North America Airport Security Market Value Forecast, 2020 – 2030 (USD Million, AGR %): V Shaped Recovery
FIG.102 North America Airport Security Market Value Forecast, 2020 – 2030 (USD Million, AGR %): U Shaped Recovery
FIG.103 North America Airport Security Market Value Forecast, 2020 – 2030 (USD Million, AGR %): L Shaped Recovery
FIG.104 North America Airport Security Market Value Forecast, 2020 – 2030 (USD Million, AGR %): W Shaped Recovery
FIG.105 North America Airport Security Market Share by Country, 2020, 2025, 2030 (%)
FIG.106 Air Transport Freight in U.S., 2010 – 2018 (Million Ton-KM)
FIG.107 Passengers Carried by Air Transport in U.S., 2010 – 2018 (Millions)
FIG.108 Air Transport Registered Carrier Departures in U.S., 2010 – 2018 (Millions)
FIG.109 U.S. Airport Security Market Value Forecast, 2020 – 2030 (USD Million, AGR %)
FIG.110 U.S. Airport Security Market Value Forecast, 2020 – 2030 (USD Million, AGR %): V Shaped Recovery
FIG.111 U.S. Airport Security Market Value Forecast, 2020 – 2030 (USD Million, AGR %): U Shaped Recovery
FIG.112 U.S. Airport Security Market Value Forecast, 2020 – 2030 (USD Million, AGR %): L Shaped Recovery
FIG.113 U.S. Airport Security Market Value Forecast, 2020 – 2030 (USD Million, AGR %): W Shaped Recovery
FIG.114 Air Transport Freight in Canada, 2010 – 2018 (Million Ton-KM)
FIG.115 Passengers Carried by Air Transport in Canada, 2010 – 2018 (Millions)
FIG.116 Air Transport Registered Carrier Departures in Canada, 2010 – 2018 (Millions)
FIG.117 Canada Airport Security Market Value Forecast, 2020 – 2030 (USD Million, AGR %)
FIG.118 Canada Airport Security Market Value Forecast, 2020 – 2030 (USD Million, AGR %): V Shaped Recovery
FIG.119 Canada Airport Security Market Value Forecast, 2020 – 2030 (USD Million, AGR %): U Shaped Recovery
FIG.120 Canada Airport Security Market Value Forecast, 2020 – 2030 (USD Million, AGR %): L Shaped Recovery
FIG.121 Canada Airport Security Market Value Forecast, 2020 – 2030 (USD Million, AGR %): W Shaped Recovery
FIG.122 Europe Airport Security Market Value Forecast, 2020 – 2030 (USD Million, AGR %)
FIG.123 Europe Airport Security Market Value Forecast, 2020 – 2030 (USD Million, AGR %): V Shaped Recovery
FIG.124 Europe Airport Security Market Value Forecast, 2020 – 2030 (USD Million, AGR %): U Shaped Recovery
FIG.125 Europe Airport Security Market Value Forecast, 2020 – 2030 (USD Million, AGR %): L Shaped Recovery
FIG.126 Europe Airport Security Market Value Forecast, 2020 – 2030 (USD Million, AGR %): W Shaped Recovery
FIG.127 Europe Airport Security Market Share by Country, 2020, 2025, 2030 (%)
FIG.128 Air Transport Freight in UK, 2010 – 2018 (Million Ton-KM)
FIG.129 Passengers Carried by Air Transport in UK, 2010 – 2018 (Millions)
FIG.130 Air Transport Registered Carrier Departures in UK, 2010 – 2018 (Millions)
FIG.131 UK Airport Security Market Value Forecast, 2020 – 2030 (USD Million, AGR %)
FIG.132 UK Airport Security Market Value Forecast, 2020 – 2030 (USD Million, AGR %): V Shaped Recovery
FIG.133 UK Airport Security Market Value Forecast, 2020 – 2030 (USD Million, AGR %): U Shaped Recovery
FIG.134 UK Airport Security Market Value Forecast, 2020 – 2030 (USD Million, AGR %): L Shaped Recovery
FIG.135 UK Airport Security Market Value Forecast, 2020 – 2030 (USD Million, AGR %): W Shaped Recovery
FIG.136 Air Transport Freight in Spain, 2010 – 2018 (Million Ton-KM)
FIG.137 Passengers Carried by Air Transport in Spain, 2010 – 2018 (Millions)
FIG.138 Air Transport Registered Carrier Departures in Spain, 2010 – 2018 (Millions)
FIG.139 Spain Airport Security Market Value Forecast, 2020 – 2030 (USD Million, AGR %)
FIG.140 Spain Airport Security Market Value Forecast, 2020 – 2030 (USD Million, AGR %): V Shaped Recovery
FIG.141 Spain Airport Security Market Value Forecast, 2020 – 2030 (USD Million, AGR %): U Shaped Recovery
FIG.142 Spain Airport Security Market Value Forecast, 2020 – 2030 (USD Million, AGR %): L Shaped Recovery
FIG.143 Spain Airport Security Market Value Forecast, 2020 – 2030 (USD Million, AGR %): W Shaped Recovery
FIG.144 Air Transport Freight in Italy, 2010 – 2018 (Million Ton-KM)
FIG.145 Passengers Carried by Air Transport in Italy, 2010 – 2018 (Millions)
FIG.146 Air Transport Registered Carrier Departures in Italy, 2010 – 2018 (Millions)
FIG.147 Italy Airport Security Market Value Forecast, 2020 – 2030 (USD Million, AGR %)
FIG.148 Italy Airport Security Market Value Forecast, 2020 – 2030 (USD Million, AGR %): V Shaped Recovery
FIG.149 Italy Airport Security Market Value Forecast, 2020 – 2030 (USD Million, AGR %): U Shaped Recovery
FIG.150 Italy Airport Security Market Value Forecast, 2020 – 2030 (USD Million, AGR %): L Shaped Recovery
FIG.151 Italy Airport Security Market Value Forecast, 2020 – 2030 (USD Million, AGR %): W Shaped Recovery
FIG.152 Air Transport Freight in Germany, 2010 – 2018 (Million Ton-KM)
FIG.153 Passengers Carried by Air Transport in Germany, 2010 – 2018 (Millions)
FIG.154 Air Transport Registered Carrier Departures in Germany, 2010 – 2018 (Millions)
FIG.155 Germany Airport Security Market Value Forecast, 2020 – 2030 (USD Million, AGR %)
FIG.156 Germany Airport Security Market Value Forecast, 2020 – 2030 (USD Million, AGR %): V Shaped Recovery
FIG.157 Germany Airport Security Market Value Forecast, 2020 – 2030 (USD Million, AGR %): U Shaped Recovery
FIG.158 Germany Airport Security Market Value Forecast, 2020 – 2030 (USD Million, AGR %): L Shaped Recovery
FIG.159 Germany Airport Security Market Value Forecast, 2020 – 2030 (USD Million, AGR %): W Shaped Recovery
FIG.160 Air Transport Freight in France, 2010 – 2018 (Million Ton-KM)
FIG.161 Passengers Carried by Air Transport in France, 2010 – 2018 (Millions)
FIG.162 Air Transport Registered Carrier Departures in France, 2010 – 2018 (Millions)
FIG.163 France Airport Security Market Value Forecast, 2020 – 2030 (USD Million, AGR %)
FIG.164 France Airport Security Market Value Forecast, 2020 – 2030 (USD Million, AGR %): V Shaped Recovery
FIG.165 France Airport Security Market Value Forecast, 2020 – 2030 (USD Million, AGR %): U Shaped Recovery
FIG.166 France Airport Security Market Value Forecast, 2020 – 2030 (USD Million, AGR %): L Shaped Recovery
FIG.167 France Airport Security Market Value Forecast, 2020 – 2030 (USD Million, AGR %): W Shaped Recovery
FIG.168 Air Transport Freight in Russia, 2010 – 2018 (Million Ton-KM)
FIG.169 Passengers Carried by Air Transport in Russia, 2010 – 2018 (Millions)
FIG.170 Air Transport Registered Carrier Departures in Russia, 2010 – 2018 (Millions)
FIG.171 Russia Airport Security Market Value Forecast, 2020 – 2030 (USD Million, AGR %)
FIG.172 Russia Airport Security Market Value Forecast, 2020 – 2030 (USD Million, AGR %): V Shaped Recovery
FIG.173 Russia Airport Security Market Value Forecast, 2020 – 2030 (USD Million, AGR %): U Shaped Recovery
FIG.174 Russia Airport Security Market Value Forecast, 2020 – 2030 (USD Million, AGR %): L Shaped Recovery
FIG.175 Russia Airport Security Market Value Forecast, 2020 – 2030 (USD Million, AGR %): W Shaped Recovery
FIG.176 Rest of Europe Airport Security Market Value Forecast, 2020 – 2030 (USD Million, AGR %)
FIG.177 Rest of Europe Airport Security Market Value Forecast, 2020 – 2030 (USD Million, AGR %): V Shaped Recovery
FIG.178 Rest of Europe Airport Security Market Value Forecast, 2020 – 2030 (USD Million, AGR %): U Shaped Recovery
FIG.179 Rest of Europe Airport Security Market Value Forecast, 2020 – 2030 (USD Million, AGR %): L Shaped Recovery
FIG.180 Rest of Europe Airport Security Market Value Forecast, 2020 – 2030 (USD Million, AGR %): W Shaped Recovery
FIG.181 Asia Pacific Airport Security Market Value Forecast, 2020 – 2030 (USD Million, AGR %)
FIG.182 Asia Pacific Airport Security Market Value Forecast, 2020 – 2030 (USD Million, AGR %): V Shaped Recovery
FIG.183 Asia Pacific Airport Security Market Value Forecast, 2020 – 2030 (USD Million, AGR %): U Shaped Recovery
FIG.184 Asia Pacific Airport Security Market Value Forecast, 2020 – 2030 (USD Million, AGR %): L Shaped Recovery
FIG.185 Asia Pacific Airport Security Market Value Forecast, 2020 – 2030 (USD Million, AGR %): W Shaped Recovery
FIG.186 Asia Pacific Airport Security Market Share by Country, 2020, 2025, 2030 (%)
FIG.187 Air Transport Freight in China, 2010 – 2018 (Million Ton-KM)
FIG.188 Passengers Carried by Air Transport in China, 2010 – 2018 (Millions)
FIG.189 Air Transport Registered Carrier Departures in China, 2010 – 2018 (Millions)
FIG.190 China Airport Security Market Value Forecast, 2020 – 2030 (USD Million, AGR %)
FIG.191 China Airport Security Market Value Forecast, 2020 – 2030 (USD Million, AGR %): V Shaped Recovery
FIG.192 China Airport Security Market Value Forecast, 2020 – 2030 (USD Million, AGR %): U Shaped Recovery
FIG.193 China Airport Security Market Value Forecast, 2020 – 2030 (USD Million, AGR %): L Shaped Recovery
FIG.194 China Airport Security Market Value Forecast, 2020 – 2030 (USD Million, AGR %): W Shaped Recovery
FIG.195 Air Transport Freight in Japan, 2010 – 2018 (Million Ton-KM)
FIG.196 Passengers Carried by Air Transport in Japan, 2010 – 2018 (Millions)
FIG.197 Air Transport Registered Carrier Departures in Japan, 2010 – 2018 (Millions)
FIG.198 Japan Airport Security Market Value Forecast, 2020 – 2030 (USD Million, AGR %)
FIG.199 Japan Airport Security Market Value Forecast, 2020 – 2030 (USD Million, AGR %): V Shaped Recovery
FIG.200 Japan Airport Security Market Value Forecast, 2020 – 2030 (USD Million, AGR %): U Shaped Recovery
FIG.201 Japan Airport Security Market Value Forecast, 2020 – 2030 (USD Million, AGR %): L Shaped Recovery
FIG.202 Japan Airport Security Market Value Forecast, 2020 – 2030 (USD Million, AGR %): W Shaped Recovery
FIG.203 Air Transport Freight in India, 2010 – 2018 (Million Ton-KM)
FIG.204 Passengers Carried by Air Transport in India, 2010 – 2018 (Millions)
FIG.205 Air Transport Registered Carrier Departures in India, 2010 – 2018 (Millions)
FIG.206 India Airport Security Market Value Forecast, 2020 – 2030 (USD Million, AGR %)
FIG.207 India Airport Security Market Value Forecast, 2020 – 2030 (USD Million, AGR %): V Shaped Recovery
FIG.208 India Airport Security Market Value Forecast, 2020 – 2030 (USD Million, AGR %): U Shaped Recovery
FIG.209 India Airport Security Market Value Forecast, 2020 – 2030 (USD Million, AGR %): L Shaped Recovery
FIG.210 India Airport Security Market Value Forecast, 2020 – 2030 (USD Million, AGR %): W Shaped Recovery
FIG.211 Air Transport Freight in Australia, 2010 – 2018 (Million Ton-KM)
FIG.212 Passengers Carried by Air Transport in Australia, 2010 – 2018 (Millions)
FIG.213 Air Transport Registered Carrier Departures in Australia, 2010 – 2018 (Millions)
FIG.214 Australia Airport Security Market Value Forecast, 2020 – 2030 (USD Million, AGR %)
FIG.215 Australia Airport Security Market Value Forecast, 2020 – 2030 (USD Million, AGR %): V Shaped Recovery
FIG.216 Australia Airport Security Market Value Forecast, 2020 – 2030 (USD Million, AGR %): U Shaped Recovery
FIG.217 Australia Airport Security Market Value Forecast, 2020 – 2030 (USD Million, AGR %): L Shaped Recovery
FIG.218 Australia Airport Security Market Value Forecast, 2020 – 2030 (USD Million, AGR %): W Shaped Recovery
FIG.219 Air Transport Freight in South Korea, 2010 – 2018 (Million Ton-KM)
FIG.220 Passengers Carried by Air Transport in South Korea, 2010 – 2018 (Millions)
FIG.221 Air Transport Registered Carrier Departures in South Korea, 2010 – 2018 (Millions)
FIG.222 South Korea Airport Security Market Value Forecast, 2020 – 2030 (USD Million, AGR %)
FIG.223 South Korea Airport Security Market Value Forecast, 2020 – 2030 (USD Million, AGR %): V Shaped Recovery
FIG.224 South Korea Airport Security Market Value Forecast, 2020 – 2030 (USD Million, AGR %): U Shaped Recovery
FIG.225 South Korea Airport Security Market Value Forecast, 2020 – 2030 (USD Million, AGR %): L Shaped Recovery
FIG.226 South Korea Airport Security Market Value Forecast, 2020 – 2030 (USD Million, AGR %): W Shaped Recovery
FIG.227 Southeast Asia Airport Security Market Value Forecast, 2020 – 2030 (USD Million, AGR %)
FIG.228 Southeast Asia Airport Security Market Value Forecast, 2020 – 2030 (USD Million, AGR %): V Shaped Recovery
FIG.229 Southeast Asia Airport Security Market Value Forecast, 2020 – 2030 (USD Million, AGR %): U Shaped Recovery
FIG.230 Southeast Asia Airport Security Market Value Forecast, 2020 – 2030 (USD Million, AGR %): L Shaped Recovery
FIG.231 Southeast Asia Airport Security Market Value Forecast, 2020 – 2030 (USD Million, AGR %): W Shaped Recovery
FIG.232 Rest of Asia Pacific Airport Security Market Value Forecast, 2020 – 2030 (USD Million, AGR %)
FIG.233 Rest of Asia Pacific Airport Security Market Value Forecast, 2020 – 2030 (USD Million, AGR %): V Shaped Recovery
FIG.234 Rest of Asia Pacific Airport Security Market Value Forecast, 2020 – 2030 (USD Million, AGR %): U Shaped Recovery
FIG.235 Rest of Asia Pacific Airport Security Market Value Forecast, 2020 – 2030 (USD Million, AGR %): L Shaped Recovery
FIG.236 Rest of Asia Pacific Airport Security Market Value Forecast, 2020 – 2030 (USD Million, AGR %): W Shaped Recovery
FIG.237 Latin America Airport Security Market Value Forecast, 2020 – 2030 (USD Million, AGR %)
FIG.238 Latin America Airport Security Market Value Forecast, 2020 – 2030 (USD Million, AGR %): V Shaped Recovery
FIG.239 Latin America Airport Security Market Value Forecast, 2020 – 2030 (USD Million, AGR %): U Shaped Recovery
FIG.240 Latin America Airport Security Market Value Forecast, 2020 – 2030 (USD Million, AGR %): L Shaped Recovery
FIG.241 Latin America Airport Security Market Value Forecast, 2020 – 2030 (USD Million, AGR %): W Shaped Recovery
FIG.242 Latin America Airport Security Market Share by Country, 2020, 2025, 2030 (%)
FIG.243 Air Transport Freight in Brazil, 2010 – 2018 (Million Ton-KM)
FIG.244 Passengers Carried by Air Transport in Brazil, 2010 – 2018 (Millions)
FIG.245 Air Transport Registered Carrier Departures in Brazil, 2010 – 2018 (Millions)
FIG.246 Brazil Airport Security Market Value Forecast, 2020 – 2030 (USD Million, AGR %)
FIG.247 Brazil Airport Security Market Value Forecast, 2020 – 2030 (USD Million, AGR %): V Shaped Recovery
FIG.248 Brazil Airport Security Market Value Forecast, 2020 – 2030 (USD Million, AGR %): U Shaped Recovery
FIG.249 Brazil Airport Security Market Value Forecast, 2020 – 2030 (USD Million, AGR %): L Shaped Recovery
FIG.250 Brazil Airport Security Market Value Forecast, 2020 – 2030 (USD Million, AGR %): W Shaped Recovery
FIG.251 Air Transport Freight in Argentina, 2010 – 2018 (Million Ton-KM)
FIG.252 Passengers Carried by Air Transport in Argentina, 2010 – 2018 (Millions)
FIG.253 Air Transport Registered Carrier Departures in Argentina, 2010 – 2018 (Millions)
FIG.254 Argentina Airport Security Market Value Forecast, 2020 – 2030 (USD Million, AGR %)
FIG.255 Argentina Airport Security Market Value Forecast, 2020 – 2030 (USD Million, AGR %): V Shaped Recovery
FIG.256 Argentina Airport Security Market Value Forecast, 2020 – 2030 (USD Million, AGR %): U Shaped Recovery
FIG.257 Argentina Airport Security Market Value Forecast, 2020 – 2030 (USD Million, AGR %): L Shaped Recovery
FIG.258 Argentina Airport Security Market Value Forecast, 2020 – 2030 (USD Million, AGR %): W Shaped Recovery
FIG.259 Air Transport Freight in Mexico, 2010 – 2018 (Million Ton-KM)
FIG.260 Passengers Carried by Air Transport in Mexico, 2010 – 2018 (Millions)
FIG.261 Air Transport Registered Carrier Departures in Mexico, 2010 – 2018 (Millions)
FIG.262 Mexico Airport Security Market Value Forecast, 2020 – 2030 (USD Million, AGR %)
FIG.263 Mexico Airport Security Market Value Forecast, 2020 – 2030 (USD Million, AGR %): V Shaped Recovery
FIG.264 Mexico Airport Security Market Value Forecast, 2020 – 2030 (USD Million, AGR %): U Shaped Recovery
FIG.265 Mexico Airport Security Market Value Forecast, 2020 – 2030 (USD Million, AGR %): L Shaped Recovery
FIG.266 Mexico Airport Security Market Value Forecast, 2020 – 2030 (USD Million, AGR %): W Shaped Recovery
FIG.267 Rest of Latin America Airport Security Market Value Forecast, 2020 – 2030 (USD Million, AGR %)
FIG.268 Rest of Latin America Airport Security Market Value Forecast, 2020 – 2030 (USD Million, AGR %): V Shaped Recovery
FIG.269 Rest of Latin America Airport Security Market Value Forecast, 2020 – 2030 (USD Million, AGR %): U Shaped Recovery
FIG.270 Rest of Latin America Airport Security Market Value Forecast, 2020 – 2030 (USD Million, AGR %): L Shaped Recovery
FIG.271 Rest of Latin America Airport Security Market Value Forecast, 2020 – 2030 (USD Million, AGR %): W Shaped Recovery
FIG.272 Middle East & Africa Airport Security Market Value Forecast, 2020 – 2030 (USD Million, AGR %)
FIG.273 Middle East & Africa Airport Security Market Value Forecast, 2020 – 2030 (USD Million, AGR %): V Shaped Recovery
FIG.274 Middle East & Africa Airport Security Market Value Forecast, 2020 – 2030 (USD Million, AGR %): U Shaped Recovery
FIG.275 Middle East & Africa Airport Security Market Value Forecast, 2020 – 2030 (USD Million, AGR %): L Shaped Recovery
FIG.276 Middle East & Africa Airport Security Market Value Forecast, 2020 – 2030 (USD Million, AGR %): W Shaped Recovery
FIG.277 Middle East & Africa Airport Security Market Share by Country, 2020, 2025, 2030 (%)
FIG.278 GCC Airport Security Market Value Forecast, 2020 – 2030 (USD Million, AGR %)
FIG.279 GCC Airport Security Market Value Forecast, 2020 – 2030 (USD Million, AGR %): V Shaped Recovery
FIG.280 GCC Airport Security Market Value Forecast, 2020 – 2030 (USD Million, AGR %): U Shaped Recovery
FIG.281 GCC Airport Security Market Value Forecast, 2020 – 2030 (USD Million, AGR %): L Shaped Recovery
FIG.282 GCC Airport Security Market Value Forecast, 2020 – 2030 (USD Million, AGR %): W Shaped Recovery
FIG.283 Air Transport Freight in South Africa, 2010 – 2018 (Million Ton-KM)
FIG.284 Passengers Carried by Air Transport in South Africa, 2010 – 2018 (Millions)
FIG.285 Air Transport Registered Carrier Departures in South Africa, 2010 – 2018 (Millions)
FIG.286 South Africa Airport Security Market Value Forecast, 2020 – 2030 (USD Million, AGR %)
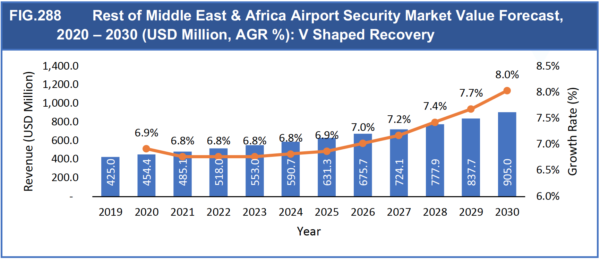
FIG.287 South Africa Airport Security Market Value Forecast, 2020 – 2030 (USD Million, AGR %): V Shaped Recovery
FIG.288 South Africa Airport Security Market Value Forecast, 2020 – 2030 (USD Million, AGR %): U Shaped Recovery
FIG.289 South Africa Airport Security Market Value Forecast, 2020 – 2030 (USD Million, AGR %): L Shaped Recovery
FIG.290 South Africa Airport Security Market Value Forecast, 2020 – 2030 (USD Million, AGR %): W Shaped Recovery
FIG.291 Rest of Middle East & Africa Airport Security Market Value Forecast, 2020 – 2030 (USD Million, AGR %)
FIG.292 Rest of Middle East & Africa Airport Security Market Value Forecast, 2020 – 2030 (USD Million, AGR %): V Shaped Recovery
FIG.293 Rest of Middle East & Africa Airport Security Market Value Forecast, 2020 – 2030 (USD Million, AGR %): U Shaped Recovery
FIG.294 Rest of Middle East & Africa Airport Security Market Value Forecast, 2020 – 2030 (USD Million, AGR %): L Shaped Recovery
FIG.295 Rest of Middle East & Africa Airport Security Market Value Forecast, 2020 – 2030 (USD Million, AGR %): W Shaped Recovery
FIG.296 Bruker Corporation.: Organizational Structure
FIG.297 Bruker Corporation.: Financials 2017 – 2019, (USD Million)
FIG.298 Bruker Corporation: Business Segment, 2019 (%)
FIG.299 Bruker Corporation: Regional Revenue Share, 2019 (%)
FIG.300 CEIA SpA Organisational Structure 2019
FIG.301 G4S Plc Organisational Structure 2019
FIG.302 G4S PLC: Financials 2017 – 2019, (USD Million)
FIG.303 G4S PLC: Consumer Sales, 2019 (%)
FIG.304 G4S PLC: Regional Share, 2019 (%)
FIG.305 L3Harris Technologies Inc: Financials 2016 – 2019, (USD Million)
FIG.306 L3Harris Technologies Inc: Business Segment, 2019 (%)
FIG.307 L3Harris Technologies Inc: Type of Sales, 2019 (%)
FIG.308 Morpho Organisational Structure 2019
FIG.309 Nuctech Company Ltd Organisational Structure 2019
FIG.310 OSI Systems: Financials 2016 – 2019, (USD Million)
FIG.311 OSI Systems: Business Segment, 2019 (%)
FIG.312 Securitas AB: Financials 2017 – 2019, (USD Million)
FIG.313 Securitas AB: Regional Sales, 2019 (%)
FIG.314 Smiths Detection Organisational Structure 2019
FIG.315 Smiths Group Plc: Financials 2017 – 2019, (USD Million)
FIG.316 Hitachi: Financials 2016 – 2019, (USD Million)
FIG.317 Hitachi: Business Segment, 2019 (%)
FIG.318 Hitachi: Regional Sales, 2019 (%)
FIG.319 Thales SA: Financials 2016 – 2019, (USD Million)
FIG.320 The Brinks Co. Organisational Structure
FIG.321 The Brinks Co.: Financials 2017 – 2019, (USD Million)
FIG.322 Siemens AG: Financials 2016 – 2019, (USD Million)
FIG.323 Siemens AG: Business Segment, 2019 (%)
FIG.324 Magal Security Systems: Financials 2017 – 2019, (USD Million)
FIG.325 Honeywell International.: Financials 2016 – 2019, (USD Million)
FIG.326 Honeywell International Inc: Business Segment (2019)
List of Tables
Table 1 Airport Security Market, 2020 – 2030 (USD Million)
Table 2 Global Airport Construction
Table 3 Current And Predicted Global Airport Improvement Investments (USD Million)
Table 4 Global Airport Security Market Size by System, 2020 – 2030 (USD Million, AGR %, CAGR %)
Table 5 Global Airport Security Market Size by System, 2020 – 2030 (USD Million, AGR %, CAGR %): V Shaped Recovery
Table 6 Global Airport Security Market Size by System, 2020 – 2030 (USD Million, AGR %, CAGR %): U Shaped Recovery
Table 7 Global Airport Security Market Size by System, 2020 – 2030 (USD Million, AGR %, CAGR %): L Shaped Recovery
Table 8 Global Airport Security Market Size by System, 2020 – 2030 (USD Million, AGR %, CAGR %): W Shaped Recovery
Table 9 Airport Security Market for Biometric System, 2020-2030 (USD Million, AGR %, CAGR %)
Table 10 Airport Security Market for Biometric System, 2020-2030 (USD Million, AGR %, CAGR %): V Shaped Recovery
Table 11 Airport Security Market for Biometric System, 2020-2030 (USD Million, AGR %, CAGR %): U Shaped Recovery
Table 12 Airport Security Market for Biometric System, 2020-2030 (USD Million, AGR %, CAGR %): L Shaped Recovery
Table 13 Airport Security Market for Biometric System, 2020-2030 (USD Million, AGR %, CAGR %): W Shaped Recovery
Table 14 Airport Security Market for Alert and Cyber Security System, 2020-2030 (USD Million, AGR %, CAGR %)
Table 15 Airport Security Market for Alert and Cyber Security System, 2020-2030 (USD Million, AGR %, CAGR %): V Shaped Recovery
Table 16 Airport Security Market for Alert and Cyber Security System, 2020-2030 (USD Million, AGR %, CAGR %): U Shaped Recovery
Table 17 Airport Security Market for Alert and Cyber Security System, 2020-2030 (USD Million, AGR %, CAGR %): L Shaped Recovery
Table 18 Airport Security Market for Alert and Cyber Security System, 2020-2030 (USD Million, AGR %, CAGR %): W Shaped Recovery
Table 19 Airport Security Market for E-fence and Ground Surveillance Radar System, 2020-2030 (USD Million, AGR %, CAGR %)
Table 20 Airport Security Market for E-fence and Ground Surveillance Radar System, 2020-2030 (USD Million, AGR %, CAGR %): V Shaped Recovery
Table 21 Airport Security Market for E-fence and Ground Surveillance Radar System, 2020-2030 (USD Million, AGR %, CAGR %): U Shaped Recovery
Table 22 Airport Security Market for E-fence and Ground Surveillance Radar System, 2020-2030 (USD Million, AGR %, CAGR %): L Shaped Recovery
Table 23 Airport Security Market for E-fence and Ground Surveillance Radar System, 2020-2030 (USD Million, AGR %, CAGR %): W Shaped Recovery
Table 24 Airport Security Market for E-tag System, 2020-2030 (USD Million, AGR %, CAGR %)
Table 25 Airport Security Market for E-tag System, 2020-2030 (USD Million, AGR %, CAGR %): V Shaped Recovery
Table 26 Airport Security Market for E-tag System, 2020-2030 (USD Million, AGR %, CAGR %): U Shaped Recovery
Table 27 Airport Security Market for E-tag System, 2020-2030 (USD Million, AGR %, CAGR %): L Shaped Recovery
Table 28 Airport Security Market for E-tag System, 2020-2030 (USD Million, AGR %, CAGR %): W Shaped Recovery
Table 29 Airport Security Market for Other Systems, 2020-2030 (USD Million, AGR %, CAGR %)
Table 30 Airport Security Market for Other Systems, 2020-2030 (USD Million, AGR %, CAGR %): V Shaped Recovery
Table 31 Airport Security Market for Other Systems, 2020-2030 (USD Million, AGR %, CAGR %): U Shaped Recovery
Table 32 Airport Security Market for Other Systems, 2020-2030 (USD Million, AGR %, CAGR %): L Shaped Recovery
Table 33 Airport Security Market for Other Systems, 2020-2030 (USD Million, AGR %, CAGR %): W Shaped Recovery
Table 34 Global Airport Security Market Size by Application, 2020 – 2030 (USD Million, AGR %, CAGR %)
Table 35 Global Airport Security Market Size by Application, 2020 – 2030 (USD Million, AGR %, CAGR %): V Shaped Recovery
Table 36 Global Airport Security Market Size by Application, 2020 – 2030 (USD Million, AGR %, CAGR %): U Shaped Recovery
Table 37 Global Airport Security Market Size by Application, 2020 – 2030 (USD Million, AGR %, CAGR %): L Shaped Recovery
Table 38 Global Airport Security Market Size by Application, 2020 – 2030 (USD Million, AGR %, CAGR %): W Shaped Recovery
Table 39 Airport Security Market for Surveillance, 2020-2030 (USD Million, AGR %, CAGR %)
Table 40 Airport Security Market for Surveillance, 2020-2030 (USD Million, AGR %, CAGR %): V Shaped Recovery
Table 41 Airport Security Market for Surveillance, 2020-2030 (USD Million, AGR %, CAGR %): U Shaped Recovery
Table 42 Airport Security Market for Surveillance, 2020-2030 (USD Million, AGR %, CAGR %): L Shaped Recovery
Table 43 Airport Security Market for Surveillance, 2020-2030 (USD Million, AGR %, CAGR %): W Shaped Recovery
Table 44 Airport Security Market for Access Control, 2020-2030 (USD Million, AGR %, CAGR %)
Table 45 Airport Security Market for Access Control, 2020-2030 (USD Million, AGR %, CAGR %): V Shaped Recovery
Table 46 Airport Security Market for Access Control, 2020-2030 (USD Million, AGR %, CAGR %): U Shaped Recovery
Table 47 Airport Security Market for Access Control, 2020-2030 (USD Million, AGR %, CAGR %): L Shaped Recovery
Table 48 Airport Security Market for Access Control, 2020-2030 (USD Million, AGR %, CAGR %): W Shaped Recovery
Table 49 Airport Security Market for Perimeter Security, 2020-2030 (USD Million, AGR %, CAGR %)
Table 50 Airport Security Market for Perimeter Security, 2020-2030 (USD Million, AGR %, CAGR %): V Shaped Recovery
Table 51 Airport Security Market for Perimeter Security, 2020-2030 (USD Million, AGR %, CAGR %): U Shaped Recovery
Table 52 Airport Security Market for Perimeter Security, 2020-2030 (USD Million, AGR %, CAGR %): L Shaped Recovery
Table 53 Airport Security Market for Perimeter Security, 2020-2030 (USD Million, AGR %, CAGR %): W Shaped Recovery
Table 54 Airport Security Market for Screening, 2020-2030 (USD Million, AGR %, CAGR %)
Table 55 Airport Security Market for Screening, 2020-2030 (USD Million, AGR %, CAGR %): V Shaped Recovery
Table 56 Airport Security Market for Screening, 2020-2030 (USD Million, AGR %, CAGR %): U Shaped Recovery
Table 57 Airport Security Market for Screening, 2020-2030 (USD Million, AGR %, CAGR %): L Shaped Recovery
Table 58 Airport Security Market for Screening, 2020-2030 (USD Million, AGR %, CAGR %): W Shaped Recovery
Table 59 Airport Security Market for Cyber Security, 2020-2030 (USD Million, AGR %, CAGR %)
Table 60 Airport Security Market for Cyber Security, 2020-2030 (USD Million, AGR %, CAGR %): V Shaped Recovery
Table 61 Airport Security Market for Cyber Security, 2020-2030 (USD Million, AGR %, CAGR %): U Shaped Recovery
Table 62 Airport Security Market for Cyber Security, 2020-2030 (USD Million, AGR %, CAGR %): L Shaped Recovery
Table 63 Airport Security Market for Cyber Security, 2020-2030 (USD Million, AGR %, CAGR %): W Shaped Recovery
Table 64 Airport Security Market for Other Applications, 2020-2030 (USD Million, AGR %, CAGR %)
Table 65 Airport Security Market for Other Applications, 2020-2030 (USD Million, AGR %, CAGR %): V Shaped Recovery
Table 66 Airport Security Market for Other Applications, 2020-2030 (USD Million, AGR %, CAGR %): U Shaped Recovery
Table 67 Airport Security Market for Other Applications, 2020-2030 (USD Million, AGR %, CAGR %): L Shaped Recovery
Table 68 Airport Security Market for Other Applications, 2020-2030 (USD Million, AGR %, CAGR %): W Shaped Recovery
Table 69 Global Airport Security Market Size by End-Use, 2020 – 2030 (USD Million, AGR %, CAGR %)
Table 70 Global Airport Security Market Size by End-Use, 2020 – 2030 (USD Million, AGR %, CAGR %): V Shaped Recovery
Table 71 Global Airport Security Market Size by End-Use, 2020 – 2030 (USD Million, AGR %, CAGR %): U Shaped Recovery
Table 72 Global Airport Security Market Size by End-Use, 2020 – 2030 (USD Million, AGR %, CAGR %): L Shaped Recovery
Table 73 Global Airport Security Market Size by End-Use, 2020 – 2030 (USD Million, AGR %, CAGR %): W Shaped Recovery
Table 74 Airport Security Market for Terminal Side, 2020-2030 (USD Million, AGR %, CAGR %)
Table 75 Airport Security Market for Terminal Side, 2020-2030 (USD Million, AGR %, CAGR %): V Shaped Recovery
Table 76 Airport Security Market for Terminal Side, 2020-2030 (USD Million, AGR %, CAGR %): U Shaped Recovery
Table 77 Airport Security Market for Terminal Side, 2020-2030 (USD Million, AGR %, CAGR %): L Shaped Recovery
Table 78 Airport Security Market for Terminal Side, 2020-2030 (USD Million, AGR %, CAGR %): W Shaped Recovery
Table 79 Airport Security Market for Air Side, 2020-2030 (USD Million, AGR %, CAGR %)
Table 80 Airport Security Market for Air Side, 2020-2030 (USD Million, AGR %, CAGR %): V Shaped Recovery
Table 81 Airport Security Market for Air Side, 2020-2030 (USD Million, AGR %, CAGR %): U Shaped Recovery
Table 82 Airport Security Market for Air Side, 2020-2030 (USD Million, AGR %, CAGR %): L Shaped Recovery
Table 83 Airport Security Market for Air Side, 2020-2030 (USD Million, AGR %, CAGR %): W Shaped Recovery
Table 84 Airport Security Market for Land Side, 2020-2030 (USD Million, AGR %, CAGR %)
Table 85 Airport Security Market for Land Side, 2020-2030 (USD Million, AGR %, CAGR %): V Shaped Recovery
Table 86 Airport Security Market for Land Side, 2020-2030 (USD Million, AGR %, CAGR %): U Shaped Recovery
Table 87 Airport Security Market for Land Side, 2020-2030 (USD Million, AGR %, CAGR %): L Shaped Recovery
Table 88 Airport Security Market for Land Side, 2020-2030 (USD Million, AGR %, CAGR %): W Shaped Recovery
Table 89 Global Airport Security Market Size by Region, 2020 – 2030 (USD Million, AGR %, CAGR %)
Table 90 Global Airport Security Market Size by Region, 2020 – 2030 (USD Million, AGR %, CAGR %): V Shaped Recovery
Table 91 Global Airport Security Market Size by Region, 2020 – 2030 (USD Million, AGR %, CAGR %): U Shaped Recovery
Table 92 Global Airport Security Market Size by Region, 2020 – 2030 (USD Million, AGR %, CAGR %): L Shaped Recovery
Table 93 Global Airport Security Market Size by Region, 2020 – 2030 (USD Million, AGR %, CAGR %): W Shaped Recovery
Table 94 North America Airport Security Market, 2020-2030 (USD Million, AGR %, CAGR %)
Table 95 North America Airport Security Market, 2020-2030 (USD Million, AGR %, CAGR %): V Shaped Recovery
Table 96 North America Airport Security Market, 2020-2030 (USD Million, AGR %, CAGR %): U Shaped Recovery
Table 97 North America Airport Security Market, 2020-2030 (USD Million, AGR %, CAGR %): L Shaped Recovery
Table 98 North America Airport Security Market, 2020-2030 (USD Million, AGR %, CAGR %): W Shaped Recovery
Table 99 North America Airport Security Market Size by System, 2020 – 2030 (USD Million, AGR %, CAGR %)
Table 100 North America Airport Security Market Size by Application, 2020 – 2030 (USD Million, AGR %, CAGR %)
Table 101 North America Airport Security Market Size by End-User, 2020 – 2030 (USD Million, AGR %, CAGR %)
Table 102 U.S. Airport Security Market, 2020-2030 (USD Million, AGR %, CAGR %)
Table 103 U.S. Airport Security Market, 2020-2030 (USD Million, AGR %, CAGR %): V Shaped Recovery
Table 104 U.S. Airport Security Market, 2020-2030 (USD Million, AGR %, CAGR %): U Shaped Recovery
Table 105 U.S. Airport Security Market, 2020-2030 (USD Million, AGR %, CAGR %): L Shaped Recovery
Table 106 U.S. Airport Security Market, 2020-2030 (USD Million, AGR %, CAGR %): W Shaped Recovery
Table 107 Canada Airport Security Market, 2020-2030 (USD Million, AGR %, CAGR %)
Table 108 Canada Airport Security Market, 2020-2030 (USD Million, AGR %, CAGR %): V Shaped Recovery
Table 109 Canada Airport Security Market, 2020-2030 (USD Million, AGR %, CAGR %): U Shaped Recovery
Table 110 Canada Airport Security Market, 2020-2030 (USD Million, AGR %, CAGR %): L Shaped Recovery
Table 111 Canada Airport Security Market, 2020-2030 (USD Million, AGR %, CAGR %): W Shaped Recovery
Table 112 Europe Airport Security Market, 2020-2030 (USD Million, AGR %, CAGR %)
Table 113 Europe Airport Security Market, 2020-2030 (USD Million, AGR %, CAGR %): V Shaped Recovery
Table 114 Europe Airport Security Market, 2020-2030 (USD Million, AGR %, CAGR %): U Shaped Recovery
Table 115 Europe Airport Security Market, 2020-2030 (USD Million, AGR %, CAGR %): L Shaped Recovery
Table 116 Europe Airport Security Market, 2020-2030 (USD Million, AGR %, CAGR %): W Shaped Recovery
Table 117 Europe Airport Security Market Size by System, 2020 – 2030 (USD Million, AGR %, CAGR %)
Table 118 Europe Airport Security Market Size by Application, 2020 – 2030 (USD Million, AGR %, CAGR %)
Table 119 Europe Airport Security Market Size by End-User, 2020 – 2030 (USD Million, AGR %, CAGR %)
Table 120 UK Airport Security Market, 2020-2030 (USD Million, AGR %, CAGR %)
Table 121 UK Airport Security Market, 2020-2030 (USD Million, AGR %, CAGR %): V Shaped Recovery
Table 122 UK Airport Security Market, 2020-2030 (USD Million, AGR %, CAGR %): U Shaped Recovery
Table 123 UK Airport Security Market, 2020-2030 (USD Million, AGR %, CAGR %): L Shaped Recovery
Table 124 UK Airport Security Market, 2020-2030 (USD Million, AGR %, CAGR %): W Shaped Recovery
Table 125 Spain Airport Security Market, 2020-2030 (USD Million, AGR %, CAGR %)
Table 126 Spain Airport Security Market, 2020-2030 (USD Million, AGR %, CAGR %): V Shaped Recovery
Table 127 Spain Airport Security Market, 2020-2030 (USD Million, AGR %, CAGR %): U Shaped Recovery
Table 128 Spain Airport Security Market, 2020-2030 (USD Million, AGR %, CAGR %): L Shaped Recovery
Table 129 Spain Airport Security Market, 2020-2030 (USD Million, AGR %, CAGR %): W Shaped Recovery
Table 130 Italy Airport Security Market, 2020-2030 (USD Million, AGR %, CAGR %)
Table 131 Italy Airport Security Market, 2020-2030 (USD Million, AGR %, CAGR %): V Shaped Recovery
Table 132 Italy Airport Security Market, 2020-2030 (USD Million, AGR %, CAGR %): U Shaped Recovery
Table 133 Italy Airport Security Market, 2020-2030 (USD Million, AGR %, CAGR %): L Shaped Recovery
Table 134 Italy Airport Security Market, 2020-2030 (USD Million, AGR %, CAGR %): W Shaped Recovery
Table 135 Germany Airport Security Market, 2020-2030 (USD Million, AGR %, CAGR %)
Table 136 Germany Airport Security Market, 2020-2030 (USD Million, AGR %, CAGR %): V Shaped Recovery
Table 137 Germany Airport Security Market, 2020-2030 (USD Million, AGR %, CAGR %): U Shaped Recovery
Table 138 Germany Airport Security Market, 2020-2030 (USD Million, AGR %, CAGR %): L Shaped Recovery
Table 139 Germany Airport Security Market, 2020-2030 (USD Million, AGR %, CAGR %): W Shaped Recovery
Table 140 France Airport Security Market, 2020-2030 (USD Million, AGR %, CAGR %)
Table 141 France Airport Security Market, 2020-2030 (USD Million, AGR %, CAGR %): V Shaped Recovery
Table 142 France Airport Security Market, 2020-2030 (USD Million, AGR %, CAGR %): U Shaped Recovery
Table 143 France Airport Security Market, 2020-2030 (USD Million, AGR %, CAGR %): L Shaped Recovery
Table 144 France Airport Security Market, 2020-2030 (USD Million, AGR %, CAGR %): W Shaped Recovery
Table 145 Russia Airport Security Market, 2020-2030 (USD Million, AGR %, CAGR %)
Table 146 Russia Airport Security Market, 2020-2030 (USD Million, AGR %, CAGR %): V Shaped Recovery
Table 147 Russia Airport Security Market, 2020-2030 (USD Million, AGR %, CAGR %): U Shaped Recovery
Table 148 Russia Airport Security Market, 2020-2030 (USD Million, AGR %, CAGR %): L Shaped Recovery
Table 149 Russia Airport Security Market, 2020-2030 (USD Million, AGR %, CAGR %): W Shaped Recovery
Table 150 Rest of Europe Airport Security Market, 2020-2030 (USD Million, AGR %, CAGR %)
Table 151 Rest of Europe Airport Security Market, 2020-2030 (USD Million, AGR %, CAGR %): V Shaped Recovery
Table 152 Rest of Europe Airport Security Market, 2020-2030 (USD Million, AGR %, CAGR %): U Shaped Recovery
Table 153 Rest of Europe Airport Security Market, 2020-2030 (USD Million, AGR %, CAGR %): L Shaped Recovery
Table 154 Rest of Europe Airport Security Market, 2020-2030 (USD Million, AGR %, CAGR %): W Shaped Recovery
Table 155 Asia Pacific Airport Security Market, 2020-2030 (USD Million, AGR %, CAGR %)
Table 156 Asia Pacific Airport Security Market, 2020-2030 (USD Million, AGR %, CAGR %): V Shaped Recovery
Table 157 Asia Pacific Airport Security Market, 2020-2030 (USD Million, AGR %, CAGR %): U Shaped Recovery
Table 158 Asia Pacific Airport Security Market, 2020-2030 (USD Million, AGR %, CAGR %): L Shaped Recovery
Table 159 Asia Pacific Airport Security Market, 2020-2030 (USD Million, AGR %, CAGR %): W Shaped Recovery
Table 160 Asia Pacific Airport Security Market Size by System, 2020 – 2030 (USD Million, AGR %, CAGR %)
Table 161 Asia Pacific Airport Security Market Size by Application, 2020 – 2030 (USD Million, AGR %, CAGR %)
Table 162 Asia Pacific Airport Security Market Size by End-User, 2020 – 2030 (USD Million, AGR %, CAGR %)
Table 163 China Airport Security Market, 2020-2030 (USD Million, AGR %, CAGR %)
Table 164 China Airport Security Market, 2020-2030 (USD Million, AGR %, CAGR %): V Shaped Recovery
Table 165 China Airport Security Market, 2020-2030 (USD Million, AGR %, CAGR %): U Shaped Recovery
Table 166 China Airport Security Market, 2020-2030 (USD Million, AGR %, CAGR %): L Shaped Recovery
Table 167 China Airport Security Market, 2020-2030 (USD Million, AGR %, CAGR %): W Shaped Recovery
Table 168 Japan Airport Security Market, 2020-2030 (USD Million, AGR %, CAGR %)
Table 169 Japan Airport Security Market, 2020-2030 (USD Million, AGR %, CAGR %): V Shaped Recovery
Table 170 Japan Airport Security Market, 2020-2030 (USD Million, AGR %, CAGR %): U Shaped Recovery
Table 171 Japan Airport Security Market, 2020-2030 (USD Million, AGR %, CAGR %): L Shaped Recovery
Table 172 Japan Airport Security Market, 2020-2030 (USD Million, AGR %, CAGR %): W Shaped Recovery
Table 173 India Airport Security Market, 2020-2030 (USD Million, AGR %, CAGR %)
Table 174 India Airport Security Market, 2020-2030 (USD Million, AGR %, CAGR %): V Shaped Recovery
Table 175 India Airport Security Market, 2020-2030 (USD Million, AGR %, CAGR %): U Shaped Recovery
Table 176 India Airport Security Market, 2020-2030 (USD Million, AGR %, CAGR %): L Shaped Recovery
Table 177 India Airport Security Market, 2020-2030 (USD Million, AGR %, CAGR %): W Shaped Recovery
Table 178 Australia Airport Security Market, 2020-2030 (USD Million, AGR %, CAGR %)
Table 179 Australia Airport Security Market, 2020-2030 (USD Million, AGR %, CAGR %): V Shaped Recovery
Table 180 Australia Airport Security Market, 2020-2030 (USD Million, AGR %, CAGR %): U Shaped Recovery
Table 181 Australia Airport Security Market, 2020-2030 (USD Million, AGR %, CAGR %): L Shaped Recovery
Table 182 Australia Airport Security Market, 2020-2030 (USD Million, AGR %, CAGR %): W Shaped Recovery
Table 183 South Korea Airport Security Market, 2020-2030 (USD Million, AGR %, CAGR %)
Table 184 South Korea Airport Security Market, 2020-2030 (USD Million, AGR %, CAGR %): V Shaped Recovery
Table 185 South Korea Airport Security Market, 2020-2030 (USD Million, AGR %, CAGR %): U Shaped Recovery
Table 186 South Korea Airport Security Market, 2020-2030 (USD Million, AGR %, CAGR %): L Shaped Recovery
Table 187 South Korea Airport Security Market, 2020-2030 (USD Million, AGR %, CAGR %): W Shaped Recovery
Table 188 Southeast Asia Airport Security Market, 2020-2030 (USD Million, AGR %, CAGR %)
Table 189 Southeast Asia Airport Security Market, 2020-2030 (USD Million, AGR %, CAGR %): V Shaped Recovery
Table 190 Southeast Asia Airport Security Market, 2020-2030 (USD Million, AGR %, CAGR %): U Shaped Recovery
Table 191 Southeast Asia Airport Security Market, 2020-2030 (USD Million, AGR %, CAGR %): L Shaped Recovery
Table 192 Southeast Asia Airport Security Market, 2020-2030 (USD Million, AGR %, CAGR %): W Shaped Recovery
Table 193 Rest of Asia Pacific Airport Security Market, 2020-2030 (USD Million, AGR %, CAGR %)
Table 194 Rest of Asia Pacific Airport Security Market, 2020-2030 (USD Million, AGR %, CAGR %): V Shaped Recovery
Table 195 Rest of Asia Pacific Airport Security Market, 2020-2030 (USD Million, AGR %, CAGR %): U Shaped Recovery
Table 196 Rest of Asia Pacific Airport Security Market, 2020-2030 (USD Million, AGR %, CAGR %): L Shaped Recovery
Table 197 Rest of Asia Pacific Airport Security Market, 2020-2030 (USD Million, AGR %, CAGR %): W Shaped Recovery
Table 198 Latin America Airport Security Market, 2020-2030 (USD Million, AGR %, CAGR %)
Table 199 Latin America Airport Security Market, 2020-2030 (USD Million, AGR %, CAGR %): V Shaped Recovery
Table 200 Latin America Airport Security Market, 2020-2030 (USD Million, AGR %, CAGR %): U Shaped Recovery
Table 201 Latin America Airport Security Market, 2020-2030 (USD Million, AGR %, CAGR %): L Shaped Recovery
Table 202 Latin America Airport Security Market, 2020-2030 (USD Million, AGR %, CAGR %): W Shaped Recovery
Table 203 Latin America Airport Security Market Size by System, 2020 – 2030 (USD Million, AGR %, CAGR %)
Table 204 Latin America Airport Security Market Size by Application, 2020 – 2030 (USD Million, AGR %, CAGR %)
Table 205 Latin America Airport Security Market Size by End-User, 2020 – 2030 (USD Million, AGR %, CAGR %)
Table 206 Brazil Airport Security Market, 2020-2030 (USD Million, AGR %, CAGR %)
Table 207 Brazil Airport Security Market, 2020-2030 (USD Million, AGR %, CAGR %): V Shaped Recovery
Table 208 Brazil Airport Security Market, 2020-2030 (USD Million, AGR %, CAGR %): U Shaped Recovery
Table 209 Brazil Airport Security Market, 2020-2030 (USD Million, AGR %, CAGR %): L Shaped Recovery
Table 210 Brazil Airport Security Market, 2020-2030 (USD Million, AGR %, CAGR %): W Shaped Recovery
Table 211 Argentina Airport Security Market, 2020-2030 (USD Million, AGR %, CAGR %)
Table 212 Argentina Airport Security Market, 2020-2030 (USD Million, AGR %, CAGR %): V Shaped Recovery
Table 213 Argentina Airport Security Market, 2020-2030 (USD Million, AGR %, CAGR %): U Shaped Recovery
Table 214 Argentina Airport Security Market, 2020-2030 (USD Million, AGR %, CAGR %): L Shaped Recovery
Table 215 Argentina Airport Security Market, 2020-2030 (USD Million, AGR %, CAGR %): W Shaped Recovery
Table 216 Mexico Airport Security Market, 2020-2030 (USD Million, AGR %, CAGR %)
Table 217 Mexico Airport Security Market, 2020-2030 (USD Million, AGR %, CAGR %): V Shaped Recovery
Table 218 Mexico Airport Security Market, 2020-2030 (USD Million, AGR %, CAGR %): U Shaped Recovery
Table 219 Mexico Airport Security Market, 2020-2030 (USD Million, AGR %, CAGR %): L Shaped Recovery
Table 220 Mexico Airport Security Market, 2020-2030 (USD Million, AGR %, CAGR %): W Shaped Recovery
Table 221 Rest of Latin America Airport Security Market, 2020-2030 (USD Million, AGR %, CAGR %)
Table 222 Rest of Latin America Airport Security Market, 2020-2030 (USD Million, AGR %, CAGR %): V Shaped Recovery
Table 223 Rest of Latin America Airport Security Market, 2020-2030 (USD Million, AGR %, CAGR %): U Shaped Recovery
Table 224 Rest of Latin America Airport Security Market, 2020-2030 (USD Million, AGR %, CAGR %): L Shaped Recovery
Table 225 Rest of Latin America Airport Security Market, 2020-2030 (USD Million, AGR %, CAGR %): W Shaped Recovery
Table 226 Middle East & Africa Airport Security Market, 2020-2030 (USD Million, AGR %, CAGR %)
Table 227 Middle East & Africa Airport Security Market, 2020-2030 (USD Million, AGR %, CAGR %): V Shaped Recovery
Table 228 Middle East & Africa Airport Security Market, 2020-2030 (USD Million, AGR %, CAGR %): U Shaped Recovery
Table 229 Middle East & Africa Airport Security Market, 2020-2030 (USD Million, AGR %, CAGR %): L Shaped Recovery
Table 230 Middle East & Africa Airport Security Market, 2020-2030 (USD Million, AGR %, CAGR %): W Shaped Recovery
Table 231 Middle East & Africa Airport Security Market Size by System, 2020 – 2030 (USD Million, AGR %, CAGR %)
Table 232 Middle East & Africa Airport Security Market Size by Application, 2020 – 2030 (USD Million, AGR %, CAGR %)
Table 233 Middle East & Africa Airport Security Market Size by End-User, 2020 – 2030 (USD Million, AGR %, CAGR %)
Table 234 GCC Airport Security Market, 2020-2030 (USD Million, AGR %, CAGR %)
Table 235 GCC Airport Security Market, 2020-2030 (USD Million, AGR %, CAGR %): V Shaped Recovery
Table 236 GCC Airport Security Market, 2020-2030 (USD Million, AGR %, CAGR %): U Shaped Recovery
Table 237 GCC Airport Security Market, 2020-2030 (USD Million, AGR %, CAGR %): L Shaped Recovery
Table 238 GCC Airport Security Market, 2020-2030 (USD Million, AGR %, CAGR %): W Shaped Recovery
Table 239 South Africa Airport Security Market, 2020-2030 (USD Million, AGR %, CAGR %)
Table 240 South Africa Airport Security Market, 2020-2030 (USD Million, AGR %, CAGR %): V Shaped Recovery
Table 241 South Africa Airport Security Market, 2020-2030 (USD Million, AGR %, CAGR %): U Shaped Recovery
Table 242 South Africa Airport Security Market, 2020-2030 (USD Million, AGR %, CAGR %): L Shaped Recovery
Table 243 South Africa Airport Security Market, 2020-2030 (USD Million, AGR %, CAGR %): W Shaped Recovery
Table 244 Rest of Middle East & Africa Airport Security Market, 2020-2030 (USD Million, AGR %, CAGR %)
Table 245 Rest of Middle East & Africa Airport Security Market, 2020-2030 (USD Million, AGR %, CAGR %): V Shaped Recovery
Table 246 Rest of Middle East & Africa Airport Security Market, 2020-2030 (USD Million, AGR %, CAGR %): U Shaped Recovery
Table 247 Rest of Middle East & Africa Airport Security Market, 2020-2030 (USD Million, AGR %, CAGR %): L Shaped Recovery
Table 248 Rest of Middle East & Africa Airport Security Market, 2020-2030 (USD Million, AGR %, CAGR %): W Shaped Recovery
Table 249 Bruker Corporation: Headquarter, Founded, Employees, Company Type, Website, Business Segment
Table 250 Bruker Corporation: Product Portfolio
Table 251 Bruker Corporation: Airport Security Selected Recent Contracts / Projects / Programmes
Table 252 Bruker Corporation: Financial Analysis
Table 253 CEIA SpA: Headquarter, Founded, Employees, Company Type, Website, Business Segment
Table 254 CEIA SpA: Product Portfolio
Table 255 Selected Recent CEIA SpA Airport Security Contracts / Projects / Programmes (Date, Country / Region, Product, Details)
Table 256 G4S plc: Headquarter, Founded, Employees, Company Type, Website, Business Segment
Table 257 G4S PLC: Product Portfolio
Table 258 G4S PLC: Airport Security Selected Recent Contracts / Projects / Programmes
Table 259 G4S PLC: Financial Analysis
Table 260 L3Harris Technologies Inc: Headquarter, Founded, Employees, Company Type, Website, Business Segment
Table 261 L3Harris Technologies Inc: Product Portfolio
Table 262 L3Harris Technologies Inc: Airport Security Selected Recent Contracts / Projects / Programmes
Table 263 L3Harris Technologies Inc: Financial Analysis
Table 264 OT-Morpho (IDEMIA): Headquarter, Founded, Employees, Company Type, Website, Business Segment
Table 265 OT-Morpho (IDEMIA): Product Portfolio
Table 266 OT-Morpho (IDEMIA): Airport Security Selected Recent Contracts / Projects / Programmes
Table 267 Nuctech Company Ltd: Headquarter, Founded, Employees, Company Type, Website, Business Segment
Table 268 Nuctech Company Ltd: Product Portfolio
Table 269 Nuctech Company Ltd: Airport Security Selected Recent Contracts / Projects / Programmes
Table 270 OSI Systems: Headquarter, Founded, Employees, Company Type, Website, Business Segment
Table 271 OSI Systems: Product Portfolio
Table 272 OSI Systems: Airport Security Selected Recent Contracts / Projects / Programmes
Table 273 OSI Systems: Financial Analysis
Table 274 Securitas AB: Headquarter, Founded, Employees, Company Type, Website, Business Segment
Table 275 Securitas AB: Product Portfolio
Table 276 Securitas AB: Financial Analysis
Table 277 Smiths Group Plc: Headquarter, Founded, Employees, Company Type, Website, Business Segment
Table 278 Smiths Detection: Product Portfolio
Table 279 Smiths Group: Financial Analysis
Table 280 SITA: Headquarter, Founded, Employees, Company Type, Website, Business Segment
Table 281 SITA: Product Portfolio
Table 282 SITA: Airport Security Selected Recent Contracts / Projects / Programmes
Table 283 Hitachi: Headquarter, Founded, Employees, Company Type, Website, Business Segment
Table 284 Hitachi: Product Portfolio
Table 285 Hitachi: Airport Security Selected Recent Contracts / Projects / Programmes
Table 286 Hitachi: Financial Analysis
Table 287 Thales SA: Headquarter, Founded, Employees, Company Type, Website, Business Segment
Table 288 Thales SA: Product Portfolio
Table 289 Thales SA: Airport Security Selected Recent Contracts / Projects / Programmes
Table 290 Thales: Financial Analysis
Table 291 The Brinks Co.: Headquarter, Founded, Employees, Company Type, Website, Business Segment
Table 292 The Brinks Co: Product Portfolio
Table 293 The Brinks Co: Financial Analysis
Table 294 Siemens AG: Headquarter, Founded, Employees, Company Type, Website, Business Segment
Table 295 Siemens AG: Product Portfolio
Table 296 Siemens AG: Airport Security Selected Recent Contracts / Projects / Programmes
Table 297 Siemens AG: Financial Analysis
Table 298 Magal Security Systems: Headquarter, Founded, Employees, Company Type, Website, Business Segment
Table 299 Magal Security Systems: Product Portfolio
Table 300 Magal Security Systems: Financial Analysis
Table 301 Honeywell International: Headquarter, Founded, Employees, Company Type, Website, Business Segment
Table 302 Honeywell International: Financial Analysis
Table 303 Analogic Corporation: Headquarter, Founded, Employees, Company Type, Website, Business Segment
Table 304 Analogic Corporation: Product Portfolio
Table 305 Analogic Corporation: Airport Security Selected Recent Contracts / Projects / Programmes
Analogic Corporation
Bruker Corporation
CEIA SpA
G4S Plc
Hitachi, Ltd.
Honeywell International
L3Harris Technologies
Magal Security Systems
Nuctech Company
OSI Systems
OT-Morpho (IDEMIA)
Securitas AB
Siemens AG
SITA
Smiths Group
Thales SA
The Brink's Co.
List of Companies Mentioned in the Report
Airbus
Altaris Capital Partners
Amadeus IT Group
Applied Defense Solutions
ASV Global
Baghdad International Airport (BIAP)
Boeing
Bombardier
Brussels Airport
Capax Global
Cathay Pacific
COMAC
Czech Airlines
Delta Air Lines
EasyJet plc
Embraer
Emirates
ESTEQ
Fokker
GE
Greater Orlando Aviation Authority (GOAA)
Halifax Stanfield International Airport
Implant Sciences Corporation
Implexis GmbH
Istanbul Sabiha Gökçen International Airport
JAL
JR Automation Technologies
Latitude Engineering
Lufthansa
MacDonald Humfrey (Automation) Ltd
MAG (Manchester Airports Group)
Malev
Mendix
Morpho Detection UK Ltd
MultiMechanics
NEC Corporation
Nextnine Ltd
Nieuport Aviation Infrastructure Partners (Nieuport Aviation)
Pratt & Whitney
Process Systems Enterprise (PSE)
Qantas
Rebellion Photonics
Rolls & Royce
Ryanair DAC
Sabre Corporation
Safran Identity & Security
SAS
Singapore Airlines
Staples Inc
Stratovan
The Brink’s Company
TPG Telecom
Transnorm
Travelport
United and Emirates Airlines
List of Organizations Mentioned in the Report
Advanced Cabin Baggage X-ray
Air Administration of the Department of Transport (DOT)
Airport Council International (ACI)
Bureau of Civil Aviation Security (BCAS)
Central Industrial Security Force (CISF)
Civil Aviation Authority (CAA)
Federal Aviation Administration (FAA)
Federal Government of Mexico
German Border Police (BGS)
Greater Orlando Aviation Authority (GOAA)
Guardia Civil
International Air Transport Association (IATA)
International Civil Aviation Organization (ICAO)
International Monetary Fund (IMF)
Ministry of Transport (MOT)
Servicio de Administración Tributaria (SAT)
Spanish police force
The Procurement Agency of the German Ministry of the Interior
The United Nations World Tourism Organisation
The United States National Guard
The World Tourism Organization (UNWTO)
Transportation Security Administration (TSA)
U.S. Air Force’s Ground Based Strategic Deterrent (GBSD) program
U.S. Special Operations Command (USSOCOM)
World Bank
World Trade Organization (WTO)
World Travel & Tourism Council
Download sample pages
Complete the form below to download your free sample pages for Airport Security Market Report 2020-2030Related reports
-
Baggage Handling Systems Market Report 2020-2030
The baggage handling system market is about to enter a period of phenomenal growth and innovation. The next ten years...
Full DetailsPublished: 01 January 1970 -
Aviation Cyber Security Market Report 2020-2030
Aviation Cyber Security market to total USD 5.87 billion in 2030.
...Full DetailsPublished: 24 January 2020 -
Airport Information Systems Market Report 2021-2031
Increasing cyber-attacks in civil aviation industry is expected to increase demand for improved airport information services over the coming years....Full DetailsPublished: 08 October 2021 -
Airport Ground Handling Services Market Report 2018-2028
Developments in the aviation industry have had a significant impact on the airport ground handling services market. Visiongain’s report on...
Full DetailsPublished: 11 June 2018 -
Middle East & Africa (MEA) Airport Construction Market Report 2018-2028
The recent airport construction and expansion in aviation activity in the MEA region have led Visiongain to publish this timely...Full DetailsPublished: 25 July 2018 -
Border Security Market 2020-2030
Visiongain assesses the market to be valued at $22.8bn in 2020 and with continued advancement and sustained market demand, Visiongain...
Full DetailsPublished: 21 April 2020 -

Air Traffic Management Market Report 2021-2031
Despite the difficulties and complexities of air traffic management, major developments in both developed and emerging markets for air travel...Full DetailsPublished: 05 November 2020 -
Airport Information Systems Market Report 2019-2029
The global airport information system market is expected to grow at a steady rate during the forecast period. Some of...
Full DetailsPublished: 01 January 1970 -
Airport Construction Market Report 2018-2028
The latest report from business intelligence provider Visiongain offers comprehensive analysis of the global airport construction market. Visiongain assesses that...
Full DetailsPublished: 03 January 2018 -
Smart Airport Technologies Market Report 2020-2030
The recent contracts in Smart airport technologies market, has led Visiongain to publish this timely report. The $3,569.6 million Smart...
Full DetailsPublished: 14 May 2020
Download sample pages
Complete the form below to download your free sample pages for Airport Security Market Report 2020-2030Do you have any custom requirements we can help you with?
Any specific country, geo region, market segment or specific company information?
Email us today, we can discuss your needs and see how we can help: jamie.roberts@visiongain.com
Visiongain aviation reports are compiled using a broad and rich mixture of both primary and secondary information to produce an overall industry outlook. In order to provide our clients with the best product possible product, we do not rely on any one single source of information. Visiongain analysts reach out to market-leading vendors and automotive industry experts but also review a wealth of financial data and product information from a vast range of sources. To find out more about our reports methodology please email jamie.roberts@visiongain.com
Would you like a free report overview of the report of your choice?
If so, please drop an email to Jamie Roberts stating your chosen report title to jamie.roberts@visiongain.com
Would you like to get the latest Visiongain aviation reports catalogue?
What are the dynamic growth sectors? where are the regional business opportunities?
Which technologies will prevail and who are the leading companies succeeding in these sectors and why?
If you want definitive answers to business critical questions, discover Visiongain’s full range of business intelligence reports.
If so, please email Jamie Roberts on jamie.roberts@visiongain.com or call her today on +44 207 336 6100
Airline Passenger Experience Association (APEX)
Airlines for America
Airport Consultants Council (ACC)
Airports Council International (ACI)
Airports Council International-North America
American Association of Airport Executives
Arab Air Carriers Organization (AACO)
European Aerospace Cluster Partnership
Global Business Travel Association (GBTA)
International Air Transport Association (IATA)
Security Industry Association (SIA)
Security Manufacturers Coalition
Women in Aviation
World Aviation Services
Don’t Miss Out!
Latest Aviation news
Aircraft Computers Market
The global Aircraft Computers market is projected to grow at a CAGR of 5.7% by 2034
24 June 2024
Space Mining Market
The global Space Mining market is projected to grow at a CAGR of 20.7% by 2034
07 June 2024
Connected Aircraft Market
The global Connected Aircraft market is projected to grow at a CAGR of 17.2% by 2034
05 June 2024
Satellite Ground Station Market
The global Satellite Ground Station market was valued at US$65.69 billion in 2023 and is projected to grow at a CAGR of 13.3% during the forecast period 2024-2034.
21 May 2024


