• Do you need definitive Orphan Drugs market data?
• Succinct Orphan Drugs market analysis?
• Technological insight?
• Actionable business recommendations?
Read on to discover how this definitive report can transform your own research and save you time.
The Global Orphan Drugs market shows immense potential to grow in the future, growing in line with some emerging trends. One such trend is the increasing strategic partnerships in a move to introduce or diversify product portfolios pertaining to drugs. Another trend is advances in biomedical sciences and introduction of nanotechnologies in the global pharmaceutical market, which are revolutionising the development of medicines.
Lastly, the study of the pathogenesis of disease at genetic and molecular level studies have led to the discovery of new targets for therapy and producing disease modifying drugs.
Report highlights
• 149 quantitative tables, charts, and graphs across 173 pages
• Global Orphan Drugs market outlook and analysis from 2018-2028
• Global Orphan Drugs submarket forecasts and analysis from 2018-2028
• Oncology
• Alimentary Tract & Metabolism
• Hormonal Disorders & Haematology
• Neuroscience
• Respiratory
• Cardiovascular
• Nephrology

• Key National Orphan Drugs market forecasts 2018-2028
• US forecast 2018-2028
• Germany forecast 2018-2028
• UK forecast 2018-2028
• France forecast 2018-2028
• Italy forecast 2018-2028
• Spain forecast 2018-2028
• Japan forecast 2018-2028
• Singapore forecast 2018-2028
• South Korea forecast 2018-2028
• Brazil forecast 2018-2028
• Russia forecast 2018-2028
• China forecast 2018-2028
• Brazil forecast 2018-2028
Key questions answered
• What does the future hold for the Pharmaceutical industry with regards to Orphan Drugs
• Where should you target your business strategy?
• Which applications should you focus upon?
• Which disruptive technologies should you invest in?
• Which companies should you form strategic alliances with?
• Which company is likely to success and why?
• What business models should you adopt?
• What industry trends should you be aware of?
Target audience
• Leading Pharmaceutical companies
• Suppliers
• Contractors
• Technologists
• R&D staff
• Consultants
• Analysts
• CEO’s
• CIO’s
• COO’s
• Business development managers
• Investors
• Governments
• Agencies
• Banks
Visiongain is a trading partner with the US Federal Government
CCR Ref number: KD4R6
1. Report Overview
1.1 Why You Should Read This Report
1.2 How This Report Delivers
1.3 Key Questions Answered by This Analytical Report Include:
1.4 Who is This Report For?
1.5 Methodology
1.5.1 Primary Research
1.5.2 Secondary Research
1.5.3 Market Evaluation & Forecasting Methodology
1.6 Frequently Asked Questions (FAQ)
1.7 Associated Visiongain Reports
1.8 About Visiongain
2. Introduction to Orphan Drug Designation
2.1 US Orphan Drug Designation
2.2 Europe Orphan Drug Designation
2.3 Japan Orphan Drug Designation
2.4 Key Feature of Orphan Drug Designation
2.5 Orphan Indication and Prevalence
2.6 Orphan Drug Development Procedure versus Standard Drug Development Procedure
2.7 Development Time: Orphan Drug vs Standard Drug
2.8 Difference between Orphan Drug and Standard Drug
3. Overview on Top Selling Orphan Drugs 2016
3.1 Top Selling Orphan Drugs 2016
3.2 Rituxan
3.3 Revlimid
3.4 Opdivo
3.5 Soliris
3.6 Imbruvica
3.7 Keytruda
3.8 Yervoy
3.9 Orkambi
3.10 Darzalex
3.11 List of Orphan Designated Drug from 2014-2016
3.12 List of Orphan Drug Designation Pipeline
4. Global Orphan Drug Designation Market 2018-2028
4.1 Global Orphan Drug Designation Market 2017
4.2 Market Segmentation by Therapeutic Class 2017
4.3 Oncology
4.3.1 Market Size and Forecast
4.4 Alimentary Tract & Metabolism
4.4.1 Market Size and Forecast
4.5 Hormonal Disorders and Haematology
4.5.1 Market Size and Forecast
4.6 Neuroscience
4.6.1 Market Size and Forecast
4.7 Respiratory
4.7.1 Market Size and Forecast
4.8 Cardiovascular
4.8.1 Market Size and Forecast
4.9 Nephrology and Ophthalmology
4.9.1 Market Size and Forecast
5. Orphan Drug Market by Drug Class
5.1 Market Segmentation by Biologic vs Small Molecule 2017
5.2 Biologic Drug
5.2.1 Market Size and Forecast
5.3 Small Molecule Drug
5.3.1 Market Size and Forecast
6. Leading National Markets Forecast 2018-2028
6.1 Geographical Breakdown of Global Orphan Drug Designation Market, 2017
6.1.1 Region-wise Breakdown of Global Orphan Drug Drugs Market, 2017
6.1.2 Country-wise Breakdown of Global Anti-obesity Drugs Market, 2017
6.1.3 Region-wise Forecast of Global Orphan Drugs Designation Market, 2017-2028
6.2 Orphan Drug Designation Market in the US, 2017
6.2.1 Orphan Drug Designation Activity in the US
6.2.2 FDA’s Orphan Drug Modernization Plan
6.2.3 Market Forecast of the US, 2017-2027
6.2.4 List of Drugs Approved in 2016 by FDA
6.3 Orphan Drug Designation Market in the EU5 Region, 2017
6.3.1 Orphan Applications Figures 2000-2016
6.3.2 Orphan Drug Designation Market Forecast of the EU5 Countries, 2018-2028
6.3.3 The UK
6.3.4 Germany
6.3.5 France
6.3.6 Italy
6.3.7 Spain
6.3.8 List of Drugs Approved in 2016 by European Medicine Agency
6.4 Orphan Drug Designation Market in Japan, 2017
6.4.1 New Orphan Drugs approved in Japan in 2016
6.5 Orphan Drug Designation Market in South Korea, 2017
6.6 Orphan Drug Designation Market in Singapore, 2017
6.7 Orphan Drug Designation Market Forecast of the BRIC Countries
6.7.1 Market Forecast of the BRIC Countries
6.7.2 Orphan Drug Designation Market in Brazil, 2017
6.7.3 Orphan Drug Designation Market in Russia, 2017
6.7.4 Orphan Drug Designation Market in India, 2017
6.7.5 Orphan Drug Designation Market in China, 2017
7. Leading Companies in Global Orphan Drug Designation Market, 2016
7.1 Roche
7.2 Celgene
7.3 Bristol-Myers Squibb
7.4 Novartis
7.5 Amgen
7.6 Merck
7.7 Pfizer
7.8 Other Prominent Vendors in Orphan Drug Designation market
8. Qualitative Analysis of the Global Orphan Drugs Designation Market
8.1 SWOT Analysis, 2016
8.2 Overall Global Orphan Drug Designation Market Drivers, Restraints and Trends
8.2.1 Increased Investment in Orphan Drugs from Companies
8.2.2 Opportunities from the Long Pipeline Will Drive Growth
8.3 Restraints on Growth in the Orphan Drug Designation Market.
8.3.1 Treatment Unavailability
8.3.2 Low Awareness
8.3.3 Regulatory Challenge
8.3.4 Patent Expirations
8.4 Trends on Growth in the Orphan Drug Designation Market
8.4.1 Mergers and Acquisitions
8.4.2 High Pricing
8.5 Pricing and Reimbursement Overview
8.5.1 Payers Perspective
9. Executive Summary and Recommendations
10. Glossary
Visiongain Report Sales Order Form
Associated Visiongain Reports
Appendix A
About Visiongain
Appendix B
Visiongain report evaluation form
List of Figures
Figure 2.1 Development Time: Orphan Drug vs Standard Drug
Figure 4.1 Global Orphan Drugs Market Forecast 2017-2028: Revenue ($bn), AGR (%)
Figure 4.2 Global Orphan Drugs Market Segmentation by Therapeutic Class, Market Share 2017 (%)
Figure 4.3 Global Oncology Market Forecast 2017-2028: Revenue ($b), AGR (%)
Figure 4.4 Global Alimentary tract and Metabolism Market Forecast 2017-2028: Revenue ($bn), AGR (%)
Figure 4.5 Global Hormonal Disorders and Haematology Drug Market Forecast 2017-2028: Revenue ($b), AGR (%)
Figure 4.6 Global Neuroscience Drugs Market Forecast 2017-2028: Revenue ($bn), AGR (%)
Figure 4.7 Global Respiratory Drugs Market Forecast 2017-2028: Revenue ($bn), AGR (%)
Figure 4.8 Global Cardiovascular Drugs Market Forecast 2017-2028: Revenue ($bn), AGR (%)
Figure 4.9 Global Nephrology and Ophthalmology Drugs Market Forecast 2017-2028: Revenue ($bn), AGR (%)
Figure 4.10 Global Orphan Drugs Market by Therapeutic Class: Market Share Forecast 2017-2028 (%)
Figure 4.11 Global Orphan Drugs Market by Therapeutic Class 2018 (%)
Figure 4.12 Global Orphan Drugs Market by Therapeutic Class 2023 (%)
Figure 4.13 Global Orphan Drugs Market by Therapeutic Class 2028 (%)
Figure 5.1 Global Orphan Drugs Market Segmentation by Biologic vs Small Molecule, Market Share 2017 (%)
Figure 5.2 Global Biologic Orphan Drugs Market Forecast 2017-2028: Revenue ($bn), AGR (%), CAGR (%)
Figure 5.3 Global Small Molecule Orphan Drugs Market Forecast 2017-2028: Revenue ($bn), AGR (%), CAGR (%)
Figure 5.4 Global Orphan Drugs Market Segmentation by Biologic vs Small Molecule Forecast 2017-2028 (%)
Figure 5.5 Global Orphan Drugs Market Segmentation by Biologic vs Small Molecule Forecast 2018 (%)
Figure 5.6 Global Orphan Drugs Market Segmentation by Biologic vs Small Molecule Forecast 2023 (%)
Figure 5.7 Global Orphan Drugs Market Segmentation by Biologic vs Small Molecule Forecast 2028 (%)
Figure 6.1 Global Orphan Drugs Market Segmentation by Region/Country
Figure 6.2 Global Orphan Drugs Market by Region: Revenue ($bn)
Figure 6.3 Global Orphan Drugs Market by Region: Market Share 2017 (%)
Figure 6.4 Global Orphan Drugs Market by Country: Revenue ($bn)
Figure 6.5 Global Orphan Drugs Market by Country: Market Share (%)
Figure 6.6 Global Orphan Drugs Market Forecast by Region 2017, 2023, 2028: Revenue ($bn)
Figure 6.7 Global Orphan Drugs Market by Region: 2017-2028(%)
Figure 6.8 Global Orphan Drug Designation Market by Region: Market Share Forecast 2017-2028 (%)
Figure 6.9 Global Orphan Drug Designation Market by Region: Market Share Forecast 2017 (%)
Figure 6.10 Global Orphan Drug Designation Market by Region: Market Share Forecast 2023 (%)
Figure 6.11 Global Orphan Drug Designation Market by Region: Market Share Forecast 2028 (%)
Figure 6.12 Orphan Drug Designation Market in the US: 2017 Revenue ($m), Market Share %
Figure 6.13 Orphan Drug Designation Market Forecast in the US 2017-2028: Revenue ($bn), AGR (%)
Figure 6.14 Orphan Drug Designation Market in the EU5 2017: Global Market Share (%)
Figure 6.15 Orphan Drug Designation Market in the EU5 Countries 2017: Market Share (%)
Figure 6.16 Orphan Drug Designation Market Forecast in the EU5 2017-2028: Revenue ($bn), AGR (%)
Figure 6.17 Orphan Drug Designation Market Forecast by EU5 Region: Global Market Share 2017(%)
Figure 6.18 Orphan Drug Designation Market Forecast by EU5 Region: Global Market Share 2028(%)
Figure 6.19 Orphan Drug Designation Market Forecast by EU5 Region: Market Share 2017(%)
Figure 6.20 Orphan Drug Designation Market Forecast by EU5 Region: Market Share 2023(%)
Figure 6.21 Orphan Drug Designation Market Forecast by EU5 Region: Market Share 2028(%)
Figure 6.22 Orphan Drug Designation Market Forecast by EU5 Region: AGR 2017-2028 (%)
Figure 6.23 Orphan Drug Designation Market Forecast in the UK: Revenue ($bn), AGR (%), CAGR (%), 2017-2028
Figure 6.24 Orphan Drug Designation Market Forecast in Germany: Revenue ($bn), AGR (%), CAGR (%), 2017-2028
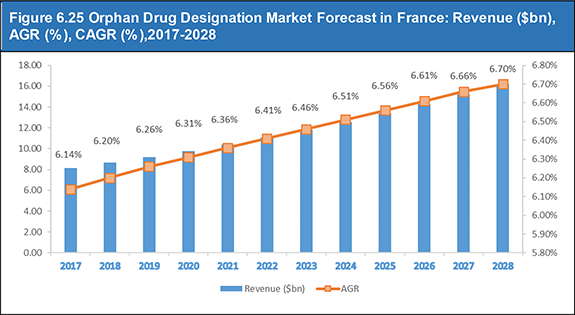
Figure 6.25 Orphan Drug Designation Market Forecast in France: Revenue ($bn), AGR (%), CAGR (%),2017-2028
Figure 6.26 Orphan Drug Designation Market Forecast in the Italy: Revenue ($bn), AGR (%), CAGR (%),2017-2028
Figure 6.27 Orphan Drug Designation Market Forecast in the Spain: Revenue ($bn), AGR (%), CAGR (%), 2017-2028
Figure 6.28 Orphan Drug Designation Market Forecast in the Japan 2017-2028: Revenue ($bn), AGR (%)
Figure 6.29 Orphan Drug Designation Market Forecast in the South Korea: Revenue ($bn), AGR (%), CAGR (%), 2017-2028
Figure 6.30 Orphan Drug Designation Market Forecast in Singapore: Revenue ($bn), AGR (%), CAGR (%), 2017-2028
Figure 6.31 Orphan Drug Designation Market in the BRIC Region: Global Market Share 2017(%)
Figure 6.32 Orphan Drug Designation Market in the BRIC Region: Global Market Share 2023(%)
Figure 6.33 Orphan Drug Designation Market in the BRIC Region: Global Market Share 2028(%)
Figure 6.34 Orphan Drug Designation Market in the BRIC Countries 2017: Market Share (%)
Figure 6.35 Orphan Drug Designation Market in the BRIC Countries 2023: Market Share (%)
Figure 6.36 Orphan Drug Designation Market in the BRIC Countries 2028: Market Share (%)
Figure 6.37 Orphan Drug Designation Market Forecast by BRIC: AGR 2017-2028 (%)
Figure 6.38 Orphan Drug Designation Market Forecast by BRIC: AGR 2017-2028 ($bn)
Figure 6.39 Orphan Drug Designation Market Forecast in the Brazil: Revenue ($bn), AGR (%), CAGR (%),2017-2028
Figure 6.40 Orphan Drug Designation Market Forecast in the Russia: Revenue ($bn), AGR (%), CAGR (%),2017-2028
Figure 6.41 Orphan Drug Designation Market Forecast in the India: Revenue ($bn), AGR (%), CAGR (%),2017-2028
Figure 6.42 Orphan Drug Designation Market Forecast in the China: Revenue ($bn), AGR (%), CAGR (%), 2017-2028
Figure 7.1 Top Selling Orphan Drugs of Roche 2016 in percent (%)
Figure 7.2 Top Selling Orphan Drugs of Roche 2016 vs 2015 ($mn)
Figure 7.3 Top Selling Orphan Drugs of Celgene 2016 in percent (%)
Figure 7.4 Top Selling Orphan Drugs of Celgene 2016 vs 2015 ($mn)
Figure 7.5 Top Selling Orphan Drugs of Bristol-Myers Squibb 2016 in percent (%)
Figure 7.6 Top Selling Orphan Drugs of Bristol-Myers Squibb 2016 vs 2015 ($mn)
Figure 7.7 Top Selling Orphan Drugs of Novartis 2016 in percent (%)
Figure 7.8 Top Selling Orphan Drugs of Novartis 2016 vs 2015 ($mn)
Figure 7.9 Top Selling Orphan Drugs of Amgen 2016 in percent (%)
Figure 7.10 Top Selling Orphan Drugs of Amgen 2016 vs 2015 ($mn)
Figure 7.11 Pfizer: Sales by Geography 2016
Figure 8.1 SWOT Analysis of the Global Orphan Drugs Market
Figure 9.1 Global Orphan Drugs Market Forecast 2016-2027: Revenue ($bn), AGR (%)
List of Tables
Table 2.1 Key Features of Orphan Drug Designation
Table 2.2 Orphan Indications and Prevalence
Table 2.2 Orphan Indications and Prevalence (Continued)
Table 2.3 Difference between Orphan Drugs and Standard Drugs
Table 3.1 Top Selling Orphan Drugs 2016
Table 3.2 List of Orphan Designated Drug from 2014-2016
Table 3.2 List of Orphan Designated Drug from 2014-2016 (Continued)
Table 3.2 List of Orphan Designated Drug from 2014-2016 (Continued)
Table 3.3 Orphan Drug Pipeline 2016
Table 3.3 Orphan Drug Pipeline 2016 (Continued)
Table 3.3 Orphan Drug Pipeline 2016 (Continued)
Table 4.1 Global Orphan Drugs Market Forecast 2017-2028: Revenue ($bn), AGR (%), CAGR (%)
Table 4.2 Global Orphan Drugs Market Segmentation: Revenue ($bn), and Market Share (%), 2017
Table 4.3 Global Oncology Drugs Market Forecast 2017-2028: Revenue ($bn), AGR (%), CAGR (%)
Table 4.4 Global Alimentary tract and Metabolism Drugs Market Forecast 2017-2028: Revenue ($bn), AGR (%), CAGR (%)
Table 4.5 Global Hormonal Disorders and Haematology Drugs Market Forecast 2017-2028: Revenue ($bn), AGR (%), CAGR (%)
Table 4.6 Global Neuroscience Drugs Market Forecast 2017-2028: Revenue ($bn), AGR (%), CAGR (%)
Table 4.7 Global Respiratory Drugs Market Forecast 2017-2028: Revenue ($bn), AGR (%), CAGR (%)
Table 4.8 Global Cardiovascular Drugs Market Forecast 2017-2028: Revenue ($bn), AGR (%), CAGR (%)
Table 4.9 Global Nephrology and Ophthalmology Drugs Market Forecast 2017-2028: Revenue ($bn), AGR (%), CAGR (%)
Table 4.10 Global Orphan Drug Designation Market Segmentation by Therapeutic Class Forecast 2017-2028: Revenue ($bn), AGR (%), CAGR (%)
Table 4.11 Global Orphan Drugs Market by Therapeutic Class: Market Share Forecast 2017-2028 (%)
Table 5.1 Key Features of Biological and Small Molecule Drugs
Table 5.2 Global Biologic Orphan Drugs Market Forecast 2017-2028: Revenue ($bn), AGR (%), CAGR (%)
Table 5.3 Global Small Molecule Orphan Drugs Market Forecast 2017-2028: Revenue ($bn), AGR (%), CAGR (%)
Table 5.4 Global Orphan Drugs Market Segmentation by Biologic vs Small Molecule Forecast 2017-2028: Revenue ($bn), AGR (%), CAGR (%)
Table 5.5 Global Orphan Drugs Market Segmentation by Biologic vs Small Molecule Forecast 2017-2028(%)
Table 6.1 Global Orphan Drugs Market Segmentation by Region: Revenue ($bn), and Market Share (%), 2017
Table 6.2 Global Orphan Drugs Market by Country: Revenue ($bn), and Market Share (%), 2017
Table 6.3 Global Orphan Drugs Market Forecast by Region: Revenue ($bn), AGR (%), CAGR (%),2017-2028
Table 6.4 Global Orphan Drugs Market by Region: AGR 2016-2027 (%)
Table 6.5 Global Orphan Drugs Market by Region: Market Share Forecast 2017-2028 (%)
Table 6.7 Orphan Drugs Market Forecast in the US: Revenue ($bn), AGR (%), CAGR (%),2017-2028
Table 6.8 List of Drugs Approved in 2016 by FDA
Table 6.8 List of Drugs Approved in 2016 by FDA (Continued)
Table 6.8 List of Drugs Approved in 2016 by FDA (Continued)
Table 6.8 List of Drugs Approved in 2016 by FDA (Continued)
Table 6.8 List of Drugs Approved in 2016 by FDA (Continued)
Table 6.8 List of Drugs Approved in 2016 by FDA (Continued)
Table 6.9 Orphan Drugs in the EU% Region 2016, Revenue ($bn) and Market Share (%)
Table 6.10 EU Orphan Applications 2000-2016
Table 6.11 Orphan Drug Designation Market Forecast in EU5: Revenue ($bn), AGR (%), CAGR (%), 2017-2028
Table 6.12 Orphan Drug Designation Market Forecast in EU5 Region: Revenue ($bn), AGR (%), CAGR (%), 2017-2028
Table 6.13 Orphan Drug Designation Market by EU Region: Market Share Forecast 2017-2028 (%)
Table 6.14 Orphan Drug Designation Market Forecast by EU5 Region: AGR 2017-2028 (%)
Table 6.15 Orphan Drug Designation Market Forecast in the UK: Revenue ($bn), AGR (%), CAGR (%),2017-2028
Table 6.17 Orphan Drug Designation Market Forecast in Germany: Revenue ($bn), AGR (%), CAGR (%), 2017-2028
Table 6.18 Orphan Drug Designation Market Forecast in France: Revenue ($bn), AGR (%), CAGR (%),2017-2028
Table 6.19 Orphan Drug Designation Market Forecast in the Italy: Revenue ($bn), AGR (%), CAGR (%), 2017-2028
Table 6.20 Orphan Drug Designation Market Forecast in the Spain: Revenue ($bn), AGR (%), CAGR (%), 2017-2028
Table 6.21 List of Drugs Approved in 2016 by European Medicine Agency
Table 6.21 List of Drugs Approved in 2016 by European Medicine Agency (Continued)
Table 6.22 Orphan Drug Designation Market Forecast in Japan: Revenue ($bn), AGR (%), CAGR (%), 2017-2028
Table 6.23 Orphan Drug Designation Market Forecast in South Korea: Revenue ($bn), AGR (%), CAGR (%), 2017-2028
Table 6.24 Orphan Drug Designation Market Forecast in Singapore: Revenue ($bn), AGR (%), CAGR (%), 2017-2028
Table 6.25 BRIC Orphan Drug Market Snapshot 2016, Revenue ($m) & Market Share (%)
Table 6.26 Orphan Drug Designation Market Forecast by BRIC Region: AGR 2017-2028 (%)
Table 6.27 Global Orphan Drugs Market Forecast by Region: Revenue ($bn), AGR (%), CAGR (%),2016-2027
Table 6.28 Orphan Drug Designation Market Forecast in Brazil: Revenue ($bn), AGR (%), CAGR (%), 2017-2028
Table 6.29 Orphan Drug Designation Market Forecast in Russia: Revenue ($bn), AGR (%), CAGR (%),2017-2028
Table 6.30 Orphan Drug Designation Market Forecast in India: Revenue ($bn), AGR (%), CAGR (%), 2017-2028
Table 6.31 Orphan Drug Designation Market Forecast in China: Revenue ($bn), AGR (%), CAGR (%), 2016-2027
Table 7.1 Roche: Overview 2016
Table 7.2 Bristol-Myers Squibb: Overview 2016
Table 7.3 Novartis: Overview 2016
Table 7.4 Amgen: Overview 2016
Table 7.5 Merck: Overview 2016
Table 7.6 Pfizer: Overview 2016
Table 7.7 Other Prominent Vendors in Orphan Drug Designation market
Table 7.7 Other Prominent Vendors in Orphan Drug Designation market (Continued)
Table 7.7 Other Prominent Vendors in Orphan Drug Designation market (Continued)
Table 7.7 Other Prominent Vendors in Orphan Drug Designation market (Continued)
Table 7.7 Other Prominent Vendors in Orphan Drug Designation market (Continued)