The global vaccines market has witnessed strong growth in past few years. The top 5 manufacturers in the global vaccines market are, Merck & Co., Inc., Sanofi, Pfizer Inc., GlaxoSmithKline PLC, and Johnson & Johnson. These companies secured about 76% revenue share in the global vaccines market.
How this report will benefit you
Read on to discover how you can exploit the future business opportunities emerging in this sector.
In this brand new report you will find 157-page report and you will receive 90 tables and 75 figures – all unavailable elsewhere.
The 157-page report provides clear detailed insight into the Top 20 Vaccines Manufacturers 2019. Discover the key drivers and challenges affecting the market.
By ordering and reading our brand new report today you stay better informed and ready to act.
Report Scope
• Assessment of the leading companies in the global vaccines market:
• Astellas Pharma Inc.
• AstraZeneca
• Bavarian Nordic
• CSL Ltd.
• Emergent Biosolutions, Inc.
• F. Hoffmann-La Roche Ltd.
• Gilead Sciences
• GlaxoSmithKline PLC
• Inovio Pharmaceuticals
• Johnson & Johnson
• Merck & Co., Inc.
• Mitsubishi Tanabe Pharma Corporation
• Novavax, Inc.
• Pfizer Inc.
• Sanofi
• SELLAS Life Sciences Group, Inc.
• Serum Institute of India Pvt. Ltd.
• Sun Pharmaceutical Industries Ltd.
• Takeda Pharmaceutical Company Ltd.
• Teva Pharmaceutical
This report discusses financial outlook, product portfolio and strategic developments.
• Revenues forecast from 2017-2028 for the US, Europe and Japan Vaccines Market.
• Market share of key companies in the vaccines market.
• Market share of leading vaccines in the global vaccines market.
• Drivers, Challenges and Opportunities for the global vaccines market.
• A SWOT analysis of the global vaccines market.
Visiongain’s study is intended for anyone requiring commercial analyses for the Top 20 Vaccines Manufacturers 2019. You find data, trends and predictions.
Buy our report today Top vaccine manufacturers Market Analysis : Merck & Co., Sanofi, Pfizer, GlaxoSmithKline, Johnson & Johnson, AstraZeneca, Emergent Biosolutions, Other Companies.
Visiongain is a trading partner with the US Federal Government
CCR Ref number: KD4R6
1. Report Overview
1.1 Overview of the Global Vaccines Market
1.2 Why You Should Read This Report
1.3 Benefits of This Report
1.4 Report Structure
1.5 Who is This Report For?
1.6 Methodology
1.6.1 Primary Research
1.6.2 Secondary Research
1.7 Frequently Asked Questions (FAQs)
1.8 Associated Visiongain Reports
1.9 About Visiongain
2. Introduction to the World Human Vaccines Market
2.1 Vaccines Market Definition
2.2 Vaccines Market Segmentation
2.2.1 Vaccine Types:
2.2.1.1 Inactivated Vaccines
2.2.1.2 Live Attenuated Vaccines
2.2.1.3 Conjugate Vaccines
2.2.1.4 Recombinant Vector Vaccines
2.2.2 Vaccine Submarket
2.2.2.1 Paediatric vaccines
2.2.2.2 Adult vaccines
2.2.2.3 Elderly vaccines
2.2.2.4 Travel vaccines
2.2.2.5 Therapeutic Vaccines
2.3 Demand for Vaccines in Regional Markets
2.3.1 U.S. Vaccines Market Overview - 2018
2.3.2 Europe Vaccines Market Overview- 2018
2.3.3 Japan Vaccines Market Overview- 2018
3. World Vaccine Market Outlook, 2017-2028
3.1 Global Vaccines Market 2018 Overview
3.2 The World Vaccine Market: Industry Trends, 2017-2028
3.3 Drivers and Challenges for the Global Vaccines Market
3.3.1 Drivers
3.3.1.1 Growing demand from emerging markets
3.3.1.2 Increasing birth rates in developing countries
3.3.1.3 Rise in ageing population globally
3.3.2 Challenges
3.3.2.1 Funding can be difficult to sustain
3.3.2.2 Oligarchic market presents barrier to entry
3.3.3 Opportunities
3.3.3.1 Advancements in vaccine technology and a strong culture of innovation and R&D pipelines
3.3.3.2 Growing awareness of benefits of vaccinations amongst adults
4. Leading 20 Companies Ranking in the Vaccines Market
4.1 Leading 20 Companies Ranking in the Vaccines Market 2018
4.2 Global Vaccines Market Forecast, 2017-2028
5. Top 20 Vaccines Manufacturers
5.1 Merck & Co., Inc. Overview
5.1.1 Merck Financial Outlook
5.1.2 Merck Product Portfolio
5.1.3 Merck Strategic Developments
5.2 Sanofi Overview
5.2.1 Sanofi Financial Outlook
5.2.2 Sanofi Product Portfolio
5.2.3 Sanofi Strategic Developments
5.3 Pfizer Overview
5.3.1 Pfizer Financial Outlook
5.3.2 Pfizer Product Portfolio
5.3.3 Pfizer Strategic Developments
5.4 GlaxoSmithKline PLC Overview
5.4.1 GlaxoSmithKline PLC Financial Outlook
5.4.2 GlaxoSmithKline PLC Product Portfolio
5.4.3 GlaxoSmithKline PLC Strategic Developments
5.5 Johnson & Johnson Overview
5.5.1 Johnson & Johnson Financial Outlook
5.5.2 Johnson & Johnson Product Portfolio
5.5.3 Johnson & Johnson Strategic Developments
5.6 AstraZeneca Overview
5.6.1 AstraZeneca Financial Outlook
5.6.2 AstraZeneca Product Portfolio
5.6.3 AstraZeneca Strategic Developments
5.7 Emergent Biosolutions Overview
5.7.1 Emergent Biosolutions Financial Outlook
5.7.2 Emergent Biosolutions Product Portfolio
5.7.3 Emergent Biosolutions Strategic Developments
5.8 CSL Ltd. Overview
5.8.1 CSL Ltd. Financial Outlook
5.8.2 CSL Ltd. Product Portfolio
5.8.3 CSL Ltd. Strategic Developments
5.9 Serum Institute of India Pvt. Ltd. Overview
5.9.1 Serum Institute of India Pvt. Ltd. Financial Outlook
5.9.2 Serum Institute of India Pvt. Ltd. Product Portfolio
5.9.3 Serum Institute of India Pvt. Ltd. Strategic Developments
5.10 Astellas Pharma Overview
5.10.1 Astellas Pharma Financial Outlook
5.10.2 Astellas Pharma Product Portfolio
5.10.3 Astellas Pharma Strategic Developments
5.11 SELLAS Life Sciences Group, Inc. Overview
5.11.1 SELLAS Life Sciences Group, Inc. Financial Outlook
5.11.2 SELLAS Life Sciences Group, Inc. Product Portfolio
5.11.3 SELLAS Life Sciences Group, Inc. Strategic Developments
5.12 Novavax, Inc. Overview
5.12.1 Novavax, Inc. Financial Outlook
5.12.2 Novavax, Inc. Product Portfolio
5.13 Inovio Pharmaceuticals Overview
5.13.1 Inovio Pharmaceuticals Financial Outlook
5.13.2 Inovio Pharmaceuticals Product Portfolio
5.13.3 Inovio Pharmaceuticals Strategic Developments
5.14 Mitsubishi Tanabe Pharma Corporation Overview
5.14.1 Mitsubishi Tanabe Pharma Corporation Financial Outlook
5.14.2 Mitsubishi Tanabe Pharma Corporation Product Portfolio
5.14.3 Mitsubishi Tanabe Pharma Corporation Strategic Developments
5.15 Sun Pharmaceutical Industries Ltd. Overview
5.15.1 Sun Pharmaceutical Industries Ltd. Financial Outlook
5.15.2 Sun Pharmaceutical Industries Ltd. Product Portfolio
5.15.3 Sun Pharmaceutical Industries Ltd. Strategic Developments
5.16 Gilead Sciences Overview
5.16.1 Gilead Sciences Financial Outlook
5.16.2 Gilead Sciences Product Portfolio
5.16.3 Gilead Sciences Strategic Developments
5.17 F. Hoffmann-La Roche Ltd. Overview
5.17.1 F. Hoffmann-La Roche Ltd. Financial Outlook
5.17.2 F. Hoffmann-La Roche Ltd. Product Portfolio
5.17.3 F. Hoffmann-La Roche Ltd. Strategic Developments
5.18 Takeda Pharmaceutical Company Limited Overview
5.18.1 Takeda Pharmaceutical Company Limited. Financial Outlook
5.18.2 Takeda Pharmaceutical Company Limited. Product Portfolio
5.18.3 Takeda Pharmaceutical Company Limited. Strategic Developments
5.19 Teva Pharmaceutical Overview
5.19.1 Teva Pharmaceutical Financial Outlook
5.19.2 Teva Pharmaceutical Product Portfolio
5.19.3 Teva Pharmaceutical Strategic Developments
5.20 Bavarian Nordic Overview
5.20.1 Bavarian Nordic Financial Outlook
5.20.2 Bavarian Nordic Product Portfolio
5.20.3 Bavarian Nordic Strategic Developments
6. SWOT Analysis of the Global Vaccines Market, 2018
6.1 Strengths
6.2 Weaknesses
6.3 Opportunities
6.4 Threats
7. Conclusion
7.1 Strong and Diverse Research and Development
7.2 Oligarchic market presents
7.3 Emerging Markets: High Demand for Vaccines
7.4 Top 20 Companies and Revenue
Appendices
Associated Visiongain Reports
Visiongain Report Sales Order Form
About Visiongain
Visiongain Report Evaluation Form
List of Tables
Table 2.1 The US Vaccines Revenue Forecast ($bn) and Annual Growth (%), 2017-2028
Table 2.2 The Europe Vaccines Revenue Forecast ($bn) and Annual Growth (%), 2017-2028
Table 2.3 Japan Vaccines Revenue Forecast ($bn) and Annual Growth (%), 2017-2028
Table 4.1 Companies Profiled in this Report and Country HQ
Table 4.2 Global Vaccines Revenue Forecast ($bn) and Annual Growth (%), 2017-2028
Table 5.1 Merck & Co., Inc.: Key Facts, 2017
Table 5.2 Merck & Co., Inc.: Revenue ($million) and Revenue Shares (%) by Reporting Segment, 2017
Table 5.3 Merck & Co., Inc.: Product Revenue ($million) and Revenue Shares (%) by Reporting Segment, 2017
Table 5.4 Merck & Co., Inc.: Vaccines Clinical Pipeline
Table 5.5 Merck & Co., Inc.: Vaccines Revenue ($million), AGR (%) 2015-2017
Table 5.6 Merck & Co., Inc.: Vaccines Product Revenue ($million) and Revenue Shares (%), 2017
Table 5.7 Merck & Co., Inc.: Strategic Developments, 2015-2018
Table 5.8 Sanofi: Key Facts, 2017
Table 5.9 Sanofi: Revenue ($million) and Revenue Shares (%) by Reporting Segment, 2017
Table 5.10 Sanofi: Vaccines Clinical Pipeline
Table 5.11 Sanofi: Vaccines Revenue ($million), AGR (%) 2015-2017
Table 5.12 Sanofi: Vaccines Product Revenue ($million) and Revenue Shares (%), 2017
Table 5.13 Sanofi: Strategic Developments, 2015-2018
Table 5.14 Pfizer: Key Facts, 2017
Table 5.15 Pfizer: Revenue ($million) and Revenue Shares (%) by Reporting Segment, 2017
Table 5.16 Pfizer: Product Revenue ($million) and Revenue Shares (%) by Reporting Segment, 2017
Table 5.17 Pfizer: Vaccines Clinical Pipeline
Table 5.18 Pfizer: Vaccines Revenue ($million), AGR (%) 2015-2017
Table 5.19 Pfizer: Vaccines Product Revenue ($million) and Revenue Shares (%), 2017
Table 5.20 Pfizer: Strategic Developments, 2015-2018
Table 5.21 GlaxoSmithKline PLC: Key Facts, 2017
Table 5.22 GlaxoSmithKline PLC: Revenue ($million) and Revenue Shares (%) by Reporting Segment, 2017
Table 5.23 GlaxoSmithKline PLC: Product Revenue ($million) and Revenue Shares (%) by Reporting Segment, 2017
Table 5.24 GlaxoSmithKline PLC: Vaccines Clinical Pipeline
Table 5.25 GlaxoSmithKline PLC: Vaccines Revenue ($million), AGR (%) 2015-2017
Table 5.26 GlaxoSmithKline PLC: Vaccines Product Revenue ($million) and Revenue Shares (%), 2017
Table 5.27 GlaxoSmithKline PLC: Strategic Developments, 2015-2018
Table 5.28 Johnson & Johnson: Key Facts, 2018
Table 5.29 Johnson & Johnson: Revenue ($million) and Revenue Shares (%) by Reporting Segment, 2017
Table 5.30 Johnson & Johnson: Product Revenue ($million) and Revenue Shares (%) by Reporting Segment, 2017
Table 5.31 Johnson & Johnson: Vaccines Clinical Pipeline
Table 5.32 Johnson & Johnson: Infectious Diseases and Vaccines Revenue ($million), AGR (%) 2015-2017
Table 5.33 Johnson & Johnson: Vaccines Product Revenue ($million) and Revenue Shares (%), 2017
Table 5.34 Johnson & Johnson: Strategic Developments, 2015-2018
Table 5.35 AstraZeneca: Key Facts, 2018
Table 5.36 AstraZeneca: Revenue ($million) and Revenue Shares (%) by Reporting Segment, 2017
Table 5.37 AstraZeneca: Infectious Diseases and Vaccines Revenue ($million), AGR (%) 2015-2017
Table 5.38 AstraZeneca: Vaccines Product Revenue ($million) and Revenue Shares (%), 2017
Table 5.39 AstraZeneca: Strategic Developments, 2015-2018
Table 5.40 Emergent Biosolutions: Key Facts, 2018
Table 5.41 Emergent Biosolutions: Revenue ($million) and Revenue Shares (%) by Reporting Segment, 2017
Table 5.42 Emergent Biosolutions: Vaccines Clinical Pipeline
Table 5.43 Emergent Biosolutions: Strategic Developments, 2015-2018
Table 5.44 CSL Ltd.: Key Facts, 2018
Table 5.45 CSL Ltd.: Revenue ($million) and Revenue Shares (%) by Reporting Segment, 2018
Table 5.46 CSL Ltd.: Vaccines Clinical Pipeline
Table 5.47 CSL Ltd.: Strategic Developments, 2015-2018
Table 5.48 Serum Institute of India Pvt. Ltd.: Key Facts, 2018
Table 5.49 Serum Institute of India Pvt. Ltd.: Strategic Developments, 2015-2018
Table 5.50 Astellas Pharma: Key Facts, 2018
Table 5.51 Astellas Pharma: Revenue ($million) and Revenue Shares (%) by Product, 2018
Table 5.52 Astellas Pharma: Vaccines Clinical Pipeline
Table 5.53 Astellas Pharma: Strategic Developments, 2015-2018
Table 5.54 SELLAS Life Sciences Group, Inc.: Key Facts, 2018
Table 5.55 SELLAS Life Sciences Group, Inc.: Vaccines Clinical Pipeline
Table 5.56 SELLAS Life Sciences Group, Inc.: Strategic Developments, 2015-2018
Table 5.57 Novavax, Inc.: Key Facts, 2018
Table 5.58 Novavax, Inc.: Vaccines Clinical Pipeline
Table 5.59 Inovio Pharmaceuticals: Key Facts, 2018
Table 5.60 Inovio Pharmaceuticals: Vaccines Clinical Pipeline
Table 5.61 Inovio Pharmaceuticals: Strategic Developments, 2015-2018
Table 5.62 Mitsubishi Tanabe Pharma Corporation: Key Facts, 2018
Table 5.63 Mitsubishi Tanabe Pharma Corporation: Revenue ($million) and Revenue Shares (%) by Product Type, 2017
Table 5.64 Mitsubishi Tanabe Pharma Corporation: Vaccines Clinical Pipeline
Table 5.65 Mitsubishi Tanabe Pharma Corporation: Vaccines Revenue ($million), AGR (%) 2015-2017
Table 5.66 Mitsubishi Tanabe Pharma Corporation: Vaccines Product Revenue ($million) and Revenue Shares (%), 2017
Table 5.67 Mitsubishi Tanabe Pharma Corporation: Strategic Developments, 2015-2018
Table 5.68 Sun Pharmaceutical Industries Ltd.: Key Facts, 2018
Table 5.69 Sun Pharmaceutical Industries Ltd.: Strategic Developments, 2015-2018
Table 5.70 Gilead Sciences: Key Facts, 2018
Table 5.71 Gilead Sciences: Revenue ($million) and Revenue Shares (%) by Segment, 2017
Table 5.72 Gilead Sciences: Strategic Developments, 2015-2018
Table 5.73 F. Hoffmann-La Roche Ltd.: Key Facts, 2018
Table 5.74 F. Hoffmann-La Roche Ltd.: Vaccines Clinical Pipeline
Table 5.75 F. Hoffmann-La Roche Ltd.: Strategic Developments, 2015-2018
Table 5.76 Takeda Pharmaceutical Company Limited: Key Facts, 2018
Table 5.77 Takeda Pharmaceutical Company: Vaccines Clinical Pipeline
Table 5.78 Takeda Pharmaceutical Company: Strategic Developments, 2015-2018
Table 5.79 Teva Pharmaceutical: Key Facts, 2018
Table 5.80 Teva Pharmaceutical: Revenue ($million) and Revenue Shares (%) by Segment, 2017
Table 5.81 Teva Pharmaceutical: Strategic Developments, 2015-2018
Table 5.82 Bavarian Nordic: Key Facts, 2018
Table 5.83 Bavarian Nordic: Vaccines Clinical Pipeline
Table 5.84 Bavarian Nordic: Strategic Developments, 2015-2018
Table 7.1 Top 20 Companies and Revenue, 2017 ($million)
List of Figures
Figure 4.1 Market Share of Key Companies in the Vaccines Market (%), 2017
Figure 4.2 Market Share of Leading Vaccines in the Market (%), 2017
Figure 4.3 Global Vaccines Revenue ($bn), 2017-2028
Figure 5.1 Merck & Co., Inc.: Historical Revenues ($million), 2013-2017
Figure 5.2 Merck & Co., Inc.: Revenue Shares (%) by Reporting Segment, 2017
Figure 5.3 Merck & Co., Inc.: Revenue Shares (%) by Reporting Segment, 2017
Figure 5.4 Merck & Co., Inc.: Revenue Shares (%) by Region, 2017
Figure 5.5 Merck & Co., Inc.: Diagnostics Revenue ($million), 2015-2017
Figure 5.6 Merck & Co., Inc.: Vaccines Product Revenue Shares (%), 2017
Figure 5.7 Sanofi: Historical Revenues ($million), 2013-2017
Figure 5.8 Sanofi: Revenue Shares (%) by Reporting Segment, 2017
Figure 5.9 Sanofi: Revenue Shares (%) by Region, 2017
Figure 5.10 Sanofi: Diagnostics Revenue ($million), 2015-2017
Figure 5.11 Sanofi: Vaccines Product Revenue Shares (%), 2017
Figure 5.12 Pfizer: Historical Revenues ($million), 2013-2017
Figure 5.13 Pfizer: Revenue Shares (%) by Reporting Segment, 2017
Figure 5.14 Merck & Co., Inc.: Revenue Shares (%) by Reporting Segment, 2017
Figure 5.15 Pfizer: Revenue Shares (%) by Region, 2017
Figure 5.16 Pfizer: Diagnostics Revenue ($million), 2015-2017
Figure 5.17 Pfizer: Vaccines Product Revenue Shares (%), 2017
Figure 5.18 GlaxoSmithKline PLC: Historical Revenues ($million), 2013-2017
Figure 5.19 GlaxoSmithKline PLC: Revenue Shares (%) by Reporting Segment, 2017
Figure 5.20 GlaxoSmithKline PLC: Revenue Shares (%) by Product, 2017
Figure 5.21 GlaxoSmithKline PLC: Revenue Shares (%) by Region, 2017
Figure 5.22 GlaxoSmithKline PLC: Diagnostics Revenue Shares (%), 2017
Figure 5.23 GlaxoSmithKline PLC: Vaccines Revenue Shares (%), 2017
Figure 5.24 GlaxoSmithKline PLC: Vaccines Revenue by Region ($million), 2017
Figure 5.25 Johnson & Johnson: Historical Revenues ($million), 2013-2017
Figure 5.26 Johnson & Johnson: Revenue Shares (%) by Reporting Segment, 2017
Figure 5.27 Johnson & Johnson: Revenue Shares (%) by Product, 2017
Figure 5.28 Johnson & Johnson: Revenue Shares (%) by Region, 2017
Figure 5.29 Johnson & Johnson: Diagnostics Revenue ($million), 2015-2017
Figure 5.30 Johnson & Johnson: Vaccines Revenue Shares (%), 2017
Figure 5.31 AstraZeneca: Historical Revenues ($million), 2013-2017
Figure 5.32 AstraZeneca: Revenue Shares (%) by Reporting Segment, 2017
Figure 5.33 AstraZeneca: Revenue Shares (%) by Region, 2017
Figure 5.34 AstraZeneca: Diagnostics Revenue ($million), 2015-2017
Figure 5.35 AstraZeneca: Vaccines Revenue Shares (%), 2017
Figure 5.36 AstraZeneca: Vaccines Revenue by Region ($million), 2017
Figure 5.37 Emergent Biosolutions: Historical Revenues ($million), 2013-2017
Figure 5.38 Emergent Biosolutions: Revenue Shares (%) by Reporting Segment, 2017
Figure 5.39 Emergent Biosolutions: Revenue Shares (%) by Region, 2017
Figure 5.40 CSL Ltd.: Historical Revenues ($million), 2013-2017
Figure 5.41 CSL Ltd.: Revenue Shares (%) by Reporting Segment, 2018
Figure 5.42 CSL Ltd.: Revenue Shares (%) by Region, 2017
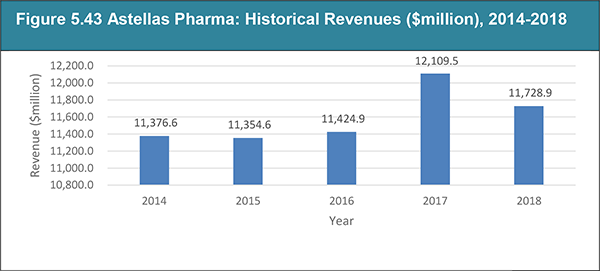
Figure 5.43 Astellas Pharma: Historical Revenues ($million), 2014-2018
Figure 5.44 Astellas Pharma: Revenue Shares (%) by Product, 2018
Figure 5.45 Astellas Pharma: Revenue Shares (%) by Region, 2018
Figure 5.46 Novavax, Inc.: Historical Revenues ($million), 2013-2017
Figure 5.47 Inovio Pharmaceuticals: Historical Revenues ($million), 2013-2017
Figure 5.48 Mitsubishi Tanabe Pharma Corporation: Historical Revenues ($million), 2013-2017
Figure 5.49 Mitsubishi Tanabe Pharma Corporation: Revenue Shares (%) by Product Type, 2017
Figure 5.50 Mitsubishi Tanabe Pharma Corporation: Revenue Shares (%) by Ethical Products, 2017
Figure 5.51 Mitsubishi Tanabe Pharma Corporation: Revenue Shares (%) by Region, 2017
Figure 5.52 Mitsubishi Tanabe Pharma Corporation: Diagnostics Revenue ($million), 2015-2017
Figure 5.53 Mitsubishi Tanabe Pharma Corporation: Vaccines Revenue Shares (%), 2017
Figure 5.54 Sun Pharmaceutical Industries Ltd.: Historical Revenues ($million), 2014-2018
Figure 5.55 Sun Pharmaceutical Industries Ltd.: Revenue Shares (%) by Region, 2018
Figure 5.56 Gilead Sciences: Historical Revenues ($million), 2013-2017
Figure 5.57 Gilead Sciences: Revenue Shares (%) by Segment, 2017
Figure 5.58 Gilead Sciences: Revenue Shares (%) by Product Type, 2017
Figure 5.59 Gilead Sciences: Revenue Shares (%) by Products, 2017
Figure 5.60 Gilead Sciences: Revenue Shares (%) by Region, 2017
Figure 5.61 F. Hoffmann-La Roche Ltd.: Historical Revenues ($million), 2013-2017
Figure 5.62 Mitsubishi Tanabe Pharma Corporation: Revenue Shares (%) by Product Type, 2018
Figure 5.63 F. Hoffmann-La Roche Ltd.: Revenue Shares (%) by Region, 2018
Figure 5.64 Takeda Pharmaceutical Company Limited: Historical Revenues ($million), 2014-2018
Figure 5.65 Takeda Pharmaceutical Company Limited: Revenue Shares (%) by Product Type, 2018
Figure 5.66 Takeda Pharmaceutical Company Limited: Revenue Shares (%) by Region, 2018
Figure 5.67 Teva Pharmaceutical: Historical Revenues ($million), 2013-2017
Figure 5.68 Teva Pharmaceutical: Revenue Shares (%) by Product Type, 2017
Figure 5.69 Teva Pharmaceutical: Revenue Shares (%) by Region, 2017
Figure 5.70 Bavarian Nordic: Historical Revenues ($million), 2013-2017
Figure 5.71 Bavarian Nordic: Revenue Shares (%) by Region, 2017
Figure 6.1 SWOT Analysis of the Global Vaccines Market, 2018