If you read only 1 static compensators report this year – this is the report you need to read. Take a look at our report on static compensators. It’ll give you an idea of what activities are in the global market and how you can leverage your products and services to generate revenue.
Find out How your Static Compensator Products Can Beat Other Products in the Market?
In practical applications, STATCOM has several advantages over other FACTS devices such as size, weight, and cost reduction, precise and continuous reactive power control with fast response. Therefore, many research activities about STATCOM to improve power system stability have been reported. Conventionally, STATCOM is used for voltage regulation in transmission lines through proportional-integral (PI) control. To improve the dynamic performance of PI control, particle swarm optimization (PSO) has been adopted to adjust the controller gains. Other control strategies, such as pole-placement and linear quadratic regulator, are also in demand.
How to break through the COVID-19 bottleneck? This report analyses four recovery pathways and helps you to make decision based on our analysis.
To access the data contained in this document please email contactus@visiongain.com
Are you Ready To Grab the Big Opportunity?
In recent years, battery energy storage (BES) techniques are fast developing due to the advancement of power electronics and battery technology. This leads to their increasing applications in power systems for different objectives. Since the integration of BES into STATCOM enables itself fast active power provision capability, various control strategies have been proposed to improve the stability of power systems.
What’s your business strategy to tackle stiff competition in the static compensators Market?
• GE to scale up power stability through two new agreements with Iraqi Ministry of Electricity. US727 million agreement with GE Renewable Energy’s Grid Solutions business to reinforce Iraq’s transmission network.
• Hitachi ABB Power Grids has signed a definitive agreement to acquire US-based Pioneer Solutions LLC, a provider of industry-leading front-to-back-office Commodities/Energy Trading and Risk Management (C/ETRM) solutions, headquartered in Denver, Colorado, USA.
• Power management company Eaton announced it has signed an agreement to acquire a 50 percent stake in HuanYu High Tech, a subsidiary of HuanYu Group that manufactures and markets low-voltage circuit breakers and contactors in China, and throughout the Asia-Pacific region.
Key questions answered in this exclusive report are:
• What are the implication to contract prices of static compensators projects taking place now and over the next 10 years?
• Where is the static compensators power market heading? And how can you ensure you are at the forefront of the market?
You need to discover how this will impact the static compensators power market today, and over the next 10 years:
• Our 325-page report provides 257 tables and 169 charts/graphs exclusively to you.
• The report highlights key lucrative areas in the industry so you can target them – NOW.
• Contains in-depth analyse of global, regional and national sales and growth
• Highlights for you the key successful trends, changes and revenue projections made by your competitors
This report tells you TODAY how the Static Compensators market will develop in the next 10 years, and in-line with the variations in COVID-19 economic recession and bounce. This market is more critical now than at any point over the last 10 years.
Forecasts to 2031 and other analyses reveal the commercial prospects
• In addition to revenue forecasting to 2031, our new study provides you with recent results, growth rates, and market shares.
• You find original analyses, with business outlooks and developments.
• Discover qualitative analyses (including market dynamics, drivers, opportunities, restraints and challenges), cost structure, impact of COVID on static compensators project profiles and recent developments.
This report includes data analysis and invaluable insight into how COVID-19 will affect your industry. Four COVID-19 recovery patterns and their impact, namely, V, L, W and U are discussed in this report.
Global Static Compensators Market by Type (COVID Impact Analysis)
• Thyristor-based
• TCR-FC-TSC
• MCR-based
Global Static Compensators Market by Vertical (COVID Impact Analysis)
• Electric Utility
• Renewable
• Railway
• Industrial
• Oil & Gas
• Other Vertical
Global Static Compensators Market by Component (COVID Impact Analysis)
• Power Electronic Device
• Harmonic Filter
• Thyristor
• Capacitor Bank
• GIS Switchgear
• Other Component

In addition to the revenue predictions for the overall world market and segments, you will also find revenue forecasts for 4 regional and 20 leading national markets:
• Americas Static Compensators 2021 to 2031 Market Outlook
– U.S. Static Compensators 2021 to 2031 Market Forecast & COVID Impact Analysis
– Canada Static Compensators 2021 to 2031 Market Forecast & COVID Impact Analysis
• Europe Static Compensators 2021 to 2031 Market Outlook
– Germany Static Compensators 2021 to 2031 Market Forecast & COVID Impact Analysis
– UK Static Compensators 2021 to 2031 Market Forecast & COVID Impact Analysis
– France Static Compensators 2021 to 2031 Market Forecast & COVID Impact Analysis
– Italy Static Compensators 2021 to 2031 Market Forecast & COVID Impact Analysis
– Spain Static Compensators 2021 to 2031 Market Forecast & COVID Impact Analysis
– Rest of Europe Static Compensators 2021 to 2031 Market Forecast & COVID Impact Analysis
• Asia Pacific Static Compensators 2021 to 2031 Market Outlook
– China Static Compensators 2021 to 2031 Market Forecast & COVID Impact Analysis
– India Static Compensators 2021 to 2031 Market Forecast & COVID Impact Analysis
– Japan Static Compensators 2021 to 2031 Market Forecast & COVID Impact Analysis
– Australia Static Compensators 2021 to 2031 Market Forecast & COVID Impact Analysis
– South Korea Static Compensators 2021 to 2031 Market Forecast & COVID Impact Analysis
– Rest of Asia Pacific Static Compensators 2021 to 2031 Market Forecast & COVID Impact Analysis
• LAMEA Static Compensators 2021 to 2031 Market Outlook
– Brazil Static Compensators 2021 to 2031 Market Forecast & COVID Impact Analysis
– Saudi Arabia Static Compensators 2021 to 2031 Market Forecast & COVID Impact Analysis
– South Africa Static Compensators 2021 to 2031 Market Forecast & COVID Impact Analysis
– Mexico Static Compensators 2021 to 2031 Market Forecast & COVID Impact Analysis
– UAE Static Compensators 2021 to 2031 Market Forecast & COVID Impact Analysis
– Rest of World Static Compensators 2021 to 2031 Market Forecast & COVID Impact Analysis
Need industry data? Please contact us today.
The report also includes profiles and for some of the leading companies in the Static Compensators 2021 to 2031 Market, with a focus on this segment of these companies’ operations.
Leading companies and the potential for market growth
• General Electric Company
• Hitachi, Ltd.
• Mitsubishi Electric Corporation
• American Electric Power Company, Inc. (AEP)
• Abb Ltd
• Infineon Technologies AG
• General Dynamics Corporation
• Eaton Corporation Plc (Eaton)
• American Superconductor Corporation (AMSC)
• Siemens AG
Overall world revenue for Static Compensators 2021 to 2031 Market will surpass US$xx million in 2021, our work calculates. We predict strong revenue growth through to 2031. Our work identifies which organizations hold the greatest potential. Discover their capabilities, progress, and commercial prospects, helping you stay ahead.
How the Static Compensators 2021 to 2031 Market report helps you?
In summary, our 320+ page report provides you with the following knowledge:
• Revenue forecasts to 2031 for Static Compensators 2021 to 2031 Market, with forecasts for Type, Component, Vertical each forecasted at a global and regional level– discover the industry’s prospects, finding the most lucrative places for investments and revenues
• Revenue forecasts to 2031 for 5 regional and 20 key national markets – See forecasts for the Static Compensators Market, 2021 to 2031 market in Americas, Europe, Asia-Pacific and LAMEA. Also forecasted is the market in the US, Mexico, Germany, France, UK, Italy, Spain, China, Japan, and Australia among other prominent economies.
• Prospects for established firms and those seeking to enter the market– including company profiles for 10 of the major companies involved in the Static Compensators 2021 to 2031 Market.
Find quantitative and qualitative analyses with independent predictions. Receive information that only our report contains, staying informed with this invaluable business intelligence.
Information found nowhere else
With our newly report title, you are less likely to fall behind in knowledge or miss out on opportunities. See how our work could benefit your research, analyses, and decisions. Visiongain’s study is for everybody needing commercial analyses for the Static Compensators 2021 to 2031 Market and leading companies. You will find data, trends and predictions.
To access the data contained in this document please email contactus@visiongain.com
Buy our report today Static Compensator Market Report 2021-2031: Forecast by Type (Thyristor-based, TCR-FC-TSC, MCR-based), by Component (Power Electronic Device, Harmonic Filter, Thyristor, Capacitor Bank, GIS Switchgear, Phase Shifting Transformer (PST)), by Vertical (Electric Utility, Renewable, Railway, Industrial, Oil & Gas) AND Regional and Leading National Market Analysis PLUS Analysis of Leading Static Compensator Companies AND COVID-19 Recovery Scenarios. Avoid missing out by staying informed – order our report now.
Visiongain is a trading partner with the US Federal Government
CCR Ref number: KD4R6
Do you have any custom requirements we can help you with? Any need for a specific country, geo region, market segment or specific company information? Contact us today, we can discuss your needs and see how we can help: sara.peerun@visiongain.com
1. Report Overview
1.1 Introduction to Static Compensators Market
1.2 Global Static Compensator Market Overview
1.3 What are the Objectives of this Report?
1.4 What is the Scope of the Report?
1.5 Static Compensators Market Definition
1.6 Why You Should Read This Report
1.7 What This Report Delivers
1.8 Key Questions Answered By This Analytical Report Include:
1.9 Who is This Report For?
1.10 Methodology
1.10.1 Primary Research
1.10.2 Secondary Research
1.10.3 Market Evaluation & Forecasting Methodology
1.11 Frequently Asked Questions (FAQs)
1.12 Associated Visiongain Reports
1.13 About Visiongain
2 Executive Summary
2.1 Modern Static VAR Compensator
2.2 Hybrid Static Compensator is in Demand
3 Static Compensator Industry Overview
3.1 Static Compensator Construction
3.2 Basic Operation of Static Compensator
3.2.1 EMTP Modeling of Static Compensator
3.2.2 Configuration of SVC
3.2.3 Control Concept of SVC
3.3 Performance Criteria of SVC Operation
3.4 Performance Analysis Of SVC Controller
3.4.1 Modeling for Dynamic Performance Analysis with SVC Applications
3.4.2 Controller Design Analysis of Static Compensator
3.4.3 Control Principles
3.4.4 Space Vector Control Concepts
3.4.5 Power System Voltage Control
3.4.6 Power Oscillation Damping Control
3.4.7 Power Factor Control
3.4.8 Negative Phase Sequence Control
3.4.9 Advantages of Static Compensators
3.5 Similar Devices
4 Market Dynamics
4.1 Which are the Driving Forces in the Global Market?
4.1.1 Satatic Compensator Is Gaining Traction Due to Its Ability To Deliver Rated Current Over The Full Voltage Range
4.1.2 How The Primary Benefits of the STATCOM Propelling the Market?
4.1.3 SVC Is The Preferred Tool For Dynamic Reactive Power Support In High Voltage Transmission Grids.
4.1.4 Increased Efficiency In Power Systems
4.1.5 Major Savings At Reasonable Cost
4.2 Which Restraining Factors Are Hindering Growth of the Market?
4.2.1 The Power Losses In The STATCOM Equate To Lost Revenue For The Utility In Question
4.3 What are the Opportunities for Companies in the Global Market?
4.3.1 Static Compensator: Rapid Response, Wide Operational Range And High Reliability Will Boost its Demand
4.3.2 Many Research Activities About STATCOM To Improve Power System Stability Have Been Reported
4.3.3 The Integration Of BES into STATCOM Enables Itself Fast Active Power Provision Capability
4.4 What are the Challenges in the Global Market?
4.4.1 The Challenge Is To Achieve A High Mvar Output Rating
4.4.2 Need Of More Efficient Electricity Systems Management Has Given Rise To Innovative Technologies In Power Generation And Transmission
4.4.3 Modern Society Has Relied Consistently On Electrical Power, Requiring Higher Demands Of Power Stability And Power Quality.
5 Global Static Compensators Market
5.1 Global Market Outlook
5.2 Global Market Size Estimation and Forecast
5.2.1 Pre-COVID Makret Scenario Analysis
5.2.2 Post-COVID Market Scenario Analysis (V, W, U, L Shaped Recovery)
5.3 Global Market Breakdown by Region
5.3.1 Pre-COVID Makret Scenario Analysis
5.3.2 Post-COVID Market Scenario Analysis (V, W, U, L Shaped Recovery)
5.4 Global Market Breakdown by Type
5.4.1 The Thyristor Controlled Reactor
5.4.2 Modular Multilevel Converter (MMC)-Based STATCOM
5.4.3 Half-Bridge MMC
5.4.4 Power System Stabilizers
5.4.5 Advanced Digital Control for SVC Systems
5.4.6 Control Software
5.4.7 Pre-COVID Makret Scenario Analysis
5.4.8 Post-COVID Market Scenario Analysis (V, W, U, L Shaped Recovery)
5.5 Global Market Breakdown by Component
5.5.1 STATCOM Transformer
5.5.2 STATCOM Reactors
5.5.3 DC Capacitors
5.5.4 AC Harmonic Filters
5.5.5 High-Precision Current Transducers
5.5.6 Pre-COVID Makret Scenario Analysis
5.5.7 Post-COVID Market Scenario Analysis (V, W, U, L Shaped Recovery)
5.6 Global Market Breakdown by Vertical
5.6.1 Static Compensator for Power Transmission
5.6.2 Static Compensators for Distribution System
5.6.3 Static Compensators for Wind Power Plant
5.6.4 Static Compensators for Industrial Consumers
5.6.5 Static Compensators for Railways
5.6.6 Pre-COVID Makret Scenario Analysis
5.6.7 Post-COVID Market Scenario Analysis (V, W, U, L Shaped Recovery)
6 North America Static Compensators Market
6.1 North America Market Outlook
6.2 North America Market Size Estimation and Forecast
6.2.1 Pre-COVID Makret Scenario Analysis
6.2.2 Post-COVID Market Scenario Analysis (V, W, U, L Shaped Recovery)
6.3 North America Market Breakdown by Country
6.3.1 Pre-COVID Makret Scenario Analysis
6.3.2 Post-COVID Market Scenario Analysis (V, W, U, L Shaped Recovery)
6.4 North America Market Breakdown by Type
6.4.1 Pre-COVID Makret Scenario Analysis
6.4.2 Post-COVID Market Scenario Analysis (V, W, U, L Shaped Recovery)
6.5 North America Market Breakdown by Component
6.5.1 Pre-COVID Makret Scenario Analysis
6.5.2 Post-COVID Market Scenario Analysis (V, W, U, L Shaped Recovery)
6.6 North America Market Breakdown by Vertical
6.6.1 Pre-COVID Makret Scenario Analysis
6.6.2 Post-COVID Market Scenario Analysis (V, W, U, L Shaped Recovery)
6.7 US Static Compensator Market Outlook
6.7.1 Pre-COVID Makret Scenario Analysis
6.7.2 Post-COVID Market Scenario Analysis (V, W, U, L Shaped Recovery)
6.8 Canada Static Compensator Market Outlook
6.8.1 Pre-COVID Makret Scenario Analysis
6.8.2 Post-COVID Market Scenario Analysis (V, W, U, L Shaped Recovery)
7 Europe Static Compensators Market
7.1 Europe Market Outlook
7.2 Europe Market Size Estimation and Forecast
7.2.1 Pre-COVID Makret Scenario Analysis
7.2.2 Post-COVID Market Scenario Analysis (V, W, U, L Shaped Recovery)
7.3 Europe Market Breakdown by Country
7.3.1 Pre-COVID Makret Scenario Analysis
7.3.2 Post-COVID Market Scenario Analysis (V, W, U, L Shaped Recovery)
7.4 Europe Market Breakdown by Type
7.4.1 Pre-COVID Makret Scenario Analysis
7.4.2 Post-COVID Market Scenario Analysis (V, W, U, L Shaped Recovery)
7.5 Europe Market Breakdown by Component
7.5.1 Pre-COVID Makret Scenario Analysis
7.5.2 Post-COVID Market Scenario Analysis (V, W, U, L Shaped Recovery)
7.6 Europe Market Breakdown by Vertical
7.6.1 Pre-COVID Makret Scenario Analysis
7.6.2 Post-COVID Market Scenario Analysis (V, W, U, L Shaped Recovery)
7.7 Germany Static Compensator Market Outlook
7.7.1 Pre-COVID Makret Scenario Analysis
7.7.2 Post-COVID Market Scenario Analysis (V, W, U, L Shaped Recovery)
7.8 UK Static Compensator Market Outlook
7.8.1 Pre-COVID Makret Scenario Analysis
7.8.2 Post-COVID Market Scenario Analysis (V, W, U, L Shaped Recovery)
7.9 France Static Compensator Market Outlook
7.9.1 Pre-COVID Makret Scenario Analysis
7.9.2 Post-COVID Market Scenario Analysis (V, W, U, L Shaped Recovery)
7.10 Italy Static Compensator Market Outlook
7.10.1 Pre-COVID Makret Scenario Analysis
7.10.2 Post-COVID Market Scenario Analysis (V, W, U, L Shaped Recovery)
7.11 Spain Static Compensator Market Outlook
7.11.1 Pre-COVID Makret Scenario Analysis
7.11.2 Post-COVID Market Scenario Analysis (V, W, U, L Shaped Recovery)
7.12 Rest of Europe Static Compensator Market Outlook
7.12.1 Pre-COVID Makret Scenario Analysis
7.12.2 Post-COVID Market Scenario Analysis (V, W, U, L Shaped Recovery)
8 Asia-Pacific Static Compensators Market
8.1 Asia-Pacific Market Outlook
8.2 Asia-Pacific Market Size Estimation and Forecast
8.2.1 Pre-COVID Makret Scenario Analysis
8.2.2 Post-COVID Market Scenario Analysis (V, W, U, L Shaped Recovery)
8.3 Asia-Pacific Market Breakdown by Country
8.3.1 Pre-COVID Makret Scenario Analysis
8.3.2 Post-COVID Market Scenario Analysis (V, W, U, L Shaped Recovery)
8.4 Asia-Pacific Market Breakdown by Type
8.4.1 Pre-COVID Makret Scenario Analysis
8.4.2 Post-COVID Market Scenario Analysis (V, W, U, L Shaped Recovery)
8.5 Asia-Pacific Market Breakdown by Component
8.5.1 Pre-COVID Makret Scenario Analysis
8.5.2 Post-COVID Market Scenario Analysis (V, W, U, L Shaped Recovery)
8.6 Asia-Pacific Market Breakdown by Vertical
8.6.1 Pre-COVID Makret Scenario Analysis
8.6.2 Post-COVID Market Scenario Analysis (V, W, U, L Shaped Recovery)
8.7 China Static Compensator Market Outlook
8.7.1 Pre-COVID Makret Scenario Analysis
8.7.2 Post-COVID Market Scenario Analysis (V, W, U, L Shaped Recovery)
8.8 India Static Compensator Market Outlook
8.8.1 Pre-COVID Makret Scenario Analysis
8.8.2 Post-COVID Market Scenario Analysis (V, W, U, L Shaped Recovery)
8.9 Japan Static Compensator Market Outlook
8.9.1 Pre-COVID Makret Scenario Analysis
8.9.2 Post-COVID Market Scenario Analysis (V, W, U, L Shaped Recovery)
8.10 South Korea Static Compensator Market Outlook
8.10.1 Pre-COVID Makret Scenario Analysis
8.10.2 Post-COVID Market Scenario Analysis (V, W, U, L Shaped Recovery)
8.11 Australia Static Compensator Market Outlook
8.11.1 Pre-COVID Makret Scenario Analysis
8.11.2 Post-COVID Market Scenario Analysis (V, W, U, L Shaped Recovery)
8.12 Rest of Asia-Pacific Static Compensator Market Outlook
8.12.1 Pre-COVID Makret Scenario Analysis
8.12.2 Post-COVID Market Scenario Analysis (V, W, U, L Shaped Recovery)
9 LAMEA Static Compensators Market
9.1 LAMEA Market Outlook
9.2 LAMEA Market Size Estimation and Forecast
9.2.1 Pre-COVID Makret Scenario Analysis
9.2.2 Post-COVID Market Scenario Analysis (V, W, U, L Shaped Recovery)
9.3 LAMEA Market Breakdown by Country
9.3.1 Pre-COVID Makret Scenario Analysis
9.3.2 Post-COVID Market Scenario Analysis (V, W, U, L Shaped Recovery)
9.4 LAMEA Market Breakdown by Type
9.4.1 Pre-COVID Makret Scenario Analysis
9.4.2 Post-COVID Market Scenario Analysis (V, W, U, L Shaped Recovery)
9.5 LAMEA Market Breakdown by Component
9.5.1 Pre-COVID Makret Scenario Analysis
9.5.2 Post-COVID Market Scenario Analysis (V, W, U, L Shaped Recovery)
9.6 LAMEA Market Breakdown by Vertical
9.6.1 Pre-COVID Makret Scenario Analysis
9.6.2 Post-COVID Market Scenario Analysis (V, W, U, L Shaped Recovery)
9.7 Brazil Static Compensator Market Outlook
9.7.1 Pre-COVID Makret Scenario Analysis
9.7.2 Post-COVID Market Scenario Analysis (V, W, U, L Shaped Recovery)
9.8 Saudi Arabia Static Compensator Market Outlook
9.8.1 Pre-COVID Makret Scenario Analysis
9.8.2 Post-COVID Market Scenario Analysis (V, W, U, L Shaped Recovery)
9.9 South Africa Static Compensator Market Outlook
9.9.1 Pre-COVID Makret Scenario Analysis
9.9.2 Post-COVID Market Scenario Analysis (V, W, U, L Shaped Recovery)
9.10 Mexico Static Compensator Market Outlook
9.10.1 Pre-COVID Makret Scenario Analysis
9.10.2 Post-COVID Market Scenario Analysis (V, W, U, L Shaped Recovery)
9.11 UAE Static Compensator Market Outlook
9.11.1 Pre-COVID Makret Scenario Analysis
9.11.2 Post-COVID Market Scenario Analysis (V, W, U, L Shaped Recovery)
9.12 Rest of LAMEA Static Compensator Market Outlook
9.12.1 Pre-COVID Makret Scenario Analysis
9.12.2 Post-COVID Market Scenario Analysis (V, W, U, L Shaped Recovery)
10 Leading Company Profiles
10.1 General Electric Company
10.1.1 Company Snapshot
10.1.2 Company Overview
10.1.3 Company Financial Profile
10.1.4 Company Product Benchmarking
10.1.5 Company Recent Developments
10.1.6 Company SWOT Analysis
10.2 Hitachi, Ltd Company
10.2.1 Company Snapshot
10.2.2 Company Overview
10.2.3 Company Financial Profile
10.2.4 Company Product Benchmarking
10.2.5 Company Recent Developments
10.2.6 Company SWOT Analysis
10.3 Mitsubishi Electric Corporation Company
10.3.1 Company Snapshot
10.3.2 Company Overview
10.3.3 Company Financial Profile
10.3.4 Company Product Benchmarking
10.3.5 Company Recent Developments
10.3.6 Company SWOT Analysis
10.4 Infineon Technologies AG Company
10.4.1 Company Snapshot
10.4.2 Company Overview
10.4.3 Company Financial Profile
10.4.4 Company Product Benchmarking
10.4.5 Company Recent Developments
10.4.6 Company SWOT Analysis
10.5 General Dynamics Aerospace and Defense Company
10.5.1 Company Snapshot
10.5.2 Company Overview
10.5.3 Company Financial Profile
10.5.4 Company Product Benchmarking
10.5.5 Company Recent Developments
10.5.6 Company SWOT Analysis
10.6 Eaton Corporation Plc Company
10.6.1 Company Snapshot
10.6.2 Company Overview
10.6.3 Company Financial Profile
10.6.4 Company Product Benchmarking
10.6.5 Company Recent Developments
10.6.6 Company SWOT Analysis
10.7 American Superconductor Corporation Company
10.7.1 Company Snapshot
10.7.2 Company Overview
10.7.3 Company Financial Profile
10.7.4 Company Product Benchmarking
10.7.5 Company Recent Developments
10.7.6 Company SWOT Analysis
10.8 American Electric Power Company, Inc. Company
10.8.1 Company Snapshot
10.8.2 Company Overview
10.8.3 Company Financial Profile
10.8.4 Company Product Benchmarking
10.8.5 Company Recent Developments
10.8.6 Company SWOT Analysis
10.9 Abb Ltd Company
10.9.1 Company Snapshot
10.9.2 Company Overview
10.9.3 Company Financial Profile
10.9.4 Company Product Benchmarking
10.9.5 Company Recent Developments
10.9.6 Company SWOT Analysis
10.10 Siemens AG Company
10.10.1 Company Snapshot
10.10.2 Company Overview
10.10.3 Company Financial Profile
10.10.4 Company Product Benchmarking
10.10.5 Company Recent Developments
10.10.6 Company SWOT Analysis
11 Concluding Remarks from Visiongain
11.1 Recommendation for Future Work
11.1.1 Voltage Reference Tracking
11.1.2 Optimal Power Flow Algorithm for RSVC
11.1.3 Interaction of RSVC with Distribution Network
List of Tables
Table 1. Global Static Compensators Market Forecast, 2021-2031 (USD Mn, AGR (%), CAGR (%))
Table 2. Global Static Compensators Market Snapshot, 2021 & 2031 (US$million, CAGR %)
Table 3. Global Static Compensators Market Forecast, 2021-2031 (USD Mn, AGR (%), CAGR (%))
Table 4. Global Static Compensators Market Forecast, 2021-2031 (USD Mn, AGR (%), CAGR (%)) (V-Shape Recovery)
Table 5. Global Static Compensators Market Forecast, 2021-2031 (USD Mn, AGR (%), CAGR (%)) (W-Shape Recovery)
Table 6. Global Static Compensators Market Forecast, 2021-2031 (USD Mn, AGR (%), CAGR (%)) (U-Shape Recovery)
Table 7. Global Static Compensators Market Forecast, 2021-2031 (USD Mn, AGR (%), CAGR (%)) (L-Shape Recovery)
Table 8. Global Static Compensators Market Forecast by Region, 2021-2031 (USD Mn, AGR (%), CAGR (%))
Table 9.Global Static Compensators Market Forecast by Region, 2021-2031 (USD Mn, AGR (%), CAGR (%)) (V-Shape Recovery)
Table 10. Global Static Compensators Market Forecast by Region, 2021-2031 (USD Mn, AGR (%), CAGR (%)) (W-Shape Recovery)
Table 11. Global Static Compensators Market Forecast by Region, 2021-2031 (USD Mn, AGR (%), CAGR (%)) (U-Shape Recovery)
Table 12. Global Static Compensators Market Forecast by Region, 2021-2031 (USD Mn, AGR (%), CAGR (%)) (L-Shape Recovery)
Table 13. Global Static Compensators Market Forecast by Type, 2021-2031 (USD Mn, AGR (%), CAGR (%))
Table 14. Global Static Compensators Market Forecast by Type, 2021-2031 (USD Mn, AGR (%), CAGR (%)) (V-Shape Recovery)
Table 15. Global Static Compensators Market Forecast by Type, 2021-2031 (USD Mn, AGR (%), CAGR (%)) (W-Shape Recovery)
Table 16. Global Static Compensators Market Forecast by Type, 2021-2031 (USD Mn, AGR (%), CAGR (%)) (U-Shape Recovery)
Table 17. Global Static Compensators Market Forecast by Type, 2021-2031 (USD Mn, AGR (%), CAGR (%)) (L-Shape Recovery)
Table 18. Global Static Compensators Market Forecast by Component, 2021-2031 (USD Mn, AGR (%), CAGR (%))
Table 19. Global Static Compensators Market Forecast by Component, 2021-2031 (USD Mn, AGR (%), CAGR (%)) (V-Shape Recovery)
Table 20. Global Static Compensators Market Forecast by Component, 2021-2031 (USD Mn, AGR (%), CAGR (%)) (W-Shape Recovery)
Table 21. Global Static Compensators Market Forecast by Component, 2021-2031 (USD Mn, AGR (%), CAGR (%)) (U-Shape Recovery)
Table 22. Global Static Compensators Market Forecast by Component, 2021-2031 (USD Mn, AGR (%), CAGR (%)) (L-Shape Recovery)
Table 23. Global Static Compensators Market Forecast by Vertical, 2021-2031 (USD Mn, AGR (%), CAGR (%))
Table 24. Global Static Compensators Market Forecast by Vertical, 2021-2031 (USD Mn, AGR (%), CAGR (%)) (V-Shape Recovery)
Table 25. Global Static Compensators Market Forecast by Vertical, 2021-2031 (USD Mn, AGR (%), CAGR (%)) (W-Shape Recovery)
Table 26. Global Static Compensators Market Forecast by Vertical, 2021-2031 (USD Mn, AGR (%), CAGR (%)) (U-Shape Recovery)
Table 27. Global Static Compensators Market Forecast by Vertical, 2021-2031 (USD Mn, AGR (%), CAGR (%)) (L-Shape Recovery)
Table 28. North America Static Compensators Market Forecast by Value, 2021-2031 (USD Mn, AGR (%), CAGR (%))
Table 29. North America Static Compensators Market Forecast by Value, 2021-2031 (USD Mn, AGR (%), CAGR (%)) (V-Shape Recovery)
Table 30. North America Static Compensators Market Forecast by Value, 2021-2031 (USD Mn, AGR (%), CAGR (%)) (W-Shape Recovery)
Table 31. North America Static Compensators Market Forecast by Value, 2021-2031 (USD Mn, AGR (%), CAGR (%)) (U-Shape Recovery)
Table 32. North America Static Compensators Market Forecast by Value, 2021-2031 (USD Mn, AGR (%), CAGR (%)) (L-Shape Recovery)
Table 33. North America Static Compensators Market Forecast by Type, 2021-2031 (USD Mn, AGR (%), CAGR (%))
Table 34. North America Static Compensators Market Forecast by Type, 2021-2031 (USD Mn, AGR (%), CAGR (%)) (V-Shape Recovery)
Table 35. North America Static Compensators Market Forecast by Type, 2021-2031 (USD Mn, AGR (%), CAGR (%)) (W-Shape Recovery)
Table 36. North America Static Compensators Market Forecast by Type, 2021-2031 (USD Mn, AGR (%), CAGR (%)) (U-Shape Recovery)
Table 37. North America Static Compensators Market Forecast by Type, 2021-2031 (USD Mn, AGR (%), CAGR (%)) (L-Shape Recovery)
Table 38. North America Static Compensators Market Forecast by Component, 2021-2031 (USD Mn, AGR (%), CAGR (%))
Table 39. North America Static Compensators Market Forecast by Component, 2021-2031 (USD Mn, AGR (%), CAGR (%)) (V-Shape Recovery)
Table 40. North America Static Compensators Market Forecast by Component, 2021-2031 (USD Mn, AGR (%), CAGR (%)) (W-Shape Recovery)
Table 41. North America Static Compensators Market Forecast by Component, 2021-2031 (USD Mn, AGR (%), CAGR (%)) (U-Shape Recovery)
Table 42. North America Static Compensators Market Forecast by Component, 2021-2031 (USD Mn, AGR (%), CAGR (%)) (L-Shape Recovery)
Table 43. North America Static Compensators Market Forecast by Vertical, 2021-2031 (USD Mn, AGR (%), CAGR (%))
Table 44. North America Static Compensators Market Forecast by Vertical, 2021-2031 (USD Mn, AGR (%), CAGR (%)) (V-Shape Recovery)
Table 45. North America Static Compensators Market Forecast by Vertical, 2021-2031 (USD Mn, AGR (%), CAGR (%)) (W-Shape Recovery)
Table 46. North America Static Compensators Market Forecast by Vertical, 2021-2031 (USD Mn, AGR (%), CAGR (%)) (U-Shape Recovery)
Table 47. North America Static Compensators Market Forecast by Vertical, 2021-2031 (USD Mn, AGR (%), CAGR (%)) (L-Shape Recovery)
Table 48. US Static Compensators Market Forecast by Country, 2021-2031 (USD Mn, AGR (%), CAGR (%))
Table 49. US Static Compensators Market Forecast by Country, 2021-2031 (USD Mn, AGR (%), CAGR (%)) (V-Shape Recovery)
Table 50. US Static Compensators Market Forecast by Country, 2021-2031 (USD Mn, AGR (%), CAGR (%)) (W-Shape Recovery)
Table 51. US Static Compensators Market Forecast by Country, 2021-2031 (USD Mn, AGR (%), CAGR (%)) (U-Shape Recovery)
Table 52. US Static Compensators Market Forecast by Country, 2021-2031 (USD Mn, AGR (%), CAGR (%)) (L-Shape Recovery)
Table 53. Canada Static Compensators Market Forecast by Country, 2021-2031 (USD Mn, AGR (%), CAGR (%))
Table 54. Canada Static Compensators Market Forecast by Country, 2021-2031 (USD Mn, AGR (%), CAGR (%)) (V-Shape Recovery)
Table 55. Canada Static Compensators Market Forecast by Country, 2021-2031 (USD Mn, AGR (%), CAGR (%)) (W-Shape Recovery)
Table 56. Canada Static Compensators Market Forecast by Country, 2021-2031 (USD Mn, AGR (%), CAGR (%)) (U-Shape Recovery)
Table 57. Canada Static Compensators Market Forecast by Country, 2021-2031 (USD Mn, AGR (%), CAGR (%)) (L-Shape Recovery)
Table 58. Europe Static Compensators Market Forecast by Value, 2021-2031 (USD Mn, AGR (%), CAGR (%))
Table 59. Europe Static Compensators Market Forecast by Value, 2021-2031 (USD Mn, AGR (%), CAGR (%)) (V-Shape Recovery)
Table 60. Europe Static Compensators Market Forecast by Value, 2021-2031 (USD Mn, AGR (%), CAGR (%)) (W-Shape Recovery)
Table 61. Europe Static Compensators Market Forecast by Value, 2021-2031 (USD Mn, AGR (%), CAGR (%)) (U-Shape Recovery)
Table 62. Europe Static Compensators Market Forecast by Value, 2021-2031 (USD Mn, AGR (%), CAGR (%)) (L-Shape Recovery)
Table 63. Europe Static Compensators Market Forecast by Type, 2021-2031 (USD Mn, AGR (%), CAGR (%))
Table 64. Europe Static Compensators Market Forecast by Type, 2021-2031 (USD Mn, AGR (%), CAGR (%)) (V-Shape Recovery)
Table 65. Europe Static Compensators Market Forecast by Type, 2021-2031 (USD Mn, AGR (%), CAGR (%)) (W-Shape Recovery)
Table 66. Europe Static Compensators Market Forecast by Type, 2021-2031 (USD Mn, AGR (%), CAGR (%)) (U-Shape Recovery)
Table 67. Europe Static Compensators Market Forecast by Type, 2021-2031 (USD Mn, AGR (%), CAGR (%)) (L-Shape Recovery)
Table 68. Europe Static Compensators Market Forecast by Component, 2021-2031 (USD Mn, AGR (%), CAGR (%))
Table 69. Europe Static Compensators Market Forecast by Component, 2021-2031 (USD Mn, AGR (%), CAGR (%)) (V-Shape Recovery)
Table 70. Europe Static Compensators Market Forecast by Component, 2021-2031 (USD Mn, AGR (%), CAGR (%)) (W-Shape Recovery)
Table 71. Europe Static Compensators Market Forecast by Component, 2021-2031 (USD Mn, AGR (%), CAGR (%)) (U-Shape Recovery)
Table 72. Europe Static Compensators Market Forecast by Component, 2021-2031 (USD Mn, AGR (%), CAGR (%)) (L-Shape Recovery)
Table 73. Europe Static Compensators Market Forecast by Vertical, 2021-2031 (USD Mn, AGR (%), CAGR (%))
Table 74. Europe Static Compensators Market Forecast by Vertical, 2021-2031 (USD Mn, AGR (%), CAGR (%)) (V-Shape Recovery)
Table 75. Europe Static Compensators Market Forecast by Vertical, 2021-2031 (USD Mn, AGR (%), CAGR (%)) (W-Shape Recovery)
Table 76. Europe Static Compensators Market Forecast by Vertical, 2021-2031 (USD Mn, AGR (%), CAGR (%)) (U-Shape Recovery)
Table 77. Europe Static Compensators Market Forecast by Vertical, 2021-2031 (USD Mn, AGR (%), CAGR (%)) (L-Shape Recovery)
Table 78. Germany Static Compensators Market Forecast by Country, 2021-2031 (USD Mn, AGR (%), CAGR (%))
Table 79. Germany Static Compensators Market Forecast by Country, 2021-2031 (USD Mn, AGR (%), CAGR (%)) (V-Shape Recovery)
Table 80. Germany Static Compensators Market Forecast by Country, 2021-2031 (USD Mn, AGR (%), CAGR (%)) (W-Shape Recovery)
Table 81. Germany Static Compensators Market Forecast by Country, 2021-2031 (USD Mn, AGR (%), CAGR (%)) (U-Shape Recovery)
Table 82. Germany Static Compensators Market Forecast by Country, 2021-2031 (USD Mn, AGR (%), CAGR (%)) (L-Shape Recovery)
Table 83. UK Static Compensators Market Forecast by Country, 2021-2031 (USD Mn, AGR (%), CAGR (%))
Table 84. UK Static Compensators Market Forecast by Country, 2021-2031 (USD Mn, AGR (%), CAGR (%)) (V-Shape Recovery)
Table 85. UK Static Compensators Market Forecast by Country, 2021-2031 (USD Mn, AGR (%), CAGR (%)) (W-Shape Recovery)
Table 86. UK Static Compensators Market Forecast by Country, 2021-2031 (USD Mn, AGR (%), CAGR (%)) (U-Shape Recovery)
Table 87. UK Static Compensators Market Forecast by Country, 2021-2031 (USD Mn, AGR (%), CAGR (%)) (L-Shape Recovery)
Table 88. France Static Compensators Market Forecast by Country, 2021-2031 (USD Mn, AGR (%), CAGR (%))
Table 89. France Static Compensators Market Forecast by Country, 2021-2031 (USD Mn, AGR (%), CAGR (%)) (V-Shape Recovery)
Table 90. France Static Compensators Market Forecast by Country, 2021-2031 (USD Mn, AGR (%), CAGR (%)) (W-Shape Recovery)
Table 91. France Static Compensators Market Forecast by Country, 2021-2031 (USD Mn, AGR (%), CAGR (%)) (U-Shape Recovery)
Table 92. France Static Compensators Market Forecast by Country, 2021-2031 (USD Mn, AGR (%), CAGR (%)) (L-Shape Recovery)
Table 93. Italy Static Compensators Market Forecast by Country, 2021-2031 (USD Mn, AGR (%), CAGR (%))
Table 94. Italy Static Compensators Market Forecast by Country, 2021-2031 (USD Mn, AGR (%), CAGR (%)) (V-Shape Recovery)
Table 95. Italy Static Compensators Market Forecast by Country, 2021-2031 (USD Mn, AGR (%), CAGR (%)) (W-Shape Recovery)
Table 96. Italy Static Compensators Market Forecast by Country, 2021-2031 (USD Mn, AGR (%), CAGR (%)) (U-Shape Recovery)
Table 97. Italy Static Compensators Market Forecast by Country, 2021-2031 (USD Mn, AGR (%), CAGR (%)) (L-Shape Recovery)
Table 98. Spain Static Compensators Market Forecast by Country, 2021-2031 (USD Mn, AGR (%), CAGR (%))
Table 99. Spain Static Compensators Market Forecast by Country, 2021-2031 (USD Mn, AGR (%), CAGR (%)) (V-Shape Recovery)
Table 100. Spain Static Compensators Market Forecast by Country, 2021-2031 (USD Mn, AGR (%), CAGR (%)) (W-Shape Recovery)
Table 101. Spain Static Compensators Market Forecast by Country, 2021-2031 (USD Mn, AGR (%), CAGR (%)) (U-Shape Recovery)
Table 102. Spain Static Compensators Market Forecast by Country, 2021-2031 (USD Mn, AGR (%), CAGR (%)) (L-Shape Recovery)
Table 103. Rest of Europe Static Compensators Market Forecast by Country, 2021-2031 (USD Mn, AGR (%), CAGR (%))
Table 104. Rest of Europe Static Compensators Market Forecast by Country, 2021-2031 (USD Mn, AGR (%), CAGR (%)) (V-Shape Recovery)
Table 105. Rest of Europe Static Compensators Market Forecast by Country, 2021-2031 (USD Mn, AGR (%), CAGR (%)) (W-Shape Recovery)
Table 106. Rest of Europe Static Compensators Market Forecast by Country, 2021-2031 (USD Mn, AGR (%), CAGR (%)) (U-Shape Recovery)
Table 107. Rest of Europe Static Compensators Market Forecast by Country, 2021-2031 (USD Mn, AGR (%), CAGR (%)) (L-Shape Recovery)
Table 108. Asia-Pacific Static Compensators Market Forecast by Value, 2021-2031 (USD Mn, AGR (%), CAGR (%))
Table 109. Asia-Pacific Static Compensators Market Forecast by Value, 2021-2031 (USD Mn, AGR (%), CAGR (%)) (V-Shape Recovery)
Table 110. Asia-Pacific Static Compensators Market Forecast by Value, 2021-2031 (USD Mn, AGR (%), CAGR (%)) (W-Shape Recovery)
Table 111. Asia-Pacific Static Compensators Market Forecast by Value, 2021-2031 (USD Mn, AGR (%), CAGR (%)) (U-Shape Recovery)
Table 112. Asia-Pacific Static Compensators Market Forecast by Value, 2021-2031 (USD Mn, AGR (%), CAGR (%)) (L-Shape Recovery)
Table 113. Asia-Pacific Static Compensators Market Forecast by Type, 2021-2031 (USD Mn, AGR (%), CAGR (%))
Table 114. Asia-Pacific Static Compensators Market Forecast by Type, 2021-2031 (USD Mn, AGR (%), CAGR (%)) (V-Shape Recovery)
Table 115. Asia-Pacific Static Compensators Market Forecast by Type, 2021-2031 (USD Mn, AGR (%), CAGR (%)) (W-Shape Recovery)
Table 116. Asia-Pacific Static Compensators Market Forecast by Type, 2021-2031 (USD Mn, AGR (%), CAGR (%)) (U-Shape Recovery)
Table 117. Asia-Pacific Static Compensators Market Forecast by Type, 2021-2031 (USD Mn, AGR (%), CAGR (%)) (L-Shape Recovery)
Table 118. Asia-Pacific Static Compensators Market Forecast by Component, 2021-2031 (USD Mn, AGR (%), CAGR (%))
Table 119. Asia-Pacific Static Compensators Market Forecast by Component, 2021-2031 (USD Mn, AGR (%), CAGR (%)) (V-Shape Recovery)
Table 120. Asia-Pacific Static Compensators Market Forecast by Component, 2021-2031 (USD Mn, AGR (%), CAGR (%)) (W-Shape Recovery)
Table 121. Asia-Pacific Static Compensators Market Forecast by Component, 2021-2031 (USD Mn, AGR (%), CAGR (%)) (U-Shape Recovery)
Table 122. Asia-Pacific Static Compensators Market Forecast by Component, 2021-2031 (USD Mn, AGR (%), CAGR (%)) (L-Shape Recovery)
Table 123. Asia-Pacific Static Compensators Market Forecast by Vertical, 2021-2031 (USD Mn, AGR (%), CAGR (%))
Table 124. Asia-Pacific Static Compensators Market Forecast by Vertical, 2021-2031 (USD Mn, AGR (%), CAGR (%)) (V-Shape Recovery)
Table 125. Asia-Pacific Static Compensators Market Forecast by Vertical, 2021-2031 (USD Mn, AGR (%), CAGR (%)) (W-Shape Recovery)
Table 126. Asia-Pacific Static Compensators Market Forecast by Vertical, 2021-2031 (USD Mn, AGR (%), CAGR (%)) (U-Shape Recovery)
Table 127. Asia-Pacific Static Compensators Market Forecast by Vertical, 2021-2031 (USD Mn, AGR (%), CAGR (%)) (L-Shape Recovery)
Table 128. China Static Compensators Market Forecast by Country, 2021-2031 (USD Mn, AGR (%), CAGR (%))
Table 129. China Static Compensators Market Forecast by Country, 2021-2031 (USD Mn, AGR (%), CAGR (%)) (V-Shape Recovery)
Table 130. China Static Compensators Market Forecast by Country, 2021-2031 (USD Mn, AGR (%), CAGR (%)) (W-Shape Recovery)
Table 131. China Static Compensators Market Forecast by Country, 2021-2031 (USD Mn, AGR (%), CAGR (%)) (U-Shape Recovery)
Table 132. China Static Compensators Market Forecast by Country, 2021-2031 (USD Mn, AGR (%), CAGR (%)) (L-Shape Recovery)
Table 133. India Static Compensators Market Forecast by Country, 2021-2031 (USD Mn, AGR (%), CAGR (%))
Table 134. India Static Compensators Market Forecast by Country, 2021-2031 (USD Mn, AGR (%), CAGR (%)) (V-Shape Recovery)
Table 135. India Static Compensators Market Forecast by Country, 2021-2031 (USD Mn, AGR (%), CAGR (%)) (W-Shape Recovery)
Table 136. India Static Compensators Market Forecast by Country, 2021-2031 (USD Mn, AGR (%), CAGR (%)) (U-Shape Recovery)
Table 137. India Static Compensators Market Forecast by Country, 2021-2031 (USD Mn, AGR (%), CAGR (%)) (L-Shape Recovery)
Table 138. Japan Static Compensators Market Forecast by Country, 2021-2031 (USD Mn, AGR (%), CAGR (%))
Table 139. Japan Static Compensators Market Forecast by Country, 2021-2031 (USD Mn, AGR (%), CAGR (%)) (V-Shape Recovery)
Table 140. Japan Static Compensators Market Forecast by Country, 2021-2031 (USD Mn, AGR (%), CAGR (%)) (W-Shape Recovery)
Table 141. Japan Static Compensators Market Forecast by Country, 2021-2031 (USD Mn, AGR (%), CAGR (%)) (U-Shape Recovery)
Table 142. Japan Static Compensators Market Forecast by Country, 2021-2031 (USD Mn, AGR (%), CAGR (%)) (L-Shape Recovery)
Table 143. South Korea Static Compensators Market Forecast by Country, 2021-2031 (USD Mn, AGR (%), CAGR (%))
Table 144. South Korea Static Compensators Market Forecast by Country, 2021-2031 (USD Mn, AGR (%), CAGR (%)) (V-Shape Recovery)
Table 145. South Korea Static Compensators Market Forecast by Country, 2021-2031 (USD Mn, AGR (%), CAGR (%)) (W-Shape Recovery)
Table 146. South Korea Static Compensators Market Forecast by Country, 2021-2031 (USD Mn, AGR (%), CAGR (%)) (U-Shape Recovery)
Table 147. South Korea Static Compensators Market Forecast by Country, 2021-2031 (USD Mn, AGR (%), CAGR (%)) (L-Shape Recovery)
Table 148. Australia Static Compensators Market Forecast by Country, 2021-2031 (USD Mn, AGR (%), CAGR (%))
Table 149. Australia Static Compensators Market Forecast by Country, 2021-2031 (USD Mn, AGR (%), CAGR (%)) (V-Shape Recovery)
Table 150. Australia Static Compensators Market Forecast by Country, 2021-2031 (USD Mn, AGR (%), CAGR (%)) (W-Shape Recovery)
Table 151. Australia Static Compensators Market Forecast by Country, 2021-2031 (USD Mn, AGR (%), CAGR (%)) (U-Shape Recovery)
Table 152. Australia Static Compensators Market Forecast by Country, 2021-2031 (USD Mn, AGR (%), CAGR (%)) (L-Shape Recovery)
Table 153. Rest of Asia-Pacific Static Compensators Market Forecast by Country, 2021-2031 (USD Mn, AGR (%), CAGR (%))
Table 154. Rest of Asia-Pacific Static Compensators Market Forecast by Country, 2021-2031 (USD Mn, AGR (%), CAGR (%)) (V-Shape Recovery)
Table 155. Rest of Asia-Pacific Static Compensators Market Forecast by Country, 2021-2031 (USD Mn, AGR (%), CAGR (%)) (W-Shape Recovery)
Table 156. Rest of Asia-Pacific Static Compensators Market Forecast by Country, 2021-2031 (USD Mn, AGR (%), CAGR (%)) (U-Shape Recovery)
Table 157. Rest of Asia-Pacific Static Compensators Market Forecast by Country, 2021-2031 (USD Mn, AGR (%), CAGR (%)) (L-Shape Recovery)
Table 158. LAMEA Static Compensators Market Forecast by Value, 2021-2031 (USD Mn, AGR (%), CAGR (%))
Table 159. LAMEA Static Compensators Market Forecast by Value, 2021-2031 (USD Mn, AGR (%), CAGR (%)) (V-Shape Recovery)
Table 160. LAMEA Static Compensators Market Forecast by Value, 2021-2031 (USD Mn, AGR (%), CAGR (%)) (W-Shape Recovery)
Table 161. LAMEA Static Compensators Market Forecast by Value, 2021-2031 (USD Mn, AGR (%), CAGR (%)) (U-Shape Recovery)
Table 162. LAMEA Static Compensators Market Forecast by Value, 2021-2031 (USD Mn, AGR (%), CAGR (%)) (L-Shape Recovery)
Table 163. LAMEA Static Compensators Market Forecast by Type, 2021-2031 (USD Mn, AGR (%), CAGR (%))
Table 164. LAMEA Static Compensators Market Forecast by Type, 2021-2031 (USD Mn, AGR (%), CAGR (%)) (V-Shape Recovery)
Table 165. LAMEA Static Compensators Market Forecast by Type, 2021-2031 (USD Mn, AGR (%), CAGR (%)) (W-Shape Recovery)
Table 166. LAMEA Static Compensators Market Forecast by Type, 2021-2031 (USD Mn, AGR (%), CAGR (%)) (U-Shape Recovery)
Table 167. LAMEA Static Compensators Market Forecast by Type, 2021-2031 (USD Mn, AGR (%), CAGR (%)) (L-Shape Recovery)
Table 168. LAMEA Static Compensators Market Forecast by Component, 2021-2031 (USD Mn, AGR (%), CAGR (%))
Table 169. LAMEA Static Compensators Market Forecast by Component, 2021-2031 (USD Mn, AGR (%), CAGR (%)) (V-Shape Recovery)
Table 170. LAMEA Static Compensators Market Forecast by Component, 2021-2031 (USD Mn, AGR (%), CAGR (%)) (W-Shape Recovery)
Table 171. LAMEA Static Compensators Market Forecast by Component, 2021-2031 (USD Mn, AGR (%), CAGR (%)) (U-Shape Recovery)
Table 172. LAMEA Static Compensators Market Forecast by Component, 2021-2031 (USD Mn, AGR (%), CAGR (%)) (L-Shape Recovery)
Table 173. LAMEA Static Compensators Market Forecast by Vertical, 2021-2031 (USD Mn, AGR (%), CAGR (%))
Table 174. LAMEA Static Compensators Market Forecast by Vertical, 2021-2031 (USD Mn, AGR (%), CAGR (%)) (V-Shape Recovery)
Table 175. LAMEA Static Compensators Market Forecast by Vertical, 2021-2031 (USD Mn, AGR (%), CAGR (%)) (W-Shape Recovery)
Table 176. LAMEA Static Compensators Market Forecast by Vertical, 2021-2031 (USD Mn, AGR (%), CAGR (%)) (U-Shape Recovery)
Table 177. LAMEA Static Compensators Market Forecast by Vertical, 2021-2031 (USD Mn, AGR (%), CAGR (%)) (L-Shape Recovery)
Table 178. Brazil Static Compensators Market Forecast by Country, 2021-2031 (USD Mn, AGR (%), CAGR (%))
Table 179. Brazil Static Compensators Market Forecast by Country, 2021-2031 (USD Mn, AGR (%), CAGR (%)) (V-Shape Recovery)
Table 180. Brazil Static Compensators Market Forecast by Country, 2021-2031 (USD Mn, AGR (%), CAGR (%)) (W-Shape Recovery)
Table 181. Brazil Static Compensators Market Forecast by Country, 2021-2031 (USD Mn, AGR (%), CAGR (%)) (U-Shape Recovery)
Table 182. Brazil Static Compensators Market Forecast by Country, 2021-2031 (USD Mn, AGR (%), CAGR (%)) (L-Shape Recovery)
Table 183. Saudi Arabia Static Compensators Market Forecast by Country, 2021-2031 (USD Mn, AGR (%), CAGR (%))
Table 184. Saudi Arabia Static Compensators Market Forecast by Country, 2021-2031 (USD Mn, AGR (%), CAGR (%)) (V-Shape Recovery)
Table 185. Saudi Arabia Static Compensators Market Forecast by Country, 2021-2031 (USD Mn, AGR (%), CAGR (%)) (W-Shape Recovery)
Table 186. Saudi Arabia Static Compensators Market Forecast by Country, 2021-2031 (USD Mn, AGR (%), CAGR (%)) (U-Shape Recovery)
Table 187. Saudi Arabia Static Compensators Market Forecast by Country, 2021-2031 (USD Mn, AGR (%), CAGR (%)) (L-Shape Recovery)
Table 188. South Africa Static Compensators Market Forecast by Country, 2021-2031 (USD Mn, AGR (%), CAGR (%))
Table 189. South Africa Static Compensators Market Forecast by Country, 2021-2031 (USD Mn, AGR (%), CAGR (%)) (V-Shape Recovery)
Table 190. South Africa Static Compensators Market Forecast by Country, 2021-2031 (USD Mn, AGR (%), CAGR (%)) (W-Shape Recovery)
Table 191. South Africa Static Compensators Market Forecast by Country, 2021-2031 (USD Mn, AGR (%), CAGR (%)) (U-Shape Recovery)
Table 192. South Africa Static Compensators Market Forecast by Country, 2021-2031 (USD Mn, AGR (%), CAGR (%)) (L-Shape Recovery)
Table 193. Mexico Static Compensators Market Forecast by Country, 2021-2031 (USD Mn, AGR (%), CAGR (%))
Table 194. Mexico Static Compensators Market Forecast by Country, 2021-2031 (USD Mn, AGR (%), CAGR (%)) (V-Shape Recovery)
Table 195. Mexico Static Compensators Market Forecast by Country, 2021-2031 (USD Mn, AGR (%), CAGR (%)) (W-Shape Recovery)
Table 196. Mexico Static Compensators Market Forecast by Country, 2021-2031 (USD Mn, AGR (%), CAGR (%)) (U-Shape Recovery)
Table 197. Mexico Static Compensators Market Forecast by Country, 2021-2031 (USD Mn, AGR (%), CAGR (%)) (L-Shape Recovery)
Table 198. UAE Static Compensators Market Forecast by Country, 2021-2031 (USD Mn, AGR (%), CAGR (%))
Table 199. UAE Static Compensators Market Forecast by Country, 2021-2031 (USD Mn, AGR (%), CAGR (%)) (V-Shape Recovery)
Table 200. UAE Static Compensators Market Forecast by Country, 2021-2031 (USD Mn, AGR (%), CAGR (%)) (W-Shape Recovery)
Table 201. UAE Static Compensators Market Forecast by Country, 2021-2031 (USD Mn, AGR (%), CAGR (%)) (U-Shape Recovery)
Table 202. UAE Static Compensators Market Forecast by Country, 2021-2031 (USD Mn, AGR (%), CAGR (%)) (L-Shape Recovery)
Table 203. Rest of LAMEA Static Compensators Market Forecast by Country, 2021-2031 (USD Mn, AGR (%), CAGR (%))
Table 204. Rest of LAMEA Static Compensators Market Forecast by Country, 2021-2031 (USD Mn, AGR (%), CAGR (%)) (V-Shape Recovery)
Table 205. Rest of LAMEA Static Compensators Market Forecast by Country, 2021-2031 (USD Mn, AGR (%), CAGR (%)) (W-Shape Recovery)
Table 206. Rest of LAMEA Static Compensators Market Forecast by Country, 2021-2031 (USD Mn, AGR (%), CAGR (%)) (U-Shape Recovery)
Table 207. Rest of LAMEA Static Compensators Market Forecast by Country, 2021-2031 (USD Mn, AGR (%), CAGR (%)) (L-Shape Recovery)
Table 208. General Electric: Company Information
Table 209. General Electric: Company Revenue 2015-2019 (USMn, AGR %)
Table 210. General Electric: Company Product and Service Benchmarking
Table 211. General Electric: Company Recent Developments till Jan,2021
Table 212. SWOT Analysis
Table 213. Hitachi, Ltd.: Company Information
Table 214. Hitachi, Ltd.: Company Revenue 2015-2019 (USMn, AGR %)
Table 215. Hitachi, Ltd.: Company Product and Service Benchmarking
Table 216. Hitachi, Ltd.: Company Recent Developments till Jan,2021
Table 217. SWOT Analysis
Table 218. Mitsubishi Electric Corporation: Company Information
Table 219. Mitsubishi Electric Corporation: Company Revenue 2015-2019 (USMn, AGR %)
Table 220. Mitsubishi Electric Corporation: Company Product and Service Benchmarking
Table 221. Mitsubishi Electric Corporation: Company Recent Developments till Jan,2021
Table 222. SWOT Analysis
Table 223. Infineon Technologies AG: Company Information
Table 224. Infineon Technologies AG: Company Revenue 2015-2019 (USMn, AGR %)
Table 225. Infineon Technologies AG: Company Product and Service Benchmarking
Table 226. Infineon Technologies AG: Company Recent Developments till Jan,2021
Table227. SWOT Analysis
Table 228. General Dynamics Corporation: Company Information
Table 229. General Dynamics Corporation: Company Revenue 2015-2019 (USMn, AGR %)
Table 230. General Dynamics Corporation: Company Product and Service Benchmarking
Table 231. General Dynamics Corporation: Company Recent Developments till Jan,2021
Table 232. SWOT Analysis
Table 233. Eaton Corporation Plc: Company Information
Table 234. Eaton Corporation Plc: Company Revenue 2015-2019 (USMn, AGR %)
Table 235. Eaton Corporation Plc: Company Product and Service Benchmarking
Table 236. Eaton Corporation Plc: Company Recent Developments till Jan,2021
Table 237. SWOT Analysis
Table 238. American Superconductor Corporation: Company Information
Table 239. American Superconductor Corporation: Company Revenue 2015-2019 (USMn, AGR %)
Table 240. American Superconductor Corporation: Company Product and Service Benchmarking
Table 241. American Superconductor Corporation: Company Recent Developments till Jan,2021
Table 242. SWOT Analysis
Table 243. American Electric Power Company, Inc.: Company Information
Table 244. American Electric Power Company, Inc.: Company Revenue 2015-2019 (USMn, AGR %)
Table 245. American Electric Power Company, Inc.: Company Product and Service Benchmarking
Table 246. American Electric Power Company, Inc.: Company Recent Developments till Jan,2021
Table 247. SWOT Analysis
Table 248. Abb Ltd: Company Information
Table 249. Abb Ltd: Company Revenue 2015-2019 (USMn, AGR %)
Table 250. Abb Ltd: Company Product and Service Benchmarking
Table 251. Abb Ltd: Company Recent Developments till Jan,2021
Table 252. SWOT Analysis
Table 253. Siemens AG: Company Information
Table 254. Siemens AG: Company Revenue 2015-2019 (USMn, AGR %)
Table 255. Siemens AG: Company Product and Service Benchmarking
Table 256. Siemens AG: Company Recent Developments till Jan,2021
Table 257.SWOT Analysis
List of Figures
Figure 1. Global Static Compensators Market Forecast, 2021-2031 (USD Mn, AGR (%))
Figure 2. Global Static Compensators Market Segmentation
Figure 3. Global Static Compensators Market Forecast, 2021-2031 (USD Mn, AGR (%))
Figure 4. Global Static Compensators Market Forecast, 2021-2031 (USD Mn, AGR (%)) (V-Shape Recovery)
Figure 5. Global Static Compensators Market Forecast, 2021-2031 (USD Mn, AGR (%)) (W-Shape Recovery)
Figure 6. Global Static Compensators Market Forecast, 2021-2031 (USD Mn, AGR (%)) (U-Shape Recovery)
Figure 7. Global Static Compensators Market Forecast, 2021-2031 (USD Mn, AGR (%)) (L-Shape Recovery)
Figure 8. Global Static Compensators Market Forecast by Region, 2021-2031 (USD Mn, AGR (%))
Figure 9. Global Static Compensators Market Forecast by Region, 2021-2031 (USD Mn, AGR (%)) (V-Shape Recovery)
Figure 10. Global Static Compensators Market Forecast by Region, 2021-2031 (USD Mn, AGR (%)) (W-Shape Recovery)
Figure 11. Global Static Compensators Market Forecast by Region, 2021-2031 (USD Mn, AGR (%)) (U-Shape Recovery)
Figure 12. Global Static Compensators Market Forecast by Region, 2021-2031 (USD Mn, AGR (%)) (L-Shape Recovery)
Figure 13. Advanced Thyristor Valve
Figure 14. Advanced Digital Control Paltform for SVC Systems
Figure 15. Global Static Compensators Market Forecast by Type, 2021-2031 (USD Mn, AGR (%))
Figure 16. Global Static Compensators Market Forecast by Type, 2021-2031 (USD Mn, AGR (%)) (V-Shape Recovery)
Figure 17. Global Static Compensators Market Forecast by Type, 2021-2031 (USD Mn, AGR (%)) (W-Shape Recovery)
Figure 18. Global Static Compensators Market Forecast by Type, 2021-2031 (USD Mn, AGR (%)) (U-Shape Recovery)
Figure 19. Global Static Compensators Market Forecast by Type, 2021-2031 (USD Mn, AGR (%)) (L-Shape Recovery)
Figure 20. Global Static Compensators Market Forecast by Component, 2021-2031 (USD Mn, AGR (%))
Figure 21. Global Static Compensators Market Forecast by Component, 2021-2031 (USD Mn, AGR (%)) (V-Shape Recovery)
Figure 22. Global Static Compensators Market Forecast by Component, 2021-2031 (USD Mn, AGR (%)) (W-Shape Recovery)
Figure 23. Global Static Compensators Market Forecast by Component, 2021-2031 (USD Mn, AGR (%)) (U-Shape Recovery)
Figure 24. Global Static Compensators Market Forecast by Component, 2021-2031 (USD Mn, AGR (%)) (L-Shape Recovery)
Figure 25. Global Static Compensators Market Forecast by Vertical, 2021-2031 (USD Mn, AGR (%))
Figure 26. Global Static Compensators Market Forecast by Vertical, 2021-2031 (USD Mn, AGR (%)) (V-Shape Recovery)
Figure 27. Global Static Compensators Market Forecast by Vertical, 2021-2031 (USD Mn, AGR (%)) (W-Shape Recovery)
Figure 28. Global Static Compensators Market Forecast by Vertical, 2021-2031 (USD Mn, AGR (%)) (U-Shape Recovery)
Figure 29. Global Static Compensators Market Forecast by Vertical, 2021-2031 (USD Mn, AGR (%)) (L-Shape Recovery)
Figure 30. North America Static Compensators Market Forecast by Value, 2021-2031 (USD Mn, AGR (%))
Figure 31. North America Static Compensators Market Forecast by Value, 2021-2031 (USD Mn, AGR (%)) (V-Shape Recovery)
Figure 32. North America Static Compensators Market Forecast by Value, 2021-2031 (USD Mn, AGR (%)) (W-Shape Recovery)
Figure 33. North America Static Compensators Market Forecast by Value, 2021-2031 (USD Mn, AGR (%)) (U-Shape Recovery)
Figure 34. North America Static Compensators Market Forecast by Value, 2021-2031 (USD Mn, AGR (%)) (L-Shape Recovery)
Figure 35. North America Static Compensators Market Forecast by Country, 2021-2031 (USD Mn, AGR (%))
Figure 36. North America Static Compensators Market Forecast by Country, 2021-2031 (USD Mn, AGR (%)) (V-Shape Recovery)
Figure 37. North America Static Compensators Market Forecast by Country, 2021-2031 (USD Mn, AGR (%)) (W-Shape Recovery)
Figure 38. North America Static Compensators Market Forecast by Country, 2021-2031 (USD Mn, AGR (%)) (U-Shape Recovery)
Figure 39. North America Static Compensators Market Forecast by Country, 2021-2031 (USD Mn, AGR (%)) (L-Shape Recovery)
Figure 40. North America Static Compensators Market Forecast by Type, 2021-2031 (USD Mn, AGR (%))
Figure 41. North America Static Compensators Market Forecast by Type, 2021-2031 (USD Mn, AGR (%)) (V-Shape Recovery)
Figure 42. North America Static Compensators Market Forecast by Type, 2021-2031 (USD Mn, AGR (%)) (W-Shape Recovery)
Figure 43. North America Static Compensators Market Forecast by Type, 2021-2031 (USD Mn, AGR (%)) (U-Shape Recovery)
Figure 44. North America Static Compensators Market Forecast by Type, 2021-2031 (USD Mn, AGR (%)) (L-Shape Recovery)
Figure 45. North America Static Compensators Market Forecast by Component, 2021-2031 (USD Mn, AGR (%))
Figure 46. North America Static Compensators Market Forecast by Component, 2021-2031 (USD Mn, AGR (%)) (V-Shape Recovery)
Figure 47. North America Static Compensators Market Forecast by Component, 2021-2031 (USD Mn, AGR (%)) (W-Shape Recovery)
Figure 48. North America Static Compensators Market Forecast by Component, 2021-2031 (USD Mn, AGR (%)) (U-Shape Recovery)
Figure 49. North America Static Compensators Market Forecast by Component, 2021-2031 (USD Mn, AGR (%)) (L-Shape Recovery)
Figure 50. North America Static Compensators Market Forecast by Vertical, 2021-2031 (USD Mn, AGR (%))
Figure 51. North America Static Compensators Market Forecast by Vertical, 2021-2031 (USD Mn, AGR (%)) (V-Shape Recovery)
Figure 52. North America Static Compensators Market Forecast by Vertical, 2021-2031 (USD Mn, AGR (%)) (W-Shape Recovery)
Figure 53. North America Static Compensators Market Forecast by Vertical, 2021-2031 (USD Mn, AGR (%)) (U-Shape Recovery)
Figure 54. North America Static Compensators Market Forecast by Vertical, 2021-2031 (USD Mn, AGR (%)) (L-Shape Recovery)
Figure 55. Europe Static Compensators Market Forecast by Value, 2021-2031 (USD Mn, AGR (%))
Figure 56. Europe Static Compensators Market Forecast by Value, 2021-2031 (USD Mn, AGR (%)) (V-Shape Recovery)
Figure 57. Europe Static Compensators Market Forecast by Value, 2021-2031 (USD Mn, AGR (%)) (W-Shape Recovery)
Figure 58. Europe Static Compensators Market Forecast by Value, 2021-2031 (USD Mn, AGR (%)) (U-Shape Recovery)
Figure 59. Europe Static Compensators Market Forecast by Value, 2021-2031 (USD Mn, AGR (%)) (L-Shape Recovery)
Figure 60. Europe Static Compensators Market Forecast by Country, 2021-2031 (USD Mn, AGR (%))
Figure 61. Europe Static Compensators Market Forecast by Country, 2021-2031 (USD Mn, AGR (%)) (V-Shape Recovery)
Figure 62. Europe Static Compensators Market Forecast by Country, 2021-2031 (USD Mn, AGR (%)) (W-Shape Recovery)
Figure 63. Europe Static Compensators Market Forecast by Country, 2021-2031 (USD Mn, AGR (%)) (U-Shape Recovery)
Figure 64. Europe Static Compensators Market Forecast by Country, 2021-2031 (USD Mn, AGR (%)) (L-Shape Recovery)
Figure 65. Europe Static Compensators Market Forecast by Type, 2021-2031 (USD Mn, AGR (%))
Figure 66. Europe Static Compensators Market Forecast by Type, 2021-2031 (USD Mn, AGR (%)) (V-Shape Recovery)
Figure 67. Europe Static Compensators Market Forecast by Type, 2021-2031 (USD Mn, AGR (%)) (W-Shape Recovery)
Figure 68. Europe Static Compensators Market Forecast by Type, 2021-2031 (USD Mn, AGR (%)) (U-Shape Recovery)
Figure 69. Europe Static Compensators Market Forecast by Type, 2021-2031 (USD Mn, AGR (%)) (L-Shape Recovery)
Figure 70. Europe Static Compensators Market Forecast by Component, 2021-2031 (USD Mn, AGR (%))
Figure 71. Europe Static Compensators Market Forecast by Component, 2021-2031 (USD Mn, AGR (%)) (V-Shape Recovery)
Figure 72. Europe Static Compensators Market Forecast by Component, 2021-2031 (USD Mn, AGR (%)) (W-Shape Recovery)
Figure 73. Europe Static Compensators Market Forecast by Component, 2021-2031 (USD Mn, AGR (%)) (U-Shape Recovery)
Figure 74. Europe Static Compensators Market Forecast by Component, 2021-2031 (USD Mn, AGR (%)) (L-Shape Recovery)
Figure 75. Europe Static Compensators Market Forecast by Vertical, 2021-2031 (USD Mn, AGR (%))
Figure 76. Europe Static Compensators Market Forecast by Vertical, 2021-2031 (USD Mn, AGR (%)) (V-Shape Recovery)
Figure 77. Europe Static Compensators Market Forecast by Vertical, 2021-2031 (USD Mn, AGR (%)) (W-Shape Recovery)
Figure 78. Europe Static Compensators Market Forecast by Vertical, 2021-2031 (USD Mn, AGR (%)) (U-Shape Recovery)
Figure 79. Europe Static Compensators Market Forecast by Vertical, 2021-2031 (USD Mn, AGR (%)) (L-Shape Recovery)
Figure 80. Asia-Pacific Static Compensators Market Forecast by Value, 2021-2031 (USD Mn, AGR (%))
Figure 81. Asia-Pacific Static Compensators Market Forecast by Value, 2021-2031 (USD Mn, AGR (%)) (V-Shape Recovery)
Figure 82. Asia-Pacific Static Compensators Market Forecast by Value, 2021-2031 (USD Mn, AGR (%)) (W-Shape Recovery)
Figure 83. Asia-Pacific Static Compensators Market Forecast by Value, 2021-2031 (USD Mn, AGR (%)) (U-Shape Recovery)
Figure 84. Asia-Pacific Static Compensators Market Forecast by Value, 2021-2031 (USD Mn, AGR (%)) (L-Shape Recovery)
Figure 85. Asia-Pacific Static Compensators Market Forecast by Country, 2021-2031 (USD Mn, AGR (%))
Figure 86. Asia-Pacific Static Compensators Market Forecast by Country, 2021-2031 (USD Mn, AGR (%)) (V-Shape Recovery)
Figure 87. Asia-Pacific Static Compensators Market Forecast by Country, 2021-2031 (USD Mn, AGR (%)) (W-Shape Recovery)
Figure 88. Asia-Pacific Static Compensators Market Forecast by Country, 2021-2031 (USD Mn, AGR (%)) (U-Shape Recovery)
Figure 89. Asia-Pacific Static Compensators Market Forecast by Country, 2021-2031 (USD Mn, AGR (%)) (L-Shape Recovery)
Figure 90. Asia-Pacific Static Compensators Market Forecast by Type, 2021-2031 (USD Mn, AGR (%))
Figure 91. Asia-Pacific Static Compensators Market Forecast by Type, 2021-2031 (USD Mn, AGR (%)) (V-Shape Recovery)
Figure 92. Asia-Pacific Static Compensators Market Forecast by Type, 2021-2031 (USD Mn, AGR (%)) (W-Shape Recovery)
Figure 93. Asia-Pacific Static Compensators Market Forecast by Type, 2021-2031 (USD Mn, AGR (%)) (U-Shape Recovery)
Figure 94. Asia-Pacific Static Compensators Market Forecast by Type, 2021-2031 (USD Mn, AGR (%)) (L-Shape Recovery)
Figure 95. Asia-Pacific Static Compensators Market Forecast by Component, 2021-2031 (USD Mn, AGR (%))
Figure 96. Asia-Pacific Static Compensators Market Forecast by Component, 2021-2031 (USD Mn, AGR (%)) (V-Shape Recovery)
Figure 97. Asia-Pacific Static Compensators Market Forecast by Component, 2021-2031 (USD Mn, AGR (%)) (W-Shape Recovery)
Figure 98. Asia-Pacific Static Compensators Market Forecast by Component, 2021-2031 (USD Mn, AGR (%)) (U-Shape Recovery)
Figure 99. Asia-Pacific Static Compensators Market Forecast by Component, 2021-2031 (USD Mn, AGR (%)) (L-Shape Recovery)
Figure 100. Asia-Pacific Static Compensators Market Forecast by Vertical, 2021-2031 (USD Mn, AGR (%))
Figure 101. Asia-Pacific Static Compensators Market Forecast by Vertical, 2021-2031 (USD Mn, AGR (%)) (V-Shape Recovery)
Figure 102. Asia-Pacific Static Compensators Market Forecast by Vertical, 2021-2031 (USD Mn, AGR (%)) (W-Shape Recovery)
Figure 103. Asia-Pacific Static Compensators Market Forecast by Vertical, 2021-2031 (USD Mn, AGR (%)) (U-Shape Recovery)
Figure 104. Asia-Pacific Static Compensators Market Forecast by Vertical, 2021-2031 (USD Mn, AGR (%)) (L-Shape Recovery)
Figure 105. LAMEA Static Compensators Market Forecast by Value, 2021-2031 (USD Mn, AGR (%))
Figure 106. LAMEA Static Compensators Market Forecast by Value, 2021-2031 (USD Mn, AGR (%)) (V-Shape Recovery)
Figure 107. LAMEA Static Compensators Market Forecast by Value, 2021-2031 (USD Mn, AGR (%)) (W-Shape Recovery)
Figure 108. LAMEA Static Compensators Market Forecast by Value, 2021-2031 (USD Mn, AGR (%)) (U-Shape Recovery)
Figure 109. LAMEA Static Compensators Market Forecast by Value, 2021-2031 (USD Mn, AGR (%)) (L-Shape Recovery)
Figure 110. LAMEA Static Compensators Market Forecast by Country, 2021-2031 (USD Mn, AGR (%))
Figure 111. LAMEA Static Compensators Market Forecast by Country, 2021-2031 (USD Mn, AGR (%)) (V-Shape Recovery)
Figure 112. LAMEA Static Compensators Market Forecast by Country, 2021-2031 (USD Mn, AGR (%)) (W-Shape Recovery)
Figure 113. LAMEA Static Compensators Market Forecast by Country, 2021-2031 (USD Mn, AGR (%)) (U-Shape Recovery)
Figure 114. LAMEA Static Compensators Market Forecast by Country, 2021-2031 (USD Mn, AGR (%)) (L-Shape Recovery)
Figure 115. LAMEA Static Compensators Market Forecast by Type, 2021-2031 (USD Mn, AGR (%))
Figure 116. LAMEA Static Compensators Market Forecast by Type, 2021-2031 (USD Mn, AGR (%)) (V-Shape Recovery)
Figure 117. LAMEA Static Compensators Market Forecast by Type, 2021-2031 (USD Mn, AGR (%)) (W-Shape Recovery)
Figure 118. LAMEA Static Compensators Market Forecast by Type, 2021-2031 (USD Mn, AGR (%)) (U-Shape Recovery)
Figure 119. LAMEA Static Compensators Market Forecast by Type, 2021-2031 (USD Mn, AGR (%)) (L-Shape Recovery)
Figure 120. LAMEA Static Compensators Market Forecast by Component, 2021-2031 (USD Mn, AGR (%))
Figure 121. LAMEA Static Compensators Market Forecast by Component, 2021-2031 (USD Mn, AGR (%)) (V-Shape Recovery)
Figure 122. LAMEA Static Compensators Market Forecast by Component, 2021-2031 (USD Mn, AGR (%)) (W-Shape Recovery)
Figure 123. LAMEA Static Compensators Market Forecast by Component, 2021-2031 (USD Mn, AGR (%)) (U-Shape Recovery)
Figure 124. LAMEA Static Compensators Market Forecast by Component, 2021-2031 (USD Mn, AGR (%)) (L-Shape Recovery)
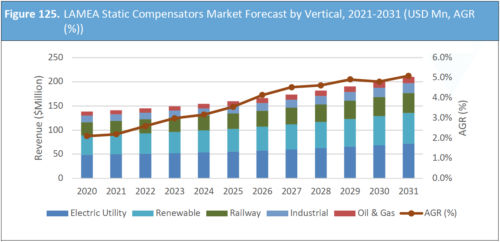
Figure 125. LAMEA Static Compensators Market Forecast by Vertical, 2021-2031 (USD Mn, AGR (%))
Figure 126. LAMEA Static Compensators Market Forecast by Vertical, 2021-2031 (USD Mn, AGR (%)) (V-Shape Recovery)
Figure 127. LAMEA Static Compensators Market Forecast by Vertical, 2021-2031 (USD Mn, AGR (%)) (W-Shape Recovery)
Figure 128. LAMEA Static Compensators Market Forecast by Vertical, 2021-2031 (USD Mn, AGR (%)) (U-Shape Recovery)
Figure 129. LAMEA Static Compensators Market Forecast by Vertical, 2021-2031 (USD Mn, AGR (%)) (L-Shape Recovery)
Figure 130. General Electric: Company Revenue 2015-2019 (USMn, AGR %)
Figure 131. General Electric: Company Operating Income 2015-2019 (USMn, AGR %)
Figure 132. General Electric: Company EBITDA 2015-2019 (USMn, AGR %)
Figure 133. General Electric: Company Net Income/Loss 2015-2019 (USMn, AGR %)
Figure 134. Hitachi, Ltd.: Company Revenue 2015-2019 (USMn, AGR %)
Figure 135. Hitachi, Ltd.: Company Operating Income 2015-2019 (USMn, AGR %)
Figure 136. Hitachi, Ltd.: Company EBITDA 2015-2019 (USMn, AGR %)
Figure 137. Hitachi, Ltd.: Company Net Income/Loss 2015-2019 (USMn, AGR %)
Figure 138. Mitsubishi Electric Corporation: Company Revenue 2015-2019 (USMn, AGR %)
Figure 139. Mitsubishi Electric Corporation: Company Operating Income 2015-2019 (USMn, AGR %)
Figure 140. Mitsubishi Electric Corporation: Company EBITDA 2015-2019 (USMn, AGR %)
Figure 141. Mitsubishi Electric Corporation: Company Net Income/Loss 2015-2019 (USMn, AGR %)
Figure 142. Infineon Technologies AG: Company Revenue 2015-2019 (USMn, AGR %)
Figure 143. Infineon Technologies AG: Company Operating Income 2015-2019 (USMn, AGR %)
Figure 144. Infineon Technologies AG: Company EBITDA 2015-2019 (USMn, AGR %)
Figure 145. Infineon Technologies AG: Company Net Income/Loss 2015-2019 (USMn, AGR %)
Figure 146. General Dynamics Corporation: Company Revenue 2015-2019 (USMn, AGR %)
Figure 147. General Dynamics Corporation: Company Operating Income 2015-2019 (USMn, AGR %)
Figure 148. General Dynamics Corporation: Company EBITDA 2015-2019 (USMn, AGR %)
Figure 149. General Dynamics Corporation: Company Net Income/Loss 2015-2019 (USMn, AGR %)
Figure 150. Eaton Corporation Plc: Company Revenue 2015-2019 (USMn, AGR %)
Figure 151. Eaton Corporation Plc: Company Operating Income 2015-2019 (USMn, AGR %)
Figure 152. Eaton Corporation Plc: Company EBITDA 2015-2019 (USMn, AGR %)
Figure 153. Eaton Corporation Plc: Company Net Income/Loss 2015-2019 (USMn, AGR %)
Figure 154. American Superconductor Corporation: Company Revenue 2015-2019 (USMn, AGR %)
Figure 155. American Superconductor Corporation: Company Operating Income 2015-2019 (USMn, AGR %)
Figure 156. American Superconductor Corporation: Company EBITDA 2015-2019 (USMn, AGR %)
Figure 157. American Superconductor Corporation: Company Net Income/Loss 2015-2019 (USMn, AGR %)
Figure 158. American Electric Power Company, Inc.: Company Revenue 2015-2019 (USMn, AGR %)
Figure 159. American Electric Power Company, Inc.: Company Operating Income 2015-2019 (USMn, AGR %)
Figure 160. American Electric Power Company, Inc.: Company EBITDA 2015-2019 (USMn, AGR %)
Figure 161. American Electric Power Company, Inc.: Company Net Income/Loss 2015-2019 (USMn, AGR %)
Figure 162. Abb Ltd: Company Revenue 2015-2019 (USMn, AGR %)
Figure 163. Abb Ltd: Company Operating Income 2015-2019 (USMn, AGR %)
Figure 164. Abb Ltd: Company EBITDA 2015-2019 (USMn, AGR %)
Figure 165. Abb Ltd: Company Net Income/Loss 2015-2019 (USMn, AGR %)
Figure 166. Siemens AG: Company Revenue 2015-2019 (USMn, AGR %)
Figure 167. Siemens AG: Company Operating Income 2015-2019 (USMn, AGR %)
Figure 168. Siemens AG: Company EBITDA 2015-2019 (USMn, AGR %)
Figure 169. Siemens AG: Company Net Income/Loss 2015-2019 (USMn, AGR %)
List of Companies Profiled in the report
Abb Ltd
American Electric Power Company, Inc. (AEP)
American Superconductor Corporation (AMSC)
Eaton Corporation Plc (Eaton)
General Dynamics Corporation
General Electric Company
Hitachi, Ltd.
Infineon Technologies AG
Mitsubishi Electric Corporation
Siemens AG
List of Other Companies Mentioned in the report
Abengoa
Achilles Corporation
Actuant Group
Actuant Group
Alberta Electric System Operator
Alstom
AltaLink
Alupar
Ameren Corporation
American Society of Civil Engineers
American Wind Energy Association
Amprion
AMSC
ANDE – Administracion Nacional de Electricidad
ASEAN Centre for Energy
Association of Southeast Asian Nations (ASEAN)
Atco Electric
Atlantic Wind Connection
AUER Packaging GmbH
AZZ, Inc.
AZZ, Inc.
Borealis
Botron Company Inc.
Braxenergy
Bundesnetzagentur (BNetZA) – German Federal Network Agency
C-EPRI
Canadian Electricity Association
Central Maine Power
China Southern Power Grid
China Xian Electrical Group
China Xian Electrical Group
Chint Group
Chint Group
CIA World Factbook
CIGRE
Clean Line Energy Partners LLC
COES
Companhia de Transmissao de Energia Eletrica Paulista (CTEEP)
Conference of the Parties 21
Copel – Companhia Paranaense de Energia
Coporacion Electrica del Ecuador
Council of European Energy Regulators (CEER)
Crnogorski Elektroprenosni Sistem AD
Crompton Greaves
Cymimasa
DEH Quantum Energy
Delixi
Delixi
Delphon Industries, LLC
Department of Energy and Climate Change
Desco Industries Inc.
Dongfang Electric
Dongfang Electric
Dou Yee Enterprises (S) Pte Ltd.
DS Smith Plc
Duke American Transmission Company
Duke Energy Corporation
E-CL
East African Community
Eaton Cutler and Hammer
Edesur
Elcom (UK) Ltd
Elecnor
Electricidade de Moçambique (EDM)
Electricity Generating Authority of Thailand (EGAT)
Electricity of Vietnam (EVN)
Electrobras
Electronorte
Element Power
Elering
Elia
Emera
Emerson Electric Company
Empresa de Energia de Bogota (EEB)
EPM (Empresas Publicas de Medellin)
Eskom
Ethiopian Electric Power Corporation
Exelon Corporation
Federal Government of Malaysia
Fingrid
Fujikura
Furnas
Furukawa Electric
General Electric (GE)
German Renewable Energy Federation
Government Agencies and Other Organisations Mentioned in This Report
Government of Argentina
Government of Egypt
Government of Mali
Government of Mozambique
Great River Energy
GWP Group Limited
Hubbell Inc.
Hubbell, Inc.
Hyosung Corporation
INDECOPI
Interchile
Interconexion Electrica S.A.
International Plastics Inc.
International Trade Administration Industry & Analysis
Isolux Corsan
ITC Holdings Corporation
KETRACO – Kenya Electricity Transmission Co. Ltd.
Kirloskar Electric Company
Kirloskar Electric Company
Kiva Container Corporation
Lapp
Legrand SA
LITGRID AB
LS Cable & System
LS power
Manitoba Hydro
Massachusetts Institute of Technology (MIT)
Medgrid
Ministry of Energy of the Russian Federation
Mitsubishi Electric
Mozambique Electricity
Nalcor Energy
National Grid Corporation of the Philippines (NGCP)
National Grid Plc
Nexans
Norte Energia
Northern Pass Transmission LLC
Norwegian Smartgrid Centre
Nur Energie
Office of Gas and Electricity Markets (Ofgem)
Omnetric Group
OSINERGMIN - Peruvian state energy and mines investment regulator
Pacific Gas & Electric Company (PG&E)
Peruvian Ministry of Energy and Mines (MEM)
Peruvian Ministry of the Environment
PLN (Perusahaan Listrik Negara)
Powell Industries
Powell Industries
Power Grid Corporation of India (POWERGRID)
PPC Renewables
PPL Corporation
Pregis Corporation
PROINVERSION
Protective Packaging Corporation
PT BICC BERCA Cables
Red Electrica de España
Russian Federal Grid Company
S&C Electric Company
S&C Electric Company
Sarawak Energy Berhad
Schneider Electric
Scottish and Southern Energy (SSE)
Sealed Air Corporation
Siemens
Smurfit Kappa Group
Southern California Edison (SCE)
SouthWestern Power Group (SPG)
SPX Group
SPX Group
State Grid Corporation of China (SGCC)
Statnett
Storopack Hans Reichenecker GmbH
Summit Container
Teknis Limited
TenneT
TERNA
Tokyo Electric Power Company (TEPCO)
Toshiba Transmission Distribution & Industrial Systems Company
Transmission Developers Inc.
Transpower New Zealand
Uganda Electricity Transmission Company
Waukesha Electric Systems, Inc.
West African Power Pool
World Bank
World Nuclear Association
ZESCO