The Ozone Generator Market Report 2023-2033: This report will prove invaluable to leading firms striving for new revenue pockets if they wish to better understand the industry and its underlying dynamics. It will be useful for companies that would like to expand into different industries or to expand their existing operations in a new region.
Harnessing the Power of Ozone for Clean and Safe Water
The increasing demand for water and wastewater treatment solutions is a significant driving factor for the ozone generator market. Ozone generators are widely used in water treatment processes to disinfect and remove contaminants, offering an effective alternative to traditional chemical-based treatments. The growing population, urbanization, and industrial activities have led to an increased need for clean and safe water, driving the demand for ozone generators in the water and wastewater treatment sector. Ozone treatment provides efficient disinfection, eliminates odor, and reduces the formation of harmful by-products, making it an attractive solution for addressing water treatment challenges.
Meeting Regulations with Eco-Friendly Ozone Solutions
Stringent environmental regulations and standards imposed by governments and regulatory bodies worldwide are driving the demand for ozone generators. Ozone, as a powerful oxidizing agent, offers a sustainable and environmentally friendly alternative to conventional chemical treatment methods. Ozone generators aid in meeting regulatory requirements by providing efficient disinfection, reducing the need for hazardous chemicals, and minimizing the environmental impact of water and air treatment processes. As environmental concerns continue to grow, the adoption of ozone generators becomes crucial for industries striving for compliance with sustainable practices.
What Questions Should You Ask before Buying a Market Research Report?
• How is the ozone generator market evolving?
• What is driving and restraining the ozone generator market?
• How will each ozone generator submarket segment grow over the forecast period and how much revenue will these submarkets account for in 2033?
• How will the market shares for each ozone generator submarket develop from 2023 to 2033?
• What will be the main driver for the overall market from 2023 to 2033?
• Will leading ozone generator markets broadly follow the macroeconomic dynamics, or will individual national markets outperform others?
• How will the market shares of the national markets change by 2033 and which geographical region will lead the market in 2033?
• Who are the leading players and what are their prospects over the forecast period?
• What are the ozone generator projects for these leading companies?
• How will the industry evolve during the period between 2023 and 2033? What are the implications of ozone generator projects taking place now and over the next 10 years?
• Is there a greater need for product commercialisation to further scale the ozone generator market?
• Where is the ozone generator market heading and how can you ensure you are at the forefront of the market?
• What are the best investment options for new product and service lines?
• What are the key prospects for moving companies into a new growth path and C-suite?
You need to discover how this will impact the ozone generator market today, and over the next 10 years:
• Our 320-page report provides 128 tables and 177 charts/graphs exclusively to you.
• The report highlights key lucrative areas in the industry so you can target them – NOW.
• It contains in-depth analysis of global, regional and national sales and growth.
• It highlights for you the key successful trends, changes and revenue projections made by your competitors.
This report tells you TODAY how the ozone generator market will develop in the next 10 years, and in line with the variations in COVID-19 economic recession and bounce. This market is more critical now than at any point over the last 10 years.
Forecasts to 2033 and other analyses reveal commercial prospects
• In addition to revenue forecasting to 2033, our new study provides you with recent results, growth rates, and market shares.
• You will find original analyses, with business outlooks and developments.
• Discover qualitative analyses (including market dynamics, drivers, opportunities, restraints and challenges), cost structure, impact of rising ozone generator prices and recent developments.
This report includes data analysis and invaluable insight into how COVID-19 will affect the industry and your company. Four COVID-19 recovery patterns and their impact, namely, “V”, “L”, “W” and “U” are discussed in this report.
Segments Covered in the Report
Market Segment by Process
• Odor Control
• Groundwater Remediation
• Disinfection
Market Segment by Technology
• Corona Discharge
• Ultraviolet Radiation
• Electrolysis
• Radiochemical
Market Segment by End-use Industry
• Municipal & Industrial Water Treatment
• Residential & Industrial Air Treatment
• Automotive
• Food & Beverage
• Other End-use Industry
Market Segment by Application
• Water Purification
• Air Purification
• Pulp Bleaching
• Organic Synthesis
• Aquaculture
• Other Applications

In addition to the revenue predictions for the overall world market and segments, you will also find revenue forecasts for four regional and 20 leading national markets:
North America
• U.S.
• Canada
Europe
• Germany
• Spain
• United Kingdom
• France
• Italy
• Rest of Europe
Asia Pacific
• China
• Japan
• India
• Australia
• South Korea
• Rest of Asia Pacific
Latin America
• Brazil
• Mexico
• Rest of Latin America
Middle East & Africa
• GCC
• South Africa
• Rest of Middle East & Africa
Need industry data? Please contact us today.
The report also includes profiles and for some of the leading companies in the Ozone Generator Market, 2023 to 2033, with a focus on this segment of these companies’ operations.
Leading companies and the potential for market growth
• Chemtronics Technologies Pvt. Ltd.
• Corotec Corporation
• Creative Oz-Air (I) Pvt Ltd
• Faraday Ozone Products Private Limited
• Industrie De Nora S.p.A.
• Lenntech B.V.
• Metawater Co.,Ltd.
• Mitsubishi Electric Corporation
• MKS Instruments, Inc.
• Ozonetech Systems OTS AB
• Spartan Environmental Technologies
• Teledyne Advanced Pollution Instrumentation
• Toshiba Corporation
• Veolia Water Technologies & Solutions
• Xylem Inc.
Overall world revenue for Ozone Generator Market, 2023 to 2033 in terms of value the market will surpass US$1,246.1 million in 2023, our work calculates. We predict strong revenue growth through to 2033. Our work identifies which organizations hold the greatest potential. Discover their capabilities, progress, and commercial prospects, helping you stay ahead.
How will the Ozone Generator Market, 2023 to 2033 report help you?
In summary, our 320-pages report provides you with the following knowledge:
• Revenue forecasts to 2033 for Ozone Generator Market, 2023 to 2033 Market, with forecasts for process, technology, end-use industry, application, each forecast at a global and regional level – discover the industry’s prospects, finding the most lucrative places for investments and revenues.
• Revenue forecasts to 2033 for four regional and 20 key national markets – See forecasts for the Ozone Generator Market, 2023 to 2033 market in North America, Europe, Asia-Pacific, Latin America and Middle East & Africa. Also forecasted is the market in the US, Canada, Brazil, Germany, France, UK, Italy, China, India, Japan, and Australia among other prominent economies.
• Prospects for established firms and those seeking to enter the market – including company profiles for 15 of the major companies involved in the Ozone Generator Market, 2023 to 2033.
Find quantitative and qualitative analyses with independent predictions. Receive information that only our report contains, staying informed with invaluable business intelligence.
Information found nowhere else
With our new report, you are less likely to fall behind in knowledge or miss out on opportunities. See how our work could benefit your research, analyses, and decisions. Visiongain’s study is for everybody needing commercial analyses for the ozone generator market, 2023 to 2033, market-leading companies. You will find data, trends and predictions.
To access the data contained in this document please email contactus@visiongain.com
Buy our report today Ozone Generator Market Report 2023-2033: Forecasts by Process (Odour Control, Groundwater Remediation, Disinfection), by Technology (Corona Discharge, Ultraviolet Radiation, Electrolysis, Radiochemical), by End-use Industry (Municipal & Industrial Water Treatment, Residential & Industrial Air Treatment, Automotive, Food & Beverage, Other), by Application (Water Purification, Air Purification, Pulp Bleaching, Organic Synthesis, Aquaculture, Other) AND Regional and Leading National Market Analysis PLUS Analysis of Leading Companies AND COVID-19 Impact and Recovery Pattern Analysis. Avoid missing out by staying informed – order our report now.
Visiongain is a trading partner with the US Federal Government
CCR Ref number: KD4R6
Do you have any custom requirements we can help you with? Any need for a specific country, geo region, market segment or specific company information? Contact us today, we can discuss your needs and see how we can help: contactus@visiongain.com
1 Report Overview
1.1 Objectives of the Study
1.2 Introduction to Ozone Generator Market
1.3 What This Report Delivers
1.4 Why You Should Read This Report
1.5 Key Questions Answered by This Analytical Report
1.6 Who is This Report for?
1.7 Research Methodology
1.7.1 Market Definitions
1.7.2 Market Evaluation & Forecasting Methodology
1.7.3 Data Validation
1.7.3.1 Primary Research
1.7.3.2 Secondary Research
1.8 Frequently Asked Questions (FAQs)
1.9 Associated Visiongain Reports
1.10 About Visiongain
2 Executive Summary
2.1 Segment Analysis
2.1.1 Process Segment: Market Attractiveness Index
2.1.2 Technology Segment: Market Attractiveness Index
2.1.3 End-Use Segment: Market Attractiveness Index
2.1.4 Application Segment: Market Attractiveness Index
2.2 Regional Analysis
3 Market Overview
3.1 Key Findings
3.2 Market Dynamics
3.2.1 Market Driving Factors
3.2.1.1 Increasing Awareness and Concerns Regarding Environmental Pollution and Health Risks Drive the Demand for Ozone Generators
3.2.1.2 Stringent Government Regulations and Policies Promoting the Use of Ozone Technology in Water and Air Treatment Fuel Market Growth
3.2.1.3 Growing Industrialization and Urbanization Lead to a Higher Need for Effective Water and Air Purification Solutions, Boosting the Ozone Generator Market
3.2.2 Market Restraints
3.2.2.1 High Initial Investment and Operating Costs Associated with Ozone Generator Systems Hinder Market Adoption
3.2.2.2 Technical Complexities and Maintenance Requirements Pose Challenges to Market Growth
3.2.2.3 Limited Awareness and Understanding of Ozone Technology Among End-Users Restrict Market Expansion
3.2.3 Market Opportunities
3.2.3.1 Advancements in Ozone Generator Technology, Such as Improved Energy Efficiency and Automation, Create Opportunities for Market Players
3.2.3.2 Rising Demand for Ozone Generators in Emerging Economies with Expanding Industrial Sectors Presents Untapped Market Potential
3.2.3.3 Increasing Focus on Sustainable Development and Green Initiatives Drives the Adoption of Ozone Generators in Various Industries
3.3 COVID-19 Impact Analysis
3.3.1 V-Shaped Recovery
3.3.2 W-Shaped Recovery
3.3.3 U-Shaped Recovery
3.3.4 L-Shaped Recovery
3.4 Porter’s Five Forces Analysis
3.4.1 Bargaining Power of Suppliers (Moderate)
3.4.2 Bargaining Power of Buyers (High)
3.4.3 Competitive Rivalry (High)
3.4.4 Threat from Substitutes (Low)
3.4.5 Threat of New Entrants (Low)
3.5 PEST Analysis
3.5.1 Political Factors
3.5.2 Economic Factors:
3.5.3 Social Factors
3.5.4 Technological Factors
4 Ozone Generator Market Analysis by Process
4.1 Key Findings
4.2 Process Segment: Market Attractiveness Index
4.3 Ozone Generator Market Size Estimation and Forecast by Process
4.4 Odour Control
4.4.1 Market Size by Region, 2023-2033 (US$ Million)
4.4.2 Market Share by Region, 2023 & 2033 (%)
4.5 Groundwater Remediation
4.5.1 Market Size by Region, 2023-2033 (US$ Million)
4.5.2 Market Share by Region, 2023 & 2033 (%)
4.6 Disinfection Market
4.6.1 Market Size by Region, 2023-2033 (US$ Million)
4.6.2 Market Share by Region, 2023 & 2033 (%)
5 Ozone Generator Market Analysis by Technology
5.1 Key Findings
5.2 Technology Segment: Market Attractiveness Index
5.3 Ozone Generator Market Size Estimation and Forecast by Technology
5.4 Corona Discharge Market
5.4.1 Market Size by Region, 2023-2033 (US$ Million)
5.4.2 Market Share by Region, 2023 & 2033 (%)
5.5 Ultraviolet Radiation Market
5.5.1 Market Size by Region, 2023-2033 (US$ Million)
5.5.2 Market Share by Region, 2023 & 2033 (%)
5.6 Electrolysis Market
5.6.1 Market Size by Region, 2023-2033 (US$ Million)
5.6.2 Market Share by Region, 2023 & 2033 (%)
5.7 Radiochemical Market
5.7.1 Market Size by Region, 2023-2033 (US$ Million)
5.7.2 Market Share by Region, 2023 & 2033 (%)
6 Ozone Generator Market Analysis by End-Use
6.1 Key Findings
6.2 End-Use Segment: Market Attractiveness Index
6.3 Ozone Generator Market Size Estimation and Forecast by End-Use
6.4 Municipal & Industrial Water Treatment Market
6.4.1 Market Size by Region, 2023-2033 (US$ Million)
6.4.2 Market Share by Region, 2023 & 2033 (%)
6.5 Residential & Industrial Air Treatment Market
6.5.1 Market Size by Region, 2023-2033 (US$ Million)
6.5.2 Market Share by Region, 2023 & 2033 (%)
6.6 Automotive Market
6.6.1 Market Size by Region, 2023-2033 (US$ Million)
6.6.2 Market Share by Region, 2023 & 2033 (%)
6.7 Food & Beverage Market
6.7.1 Market Size by Region, 2023-2033 (US$ Million)
6.7.2 Market Share by Region, 2023 & 2033 (%)
6.8 Other End-use Industry Market
6.8.1 Market Size by Region, 2023-2033 (US$ Million)
6.8.2 Market Share by Region, 2023 & 2033 (%)
7 Ozone Generator Market Analysis by Application
7.1 Key Findings
7.2 Application Segment: Market Attractiveness Index
7.3 Ozone Generator Market Size Estimation and Forecast by Application
7.4 Water Purification Market
7.4.1 Market Size by Region, 2023-2033 (US$ Million)
7.4.2 Market Share by Region, 2023 & 2033 (%)
7.5 Air Purification Market
7.5.1 Market Size by Region, 2023-2033 (US$ Million)
7.5.2 Market Share by Region, 2023 & 2033 (%)
7.6 Pulp Bleaching Market
7.6.1 Market Size by Region, 2023-2033 (US$ Million)
7.6.2 Market Share by Region, 2023 & 2033 (%)
7.7 Organic Synthesis Market
7.7.1 Market Size by Region, 2023-2033 (US$ Million)
7.7.2 Market Share by Region, 2023 & 2033 (%)
7.8 Aquaculture Market
7.8.1 Market Size by Region, 2023-2033 (US$ Million)
7.8.2 Market Share by Region, 2023 & 2033 (%)
7.9 Other Applications Market
7.9.1 Market Size by Region, 2023-2033 (US$ Million)
7.9.2 Market Share by Region, 2023 & 2033 (%)
8 Ozone Generator Market Analysis by Region
8.1 Key Findings
8.2 Regional Market Size Estimation and Forecast
9 North America Ozone Generator Market Analysis
9.1 Key Findings
9.2 North America Ozone Generator Market Attractiveness Index
9.3 North America Ozone Generator Market by Country, 2023, 2028 & 2033 (US$ Million)
9.4 North America Ozone Generator Market Size Estimation and Forecast by Value
9.5 North America Ozone Generator Market Size Estimation and Forecast by Country
9.6 North America Ozone Generator Market Size Estimation and Forecast by Process
9.7 North America Ozone Generator Market Size Estimation and Forecast by Technology
9.8 North America Ozone Generator Market Size Estimation and Forecast by End-Use
9.9 North America Ozone Generator Market Size Estimation and Forecast by Application
9.10 US Ozone Generator Market
9.11 Canada Ozone Generator Market
10 Europe Ozone Generator Market Analysis
10.1 Key Findings
10.2 Europe Ozone Generator Market Attractiveness Index
10.3 Europe Ozone Generator Market by Country, 2023, 2028 & 2033 (US$ Million)
10.4 Europe Ozone Generator Market Size Estimation and Forecast by Value
10.5 Europe Ozone Generator Market Size Estimation and Forecast by Country
10.6 Europe Ozone Generator Market Size Estimation and Forecast by Process
10.7 Europe Ozone Generator Market Size Estimation and Forecast by Technology
10.8 Europe Ozone Generator Market Size Estimation and Forecast by End-Use
10.9 Europe Ozone Generator Market Size Estimation and Forecast by Application
10.10 Germany Ozone Generator Market
10.11 UK Ozone Generator Market
10.12 France Ozone Generator Market
10.13 Italy Ozone Generator Market
10.14 Spain Ozone Generator Market
10.15 Rest of Europe Ozone Generator Market
11 Asia-Pacific Ozone Generator Market Analysis
11.1 Key Findings
11.2 Asia-Pacific Ozone Generator Market Attractiveness Index
11.3 Asia-Pacific Ozone Generator Market by Country, 2023, 2028 & 2033 (US$ Million)
11.4 Asia-Pacific Ozone Generator Market Size Estimation and Forecast by Value
11.5 Asia-Pacific Ozone Generator Market Size Estimation and Forecast by Country
11.6 Asia-Pacific Ozone Generator Market Size Estimation and Forecast by Process
11.7 Asia-Pacific Ozone Generator Market Size Estimation and Forecast by Technology
11.8 Asia-Pacific Ozone Generator Market Size Estimation and Forecast by End-Use
11.9 Asia-Pacific Ozone Generator Market Size Estimation and Forecast by Application
11.10 China Ozone Generator Market
11.11 India Ozone Generator Market
11.12 Japan Ozone Generator Market
11.13 South Korea Ozone Generator Market
11.14 Australia Ozone Generator Market
11.15 Rest of Asia Pacific Ozone Generator Market
12 Middle East & Africa Ozone Generator Market Analysis
12.1 Key Findings
12.2 Middle East & Africa Ozone Generator Market Attractiveness Index
12.3 Middle East & Africa Ozone Generator Market by Country, 2023, 2028 & 2033 (US$ Million)
12.4 Middle East & Africa Ozone Generator Market Size Estimation and Forecast by Value
12.5 Middle East & Africa Ozone Generator Market Size Estimation and Forecast by Country
12.6 Middle East & Africa Ozone Generator Market Size Estimation and Forecast by Process
12.7 Middle East & Africa Ozone Generator Market Size Estimation and Forecast by Technology
12.8 Middle East & Africa Ozone Generator Market Size Estimation and Forecast by End-Use
12.9 Middle East & Africa Ozone Generator Market Size Estimation and Forecast by Application
12.10 GCC Ozone Generator Market
12.11 South Africa Ozone Generator Market
12.12 Rest of Middle East & Africa Ozone Generator Market
13 Latin America Ozone Generator Market Analysis
13.1 Key Findings
13.2 Latin America Ozone Generator Market Attractiveness Index
13.3 Latin America Ozone Generator Market by Country, 2023, 2028 & 2033 (US$ Million)
13.4 Latin America Ozone Generator Market Size Estimation and Forecast by Value
13.5 Latin America Ozone Generator Market Size Estimation and Forecast by Country
13.6 Latin America Ozone Generator Market Size Estimation and Forecast by Process
13.7 Latin America Ozone Generator Market Size Estimation and Forecast by Technology
13.8 Latin America Ozone Generator Market Size Estimation and Forecast by End-Use
13.9 Latin America Ozone Generator Market Size Estimation and Forecast by Application
13.10 Brazil Ozone Generator Market
13.11 Mexico Ozone Generator Market
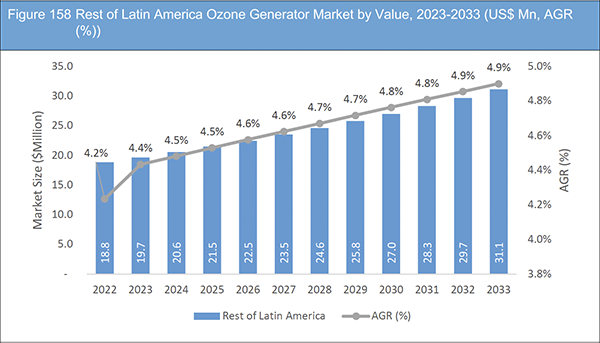
13.12 Rest of Latin America Ozone Generator Market
14 Company Profiles
14.1 Competitive Landscape, 2022
14.2 Strategic Outlook
14.2.1 New Product Launch as Key Business Strategy
14.2.1 Acquisitions as Key Business Strategy
14.2.1 Partnership as Key Business Strategy
14.2.1 Agreement as Key Business Strategy
14.2.2 Contract as Key Business Strategy
14.3 Veolia Water Technologies & Solutions
14.3.1 Company Snapshot
14.3.2 Company Overview
14.3.3 Product Benchmarking
14.3.4 Strategic Outlook
14.4 Xylem Inc.
14.4.1 Company Snapshot
14.4.2 Company Overview
14.4.3 Financial Analysis
14.4.3.1 Net Revenue, 2018-2022
14.4.3.2 R&D, 2018-2022
14.4.3.3 Regional Revenue Share, 2022 (%)
14.4.3.4 Business Segment Revenue Share, 2022 (%)
14.4.4 Product Benchmarking
14.4.5 Strategic Outlook
14.5 Mitsubishi Electric Corporation
14.5.1 Company Snapshot
14.5.2 Company Overview
14.5.3 Financial Analysis
14.5.3.1 Net Revenue, 2018-2022
14.5.3.2 R&D, 2018-2022
14.5.3.3 Regional Revenue Share, 2022 (%)
14.5.3.4 Business Segment Revenue Share, 2022 (%)
14.5.4 Product Benchmarking
14.5.5 Strategic Outlook
14.6 Toshiba Corporation
14.6.1 Company Snapshot
14.6.2 Company Overview
14.6.3 Financial Analysis
14.6.3.1 Net Revenue, 2018-2022
14.6.3.2 R&D, 2018-2022
14.6.3.3 Regional Revenue Share, 2022 (%)
14.6.3.4 Business Segment Revenue Share, 2022 (%)
14.6.4 Product Benchmarking
14.6.5 Strategic Outlook
14.7 Metawater Co.,Ltd.
14.7.1 Company Snapshot
14.7.2 Company Overview
14.7.3 Financial Analysis
14.7.3.1 Net Revenue, 2018-2022
14.7.3.2 R&D, 2018-2022
14.7.3.3 Business Segment Revenue Share, 2022 (%)
14.7.4 Product Benchmarking
14.8 Industrie De Nora S.p.A.
14.8.1 Company Snapshot
14.8.2 Company Overview
14.8.3 Product Benchmarking
14.8.4 Strategic Outlook
14.9 Spartan Environmental Technologies
14.9.1 Company Snapshot
14.9.2 Company Overview
14.9.3 Product Benchmarking
14.10 MKS Instruments, Inc.
14.10.1 Company Snapshot
14.10.2 Company Overview
14.10.3 Financial Analysis
14.10.3.1 Net Revenue, 2018-2022
14.10.3.2 R&D, 2018-2022
14.10.3.3 Business Segment Revenue Share, 2022 (%)
14.10.4 Product Benchmarking
14.10.5 Strategic Outlook
14.11 Teledyne Advanced Pollution Instrumentation
14.11.1 Company Snapshot
14.11.2 Company Overview
14.11.3 Product Benchmarking
14.12 Creative Oz-Air (I) Pvt Ltd
14.12.1 Company Snapshot
14.12.2 Company Overview
14.12.3 Product Benchmarking
14.13 Corotec Corporation
14.13.1 Company Snapshot
14.13.2 Company Overview
14.13.3 Product Benchmarking
14.14 Ozonetech Systems OTS AB
14.14.1 Company Snapshot
14.14.2 Company Overview
14.14.3 Product Benchmarking
14.15 Lenntech B.V.
14.15.1 Company Snapshot
14.15.2 Company Overview
14.15.3 Product Benchmarking
14.16 Chemtronics Technologies Pvt. Ltd.
14.16.1 Company Snapshot
14.16.2 Company Overview
14.16.3 Product Benchmarking
14.17 Faraday Ozone
14.17.1 Company Snapshot
14.17.2 Company Overview
14.17.3 Product Benchmarking
15 Conclusion and Recommendations
15.1 Concluding Remarks from Visiongain
15.2 Recommendations for Market Players
List of Tables
Table 1 Ozone Generator Market Snapshot, 2023 & 2033 (US$ Million, CAGR %)
Table 2 Global Ozone Generator Market Forecast, 2023-2033 (US$ Mn, AGR (%), CAGR (%)) (V-Shaped Recovery Scenario)
Table 3 Global Ozone Generator Market by Region, 2023-2033 (US$ Mn, AGR (%), CAGR (%)) (V-Shaped Recovery Scenario)
Table 4 Global Ozone Generator Market Forecast, 2023-2033 (US$ Mn, AGR (%), CAGR (%)) (W-Shaped Recovery Scenario)
Table 5 Global Ozone Generator Market by Region, 2023-2033 (US$ Mn, AGR (%), CAGR (%)) (W-Shaped Recovery Scenario)
Table 6 Global Ozone Generator Market Forecast, 2023-2033 (US$ Mn, AGR (%), CAGR (%)) (U-Shaped Recovery Scenario)
Table 7 Global Ozone Generator Market by Region, 2023-2033 (US$ Mn, AGR (%), CAGR (%)) (U-Shaped Recovery Scenario)
Table 8 Global Ozone Generator Market Forecast, 2023-2033 (US$ Mn, AGR (%), CAGR (%)) (L-Shaped Recovery Scenario)
Table 9 Global Ozone Generator Market by Region, 2023-2033 (US$ Mn, AGR (%), CAGR (%)) (L-Shaped Recovery Scenario)
Table 10 Global Ozone Generator Market by Process, 2023-2033 (US$ Mn, AGR (%), CAGR (%))
Table 11 Odour Control Market by Region, 2023-2033 (US$ Mn, AGR (%), CAGR (%))
Table 12 Groundwater Remediation Market by Region, 2023-2033 (US$ Mn, AGR (%), CAGR (%))
Table 13 Disinfection Market by Region, 2023-2033 (US$ Mn, AGR (%), CAGR (%))
Table 14 Global Ozone Generator Market by Technology, 2023-2033 (US$ Mn, AGR (%), CAGR (%))
Table 15 Corona Discharge Market by Region, 2023-2033 (US$ Mn, AGR (%), CAGR (%))
Table 16 Ultraviolet Radiation Market by Region, 2023-2033 (US$ Mn, AGR (%), CAGR (%))
Table 17 Electrolysis Market by Region, 2023-2033 (US$ Mn, AGR (%), CAGR (%))
Table 18 Radiochemical Market by Region, 2023-2033 (US$ Mn, AGR (%), CAGR (%))
Table 19 Global Ozone Generator Market by End-use Industry, 2023-2033 (US$ Mn, AGR (%), CAGR (%))
Table 20 Municipal & Industrial Water Treatment Market by Region, 2023-2033 (US$ Mn, AGR (%), CAGR (%))
Table 21 Residential & Industrial Air Treatment Market by Region, 2023-2033 (US$ Mn, AGR (%), CAGR (%))
Table 22 Automotive Market by Region, 2023-2033 (US$ Mn, AGR (%), CAGR (%))
Table 23 Food & Beverage Market by Region, 2023-2033 (US$ Mn, AGR (%), CAGR (%))
Table 24 Other End-use Industry Market by Region, 2023-2033 (US$ Mn, AGR (%), CAGR (%))
Table 25 Global Ozone Generator Market by Application, 2023-2033 (US$ Mn, AGR (%), CAGR (%))
Table 26 Water Purification Market by Region, 2023-2033 (US$ Mn, AGR (%), CAGR (%))
Table 27 Air Purification Market by Region, 2023-2033 (US$ Mn, AGR (%), CAGR (%))
Table 28 Pulp Bleaching Market by Region, 2023-2033 (US$ Mn, AGR (%), CAGR (%))
Table 29 Organic Synthesis Market by Region, 2023-2033 (US$ Mn, AGR (%), CAGR (%))
Table 30 Aquaculture Market by Region, 2023-2033 (US$ Mn, AGR (%), CAGR (%))
Table 31 Other Applications Market by Region, 2023-2033 (US$ Mn, AGR (%), CAGR (%))
Table 32 Global Ozone Generator Market Forecast, 2023-2033 (US$ Mn, AGR (%), CAGR (%))
Table 33 Global Ozone Generator Market by Region, 2023-2033 (US$ Mn, AGR (%), CAGR (%))
Table 34 Global Ozone Generator Market by Process, 2023-2033 (US$ Mn, AGR (%), CAGR (%))
Table 35 Global Ozone Generator Market by Technology, 2023-2033 (US$ Mn, AGR (%), CAGR (%))
Table 36 Global Ozone Generator Market by End-use Industry, 2023-2033 (US$ Mn, AGR (%), CAGR (%))
Table 37 Global Ozone Generator Market by Application, 2023-2033 (US$ Mn, AGR (%), CAGR (%))
Table 38 North America Ozone Generator Market by Value, 2023-2033 (US$ Mn, AGR (%), CAGR (%))
Table 39 North America Ozone Generator Market by Country, 2023-2033 (US$ Mn, AGR (%), CAGR (%))
Table 40 North America Ozone Generator Market by Process, 2023-2033 (US$ Mn, AGR (%), CAGR (%))
Table 41 North America Ozone Generator Market by Technology, 2023-2033 (US$ Mn, AGR (%), CAGR (%))
Table 42 North America Ozone Generator Market by End-use Industry, 2023-2033 (US$ Mn, AGR (%), CAGR (%))
Table 43 North America Ozone Generator Market by Application, 2023-2033 (US$ Mn, AGR (%), CAGR (%))
Table 44 US Ozone Generator Market by Value, 2023-2033 (US$ Mn, AGR (%), CAGR (%))
Table 45 Canada Ozone Generator Market by Value, 2023-2033 (US$ Mn, AGR (%), CAGR (%))
Table 46 Europe Ozone Generator Market by Value, 2023-2033 (US$ Mn, AGR (%), CAGR (%))
Table 47 Europe Ozone Generator Market by Country, 2023-2033 (US$ Mn, AGR (%), CAGR (%))
Table 48 Europe Ozone Generator Market by Process, 2023-2033 (US$ Mn, AGR (%), CAGR (%))
Table 49 Europe Ozone Generator Market by Technology, 2023-2033 (US$ Mn, AGR (%), CAGR (%))
Table 50 Europe Ozone Generator Market by End-use Industry, 2023-2033 (US$ Mn, AGR (%), CAGR (%))
Table 51 Europe Ozone Generator Market by Application, 2023-2033 (US$ Mn, AGR (%), CAGR (%))
Table 52 Germany Ozone Generator Market by Value, 2023-2033 (US$ Mn, AGR (%), CAGR (%))
Table 53 UK Ozone Generator Market by Value, 2023-2033 (US$ Mn, AGR (%), CAGR (%))
Table 54 France Ozone Generator Market by Value, 2023-2033 (US$ Mn, AGR (%), CAGR (%))
Table 55 Italy Ozone Generator Market by Value, 2023-2033 (US$ Mn, AGR (%), CAGR (%))
Table 56 Spain Ozone Generator Market by Value, 2023-2033 (US$ Mn, AGR (%), CAGR (%))
Table 57 Rest of Europe Ozone Generator Market by Value, 2023-2033 (US$ Mn, AGR (%), CAGR (%))
Table 58 Asia-Pacific Ozone Generator Market by Value, 2023-2033 (US$ Mn, AGR (%), CAGR (%))
Table 59 Asia-Pacific Ozone Generator Market by Country, 2023-2033 (US$ Mn, AGR (%), CAGR (%))
Table 60 Asia-Pacific Ozone Generator Market by Process, 2023-2033 (US$ Mn, AGR (%), CAGR (%))
Table 61 Asia-Pacific Ozone Generator Market by Technology, 2023-2033 (US$ Mn, AGR (%), CAGR (%))
Table 62 Asia-Pacific Ozone Generator Market by End-use Industry, 2023-2033 (US$ Mn, AGR (%), CAGR (%))
Table 63 Asia-Pacific Ozone Generator Market by Application, 2023-2033 (US$ Mn, AGR (%), CAGR (%))
Table 64 China Ozone Generator Market by Value, 2023-2033 (US $Mn, AGR (%), CAGR (%))
Table 65 India Ozone Generator Market by Value, 2023-2033 (US$ Mn, AGR (%), CAGR (%))
Table 66 Japan Ozone Generator Market by Value, 2023-2033 (US$ Mn, AGR (%), CAGR (%))
Table 67 South Korea Ozone Generator Market by Value, 2023-2033 (US$ Mn, AGR (%), CAGR (%))
Table 68 Australia Ozone Generator Market by Value, 2023-2033 (US$ Mn, AGR (%), CAGR (%))
Table 69 Rest of Asia-Pacific Ozone Generator Market by Value, 2023-2033 (US$ Mn, AGR (%), CAGR (%))
Table 70 Middle East & Africa Ozone Generator Market by Value, 2023-2033 (US$ Mn, AGR (%), CAGR (%))
Table 71 Middle East & Africa Ozone Generator Market by Country, 2023-2033 (US$ Mn, AGR (%), CAGR (%))
Table 72 Middle East & Africa Ozone Generator Market by Process, 2023-2033 (US$ Mn, AGR (%), CAGR (%))
Table 73 Middle East & Africa Ozone Generator Market by Technology, 2023-2033 (US$ Mn, AGR (%), CAGR (%))
Table 74 Middle East & Africa Ozone Generator Market by End-use Industry, 2023-2033 (US$ Mn, AGR (%), CAGR (%))
Table 75 Middle East & Africa Ozone Generator Market by Application, 2023-2033 (US$ Mn, AGR (%), CAGR (%))
Table 76 GCC Ozone Generator Market by Value, 2023-2033 (US$ Mn, AGR (%), CAGR (%))
Table 77 South Africa Ozone Generator Market by Value, 2023-2033 (US$ Mn, AGR (%), CAGR (%))
Table 78 Rest of Middle East & Africa Ozone Generator Market by Value, 2023-2033 (US$ Mn, AGR (%), CAGR (%))
Table 79 Latin America Ozone Generator Market by Value, 2023-2033 (US$ Mn, AGR (%), CAGR (%))
Table 80 Latin America Ozone Generator Market by Country, 2023-2033 (US$ Mn, AGR (%), CAGR (%))
Table 81 Latin America Ozone Generator Market by Process, 2023-2033 (US$ Mn, AGR (%), CAGR (%))
Table 82 Latin America Ozone Generator Market by Technology, 2023-2033 (US$ Mn, AGR (%), CAGR (%))
Table 83 Latin America Ozone Generator Market by End-use Industry, 2023-2033 (US$ Mn, AGR (%), CAGR (%))
Table 84 Latin America Ozone Generator Market by Application, 2023-2033 (US$ Mn, AGR (%), CAGR (%))
Table 85 Brazil Ozone Generator Market by Value, 2023-2033 (US$ Mn, AGR (%), CAGR (%))
Table 86 Mexico Ozone Generator Market by Value, 2023-2033 (US$ Mn, AGR (%), CAGR (%))
Table 87 Rest of Latin America Ozone Generator Market by Value, 2023-2033 (US$ Mn, AGR (%), CAGR (%))
Table 88 Strategic Outlook: New Product Launch
Table 89 Strategic Outlook: Acquisition
Table 90 Strategic Outlook: Partnership
Table 91 Strategic Outlook: Agreement
Table 92 Strategic Outlook: Contract
Table 93 Veolia Water Technologies & Solutions :Key Details, (CEO, HQ, Revenue, Founded, No. of Employees, Company Type, Website, Business Segment)
Table 94 Veolia Water Technologies & Solutions: Product Benchmarking
Table 95 Veolia Water Technologies & Solutions: Strategic Outlook
Table 96 Xylem Inc. Key Details, (CEO, HQ, Revenue, Founded, No. of Employees, Company Type, Website, Business Segment)
Table 97 Xylem Inc.: Product Benchmarking
Table 98 Xylem Inc.: Strategic Outlook
Table 99 Mitsubishi Electric Corporation Key Details, (CEO, HQ, Revenue, Founded, No. of Employees, Company Type, Website, Business Segment)
Table 100 Mitsubishi Electric Corporation: Product Benchmarking
Table 101 Mitsubishi Electric Corporation: Strategic Outlook
Table 102 Toshiba Corporation Key Details, (CEO, HQ, Revenue, Founded, No. of Employees, Company Type, Website, Business Segment)
Table 103 Toshiba Corporation: Product Benchmarking
Table 104 Toshiba Corporation: Strategic Outlook
Table 105 Metawater Co,Ltd Key Details, (CEO, HQ, Revenue, Founded, No. of Employees, Company Type, Website, Business Segment)
Table 106 Metawater Co,Ltd : Product Benchmarking
Table 107 Industrie De Nora S.p.A. Key Details, (CEO, HQ, Revenue, Founded, No. of Employees, Company Type, Website, Business Segment)
Table 108 Industrie De Nora S.p.A.: Product Benchmarking
Table 109 Industries De Nora S.p.A.: Strategic Outlook
Table 110 Spartan Environmental Technologies Key Details, (CEO, HQ, Revenue, Founded, No. of Employees, Company Type, Website, Business Segment)
Table 111 Spartan Environmental Technologies: Product Benchmarking
Table 112 MKS Instruments, Inc.Key Details, (CEO, HQ, Revenue, Founded, No. of Employees, Company Type, Website, Business Segment)
Table 113 MKS Instruments, Inc: Product Benchmarking
Table 114 MKS Instruments, Inc: Strategic Outlook
Table 115 Teledyne Advanced Pollution Instrumentation Key Details, (CEO, HQ, Revenue, Founded, No. of Employees, Company Type, Website, Business Segment)
Table 116 Teledyne Advanced Pollution Instrumentation: Product Benchmarking
Table 117 Creative Oz-Air (I) Pvt Ltd Key Details, (CEO, HQ, Revenue, Founded, No. of Employees, Company Type, Website, Business Segment)
Table 118 Creative Oz-Air (I) Pvt Ltd: Product Benchmarking
Table 119 Corotec CorporationKey Details, (CEO, HQ, Revenue, Founded, No. of Employees, Company Type, Website, Business Segment)
Table 120 Corotec Corporation: Product Benchmarking
Table 121 Ozonetech Systems OTS AB Key Details, (CEO, HQ, Revenue, Founded, No. of Employees, Company Type, Website, Business Segment)
Table 122 Ozonetech Systems OTS AB: Product Benchmarking
Table 123 Lenntech B.V.Key Details, (CEO, HQ, Revenue, Founded, No. of Employees, Company Type, Website, Business Segment)
Table 124 Lenntech B.V.: Product Benchmarking
Table 125 Chemtronics Technologies Pvt. Ltd. Key Details, (CEO, HQ, Revenue, Founded, No. of Employees, Company Type, Website, Business Segment)
Table 126 Chemtronics Technologies Pvt. Ltd.: Product Benchmarking
Table 127 Faraday Ozone Key Details, (CEO, HQ, Revenue, Founded, No. of Employees, Company Type, Website, Business Segment)
Table 128 Faraday Ozone: Product Benchmarking
List of Figures
Figure 1 Ozone Generator Market Segmentation
Figure 2 Ozone Generator Market by Process: Market Attractiveness Index
Figure 3 Ozone Generator Market by Technology: Market Attractiveness Index
Figure 4 Ozone Generator Market by End-Use: Market Attractiveness Index
Figure 5 Ozone Generator Market by Application: Market Attractiveness Index
Figure 6 Ozone Generator Market Attractiveness Index by Region
Figure 7 Ozone Generator Market: Market Dynamics
Figure 8 Global Ozone Generator Market Forecast by COVID, 2023-2033 (%)
Figure 17 Ozone Generator Market: Porter’s Five Forces Analysis
Figure 18 Ozone Generator Market: PEST Analysis
Figure 19 Ozone Generator Market by Process: Market Attractiveness Index
Figure 21 Global Ozone Generator Market Forecast by Process, 2023-2033 (%)
Figure 23 Process Segment Market Share Forecast by Region, 2023 & 2033 (%)
Figure 25 Process Segment Market Share Forecast by Region, 2023 & 2033 (%)
Figure 27 Process Segment Market Share Forecast by Region, 2023 & 2033 (%)
Figure 28 Ozone Generator Market by Technology: Market Attractiveness Index
Figure 30 Global Ozone Generator Market Forecast by Technology, 2023-2033 (%)
Figure 32 Technology Segment Market Share Forecast by Region, 2023 & 2033 (%)
Figure 34 Technology Segment Market Share Forecast by Region, 2023 & 2033 (%)
Figure 36 Technology Segment Market Share Forecast by Region, 2023 & 2033 (%)
Figure 38 Technology Segment Market Share Forecast by Region, 2023 & 2033 (%)
Figure 39 Ozone Generator Market by End-Use: Market Attractiveness Index
Figure 41 Global Ozone Generator Market Forecast by End-use Industry, 2023-2033 (%)
Figure 43 End-Use Segment Market Share Forecast by Region, 2023 & 2033 (%)
Figure 45 End-Use Segment Market Share Forecast by Region, 2023 & 2033 (%)
Figure 47 End-Use Segment Market Share Forecast by Region, 2023 & 2033 (%)
Figure 49 End-Use Segment Market Share Forecast by Region, 2023 & 2033 (%)
Figure 51 End-Use Segment Market Share Forecast by Region, 2023 & 2033 (%)
Figure 52 Ozone Generator Market by Application: Market Attractiveness Index
Figure 54 Global Ozone Generator Market Forecast by Application, 2023-2033 (%)
Figure 56 Application Segment Market Share Forecast by Region, 2023 & 2033 (%)
Figure 58 Application Segment Market Share Forecast by Region, 2023 & 2033 (%)
Figure 60 Application Segment Market Share Forecast by Region, 2023 & 2033 (%)
Figure 62 Application Segment Market Share Forecast by Region, 2023 & 2033 (%)
Figure 64 Application Segment Market Share Forecast by Region, 2023 & 2033 (%)
Figure 66 Application Segment Market Share Forecast by Region, 2023 & 2033 (%)
Figure 73 Global Ozone Generator Market Forecast by Region, 2023-2033 (%)
Figure 74 North America Ozone Generator Market Attractiveness Index
Figure 75 North America Ozone Generator Market by Country, 2023, 2028 & 2033 (US$ Million)
Figure 78 North America Ozone Generator Market Forecast by Country, 2023-2033 (%)
Figure 80 North America Ozone Generator Market Forecast by Process, 2023-2033 (%)
Figure 82 North America Ozone Generator Market Forecast by Technology, 2023-2033 (%)
Figure 84 North America Ozone Generator Market Forecast by End-use Industry, 2023-2033 (%)
Figure 86 North America Ozone Generator Market Forecast by Application, 2023-2033 (%)
Figure 89 Europe Ozone Generator Market Attractiveness Index
Figure 90 Europe Ozone Generator Market by Region, 2023, 2028 & 2033 (US$ Million)
Figure 93 Europe Ozone Generator Market Forecast by Country, 2023-2033 (%)
Figure 95 Europe Ozone Generator Market Forecast by Process, 2023-2033 (%)
Figure 97 Europe Ozone Generator Market Forecast by Technology, 2023-2033 (%)
Figure 99 Europe Ozone Generator Market Forecast by End-use Industry, 2023-2033 (%)
Figure 101 Europe Ozone Generator Market Forecast by Application, 2023-2033 (%)
Figure 108 Asia-Pacific Ozone Generator Market Attractiveness Index
Figure 109 Asia-Pacific Ozone Generator Market by Region, 2023, 2028 & 2033 (US$ Million)
Figure 112 Asia-Pacific Ozone Generator Market Forecast by Country, 2023-2033 (%)
Figure 114 Asia-Pacific Ozone Generator Market Forecast by Process, 2023-2033 (%)
Figure 116 Asia-Pacific Ozone Generator Market Forecast by Technology, 2023-2033 (%)
Figure 118 Asia-Pacific Ozone Generator Market Forecast by End-use Industry2023-2033 (%)
Figure 120 Asia-Pacific Ozone Generator Market Forecast by Application, 2023-2033 (%)
Figure 127 Middle East & Africa Ozone Generator Market Attractiveness Index
Figure 128 Middle East & Africa Ozone Generator Market by Country, 2023, 2028 & 2033 (US$ Million)
Figure 131 Middle East & Africa Ozone Generator Market Forecast by Country, 2023-2033 (%)
Figure 133 Middle East & Africa Ozone Generator Market Forecast by Process, 2023-2033 (%)
Figure 135 Middle East & Africa Ozone Generator Market Forecast by Technology, 2023-2033 (%)
Figure 139 Middle East & Africa Ozone Generator Market Forecast by Application, 2023-2033 (%)
Figure 143 Latin America Ozone Generator Market Attractiveness Index
Figure 144 Latin America Ozone Generator Market by Country, 2023, 2028 & 2033 (US$ Million)
Figure 147 Latin America Ozone Generator Market Forecast by Country, 2023-2033 (%)
Figure 149 Latin America Ozone Generator Market Forecast by Process, 2023-2033 (%)
Figure 151 Latin America Ozone Generator Market Forecast by Technology, 2023-2033 (%)
Figure 153 Latin America Ozone Generator Market Forecast by End-use Industry, 2023-2033 (%)
Figure 155 Latin America Ozone Generator Market Forecast by Application, 2023-2033 (%)
Figure 159 Ozone Generator Market: Company Share, 2022
Figure 160 Xylem Inc.: Net Revenue, 2018-2022 (US$ Million, AGR%)
Figure 161 Xylem Inc.: R&D, 2018-2022 (US$ Million, AGR%)
Figure 162 Xylem Inc.: Regional Revenue Share, 2022 (%)
Figure 163 Xylem Inc.: Business Segment Revenue Share, 2022 (%)
Figure 164 Mitsubishi Electric Corporation: Net Revenue, 2018-2022 (US$ Million, AGR%)
Figure 165 Mitsubishi Electric Corporation: R&D, 2018-2022 (US$ Million, AGR%)
Figure 166 Mitsubishi Electric Corporation: Regional Revenue Share, 2022 (%)
Figure 167 Mitsubishi Electric Corporation: Business Segment Revenue Share, 2022 (%)
Figure 168 Toshiba Corporation: Net Revenue, 2018-2022 (US$ Million, AGR%)
Figure 169 Toshiba Corporation: R&D, 2018-2022 (US$ Million, AGR%)
Figure 170 Toshiba Corporation: Regional Revenue Share, 2022 (%)
Figure 171 Toshiba Corporation: Business Segment Revenue Share, 2022 (%)
Figure 172 Metawater Co,Ltd : Net Revenue, 2018-2022 (US$ Million, AGR%)
Figure 173 Metawater Co,Ltd : R&D, 2018-2022 (US$ Million, AGR%)
Figure 174 Metawater Co,Ltd : Business Segment Revenue Share, 2022 (%)
Figure 175 MKS Instruments, Inc: Net Revenue, 2018-2022 (US$ Million, AGR%)
Figure 176 MKS Instruments, Inc: R&D, 2018-2022 (US$ Million, AGR%)
Figure 177 MKS Instruments, Inc: Business Segment Revenue Share, 2022 (%)
List of Companies Profiled in the report
Chemtronics Technologies Pvt. Ltd.
Corotec Corporation
Creative Oz-Air (I) Pvt Ltd
Faraday Ozone Products Private Limited
Industrie De Nora S.p.A.
Lenntech B.V.
Metawater Co.,Ltd.
Mitsubishi Electric Corporation
MKS Instruments, Inc.
Ozonetech Systems OTS AB
Spartan Environmental Technologies
Teledyne Advanced Pollution Instrumentation
Toshiba Corporation
Veolia Water Technologies & Solutions
Xylem Inc.
List of Other Companies Mentioned in the report
A2Z Ozone Inc.
Advanced Ozone Solutions
AirSep Corporation
AquaOzone
Aquazone Ozone Solutions
Biozone Corporation
BWT Group
ClearWater Tech
Del Ozone
Ecozone Technologies
ENALY Ozone Generator
Enozo Technologies
Fujian Newland EnTech Co., Ltd.
Genesis Water Technologies
Guangzhou Jiahuan Appliance Technology Co., Ltd.
HyGear B.V.
IN USA, Inc.
International Ozone Technologies Group
MAZZEI Injector Corporation
Metawater Co., Ltd.
Mitsubishi Electric Corporation
Newland EnTech Europe B.V.
OZOMAX Limited
Ozonetech Systems AB
Primozone Production AB
Purezone Ozone Systems
Qingdao Guolin Environmental Technology Co., Ltd.
SUEZ Water Technologies & Solutions
Tianjin Binhai Environmental Protection Technology Co., Ltd.
Toshniwal Instruments (Madras) Pvt. Ltd.
List of Associations Mentioned in the Report
Air & Waste Management Association (AWMA)
American Industrial Hygiene Association (AIHA)
American Society of Heating, Refrigerating and Air-Conditioning Engineers (ASHRAE)
American Water Works Association (AWWA)
Association of Water Technologies (AWT)
Canadian Environmental Technology Verification (ETV) Program
China Association of Environmental Protection Industry (CAEPI)
China Environmental Chamber of Commerce (CECC)
China Water and Wastewater Treatment Association (CWWTA)
Confederation of Indian Industry (CII)
European Water Association (EWA)
Federation of Environmental Trade Associations (FETA)
German Association for Water, Wastewater and Waste (DWA)
Global Aquaculture Alliance (GAA)
Green Building Councils (GBC)
Groundwater Association (GWA)
Indoor Air Quality Association (IAQA)
International Association of Hydrogen Energy (IAHE)
International Ozone Association (IOA)
International Ultraviolet Association (IUVA)
International Association for Water Pollution Research and Control (IAWPRC)
Japan Industrial Ozone Association (JIOA)
National Ground Water Association (NGWA)
National Sanitation Foundation (NSF) International
Ozone Association of India (OAI)
Ozone Association of Southern Africa (OASA)
Ozone Association of Southeast Asia (OASA)
Ozone Association of the Americas (OAA)
Ozone Industry Association (OIA)
Ozone Research and Application Center (ORAC)
Singapore Water Association (SWA)
Society of Environmental Engineers (SEE)
South African Water Quality Association (SAWQA)
Water Environment Federation (WEF)
Water Quality Association (WQA)
World Health Organization (WHO)
World Ozone and Ultraviolet Radiation Data Centre (WOUDC)
World Ozone Day (WOD)
World Water Council (WWC)
World Wide Fund for Nature (WWF)