Growing Prevalence of Infectious Diseases Anticipated to Augur Market Growth
According to the CDC, in the U.S., hospital-acquired infections (HAI) account for over 1.5 million infections & nearly 95,000 associated deaths per year. Molecular diagnostic is critical in the field of infectious disease testing as it provides rapid & successful results. The rising prevalence of infectious diseases & hospital-acquired infections is therefore expected to fuel molecular diagnostics market across the North American region from 2021 to 2031.
Which Factors are Fueling North America Molecular Diagnostics Market Growth?
– Growing Geriatric Population Base
– Increase in Demand for Point-of-Care Facilities
– Growing Prevalence of Target Diseases Such as Genetic, CVDs, and Neurological Diseases
– Introduction of Technologically Advanced Products
Which Factors are Restraining Growth?
– High Prices of Molecular Diagnostics Tests
– Presence of Ambiguous Regulatory Framework to Impede Market Growth
Technological Advancements to Boost Market Growth
According to Visiongain analysis, advancements in technology is projected to boost North American molecular diagnostics industry growth as they provide greater accuracy and are cost-effective. The market is likely to be guided by the launch of MinION, an affordable and compact sequencer that supplies users in small peripheral laboratories and point of care facilities. Also, high demand for over-the-counter diagnostics is expected to help drive market growth in this area. Furthermore, some of the key factors such as advanced cancer diagnostic testing coupled with growing demand for genetic testing is expected to fuel market growth further through 2031.
UNIQUE COVID-19 VARIATIONS– only available in this Visiongain report are dedicated analysis of 4 different rebound scenarios of how the market will develop – no matter how COVID-19 affects the economy.
To access the data contained in this document please email contactus@visiongain.com
How do prominent players strengthen their position throughout the world?
You must read this newly updated report if you are involved in this sector. The report from Visiongain shows you potential revenues up to 2031, evaluate information, trends, opportunities and business outlooks.
Discover how to stay ahead
Our 350+ page report provides 500+ tables and charts/graphs. Read on to discover the most lucrative areas in the industry and the future market prospects. Our new study lets you assess forecasted sales at overall North American market and country level. See financial results, trends, opportunities, and revenue predictions. Much opportunity remains in this growing North America Molecular Diagnostics Market. See how to exploit the opportunities.
Forecasts to 2031 and other analyses reveal the commercial prospects
• In addition to revenue forecasting to 2031, our new study provides you with recent results, growth rates, and market shares.
• You find original analyses, with business outlooks and developments.
• Discover qualitative analyses (including market dynamics, drivers, opportunities, restraints and challenges), SWOT Analysis, PEST Analysis, Porter’s Analysis, product profiles and commercial developments.
Discover sales predictions for the North American market and submarkets
Technology
• Polymerase Chain Reaction
– Multiplex PCR
– Other PCR
• In Situ Hybridization
• Isothermal Nucleic Acid Amplification Technology
• Chips and Microarrays
• Mass Spectrometry
• Sequencing
• Transcription Mediated Amplification
• Others
Application
• Oncology
– Breast Cancer
– Prostate Cancer
– Colorectal Cancer
– Cervical Cancer
– Kidney Cancer
– Liver Cancer
– Blood Cancer
– Lung Cancer
– Other Cancer
• Pharmacogenomics
• Infectious Diseases
– Methicillin-Resistant Staphylococcus Aureus
– Clostridium Difficile
– Vancomycin-Resistant Enterococci
– Carbapenem-Resistant Bacteria
– Flu
– Respiratory Syncytial Virus
– Candida
– Tuberculosis and Drug-Resistant TBA
– Meningitis
– Gastrointestinal Panel Testing
– Chlamydia
– Gonorrhea
– HIV
– Hepatitis C
– Hepatitis B
– Other Infectious Diseases
• Genetic Testing
– Newborn Screening
– Predictive and Presymptomatic Testing
– Other Genetic Testing
• Neurological Disease
• Cardiovascular Diseases
• Microbiology
• Others
Product
• Instruments
• Reagents
Test Location
• Point-of-Care
• Over the Counter
• Central Laboratories
In addition to the revenue predictions for the overall North American market and segments, you will also find revenue forecasts for country by segments as well:
• U.S. Molecular Diagnostics Market
– Revenue Forecasts by Technology
– Revenue Forecasts by Application
– Revenue Forecasts by Product
– Revenue Forecasts by Test Location
• Canada Molecular Diagnostics Market
– Revenue Forecasts by Technology
– Revenue Forecasts by Application
– Revenue Forecasts by Product
– Revenue Forecasts by Test Location
Need industry data? Please contact us today.
Leading companies and the potential for market growth
Overall revenue for North America molecular diagnostics market will surpass $xx million in 2021, our work calculates. We predict strong revenue growth through to 2031. Our work identifies which organizations hold the greatest potential. Discover their capabilities, progress, and commercial prospects, helping you stay ahead.
Prospects for established firms and those seeking to enter the market– including company profiles for 16 of the major companies involved in the North America Molecular Diagnostics Market. Some of the companies profiled in this report include are Roche Diagnostics, Abbott, Becton, Dickinson, and Company, bioMérieux SA, Bio-Rad Laboratories, Inc., Dako (Agilent Technologies), Danaher, FOUNDATION MEDICINE, INC., Genomic Health (Exact Sciences Corporation), Hologic, Inc., Illumina, Inc., HTG Molecular Diagnostics, Inc., Grifols, S.A., QIAGEN, Siemens Healthcare GmbH, and Sysmex Corporation.
Key Questions Answered by this Report:
• What is the current size of the North America Molecular Diagnostics market? How much will this market be worth from 2021 to 2031?
• What are the main drivers and restraints that will shape the North America Molecular Diagnostics market over the next ten years?
• What are the main segments within the North America Molecular Diagnostics market? How much will each of these segments be worth for the period 2021 to 2031? How will the composition of the market change during that time, and why?
• What factors will affect that industry and market over the next ten years?
• What are the largest national markets for the North America Molecular Diagnostics? What is their current status and how will they develop over the next ten years? What are their revenue potentials to 2031?
• How will market shares of the leading national markets change by 2031, and which geographical region will lead the market in 2031?
• Which are the leading companies and what are their activities, results, developments, and prospects?
• What are the main trends that will affect the North America Molecular Diagnostics market between 2021 and 2031?
• What are the main strengths, weaknesses, opportunities, and threats for the market?
• How will the North America Molecular Diagnostics market evolve over the forecasted period, 2021 to 2031?
• How will market shares of prominent national markets change from 2021, and which countries will lead the market in 2031, achieving highest revenues and fastest growth?
Find quantitative and qualitative analyses with independent predictions. Receive information that only our report contains, staying informed with this invaluable business intelligence.
Information found nowhere else
With our newly report title, you are less likely to fall behind in knowledge or miss out on opportunities. See how our work could benefit your research, analyses, and decisions.
Visiongain’s study is intended for everybody needing commercial analyses for the North America Molecular Diagnostics Market and leading companies. You will find data, trends and predictions.
To access the data contained in this document please email contactus@visiongain.com
Buy our report today North American Molecular Diagnostics (MDx) Market Report 2021-2031: Forecasts by Technology (Polymerase Chain Reaction, In Situ Hybridization, Isothermal Nucleic Acid Amplification Technology, Chips and Microarrays, Mass Spectrometry, Sequencing, Transcription Mediated Amplification, Others), by Application (Oncology, Pharmacogenomics, Infectious Diseases, Genetic Testing, Neurological Disease, Cardiovascular Diseases, Microbiology, Others), by Product (Instruments, Reagents), Test Location (Point-of-Care, Over the Counter, Central Laboratories), by Country (USA, Canada) PLUS Analysis of Leading MDx Companies AND COVID-19 Recovery Scenarios. Avoid missing out by staying informed – order our report now.
Visiongain is a trading partner with the US Federal Government
CCR Ref number: KD4R6
Do you have any custom requirements we can help you with? Any need for a specific country, geo region, market segment or specific company information? Contact us today, we can discuss your needs and see how we can help: sara.peerun@visiongain.com
1. Report Overview
1.1 Introduction to Molecular Diagnostics Market
1.2 Molecular Diagnostics Market Definition
1.3 Why You Should Read This Report
1.4 What This Report Delivers
1.5 Key Questions Answered By This Analytical Report Include:
1.6 Who is This Report For?
1.7 Methodology
1.7.1 COVID-19 Impact: Recovery Scenarios
1.7.2 Market Evaluation & Forecasting Methodology
1.8 Frequently Asked Questions (FAQs)
1.9 Associated Visiongain Reports
1.10 About Visiongain
2 Executive Summary
3 Market Dynamics
3.1 Drivers
3.1.1 Growing Geriatric Population Base
3.1.2 Increase in Demand for Point-of-Care Facilities
3.1.3 Growing Prevalence of Target Diseases Such as Genetic, CVDs, Neurological Diseases etc.
3.2 Restraints
3.2.1 High Prices of Molecular Diagnostics Tests
3.2.2 Presence of Ambiguous Regulatory Framework to Impede Market Growth
3.3 Opportunities
3.3.1 Technological Advancements to Pave Way for Fresh Revenue Pockets
3.3.2 Growing Demand from Emerging Economies to Offer Lucrative Growth Opportunities
3.3.3 Increase in the Adoption of Automation and Multiplexing of Technologies
3.4 SWOT Analysis
3.4.1 Strengths
3.4.2 Weaknesses
3.4.3 Opportunities
3.4.4 Threats
3.5 Industry analysis - Porter’s
3.5.1 Buyer Power
3.5.2 Supplier Power
3.5.3 Competitive Rivalry
3.5.4 Threat of Substitute
3.5.5 Threat of New Entrants
3.6 Industry analysis – PEST Analysis
3.6.1 Political Factors Impacting Molecular Diagnostics Market
3.6.2 Economic Factors Impacting Molecular Diagnostics Market
3.6.3 Social Factors Impacting Molecular Diagnostics Market
3.6.4 Technological Factors Impacting Molecular Diagnostics Market
4 North America Molecular Diagnostics Market by Technology
4.1 Polymerase Chain Reaction Segment Market Forecast, 2021-2031
4.1.1 Technological Advancements to Fuel PCR Segment Growth
4.1.2 Polymerase Chain Reaction Market by Sub-Segment, 2021-2031
4.1.3 Recovery Scenarios (V, U, W, L)
4.2 In Situ Hybridization Segment Market Forecast, 2021-2031
4.2.1 Increasing Incidence of Genetic Disorder and Cancer to Boost ISH Market Growth
4.2.2 Recovery Scenarios (V, U, W, L)
4.3 Isothermal Nucleic Acid Amplification Technology Segment Market Forecast, 2021-2031
4.3.1 Rising Prevalence of Infectious Disease to Drive INAAT Market Growth
4.3.2 Recovery Scenarios (V, U, W, L)
4.4 Chips and Microarrays Segment Market Forecast, 2021-2031
4.4.1 Increasing Usage in Basic Molecular Biology to Drive Segmental Growth
4.4.2 Recovery Scenarios (V, U, W, L)
4.5 Mass Spectrometry Segment Market Forecast, 2021-2031
4.5.1 Multidimensional Analysis and Evaluation of Impurities During Drug Development Process Fuelling Market Growth
4.5.2 Recovery Scenarios (V, U, W, L)
4.6 Sequencing Segment Market Forecast, 2021-2031
4.6.1 Sequencing Segment to Offer Massive Advances in Diagnosis, Prognosis and Treatment of Disease
4.6.2 Recovery Scenarios (V, U, W, L)
4.7 Transcription Mediated Amplification Segment Market Forecast, 2021-2031
4.7.1 Recovery Scenarios (V, U, W, L)
4.8 Others Segment Market Forecast, 2021-2031
4.8.1 Recovery Scenarios (V, U, W, L)
5 North America Molecular Diagnostics Market by Application
5.1 Oncology Segment Market Forecast, 2021-2031
5.1.1 Rising Prevalence of Cancer to Propel Market Growth
5.1.2 Oncology Market by Sub-Segment, 2021-2031
5.1.3 Recovery Scenarios (V, U, W, L)
5.2 Pharmacogenomics Segment Market Forecast, 2021-2031
5.2.1 Increasing Importance Across Emerging Economies to Fuel Pharmacogenomics Market Growth
5.2.2 Recovery Scenarios (V, U, W, L)
5.3 Infectious Diseases Segment Market Forecast, 2021-2031
5.3.1 Technological Advancements to Propel Usage of Molecular Diagnostics for Infectious Diseases
5.3.2 Infectious Diseases Market by Sub-Segment, 2021-2031
5.3.3 Recovery Scenarios (V, U, W, L)
5.4 Genetic Testing Segment Market Forecast, 2021-2031
5.4.1 Genetic Testing Has Led to Expansion of Molecular Techniques Withing Clinical Laboratories
5.4.2 Genetic Testing Market by Sub-Segment, 2021-2031
5.4.3 Recovery Scenarios (V, U, W, L)
5.5 Neurological Disease Segment Market Forecast, 2021-2031
5.5.1 Molecular Diagnostics for Infectious Diseases to Witness Significant Growth
5.5.2 Recovery Scenarios (V, U, W, L)
5.6 Cardiovascular Diseases Segment Market Forecast, 2021-2031
5.6.1 Growing Burden of CVDs Across Emerging Economies to Fuel Segmental Market Growth
5.6.2 Recovery Scenarios (V, U, W, L)
5.7 Microbiology Segment Market Forecast, 2021-2031
5.7.1 Technological Advancements Fuelling Microbiology Segment Growth
5.7.2 Recovery Scenarios (V, U, W, L)
5.8 Others Segment Market Forecast, 2021-2031
5.8.1 Recovery Scenarios (V, U, W, L)
6 North America Molecular Diagnostics Market by Product
6.1 Instruments Segment Market Forecast, 2021-2031
6.1.1 Strong Demand from Emerging Economies for Advanced Instruments
6.1.2 Recovery Scenarios (V, U, W, L)
6.2 Reagents Segment Market Forecast, 2021-2031
6.2.1 Reagents Segment Accounts for Majority of the Market Share
6.2.2 Recovery Scenarios (V, U, W, L)
7 North America Molecular Diagnostics Market by Test Location
7.1 Point-of-Care Segment Market Forecast, 2021-2031
7.1.1 Recovery Scenarios (V, U, W, L)
7.2 Over the Counter Segment Market Forecast, 2021-2031
7.2.1 Recovery Scenarios (V, U, W, L)
7.3 Central Laboratories Segment Market Forecast, 2021-2031
7.3.1 Recovery Scenarios (V, U, W, L)
8 North America Molecular Diagnostics Market by Country
8.1 Largest Molecular Diagnostics Market Globally
8.2 North America Molecular Diagnostics Market by Country, Forecast 2021-2031
8.3 U.S. Molecular Diagnostics Market Forecast by Technology
8.3.1 Recovery Scenarios (V, U, W, L)
8.4 U.S. Molecular Diagnostics Market Forecast by Application
8.4.1 Recovery Scenarios (V, U, W, L)
8.5 U.S. Molecular Diagnostics Market Forecast by Product
8.5.1 Recovery Scenarios (V, U, W, L)
8.6 U.S. Molecular Diagnostics Market Forecast by Test Location
8.6.1 Recovery Scenarios (V, U, W, L)
8.7 U.S. Molecular Diagnostics Market Forecast, 2021-2031
8.7.1 U.S. Accounts for Majority of the North American Molecular Diagnostics Market
8.7.2 Recovery Scenarios (V, U, W, L): U.S. Molecular Diagnostics Market Forecast, 2021-2031
8.8 Canada Molecular Diagnostics Market Forecast by Technology
8.8.1 Recovery Scenarios (V, U, W, L)
8.9 Canada Molecular Diagnostics Market Forecast by Application
8.9.1 Recovery Scenarios (V, U, W, L)
8.10 Canada Molecular Diagnostics Market Forecast by Product
8.10.1 Recovery Scenarios (V, U, W, L)
8.11 Canada Molecular Diagnostics Market Forecast by Test Location
8.11.1 Recovery Scenarios (V, U, W, L)
8.12 Canada Molecular Diagnostics Market Forecast, 2021-2031
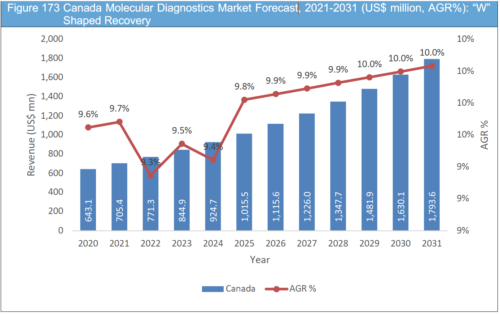
8.12.1 Rising Investments by Government to Spur Regional Market Growth
8.12.2 Recovery Scenarios (V, U, W, L): Canada Molecular Diagnostics Market Forecast, 2021-2031
9 Company Profiles
9.1 Roche Diagnostics
9.1.1 Company Snapshot
9.1.2 Company Overview
9.1.3 Financial Analysis
9.1.3.1 Net Revenue, 2015-2019
9.1.3.2 R&D Expenses, 2015-2019
9.1.3.3 Gross Profit, 2015-2019
9.1.3.4 Net Income, 2015-2019
9.1.3.5 EBDITA, 2015-2019
9.1.4 Product Benchmarking
9.1.5 Recent Developments, 2017-2020
9.2 Abbott
9.2.1 Company Snapshot
9.2.2 Company Overview
9.2.3 Financial Analysis
9.2.3.1 Net Revenue, 2015-2019
9.2.3.2 R&D Expenses, 2015-2019
9.2.3.3 Gross Profit, 2015-2019
9.2.3.4 Net Income, 2015-2019
9.2.3.5 EBDITA, 2015-2019
9.2.4 Product Benchmarking
9.3 Becton, Dickinson and Company
9.3.1 Company Snapshot
9.3.2 Company Overview
9.3.3 Financial Analysis
9.3.3.1 Net Revenue, 2015-2020
9.3.3.2 R&D Expenses, 2015-2020
9.3.3.3 Gross Profit, 2015-2020
9.3.3.4 Net Income, 2015-2020
9.3.3.5 EBDITA, 2015-2020
9.3.4 Product Benchmarking
9.3.5 Recent Developments, 2017-2020
9.4 bioMérieux SA
9.4.1 Company Snapshot
9.4.2 Company Overview
9.4.3 Financial Analysis
9.4.3.1 Net Revenue, 2016-2019
9.4.3.2 R&D Expenses, 2015-2019
9.4.3.3 Gross Profit, 2015-2019
9.4.3.4 Net Income, 2016-2019
9.4.3.5 EBDITA, 2015-2019
9.4.4 Product Benchmarking
9.4.5 Recent Developments, 2017-2020
9.5 Bio-Rad Laboratories, Inc.
9.5.1 Company Snapshot
9.5.2 Company Overview
9.5.3 Financial Analysis
9.5.3.1 Net Revenue, 2015-2019
9.5.3.2 R&D Expenses, 2015-2019
9.5.3.3 Gross Profit, 2015-2019
9.5.3.4 Net Income, 2015-2019
9.5.3.5 EBDITA, 2015-2019
9.5.4 Product Benchmarking
9.5.5 Recent Developments, 2017-2020
9.6 Dako (Agilent Technologies)
9.6.1 Company Snapshot
9.6.2 Company Overview
9.6.3 Financial Analysis
9.6.3.1 Net Revenue, 2015-2020
9.6.3.2 R&D Expenses, 2015-2020
9.6.3.3 Gross Profit, 2015-2020
9.6.3.4 Net Income, 2015-2020
9.6.3.5 EBDITA, 2015-2020
9.6.4 Product Benchmarking
9.6.5 Recent Developments, 2017-2020
9.7 Danaher
9.7.1 Company Snapshot
9.7.2 Company Overview
9.7.3 Financial Analysis
9.7.3.1 Net Revenue, 2015-2019
9.7.3.2 R&D Expenses, 2015-2019
9.7.3.3 Gross Profit, 2015-2019
9.7.3.4 Net Income, 2015-2019
9.7.3.5 EBDITA, 2015-2019
9.7.4 Product Benchmarking
9.8 FOUNDATION MEDICINE, INC.
9.8.1 Company Snapshot
9.8.2 Company Overview
9.8.3 Product Benchmarking
9.8.4 Recent Developments, 2017-2020
9.9 Genomic Health (Exact Sciences Corporation)
9.9.1 Company Snapshot
9.9.2 Company Overview
9.9.3 Financial Analysis
9.9.3.1 Net Revenue, 2015-2019
9.9.3.2 R&D Expenses, 2015-2019
9.9.3.3 Gross Profit, 2015-2019
9.9.3.4 Net Income, 2015-2019
9.9.3.5 EBDITA, 2015-2019
9.9.4 Product Benchmarking
9.9.5 Recent Developments, 2017-2020
9.10 Hologic, Inc.
9.10.1 Company Snapshot
9.10.2 Company Overview
9.10.3 Financial Analysis
9.10.3.1 Net Revenue, 2015-2020
9.10.3.2 R&D Expenses, 2015-2020
9.10.3.3 Gross Profit, 2015-2020
9.10.3.4 Net Income, 2015-2020
9.10.3.5 EBDITA, 2015-2020
9.10.4 Product Benchmarking
9.10.5 Recent Developments, 2017-2020
9.11 Illumina, Inc.
9.11.1 Company Snapshot
9.11.2 Company Overview
9.11.3 Financial Analysis
9.11.3.1 Net Revenue, 2015-2019
9.11.3.2 R&D Expenses, 2015-2019
9.11.3.3 Gross Profit, 2015-2019
9.11.3.4 Net Income, 2015-2019
9.11.3.5 EBDITA, 2015-2019
9.11.4 Product Benchmarking
9.11.5 Recent Developments, 2017-2020
9.12 HTG Molecular Diagnostics, Inc.
9.12.1 Company Snapshot
9.12.2 Company Overview
9.12.3 Financial Analysis
9.12.3.1 Net Revenue, 2015-2019
9.12.3.2 R&D Expenses, 2015-2019
9.12.3.3 Gross Profit, 2015-2019
9.12.3.4 Net Income, 2015-2019
9.12.3.5 EBDITA, 2015-2019
9.12.4 Product Benchmarking
9.12.5 Recent Developments, 2017-2020
9.13 Grifols, S.A.
9.13.1 Company Snapshot
9.13.2 Company Overview
9.13.3 Financial Analysis
9.13.3.1 Net Revenue, 2015-2019
9.13.3.2 R&D Expenses, 2015-2019
9.13.3.3 Gross Profit, 2015-2019
9.13.3.4 Net Income, 2015-2019
9.13.3.5 EBDITA, 2015-2019
9.13.4 Product Benchmarking
9.13.5 Recent Developments, 2017-2020
9.14 QIAGEN
9.14.1 Company Snapshot
9.14.2 Company Overview
9.14.3 Financial Analysis
9.14.3.1 Net Revenue, 2015-2019
9.14.3.2 R&D Expenses, 2015-2019
9.14.3.3 Gross Profit, 2015-2019
9.14.3.4 Net Income, 2015-2019
9.14.3.5 EBDITA, 2015-2019
9.14.4 Product Benchmarking
9.14.5 Recent Developments, 2017-2020
9.15 Siemens Healthcare GmbH
9.15.1 Company Snapshot
9.15.2 Company Overview
9.15.3 Financial Analysis
9.15.3.1 Net Revenue, 2015-2020
9.15.3.2 R&D Expenses, 2015-2020
9.15.3.3 Gross Profit, 2015-2020
9.15.3.4 Net Income, 2015-2020
9.15.3.5 EBDITA, 2015-2020
9.15.4 Product Benchmarking
9.16 Sysmex Corporation
9.16.1 Company Snapshot
9.16.2 Company Overview
9.16.3 Financial Analysis
9.16.3.1 Net Revenue, 2016-2020
9.16.3.2 Gross Profit, 2016-2020
9.16.3.3 Net Income, 2016-2020
9.16.3.4 EBDITA, 2016-2020
9.16.4 Product Benchmarking
9.16.5 Recent Developments, 2017-2020
10 Conclusion and Recommendations
10.1 Concluding Remarks
10.2 Recommendations
List of Tables
Table 1 Global Molecular Diagnostics Market Snapshot, 2020 & 2030 (US$ million, CAGR %)
Table 2 North America Molecular Diagnostics Market Forecast by Technology 2021-2031 (US$ mn, AGR%, CAGR%)
Table 3 North America Molecular Diagnostics Market Forecast for Polymerase Chain Reaction Segment, 2021-2031 (US$ Mn, AGR%, CAGR%)
Table 4 North America Molecular Diagnostics Market Forecast by PCR, 2021-2031 (US$ mn, AGR%, CAGR%)
Table 5 North America Molecular Diagnostics Market Forecast for Polymerase Chain Reaction Segment, 2021-2031 (US$ Mn, AGR%, CAGR%): "V" Shaped Recovery
Table 6 North America Molecular Diagnostics Market Forecast for Polymerase Chain Reaction Segment, 2021-2031 (US$ Mn, AGR%, CAGR%): "U" Shaped Recovery
Table 7 North America Molecular Diagnostics Market Forecast for Polymerase Chain Reaction Segment, 2021-2031 (US$ Mn, AGR%, CAGR%): "W" Shaped Recovery
Table 8 North America Molecular Diagnostics Market Forecast for Polymerase Chain Reaction Segment, 2021-2031 (US$ Mn, AGR%, CAGR%): "L" Shaped Recovery
Table 9 North America Molecular Diagnostics Market Forecast for In Situ Hybridization Segment, 2021-2031 (US$ Mn, AGR%, CAGR%)
Table 10 North America Molecular Diagnostics Market Forecast for In Situ Hybridization Segment, 2021-2031 (US$ Mn, AGR%, CAGR%): "V" Shaped Recovery
Table 11 North America Molecular Diagnostics Market Forecast for In Situ Hybridization Segment, 2021-2031 (US$ Mn, AGR%, CAGR%): "U" Shaped Recovery
Table 12 North America Molecular Diagnostics Market Forecast for In Situ Hybridization Segment, 2021-2031 (US$ Mn, AGR%, CAGR%): "W" Shaped Recovery
Table 13 North America Molecular Diagnostics Market Forecast for In Situ Hybridization Segment, 2021-2031 (US$ Mn, AGR%, CAGR%): "L" Shaped Recovery
Table 14 North America Molecular Diagnostics Market Forecast for Isothermal Nucleic Acid Amplification Technology Segment, 2021-2031 (US$ Mn, AGR%, CAGR%)
Table 15 North America Molecular Diagnostics Market Forecast for Isothermal Nucleic Acid Amplification Technology Segment, 2021-2031 (US$ Mn, AGR%, CAGR%): "V" Shaped Recovery
Table 16 North America Molecular Diagnostics Market Forecast for Isothermal Nucleic Acid Amplification Technology Segment, 2021-2031 (US$ Mn, AGR%, CAGR%): "U" Shaped Recovery
Table 17 North America Molecular Diagnostics Market Forecast for Isothermal Nucleic Acid Amplification Technology Segment, 2021-2031 (US$ Mn, AGR%, CAGR%): "W" Shaped Recovery
Table 18 North America Molecular Diagnostics Market Forecast for Isothermal Nucleic Acid Amplification Technology Segment, 2021-2031 (US$ Mn, AGR%, CAGR%): "L" Shaped Recovery
Table 19 North America Molecular Diagnostics Market Forecast for Chips and Microarrays Segment, 2021-2031 (US$ Mn, AGR%, CAGR%)
Table 20 North America Molecular Diagnostics Market Forecast for Chips and Microarrays Segment, 2021-2031 (US$ Mn, AGR%, CAGR%): "V" Shaped Recovery
Table 21 North America Molecular Diagnostics Market Forecast for Chips and Microarrays Segment, 2021-2031 (US$ Mn, AGR%, CAGR%): "U" Shaped Recovery
Table 22 North America Molecular Diagnostics Market Forecast for Chips and Microarrays Segment, 2021-2031 (US$ Mn, AGR%, CAGR%): "W" Shaped Recovery
Table 23 North America Molecular Diagnostics Market Forecast for Chips and Microarrays Segment, 2021-2031 (US$ Mn, AGR%, CAGR%): "L" Shaped Recovery
Table 24 North America Molecular Diagnostics Market Forecast for Mass Spectrometry Segment, 2021-2031 (US$ Mn, AGR%, CAGR%)
Table 25 North America Molecular Diagnostics Market Forecast for Mass Spectrometry Segment, 2021-2031 (US$ Mn, AGR%, CAGR%): "V" Shaped Recovery
Table 26 North America Molecular Diagnostics Market Forecast for Mass Spectrometry Segment, 2021-2031 (US$ Mn, AGR%, CAGR%): "U" Shaped Recovery
Table 27 North America Molecular Diagnostics Market Forecast for Mass Spectrometry Segment, 2021-2031 (US$ Mn, AGR%, CAGR%): "W" Shaped Recovery
Table 28 North America Molecular Diagnostics Market Forecast for Mass Spectrometry Segment, 2021-2031 (US$ Mn, AGR%, CAGR%): "L" Shaped Recovery
Table 29 North America Molecular Diagnostics Market Forecast for Sequencing Segment, 2021-2031 (US$ Mn, AGR%, CAGR%)
Table 30 North America Molecular Diagnostics Market Forecast for Sequencing Segment, 2021-2031 (US$ Mn, AGR%, CAGR%): "V" Shaped Recovery
Table 31 North America Molecular Diagnostics Market Forecast for Sequencing Segment, 2021-2031 (US$ Mn, AGR%, CAGR%): "U" Shaped Recovery
Table 32 North America Molecular Diagnostics Market Forecast for Sequencing Segment, 2021-2031 (US$ Mn, AGR%, CAGR%): "W" Shaped Recovery
Table 33 North America Molecular Diagnostics Market Forecast for Sequencing Segment, 2021-2031 (US$ Mn, AGR%, CAGR%): "L" Shaped Recovery
Table 34 North America Molecular Diagnostics Market Forecast for Transcription Mediated Amplification Segment, 2021-2031 (US$ Mn, AGR%, CAGR%)
Table 35 North America Molecular Diagnostics Market Forecast for Transcription Mediated Amplification Segment, 2021-2031 (US$ Mn, AGR%, CAGR%): "V" Shaped Recovery
Table 36 North America Molecular Diagnostics Market Forecast for Transcription Mediated Amplification Segment, 2021-2031 (US$ Mn, AGR%, CAGR%): "U" Shaped Recovery
Table 37 North America Molecular Diagnostics Market Forecast for Transcription Mediated Amplification Segment, 2021-2031 (US$ Mn, AGR%, CAGR%): "W" Shaped Recovery
Table 38 North America Molecular Diagnostics Market Forecast for Transcription Mediated Amplification Segment, 2021-2031 (US$ Mn, AGR%, CAGR%): "L" Shaped Recovery
Table 39 North America Molecular Diagnostics Market Forecast for Others Segment, 2021-2031 (US$ Mn, AGR%, CAGR%)
Table 40 North America Molecular Diagnostics Market Forecast for Others Segment, 2021-2031 (US$ Mn, AGR%, CAGR%): "V" Shaped Recovery
Table 41 North America Molecular Diagnostics Market Forecast for Others Segment, 2021-2031 (US$ Mn, AGR%, CAGR%): "U" Shaped Recovery
Table 42 North America Molecular Diagnostics Market Forecast for Others Segment, 2021-2031 (US$ Mn, AGR%, CAGR%): "W" Shaped Recovery
Table 43 North America Molecular Diagnostics Market Forecast for Others Segment, 2021-2031 (US$ Mn, AGR%, CAGR%): "L" Shaped Recovery
Table 44 North America Molecular Diagnostics Market Forecast by Application 2021-2031 (US$ mn, AGR%, CAGR%)
Table 45 North America Molecular Diagnostics Market Forecast for Oncology Segment, 2021-2031 (US$ Mn, AGR%, CAGR%)
Table 46 North America Molecular Diagnostics Market Forecast by Oncology, 2021-2031 (US$ mn, AGR%, CAGR%)
Table 47 North America Molecular Diagnostics Market Forecast for Oncology Segment, 2021-2031 (US$ Mn, AGR%, CAGR%): "V" Shaped Recovery
Table 48 North America Molecular Diagnostics Market Forecast for Oncology Segment, 2021-2031 (US$ Mn, AGR%, CAGR%): "U" Shaped Recovery
Table 49 North America Molecular Diagnostics Market Forecast for Oncology Segment, 2021-2031 (US$ Mn, AGR%, CAGR%): "W" Shaped Recovery
Table 50 North America Molecular Diagnostics Market Forecast for Oncology Segment, 2021-2031 (US$ Mn, AGR%, CAGR%): "L" Shaped Recovery
Table 51 North America Molecular Diagnostics Market Forecast for Pharmacogenomics Segment, 2021-2031 (US$ Mn, AGR%, CAGR%)
Table 52 North America Molecular Diagnostics Market Forecast for Pharmacogenomics Segment, 2021-2031 (US$ Mn, AGR%, CAGR%): "V" Shaped Recovery
Table 53 North America Molecular Diagnostics Market Forecast for Pharmacogenomics Segment, 2021-2031 (US$ Mn, AGR%, CAGR%): "U" Shaped Recovery
Table 54 North America Molecular Diagnostics Market Forecast for Pharmacogenomics Segment, 2021-2031 (US$ Mn, AGR%, CAGR%): "W" Shaped Recovery
Table 55 North America Molecular Diagnostics Market Forecast for Pharmacogenomics Segment, 2021-2031 (US$ Mn, AGR%, CAGR%): "L" Shaped Recovery
Table 56 North America Molecular Diagnostics Market Forecast for Infectious Diseases Segment, 2021-2031 (US$ Mn, AGR%, CAGR%)
Table 57 North America Molecular Diagnostics Market Forecast by Infectious Diseases, 2021-2031 (US$ mn, AGR%, CAGR%)
Table 58 North America Molecular Diagnostics Market Forecast for Infectious Diseases Segment, 2021-2031 (US$ Mn, AGR%, CAGR%): "V" Shaped Recovery
Table 59 North America Molecular Diagnostics Market Forecast for Infectious Diseases Segment, 2021-2031 (US$ Mn, AGR%, CAGR%): "U" Shaped Recovery
Table 60 North America Molecular Diagnostics Market Forecast for Infectious Diseases Segment, 2021-2031 (US$ Mn, AGR%, CAGR%): "W" Shaped Recovery
Table 61 North America Molecular Diagnostics Market Forecast for Infectious Diseases Segment, 2021-2031 (US$ Mn, AGR%, CAGR%): "L" Shaped Recovery
Table 62 North America Molecular Diagnostics Market Forecast for Genetic Testing Segment, 2021-2031 (US$ Mn, AGR%, CAGR%)
Table 63 North America Molecular Diagnostics Market Forecast by Genetic Testing 2021-2031 (US$ mn, AGR%, CAGR%)
Table 64 North America Molecular Diagnostics Market Forecast for Genetic Testing Segment, 2021-2031 (US$ Mn, AGR%, CAGR%): "V" Shaped Recovery
Table 65 North America Molecular Diagnostics Market Forecast for Genetic Testing Segment, 2021-2031 (US$ Mn, AGR%, CAGR%): "U" Shaped Recovery
Table 66 North America Molecular Diagnostics Market Forecast for Genetic Testing Segment, 2021-2031 (US$ Mn, AGR%, CAGR%): "W" Shaped Recovery
Table 67 North America Molecular Diagnostics Market Forecast for Genetic Testing Segment, 2021-2031 (US$ Mn, AGR%, CAGR%): "L" Shaped Recovery
Table 68 North America Molecular Diagnostics Market Forecast for Neurological Diseases Segment, 2021-2031 (US$ Mn, AGR%, CAGR%)
Table 69 North America Molecular Diagnostics Market Forecast for Neurological Diseases Segment, 2021-2031 (US$ Mn, AGR%, CAGR%): "V" Shaped Recovery
Table 70 North America Molecular Diagnostics Market Forecast for Neurological Diseases Segment, 2021-2031 (US$ Mn, AGR%, CAGR%): "U" Shaped Recovery
Table 71 North America Molecular Diagnostics Market Forecast for Neurological Diseases Segment, 2021-2031 (US$ Mn, AGR%, CAGR%): "W" Shaped Recovery
Table 72 North America Molecular Diagnostics Market Forecast for Neurological Diseases Segment, 2021-2031 (US$ Mn, AGR%, CAGR%): "L" Shaped Recovery
Table 73 North America Molecular Diagnostics Market Forecast for Cardiovascular Diseases Segment, 2021-2031 (US$ Mn, AGR%, CAGR%)
Table 74 North America Molecular Diagnostics Market Forecast for Cardiovascular Diseases Segment, 2021-2031 (US$ Mn, AGR%, CAGR%): "V" Shaped Recovery
Table 75 North America Molecular Diagnostics Market Forecast for Cardiovascular Diseases Segment, 2021-2031 (US$ Mn, AGR%, CAGR%): "U" Shaped Recovery
Table 76 North America Molecular Diagnostics Market Forecast for Cardiovascular Diseases Segment, 2021-2031 (US$ Mn, AGR%, CAGR%): "W" Shaped Recovery
Table 77 North America Molecular Diagnostics Market Forecast for Cardiovascular Diseases Segment, 2021-2031 (US$ Mn, AGR%, CAGR%): "L" Shaped Recovery
Table 78 North America Molecular Diagnostics Market Forecast for Microbiology Segment, 2021-2031 (US$ Mn, AGR%, CAGR%)
Table 79 North America Molecular Diagnostics Market Forecast for Microbiology Segment, 2021-2031 (US$ Mn, AGR%, CAGR%): "V" Shaped Recovery
Table 80 North America Molecular Diagnostics Market Forecast for Microbiology Segment, 2021-2031 (US$ Mn, AGR%, CAGR%): "U" Shaped Recovery
Table 81 North America Molecular Diagnostics Market Forecast for Microbiology Segment, 2021-2031 (US$ Mn, AGR%, CAGR%): "W" Shaped Recovery
Table 82 North America Molecular Diagnostics Market Forecast for Microbiology Segment, 2021-2031 (US$ Mn, AGR%, CAGR%): "L" Shaped Recovery
Table 83 North America Molecular Diagnostics Market Forecast for Others Segment, 2021-2031 (US$ Mn, AGR%, CAGR%)
Table 84 North America Molecular Diagnostics Market Forecast for Others Segment, 2021-2031 (US$ Mn, AGR%, CAGR%): "V" Shaped Recovery
Table 85 North America Molecular Diagnostics Market Forecast for Others Segment, 2021-2031 (US$ Mn, AGR%, CAGR%): "U" Shaped Recovery
Table 86 North America Molecular Diagnostics Market Forecast for Others Segment, 2021-2031 (US$ Mn, AGR%, CAGR%): "W" Shaped Recovery
Table 87 North America Molecular Diagnostics Market Forecast for Others Segment, 2021-2031 (US$ Mn, AGR%, CAGR%): "L" Shaped Recovery
Table 88 North America Molecular Diagnostics Market Forecast by Product 2021-2031 (US$ mn, AGR%, CAGR%)
Table 89 North America Molecular Diagnostics Market Forecast for Instruments Segment, 2021-2031 (US$ Mn, AGR%, CAGR%)
Table 90 North America Molecular Diagnostics Market Forecast for Instruments Segment, 2021-2031 (US$ Mn, AGR%, CAGR%): "V" Shaped Recovery
Table 91 North America Molecular Diagnostics Market Forecast for Instruments Segment, 2021-2031 (US$ Mn, AGR%, CAGR%): "U" Shaped Recovery
Table 92 North America Molecular Diagnostics Market Forecast for Instruments Segment, 2021-2031 (US$ Mn, AGR%, CAGR%): "W" Shaped Recovery
Table 93 North America Molecular Diagnostics Market Forecast for Instruments Segment, 2021-2031 (US$ Mn, AGR%, CAGR%): "L" Shaped Recovery
Table 94 North America Molecular Diagnostics Market Forecast for Reagents Segment, 2021-2031 (US$ Mn, AGR%, CAGR%)
Table 95 North America Molecular Diagnostics Market Forecast for Reagents Segment, 2021-2031 (US$ Mn, AGR%, CAGR%): "V" Shaped Recovery
Table 96 North America Molecular Diagnostics Market Forecast for Reagents Segment, 2021-2031 (US$ Mn, AGR%, CAGR%): "U" Shaped Recovery
Table 97 North America Molecular Diagnostics Market Forecast for Reagents Segment, 2021-2031 (US$ Mn, AGR%, CAGR%): "W" Shaped Recovery
Table 98 North America Molecular Diagnostics Market Forecast for Reagents Segment, 2021-2031 (US$ Mn, AGR%, CAGR%): "L" Shaped Recovery
Table 99 North America Molecular Diagnostics Market Forecast by Test Location 2021-2031 (US$ mn, AGR%, CAGR%)
Table 100 North America Molecular Diagnostics Market Forecast for Point of Care Segment, 2021-2031 (US$ Mn, AGR%, CAGR%)
Table 101 North America Molecular Diagnostics Market Forecast for Point of Care Segment, 2021-2031 (US$ Mn, AGR%, CAGR%): "V" Shaped Recovery
Table 102 North America Molecular Diagnostics Market Forecast for Point of Care Segment, 2021-2031 (US$ Mn, AGR%, CAGR%): "U" Shaped Recovery
Table 103 North America Molecular Diagnostics Market Forecast for Point of Care Segment, 2021-2031 (US$ Mn, AGR%, CAGR%): "W" Shaped Recovery
Table 104 North America Molecular Diagnostics Market Forecast for Point of Care Segment, 2021-2031 (US$ Mn, AGR%, CAGR%): "L" Shaped Recovery
Table 105 North America Molecular Diagnostics Market Forecast for Over the Counter Segment, 2021-2031 (US$ Mn, AGR%, CAGR%)
Table 106 North America Molecular Diagnostics Market Forecast for Over the Counter Segment, 2021-2031 (US$ Mn, AGR%, CAGR%): "V" Shaped Recovery
Table 107 North America Molecular Diagnostics Market Forecast for Over the Counter Segment, 2021-2031 (US$ Mn, AGR%, CAGR%): "U" Shaped Recovery
Table 108 North America Molecular Diagnostics Market Forecast for Over the Counter Segment, 2021-2031 (US$ Mn, AGR%, CAGR%): "W" Shaped Recovery
Table 109 North America Molecular Diagnostics Market Forecast for Over the Counter Segment, 2021-2031 (US$ Mn, AGR%, CAGR%): "L" Shaped Recovery
Table 110 North America Molecular Diagnostics Market Forecast for Central Laboratories, 2021-2031 (US$ Mn, AGR%, CAGR%)
Table 111 North America Molecular Diagnostics Market Forecast for Central Laboratories, 2021-2031 (US$ Mn, AGR%, CAGR%): "V" Shaped Recovery
Table 112 North America Molecular Diagnostics Market Forecast for Central Laboratories, 2021-2031 (US$ Mn, AGR%, CAGR%): "U" Shaped Recovery
Table 113 North America Molecular Diagnostics Market Forecast for Central Laboratories, 2021-2031 (US$ Mn, AGR%, CAGR%): "W" Shaped Recovery
Table 114 North America Molecular Diagnostics Market Forecast for Central Laboratories, 2021-2031 (US$ Mn, AGR%, CAGR%): "L" Shaped Recovery
Table 115 North America Molecular Diagnostics Market Forecast by country 2021-2031 (US$ mn, AGR%, CAGR%)
Table 116 U.S. Molecular Diagnostics Market Forecast by Technology 2021-2031 (US$ mn, AGR%, CAGR%)
Table 117 U.S. Molecular Diagnostics Market Forecast by Technology 2021-2031 (US$ Mn, AGR%, CAGR%): "V" Shaped Recovery
Table 118 U.S. Molecular Diagnostics Market Forecast by Technology 2021-2031 (US$ Mn, AGR%, CAGR%): "U" Shaped Recovery
Table 119 U.S. Molecular Diagnostics Market Forecast by Technology 2021-2031 (US$ Mn, AGR%, CAGR%): "W" Shaped Recovery
Table 120 U.S. Molecular Diagnostics Market Forecast by Technology 2021-2031 (US$ Mn, AGR%, CAGR%): "L" Shaped Recovery
Table 121 U.S. Molecular Diagnostics Market Forecast by Application 2021-2031 (US$ mn, AGR%, CAGR%)
Table 122 U.S. Molecular Diagnostics Market Forecast by Application 2021-2031 (US$ Mn, AGR%, CAGR%): "V" Shaped Recovery
Table 123 U.S. Molecular Diagnostics Market Forecast by Application 2021-2031 (US$ Mn, AGR%, CAGR%): "U" Shaped Recovery
Table 124 U.S. Molecular Diagnostics Market Forecast by Application 2021-2031 (US$ Mn, AGR%, CAGR%): "W" Shaped Recovery
Table 125 U.S. Molecular Diagnostics Market Forecast by Application 2021-2031 (US$ Mn, AGR%, CAGR%): "L" Shaped Recovery
Table 126 U.S. Molecular Diagnostics Market Forecast by Product 2021-2031 (US$ mn, AGR%, CAGR%)
Table 127 U.S. Molecular Diagnostics Market Forecast by Product 2021-2031 (US$ Mn, AGR%, CAGR%): "V" Shaped Recovery
Table 128 U.S. Molecular Diagnostics Market Forecast by Product 2021-2031 (US$ Mn, AGR%, CAGR%): "U" Shaped Recovery
Table 129 U.S. Molecular Diagnostics Market Forecast by Product 2021-2031 (US$ Mn, AGR%, CAGR%): "W" Shaped Recovery
Table 130 U.S. Molecular Diagnostics Market Forecast by Product 2021-2031 (US$ Mn, AGR%, CAGR%): "L" Shaped Recovery
Table 131 U.S. Molecular Diagnostics Market Forecast by Test Location 2021-2031 (US$ mn, AGR%, CAGR%)
Table 132 U.S. Molecular Diagnostics Market Forecast by Test Location 2021-2031 (US$ Mn, AGR%, CAGR%): "V" Shaped Recovery
Table 133 U.S. Molecular Diagnostics Market Forecast by Test Location 2021-2031 (US$ Mn, AGR%, CAGR%): "U" Shaped Recovery
Table 134 U.S. Molecular Diagnostics Market Forecast by Test Location 2021-2031 (US$ Mn, AGR%, CAGR%): "W" Shaped Recovery
Table 135 U.S. Molecular Diagnostics Market Forecast by Test Location 2021-2031 (US$ Mn, AGR%, CAGR%): "L" Shaped Recovery
Table 136 U.S. Molecular Diagnostics Market Forecast, 2021-2031 (US$ Mn, AGR%, CAGR%)
Table 137 U.S. Molecular Diagnostics Market Forecast, 2021-2031 (US$ Mn, AGR%, CAGR%): "V" Shaped Recovery
Table 138 U.S. Molecular Diagnostics Market Forecast, 2021-2031 (US$ Mn, AGR%, CAGR%): "U" Shaped Recovery
Table 139 U.S. Molecular Diagnostics Market Forecast, 2021-2031 (US$ Mn, AGR%, CAGR%): "W" Shaped Recovery
Table 140 U.S. Molecular Diagnostics Market Forecast, 2021-2031 (US$ Mn, AGR%, CAGR%): "L" Shaped Recovery
Table 141 Canada Molecular Diagnostics Market Forecast by Technology 2021-2031 (US$ mn, AGR%, CAGR%)
Table 142 Canada Molecular Diagnostics Market Forecast by Technology 2021-2031 (US$ Mn, AGR%, CAGR%): "V" Shaped Recovery
Table 143 Canada Molecular Diagnostics Market Forecast by Technology 2021-2031 (US$ Mn, AGR%, CAGR%): "U" Shaped Recovery
Table 144 Canada Molecular Diagnostics Market Forecast by Technology 2021-2031 (US$ Mn, AGR%, CAGR%): "W" Shaped Recovery
Table 145 Canada Molecular Diagnostics Market Forecast by Technology 2021-2031 (US$ Mn, AGR%, CAGR%): "L" Shaped Recovery
Table 146 Canada Molecular Diagnostics Market Forecast by Application 2021-2031 (US$ mn, AGR%, CAGR%)
Table 147 Canada Molecular Diagnostics Market Forecast by Application 2021-2031 (US$ Mn, AGR%, CAGR%): "V" Shaped Recovery
Table 148 Canada Molecular Diagnostics Market Forecast by Application 2021-2031 (US$ Mn, AGR%, CAGR%): "U" Shaped Recovery
Table 149 Canada Molecular Diagnostics Market Forecast by Application 2021-2031 (US$ Mn, AGR%, CAGR%): "W" Shaped Recovery
Table 150 Canada Molecular Diagnostics Market Forecast by Application 2021-2031 (US$ Mn, AGR%, CAGR%): "L" Shaped Recovery
Table 151 Canada Molecular Diagnostics Market Forecast by Product 2021-2031 (US$ mn, AGR%, CAGR%)
Table 152 Canada Molecular Diagnostics Market Forecast by Product 2021-2031 (US$ Mn, AGR%, CAGR%): "V" Shaped Recovery
Table 153 Canada Molecular Diagnostics Market Forecast by Product 2021-2031 (US$ Mn, AGR%, CAGR%): "U" Shaped Recovery
Table 154 Canada Molecular Diagnostics Market Forecast by Product 2021-2031 (US$ Mn, AGR%, CAGR%): "W" Shaped Recovery
Table 155 Canada Molecular Diagnostics Market Forecast by Product 2021-2031 (US$ Mn, AGR%, CAGR%): "L" Shaped Recovery
Table 156 Canada Molecular Diagnostics Market Forecast by Test Location 2021-2031 (US$ mn, AGR%, CAGR%)
Table 157 Canada Molecular Diagnostics Market Forecast by Test Location 2021-2031 (US$ Mn, AGR%, CAGR%): "V" Shaped Recovery
Table 158 Canada Molecular Diagnostics Market Forecast by Test Location 2021-2031 (US$ Mn, AGR%, CAGR%): "U" Shaped Recovery
Table 159 Canada Molecular Diagnostics Market Forecast by Test Location 2021-2031 (US$ Mn, AGR%, CAGR%): "W" Shaped Recovery
Table 160 Canada Molecular Diagnostics Market Forecast by Test Location 2021-2031 (US$ Mn, AGR%, CAGR%): "L" Shaped Recovery
Table 161 Canada Molecular Diagnostics Market Forecast, 2021-2031 (US$ Mn, AGR%, CAGR%)
Table 162 Canada Molecular Diagnostics Market Forecast, 2021-2031 (US$ Mn, AGR%, CAGR%): "V" Shaped Recovery
Table 163 Canada Molecular Diagnostics Market Forecast, 2021-2031 (US$ Mn, AGR%, CAGR%): "U" Shaped Recovery
Table 164 Canada Molecular Diagnostics Market Forecast, 2021-2031 (US$ Mn, AGR%, CAGR%): "W" Shaped Recovery
Table 165 Canada Molecular Diagnostics Market Forecast, 2021-2031 (US$ Mn, AGR%, CAGR%): "L" Shaped Recovery
Table 166 Roche Diagnostics: Key Details, (CEO, HQ, Revenue, Founded, No. of Employees, Company Type, Website, Business Segment)
Table 167 Roche Diagnostics: Product Benchmarking
Table 168 Roche Diagnostics: Recent Developments, 2017-2020
Table 169 Abbott: Key Details, (CEO, HQ, Revenue, Founded, No. of Employees, Company Type, Website, Business Segment)
Table 170 Abbott: Product Benchmarking
Table 171 Abbott: Recent Developments, 2017-2020
Table 172 Becton, Dickinson and Company: Key Details, (CEO, HQ, Revenue, Founded, No. of Employees, Company Type, Website, Business Segment)
Table 173 Becton, Dickinson and Company: Product Benchmarking
Table 174 Becton, Dickinson and Company: Recent Developments, 2017-2020
Table 175 bioMérieux SA: Key Details, (CEO, HQ, Revenue, Founded, No. of Employees, Company Type, Website, Business Segment)
Table 176 bioMérieux SA: Product Benchmarking
Table 177 bioMérieux SA: Recent Developments, 2017-2020
Table 178 Bio-Rad Laboratories, Inc.: Key Details, (CEO, HQ, Revenue, Founded, No. of Employees, Company Type, Website, Business Segment)
Table 179 Bio-Rad Laboratories, Inc.: Product Benchmarking
Table 180 Bio-Rad Laboratories, Inc.: Recent Developments, 2017-2020
Table 181 Dako (Agilent Technologies): Key Details, (CEO, HQ, Revenue, Founded, No. of Employees, Company Type, Website, Business Segment)
Table 182 Dako (Agilent Technologies): Product Benchmarking
Table 183 Dako (Agilent Technologies): Recent Developments, 2017-2020
Table 184 Danaher: Key Details, (CEO, HQ, Revenue, Founded, No. of Employees, Company Type, Website, Business Segment)
Table 185 Danaher: Product Benchmarking
Table 186 Danaher: Recent Developments, 2017-2020
Table 187 FOUNDATION MEDICINE, INC.: Key Details, (CEO, HQ, Revenue, Founded, No. of Employees, Company Type, Website, Business Segment)
Table 188 FOUNDATION MEDICINE, INC.: Product Benchmarking
Table 189 FOUNDATION MEDICINE, INC.: Recent Developments, 2017-2020
Table 190 Genomic Health (Exact Sciences Corporation): Key Details, (CEO, HQ, Revenue, Founded, No. of Employees, Company Type, Website, Business Segment)
Table 191 Genomic Health (Exact Sciences Corporation): Product Benchmarking
Table 192 Genomic Health (Exact Sciences Corporation): Recent Developments, 2017-2020
Table 193 Hologic, Inc.: Key Details, (CEO, HQ, Revenue, Founded, No. of Employees, Company Type, Website, Business Segment)
Table 194 Hologic, Inc.: Product Benchmarking
Table 195 Hologic, Inc.: Recent Developments, 2017-2020
Table 196 Illumina, Inc.: Key Details, (CEO, HQ, Revenue, Founded, No. of Employees, Company Type, Website, Business Segment)
Table 197 Illumina, Inc.: Product Benchmarking
Table 198 Illumina, Inc.: Recent Developments, 2017-2020
Table 199 HTG Molecular Diagnostics, Inc.: Key Details, (CEO, HQ, Revenue, Founded, No. of Employees, Company Type, Website, Business Segment)
Table 200 HTG Molecular Diagnostics, Inc.: Product Benchmarking
Table 201 HTG Molecular Diagnostics, Inc.: Recent Developments, 2017-2020
Table 202 Grifols, S.A.: Key Details, (CEO, HQ, Revenue, Founded, No. of Employees, Company Type, Website, Business Segment)
Table 203 Grifols, S.A.: Product Benchmarking
Table 204 Grifols, S.A.: Recent Developments, 2017-2020
Table 205 QIAGEN: Key Details, (CEO, HQ, Revenue, Founded, No. of Employees, Company Type, Website, Business Segment)
Table 206 QIAGEN: Product Benchmarking
Table 207 QIAGEN: Recent Developments, 2017-2020
Table 208 Siemens Healthcare GmbH: Key Details, (CEO, HQ, Revenue, Founded, No. of Employees, Company Type, Website, Business Segment)
Table 209 Siemens Healthcare GmbH: Product Benchmarking
Table 210 Siemens Healthcare GmbH: Recent Developments, 2017-2020
Table 211 Sysmex Corporation: Key Details, (CEO, HQ, Revenue, Founded, No. of Employees, Company Type, Website, Business Segment)
Table 212 Sysmex Corporation: Product Benchmarking
Table 213 Sysmex Corporation: Recent Developments, 2017-2020
List of Figures
Figure 1 Global Molecular Diagnostics Market: Market Segmentation
Figure 2 North America Molecular Diagnostics Market: Market Dynamics
Figure 3 North America Molecular Diagnostics Market: SWOT Analysis
Figure 4 Porter’s Analysis
Figure 5 PEST Analysis
Figure 6 North America Molecular Diagnostics Market Forecast by Technology, 2021-2031 (US$ million, AGR %)
Figure 7 North America Molecular Diagnostics Market Share Forecast by Technology, 2021, 2026, 2031 (%)
Figure 8 North America Molecular Diagnostics Market for Polymerase Chain Reaction Segment: Revenue Forecast 2021-2031 (US$ million, AGR%)
Figure 9 North America PCR Market for Sub-Segment: Revenue Forecast 2021-2031 (US$ million, AGR%)
Figure 10 North America Molecular Diagnostics Market for Polymerase Chain Reaction Segment, Revenue Forecast 2021-2031 (US$ million, AGR%): “V” Shaped Recovery
Figure 11 North America Molecular Diagnostics Market for Polymerase Chain Reaction Segment, Revenue Forecast 2021-2031 (US$ million, AGR%): “U” Shaped Recovery
Figure 12 North America Molecular Diagnostics Market for Polymerase Chain Reaction Segment, Revenue Forecast 2021-2031 (US$ million, AGR%): “W” Shaped Recovery
Figure 13 North America Molecular Diagnostics Market for Polymerase Chain Reaction Segment, Revenue Forecast 2021-2031 (US$ million, AGR%): “L” Shaped Recovery
Figure 14 North America Molecular Diagnostics Market for In Situ Hybridization Segment: Revenue Forecast 2021-2031 (US$ million, AGR%)
Figure 15 North America Molecular Diagnostics Market for In Situ Hybridization Segment, Revenue Forecast 2021-2031 (US$ million, AGR%): “V” Shaped Recovery
Figure 16 North America Molecular Diagnostics Market for In Situ Hybridization Segment, Revenue Forecast 2021-2031 (US$ million, AGR%): “U” Shaped Recovery
Figure 17 North America Molecular Diagnostics Market for In Situ Hybridization Segment, Revenue Forecast 2021-2031 (US$ million, AGR%): “W” Shaped Recovery
Figure 18 North America Molecular Diagnostics Market for In Situ Hybridization Segment, Revenue Forecast 2021-2031 (US$ million, AGR%): “L” Shaped Recovery
Figure 19 North America Molecular Diagnostics Market for Isothermal Nucleic Acid Amplification Technology Segment: Revenue Forecast 2021-2031 (US$ million, AGR%)
Figure 20 North America Molecular Diagnostics Market for Isothermal Nucleic Acid Amplification Technology Segment, Revenue Forecast 2021-2031 (US$ million, AGR%): “V” Shaped Recovery
Figure 21 North America Molecular Diagnostics Market for Isothermal Nucleic Acid Amplification Technology Segment, Revenue Forecast 2021-2031 (US$ million, AGR%): “U” Shaped Recovery
Figure 22 North America Molecular Diagnostics Market for Isothermal Nucleic Acid Amplification Technology Segment, Revenue Forecast 2021-2031 (US$ million, AGR%): “W” Shaped Recovery
Figure 23 North America Molecular Diagnostics Market for Isothermal Nucleic Acid Amplification Technology Segment, Revenue Forecast 2021-2031 (US$ million, AGR%): “L” Shaped Recovery
Figure 24 North America Molecular Diagnostics Market for Chips and Microarrays Segment: Revenue Forecast 2021-2031 (US$ million, AGR%)
Figure 25 North America Molecular Diagnostics Market for Chips and Microarrays Segment, Revenue Forecast 2021-2031 (US$ million, AGR%): “V” Shaped Recovery
Figure 26 North America Molecular Diagnostics Market for Chips and Microarrays Segment, Revenue Forecast 2021-2031 (US$ million, AGR%): “U” Shaped Recovery
Figure 27 North America Molecular Diagnostics Market for Chips and Microarrays Segment, Revenue Forecast 2021-2031 (US$ million, AGR%): “W” Shaped Recovery
Figure 28 North America Molecular Diagnostics Market for Chips and Microarrays Segment, Revenue Forecast 2021-2031 (US$ million, AGR%): “L” Shaped Recovery
Figure 29 North America Molecular Diagnostics Market for Mass Spectrometry Segment: Revenue Forecast 2021-2031 (US$ million, AGR%)
Figure 30 North America Molecular Diagnostics Market for Mass Spectrometry Segment, Revenue Forecast 2021-2031 (US$ million, AGR%): “V” Shaped Recovery
Figure 31 North America Molecular Diagnostics Market for Mass Spectrometry Segment, Revenue Forecast 2021-2031 (US$ million, AGR%): “U” Shaped Recovery
Figure 32 North America Molecular Diagnostics Market for Mass Spectrometry Segment, Revenue Forecast 2021-2031 (US$ million, AGR%): “W” Shaped Recovery
Figure 33 North America Molecular Diagnostics Market for Mass Spectrometry Segment, Revenue Forecast 2021-2031 (US$ million, AGR%): “L” Shaped Recovery
Figure 34 North America Molecular Diagnostics Market for Sequencing Segment: Revenue Forecast 2021-2031 (US$ million, AGR%)
Figure 35 North America Molecular Diagnostics Market for Sequencing Segment, Revenue Forecast 2021-2031 (US$ million, AGR%): “V” Shaped Recovery
Figure 36 North America Molecular Diagnostics Market for Sequencing Segment, Revenue Forecast 2021-2031 (US$ million, AGR%): “U” Shaped Recovery
Figure 37 North America Molecular Diagnostics Market for Sequencing Segment, Revenue Forecast 2021-2031 (US$ million, AGR%): “W” Shaped Recovery
Figure 38 North America Molecular Diagnostics Market for Sequencing Segment, Revenue Forecast 2021-2031 (US$ million, AGR%): “L” Shaped Recovery
Figure 39 North America Molecular Diagnostics Market for Transcription Mediated Amplification Segment: Revenue Forecast 2021-2031 (US$ million, AGR%)
Figure 40 North America Molecular Diagnostics Market for Transcription Mediated Amplification Segment, Revenue Forecast 2021-2031 (US$ million, AGR%): “V” Shaped Recovery
Figure 41 North America Molecular Diagnostics Market for Transcription Mediated Amplification Segment, Revenue Forecast 2021-2031 (US$ million, AGR%): “U” Shaped Recovery
Figure 42 North America Molecular Diagnostics Market for Transcription Mediated Amplification Segment, Revenue Forecast 2021-2031 (US$ million, AGR%): “W” Shaped Recovery
Figure 43 North America Molecular Diagnostics Market for Transcription Mediated Amplification Segment, Revenue Forecast 2021-2031 (US$ million, AGR%): “L” Shaped Recovery
Figure 44 North America Molecular Diagnostics Market for Others Segment: Revenue Forecast 2021-2031 (US$ million, AGR%)
Figure 45 North America Molecular Diagnostics Market for Others Segment, Revenue Forecast 2021-2031 (US$ million, AGR%): “V” Shaped Recovery
Figure 46 North America Molecular Diagnostics Market for Others Segment, Revenue Forecast 2021-2031 (US$ million, AGR%): “U” Shaped Recovery
Figure 47 North America Molecular Diagnostics Market for Others Segment, Revenue Forecast 2021-2031 (US$ million, AGR%): “W” Shaped Recovery
Figure 48 North America Molecular Diagnostics Market for Others Segment, Revenue Forecast 2021-2031 (US$ million, AGR%): “L” Shaped Recovery
Figure 49 North America Molecular Diagnostics Market Forecast by Application, 2021-2031 (US$ million, AGR %)
Figure 50 North America Molecular Diagnostics Market Share Forecast by Application, 2021, 2026, 2031 (%)
Figure 51 North America Molecular Diagnostics Market for Oncology Segment: Revenue Forecast 2021-2031 (US$ million, AGR%)
Figure 52 North America Oncology Market for Sub-Segment: Revenue Forecast 2021-2031 (US$ million, AGR%)
Figure 53 North America Molecular Diagnostics Market for Oncology Segment, Revenue Forecast 2021-2031 (US$ million, AGR%): “V” Shaped Recovery
Figure 54 North America Molecular Diagnostics Market for Oncology Segment, Revenue Forecast 2021-2031 (US$ million, AGR%): “U” Shaped Recovery
Figure 55 North America Molecular Diagnostics Market for Oncology Segment, Revenue Forecast 2021-2031 (US$ million, AGR%): “W” Shaped Recovery
Figure 56 North America Molecular Diagnostics Market for Oncology Segment, Revenue Forecast 2021-2031 (US$ million, AGR%): “L” Shaped Recovery
Figure 57 North America Molecular Diagnostics Market for Pharmacogenomics Segment: Revenue Forecast 2021-2031 (US$ million, AGR%)
Figure 58 North America Molecular Diagnostics Market for Pharmacogenomics Segment, Revenue Forecast 2021-2031 (US$ million, AGR%): “V” Shaped Recovery
Figure 59 North America Molecular Diagnostics Market for Pharmacogenomics Segment, Revenue Forecast 2021-2031 (US$ million, AGR%): “U” Shaped Recovery
Figure 60 North America Molecular Diagnostics Market for Pharmacogenomics Segment, Revenue Forecast 2021-2031 (US$ million, AGR%): “W” Shaped Recovery
Figure 61 North America Molecular Diagnostics Market for Pharmacogenomics Segment, Revenue Forecast 2021-2031 (US$ million, AGR%): “L” Shaped Recovery
Figure 62 North America Molecular Diagnostics Market for Infectious Diseases Segment: Revenue Forecast 2021-2031 (US$ million, AGR%)
Figure 63 North America Infectious Diseases Market for Sub-Segment: Revenue Forecast 2021-2031 (US$ million, AGR%)
Figure 64 North America Molecular Diagnostics Market for Infectious Diseases Segment, Revenue Forecast 2021-2031 (US$ million, AGR%): “V” Shaped Recovery
Figure 65 North America Molecular Diagnostics Market for Infectious Diseases Segment, Revenue Forecast 2021-2031 (US$ million, AGR%): “U” Shaped Recovery
Figure 66 North America Molecular Diagnostics Market for Infectious Diseases Segment, Revenue Forecast 2021-2031 (US$ million, AGR%): “W” Shaped Recovery
Figure 67 North America Molecular Diagnostics Market for Infectious Diseases Segment, Revenue Forecast 2021-2031 (US$ million, AGR%): “L” Shaped Recovery
Figure 68 North America Molecular Diagnostics Market for Genetic Testing Segment: Revenue Forecast 2021-2031 (US$ million, AGR%)
Figure 69 North America Genetic Testing Market for Sub-Segment: Revenue Forecast 2021-2031 (US$ million, AGR%)
Figure 70 North America Molecular Diagnostics Market for Genetic Testing Segment, Revenue Forecast 2021-2031 (US$ million, AGR%): “V” Shaped Recovery
Figure 71 North America Molecular Diagnostics Market for Genetic Testing Segment, Revenue Forecast 2021-2031 (US$ million, AGR%): “U” Shaped Recovery
Figure 72 North America Molecular Diagnostics Market for Genetic Testing Segment, Revenue Forecast 2021-2031 (US$ million, AGR%): “W” Shaped Recovery
Figure 73 North America Molecular Diagnostics Market for Genetic Testing Segment, Revenue Forecast 2021-2031 (US$ million, AGR%): “L” Shaped Recovery
Figure 74 North America Molecular Diagnostics Market for Neurological Disease Segment: Revenue Forecast 2021-2031 (US$ million, AGR%)
Figure 75 North America Molecular Diagnostics Market for Neurological Disease Segment, Revenue Forecast 2021-2031 (US$ million, AGR%): “V” Shaped Recovery
Figure 76 North America Molecular Diagnostics Market for Neurological Disease Segment, Revenue Forecast 2021-2031 (US$ million, AGR%): “U” Shaped Recovery
Figure 77 North America Molecular Diagnostics Market for Neurological Disease Segment, Revenue Forecast 2021-2031 (US$ million, AGR%): “W” Shaped Recovery
Figure 78 North America Molecular Diagnostics Market for Neurological Disease Segment, Revenue Forecast 2021-2031 (US$ million, AGR%): “L” Shaped Recovery
Figure 79 North America Molecular Diagnostics Market for Cardiovascular Diseases Segment: Revenue Forecast 2021-2031 (US$ million, AGR%)
Figure 80 North America Molecular Diagnostics Market for Cardiovascular Diseases Segment, Revenue Forecast 2021-2031 (US$ million, AGR%): “V” Shaped Recovery
Figure 81 North America Molecular Diagnostics Market for Cardiovascular Diseases Segment, Revenue Forecast 2021-2031 (US$ million, AGR%): “U” Shaped Recovery
Figure 82 North America Molecular Diagnostics Market for Cardiovascular Diseases Segment, Revenue Forecast 2021-2031 (US$ million, AGR%): “W” Shaped Recovery
Figure 83 North America Molecular Diagnostics Market for Cardiovascular Diseases Segment, Revenue Forecast 2021-2031 (US$ million, AGR%): “L” Shaped Recovery
Figure 84 North America Molecular Diagnostics Market for Microbiology Segment: Revenue Forecast 2021-2031 (US$ million, AGR%)
Figure 85 North America Molecular Diagnostics Market for Microbiology Segment, Revenue Forecast 2021-2031 (US$ million, AGR%): “V” Shaped Recovery
Figure 86 North America Molecular Diagnostics Market for Microbiology Segment, Revenue Forecast 2021-2031 (US$ million, AGR%): “U” Shaped Recovery
Figure 87 North America Molecular Diagnostics Market for Microbiology Segment, Revenue Forecast 2021-2031 (US$ million, AGR%): “W” Shaped Recovery
Figure 88 North America Molecular Diagnostics Market for Microbiology Segment, Revenue Forecast 2021-2031 (US$ million, AGR%): “L” Shaped Recovery
Figure 89 North America Molecular Diagnostics Market for Others Segment: Revenue Forecast 2021-2031 (US$ million, AGR%)
Figure 90 North America Molecular Diagnostics Market for Others Segment, Revenue Forecast 2021-2031 (US$ million, AGR%): “V” Shaped Recovery
Figure 91 North America Molecular Diagnostics Market for Others Segment, Revenue Forecast 2021-2031 (US$ million, AGR%): “U” Shaped Recovery
Figure 92 North America Molecular Diagnostics Market for Others Segment, Revenue Forecast 2021-2031 (US$ million, AGR%): “W” Shaped Recovery
Figure 93 North America Molecular Diagnostics Market for Others Segment, Revenue Forecast 2021-2031 (US$ million, AGR%): “L” Shaped Recovery
Figure 94 North America Molecular Diagnostics Market Forecast by Product, 2021-2031 (US$ million, AGR %)
Figure 95 North America Molecular Diagnostics Market Share Forecast by Product, 2021, 2026, 2031 (%)
Figure 96 North America Molecular Diagnostics Market for Instruments Segment: Revenue Forecast 2021-2031 (US$ million, AGR%)
Figure 97 North America Molecular Diagnostics Market for Instruments Segment, Revenue Forecast 2021-2031 (US$ million, AGR%): “V” Shaped Recovery
Figure 98 North America Molecular Diagnostics Market for Instruments Segment, Revenue Forecast 2021-2031 (US$ million, AGR%): “U” Shaped Recovery
Figure 99 North America Molecular Diagnostics Market for Instruments Segment, Revenue Forecast 2021-2031 (US$ million, AGR%): “W” Shaped Recovery
Figure 100 North America Molecular Diagnostics Market for Instruments Segment, Revenue Forecast 2021-2031 (US$ million, AGR%): “L” Shaped Recovery
Figure 101 North America Molecular Diagnostics Market for Reagents Segment: Revenue Forecast 2021-2031 (US$ million, AGR%)
Figure 102 North America Molecular Diagnostics Market for Reagents Segment, Revenue Forecast 2021-2031 (US$ million, AGR%): “V” Shaped Recovery
Figure 103 North America Molecular Diagnostics Market for Reagents Segment, Revenue Forecast 2021-2031 (US$ million, AGR%): “U” Shaped Recovery
Figure 104 North America Molecular Diagnostics Market for Reagents Segment, Revenue Forecast 2021-2031 (US$ million, AGR%): “W” Shaped Recovery
Figure 105 North America Molecular Diagnostics Market for Reagents Segment, Revenue Forecast 2021-2031 (US$ million, AGR%): “L” Shaped Recovery
Figure 106 North America Molecular Diagnostics Market Forecast by Test Location, 2021-2031 (US$ million, AGR %)
Figure 107 North America Molecular Diagnostics Market Share Forecast by Test Location, 2021, 2026, 2031 (%)
Figure 108 North America Molecular Diagnostics Market for Point-of-Care Segment: Revenue Forecast 2021-2031 (US$ million, AGR%)
Figure 109 North America Molecular Diagnostics Market for Point-of-Care Segment, Revenue Forecast 2021-2031 (US$ million, AGR%): “V” Shaped Recovery
Figure 110 North America Molecular Diagnostics Market for Point-of-Care Segment, Revenue Forecast 2021-2031 (US$ million, AGR%): “U” Shaped Recovery
Figure 111 North America Molecular Diagnostics Market for Point-of-Care Segment, Revenue Forecast 2021-2031 (US$ million, AGR%): “W” Shaped Recovery
Figure 112 North America Molecular Diagnostics Market for Point-of-Care Segment, Revenue Forecast 2021-2031 (US$ million, AGR%): “L” Shaped Recovery
Figure 113 North America Molecular Diagnostics Market for Over the Counter Segment: Revenue Forecast 2021-2031 (US$ million, AGR%)
Figure 114 North America Molecular Diagnostics Market for Over the Counter Segment, Revenue Forecast 2021-2031 (US$ million, AGR%): “V” Shaped Recovery
Figure 115 North America Molecular Diagnostics Market for Over the Counter Segment, Revenue Forecast 2021-2031 (US$ million, AGR%): “U” Shaped Recovery
Figure 116 North America Molecular Diagnostics Market for Over the Counter Segment, Revenue Forecast 2021-2031 (US$ million, AGR%): “W” Shaped Recovery
Figure 117 North America Molecular Diagnostics Market for Over the Counter Segment, Revenue Forecast 2021-2031 (US$ million, AGR%): “L” Shaped Recovery
Figure 118 North America Molecular Diagnostics Market for Central Laboratories Segment: Revenue Forecast 2021-2031 (US$ million, AGR%)
Figure 119 North America Molecular Diagnostics Market for Central Laboratories Segment, Revenue Forecast 2021-2031 (US$ million, AGR%): “V” Shaped Recovery
Figure 120 North America Molecular Diagnostics Market for Central Laboratories Segment, Revenue Forecast 2021-2031 (US$ million, AGR%): “U” Shaped Recovery
Figure 121 North America Molecular Diagnostics Market for Central Laboratories Segment, Revenue Forecast 2021-2031 (US$ million, AGR%): “W” Shaped Recovery
Figure 122 North America Molecular Diagnostics Market for Central Laboratories Segment, Revenue Forecast 2021-2031 (US$ million, AGR%): “L” Shaped Recovery
Figure 123 North America Molecular Diagnostics Market Forecast by Country 2021-2031 (US$ million)
Figure 124 North America Molecular Diagnostics Market Share Forecast by Country 2021, 2026, 2031 (%)
Figure 125 U.S. Molecular Diagnostics Market Forecast by Technology, 2021-2031 (US$ million, AGR%)
Figure 126 U.S. Molecular Diagnostics Market by Technology, Revenue Forecast 2021-2031 (US$ million, AGR%): “V” Shaped Recovery
Figure 127 U.S. Molecular Diagnostics Market by Technology, Revenue Forecast 2021-2031 (US$ million, AGR%): “U” Shaped Recovery
Figure 128 U.S. Molecular Diagnostics Market by Technology, Revenue Forecast 2021-2031 (US$ million, AGR%): “W” Shaped Recovery
Figure 129 U.S. Molecular Diagnostics Market by Technology, Revenue Forecast 2021-2031 (US$ million, AGR%): “L” Shaped Recovery
Figure 130 U.S. Molecular Diagnostics Market Forecast by Application, 2021-2031 (US$ million, AGR%)
Figure 131 U.S. Molecular Diagnostics Market by Application, Revenue Forecast 2021-2031 (US$ million, AGR%): “V” Shaped Recovery
Figure 132 U.S. Molecular Diagnostics Market by Application, Revenue Forecast 2021-2031 (US$ million, AGR%): “U” Shaped Recovery
Figure 133 U.S. Molecular Diagnostics Market by Application, Revenue Forecast 2021-2031 (US$ million, AGR%): “W” Shaped Recovery
Figure 134 U.S. Molecular Diagnostics Market by Application, Revenue Forecast 2021-2031 (US$ million, AGR%): “L” Shaped Recovery
Figure 135 U.S. Molecular Diagnostics Market Forecast by Product, 2021-2031 (US$ million, AGR%)
Figure 136 U.S. Molecular Diagnostics Market by Product, Revenue Forecast 2021-2031 (US$ million, AGR%): “V” Shaped Recovery
Figure 137 U.S. Molecular Diagnostics Market by Product, Revenue Forecast 2021-2031 (US$ million, AGR%): “U” Shaped Recovery
Figure 138 U.S. Molecular Diagnostics Market by Product, Revenue Forecast 2021-2031 (US$ million, AGR%): “W” Shaped Recovery
Figure 139 U.S. Molecular Diagnostics Market by Product, Revenue Forecast 2021-2031 (US$ million, AGR%): “L” Shaped Recovery
Figure 140 U.S. Molecular Diagnostics Market Forecast by Test Location, 2021-2031 (US$ million, AGR%)
Figure 141 U.S. Molecular Diagnostics Market by Test Location, Revenue Forecast 2021-2031 (US$ million, AGR%): “V” Shaped Recovery
Figure 142 U.S. Molecular Diagnostics Market by Test Location, Revenue Forecast 2021-2031 (US$ million, AGR%): “U” Shaped Recovery
Figure 143 U.S. Molecular Diagnostics Market by Test Location, Revenue Forecast 2021-2031 (US$ million, AGR%): “W” Shaped Recovery
Figure 144 U.S. Molecular Diagnostics Market by Test Location, Revenue Forecast 2021-2031 (US$ million, AGR%): “L” Shaped Recovery
Figure 145 U.S. Molecular Diagnostics Market Forecast, 2021-2031 (US$ million, AGR %)
Figure 146 U.S. Molecular Diagnostics Market Forecast, 2021-2031 (US$ million, AGR%): “V” Shaped Recovery
Figure 147 U.S. Molecular Diagnostics Market Forecast, 2021-2031 (US$ million, AGR%): “U” Shaped Recovery
Figure 148 U.S. Molecular Diagnostics Market Forecast, 2021-2031 (US$ million, AGR%): “W” Shaped Recovery
Figure 149 U.S. Molecular Diagnostics Market Forecast, 2021-2031 (US$ million, AGR%): “L” Shaped Recovery
Figure 150 Canada Molecular Diagnostics Market Forecast by Technology, 2021-2031 (US$ million, AGR%)
Figure 151 Canada Molecular Diagnostics Market by Technology, Revenue Forecast 2021-2031 (US$ million, AGR%): “V” Shaped Recovery
Figure 152 Canada Molecular Diagnostics Market by Technology, Revenue Forecast 2021-2031 (US$ million, AGR%): “U” Shaped Recovery
Figure 153 Canada Molecular Diagnostics Market by Technology, Revenue Forecast 2021-2031 (US$ million, AGR%): “W” Shaped Recovery
Figure 154 Canada Molecular Diagnostics Market by Technology, Revenue Forecast 2021-2031 (US$ million, AGR%): “L” Shaped Recovery
Figure 155 Canada Molecular Diagnostics Market Forecast by Application, 2021-2031 (US$ million, AGR%)
Figure 156 Canada Molecular Diagnostics Market by Application, Revenue Forecast 2021-2031 (US$ million, AGR%): “V” Shaped Recovery
Figure 157 Canada Molecular Diagnostics Market by Application, Revenue Forecast 2021-2031 (US$ million, AGR%): “U” Shaped Recovery
Figure 158 Canada Molecular Diagnostics Market by Application, Revenue Forecast 2021-2031 (US$ million, AGR%): “W” Shaped Recovery
Figure 159 Canada Molecular Diagnostics Market by Application, Revenue Forecast 2021-2031 (US$ million, AGR%): “L” Shaped Recovery
Figure 160 Canada Molecular Diagnostics Market Forecast by Product, 2021-2031 (US$ million, AGR%)
Figure 161 Canada Molecular Diagnostics Market by Product, Revenue Forecast 2021-2031 (US$ million, AGR%): “V” Shaped Recovery
Figure 162 Canada Molecular Diagnostics Market by Product, Revenue Forecast 2021-2031 (US$ million, AGR%): “U” Shaped Recovery
Figure 163 Canada Molecular Diagnostics Market by Product, Revenue Forecast 2021-2031 (US$ million, AGR%): “W” Shaped Recovery
Figure 164 Canada Molecular Diagnostics Market by Product, Revenue Forecast 2021-2031 (US$ million, AGR%): “L” Shaped Recovery
Figure 165 Canada Molecular Diagnostics Market Forecast by Test Location, 2021-2031 (US$ million, AGR%)
Figure 166 Canada Molecular Diagnostics Market by Test Location, Revenue Forecast 2021-2031 (US$ million, AGR%): “V” Shaped Recovery
Figure 167 Canada Molecular Diagnostics Market by Test Location, Revenue Forecast 2021-2031 (US$ million, AGR%): “U” Shaped Recovery
Figure 168 Canada Molecular Diagnostics Market by Test Location, Revenue Forecast 2021-2031 (US$ million, AGR%): “W” Shaped Recovery
Figure 169 Canada Molecular Diagnostics Market by Test Location, Revenue Forecast 2021-2031 (US$ million, AGR%): “L” Shaped Recovery
Figure 170 Canada Molecular Diagnostics Market Forecast, 2021-2031 (US$ million, AGR %)
Figure 171 Canada Molecular Diagnostics Market Forecast, 2021-2031 (US$ million, AGR%): “V” Shaped Recovery
Figure 172 Canada Molecular Diagnostics Market Forecast, 2021-2031 (US$ million, AGR%): “U” Shaped Recovery
Figure 173 Canada Molecular Diagnostics Market Forecast, 2021-2031 (US$ million, AGR%): “W” Shaped Recovery
Figure 174 Canada Molecular Diagnostics Market Forecast, 2021-2031 (US$ million, AGR%): “L” Shaped Recovery
Figure 175 Roche Diagnostics: Net Revenue, 2015-2019 (US$ million, AGR%)
Figure 176 Roche Diagnostics: R&D Expenses, 2015-2019 (US$ million, AGR%)
Figure 177 Roche Diagnostics: Gross Profit, 2015-2019 (US$ million, AGR%)
Figure 178 Roche Diagnostics: Net Income, 2015-2019 (US$ million, AGR%)
Figure 179 Roche Diagnostics: EBDITA, 2015-2019 (US$ million, AGR%)
Figure 180 Abbott: Net Revenue, 2015-2019 (US$ million, AGR%)
Figure 181 Abbott: R&D Expenses, 2015-2019 (US$ million, AGR%)
Figure 182 Abbott: Gross Profit, 2015-2019 (US$ million, AGR%)
Figure 183 Abbott: Net Income, 2015-2019 (US$ million, AGR%)
Figure 184 Abbott: EBDITA, 2015-2019 (US$ million, AGR%)
Figure 185 Becton, Dickinson and Company: Net Revenue, 2015-2020 (US$ million, AGR%)
Figure 186 Becton, Dickinson and Company: R&D Expenses, 2015-2020 (US$ million, AGR%)
Figure 187 Becton, Dickinson and Company: Gross Profit, 2015-2020 (US$ million, AGR%)
Figure 188 Becton, Dickinson and Company: Net Income, 2015-2020 (US$ million, AGR%)
Figure 189 Becton, Dickinson and Company: EBDITA, 2015-2020 (US$ million, AGR%)
Figure 190 bioMérieux SA: Net Revenue, 2016-2019 (US$ million, AGR%)
Figure 191 bioMérieux SA: R&D Expenses, 2015-2019 (US$ million, AGR%)
Figure 192 bioMérieux SA: Gross Profit, 2015-2019 (US$ million, AGR%)
Figure 193 bioMérieux SA: Net Income, 2016-2019 (US$ million, AGR%)
Figure 194 bioMérieux SA: EBDITA, 2015-2019 (US$ million, AGR%)
Figure 195 Bio-Rad Laboratories, Inc.: Net Revenue, 2015-2019 (US$ million, AGR%)
Figure 196 Bio-Rad Laboratories, Inc.: R&D Expenses, 2015-2019 (US$ million, AGR%)
Figure 197 Bio-Rad Laboratories, Inc.: Gross Profit, 2015-2019 (US$ million, AGR%)
Figure 198 Bio-Rad Laboratories, Inc.: Net Income, 2015-2019 (US$ million, AGR%)
Figure 199 Bio-Rad Laboratories, Inc.: EBDITA, 2015-2019 (US$ million, AGR%)
Figure 200 Dako (Agilent Technologies): Net Revenue, 2015-2020 (US$ million, AGR%)
Figure 201 Dako (Agilent Technologies): R&D Expenses, 2015-2020 (US$ million, AGR%)
Figure 202 Dako (Agilent Technologies): Gross Profit, 2015-2020 (US$ million, AGR%)
Figure 203 Dako (Agilent Technologies): Net Income, 2015-2020 (US$ million, AGR%)
Figure 204 Dako (Agilent Technologies): EBDITA, 2015-2020 (US$ million, AGR%)
Figure 205 Danaher: Net Revenue, 2015-2019 (US$ million, AGR%)
Figure 206 Danaher: R&D Expenses, 2015-2019 (US$ million, AGR%)
Figure 207 Danaher: Gross Profit, 2015-2019 (US$ million, AGR%)
Figure 208 Danaher: Net Income, 2015-2019 (US$ million, AGR%)
Figure 209 Danaher: EBDITA, 2015-2019 (US$ million, AGR%)
Figure 210 Genomic Health (Exact Sciences Corporation): Net Revenue, 2015-2019 (US$ million, AGR%)
Figure 211 Genomic Health (Exact Sciences Corporation): R&D Expenses, 2015-2019 (US$ million, AGR%)
Figure 212 Genomic Health (Exact Sciences Corporation): Gross Profit, 2015-2019 (US$ million, AGR%)
Figure 213 Genomic Health (Exact Sciences Corporation): Net Income, 2015-2019 (US$ million, AGR%)
Figure 214 Genomic Health (Exact Sciences Corporation): EBDITA, 2015-2019 (US$ million, AGR%)
Figure 215 Hologic, Inc.: Net Revenue, 2015-2020 (US$ million, AGR%)
Figure 216 Hologic, Inc.: R&D Expenses, 2015-2020 (US$ million, AGR%)
Figure 217 Hologic, Inc.: Gross Profit, 2015-2020 (US$ million, AGR%)
Figure 218 Hologic, Inc.: Net Income, 2015-2020 (US$ million, AGR%)
Figure 219 Hologic, Inc.: EBDITA, 2015-2020 (US$ million, AGR%)
Figure 220 Illumina, Inc.: Net Revenue, 2015-2019 (US$ million, AGR%)
Figure 221 Illumina, Inc.: R&D Expenses, 2015-2019 (US$ million, AGR%)
Figure 222 Illumina, Inc.: Gross Profit, 2015-2019 (US$ million, AGR%)
Figure 223 Illumina, Inc.: Net Income, 2015-2019 (US$ million, AGR%)
Figure 224 Illumina, Inc.: EBDITA, 2015-2019 (US$ million, AGR%)
Figure 225 HTG Molecular Diagnostics, Inc.: Net Revenue, 2015-2019 (US$ million, AGR%)
Figure 226 HTG Molecular Diagnostics, Inc.: R&D Expenses, 2015-2019 (US$ million, AGR%)
Figure 227 HTG Molecular Diagnostics, Inc.: Gross Profit, 2015-2019 (US$ million, AGR%)
Figure 228 HTG Molecular Diagnostics, Inc.: Net Income, 2015-2019 (US$ million, AGR%)
Figure 229 HTG Molecular Diagnostics, Inc.: EBDITA, 2015-2019 (US$ million, AGR%)
Figure 230 Grifols, S.A.: Net Revenue, 2015-2019 (US$ million, AGR%)
Figure 231 Grifols, S.A.: R&D Expenses, 2015-2019 (US$ million, AGR%)
Figure 232 Grifols, S.A.: Gross Profit, 2015-2019 (US$ million, AGR%)
Figure 233 Grifols, S.A.: Net Income, 2015-2019 (US$ million, AGR%)
Figure 234 Grifols, S.A.: EBDITA, 2015-2019 (US$ million, AGR%)
Figure 235 QIAGEN: Net Revenue, 2015-2019 (US$ million, AGR%)
Figure 236 QIAGEN: R&D Expenses, 2015-2019 (US$ million, AGR%)
Figure 237 QIAGEN: Gross Profit, 2015-2019 (US$ million, AGR%)
Figure 238 QIAGEN: Net Income, 2015-2019 (US$ million, AGR%)
Figure 239 QIAGEN: EBDITA, 2015-2019 (US$ million, AGR%)
Figure 240 Siemens Healthcare GmbH: Net Revenue, 2015-2020 (US$ million, AGR%)
Figure 241 Siemens Healthcare GmbH: R&D Expenses, 2015-2020 (US$ million, AGR%)
Figure 242 Siemens Healthcare GmbH: Gross Profit, 2015-2020 (US$ million, AGR%)
Figure 243 Siemens Healthcare GmbH: Net Income, 2015-2020 (US$ million, AGR%)
Figure 244 Siemens Healthcare GmbH: EBDITA, 2015-2020 (US$ million, AGR%)
Figure 245 Sysmex Corporation: Net Revenue, 2016-2020 (US$ million, AGR%)
Figure 246 Sysmex Corporation: Gross Profit, 2016-2020 (US$ million, AGR%)
Figure 247 Sysmex Corporation: Net Income, 2016-2020 (US$ million, AGR%)
Figure 248 Sysmex Corporation: EBDITA, 2016-2020 (US$ million, AGR%)
Companies Profiled in the Report
Abbott
Becton, Dickinson, and Company
Bio-Rad Laboratories, Inc.
bioMérieux SA
Dako (Agilent Technologies)
Danaher
FOUNDATION MEDICINE, INC.
Genomic Health (Exact Sciences Corporation)
Grifols, S.A.
Hologic, Inc.
HTG Molecular Diagnostics, Inc.
Illumina, Inc.
QIAGEN
Roche Diagnostics
Siemens Healthcare GmbH
Sysmex Corporation
List of Other Companies
AdvanDx
Alere
Autogenomics, Inc.
AvariaDx
Bina Technologies, Inc.
Bio-Reference Laboratories
BIOBASE
Biocartis
BioFire Diagnostics
bioTheranostics
CareFusion Corporation
Celera Diagnostics
DiaGenic
DiagnoCure
Dutalys
DxS
Gen-Probe
Great Basin Scientific, Inc.
Infectio Diagnstic, Inc.
Intelligent Medical Devices, Inc.
MDx Health
Meridian Bioscience, Inc.
Myriad Genetic Laboratories, Inc.
Olerup SSP AB
One Lambda
OPKO
Quest Diagnostics, Inc.
Quidel Corporation
Signature Diagnostics AG
Ventana Medical Systems, Inc.
List of Organizations
American Medical Association
FDA's Office of In Vitro Diagnostic Device Evaluation and Safety (OIVD)
National Institute for Health and Clinical Excellence (NICE)
Rashtriya Swasthya Bima Yojana (RSBY) - (Indian National Health Insurance Programme)
Rospotrebnadzor Federal Monitoring Agency
Seguro Popular (Mexican National Health Insurance Programme)
United Nations Population Division
US Centers for Disease Control and Prevention (CDC)
US Centers for Medicare and Medicaid Services (CMS)
US Congressional Research Service (CRS)
US Food and Drug Administration (FDA)
US National Healthcare Safety Network (NHSN)
USPS (United States Postal Service)
World Health Organisation (WHO)
 Market Report 2021-2031")