• Do you need definitive NASH market data?
• Succinct NASH market analysis?
• Technological insight?
• Actionable business recommendations?
Read on to discover how this definitive report can transform your own research and save you time.
The increase in prevalence of hepatic pathology and its pathophysiology have propelled the growth of the novel therapeutic studies, which has given birth to the novel therapeutic solutions such as Farnesoid X Receptor (FXR) agonists, incretins and probiotics. Most of these studies are in last phase of their clinical trials and commercialization is expected within a short period of time that could be used in treating patients with NASH.
Report highlights
• 132 quantitative tables, charts, and graphs across 145 pages
• Global NASH market outlook and analysis from to 2027
• Global NASH submarket forecasts and analysis from to 2027
• GFT 505
• Obeticholic Acid (INT-747)
• Simtuzumab and Liraglutide (Victoza)
• Vitamin E
• Pioglitazone
• Placebo
• Regional and National NASH market forecasts to 2027
• North America forecast to 2027:
• US forecast to 2027
• Canada forecast to 2027
• Mexico forecast to 2027
• South America forecast to 2027:
• Brazil forecast to 2027
• Argentina forecast to 2027
• Paraguay forecast to 2027
• Bolivia forecast to 2027
• Rest of South America forecast to 2027
• Europe forecast to 2027:
• Germany forecast to 2027
• UK forecast to 2027
• France forecast to 2027
• Italy forecast to 2027
• Spain forecast to 2027
• Rest of Europe forecast to 2027
• Asia-Pacific forecast to 2027
• Japan forecast to 2027
• India forecast to 2027
• China forecast to 2027
• Australia forecast to 2027
• Thailand forecast to 2027
• Rest of Asia-Pacific forecast to 2027
• Rest of World forecast to 2027:
• Middle East forecast to 2027
• Africa forecast to 2027
• Other Countries forecast to 2027
Key questions answered
• What does the future hold for the Pharmaceutical industry with regards to Nonalcoholic Steatohepatitis (NASH)
• Where should you target your business strategy?
• Which applications should you focus upon?
• Which disruptive technologies should you invest in?
• Which companies should you form strategic alliances with?
• Which company is likely to success and why?
• What business models should you adopt?
• What industry trends should you be aware of?
Target audience
• Leading Pharmaceutical companies
• Suppliers
• Contractors
• Technologists
• R&D staff
• Consultants
• Analysts
• CEO’s
• CIO’s
• COO’s
• Business development managers
• Investors
• Governments
• Agencies
• Banks
Visiongain is a trading partner with the US Federal Government
CCR Ref number: KD4R6
1. Report Overview
1.1 NASH Market Overview
1.2 Research Methodology
1.3 Primary Research
1.4 Secondary Research
1.5 Market Evaluation & Forecasting Methodology
1.6 Global NASH Market Segmentation
1.7 Overview of Findings
1.8 Why You Should Read This Report
1.9 How this report delivers
1.10 Key Questions Answered by this Analytical Report
1.11 Frequently Asked Questions (FAQ)
1.12 Who is This Report For?
1.13 Associated Visiongain Reports
1.14 About Visiongain
2. Introduction to NASH Market
2.1 Dos and Don’ts for NASH
2.2 Alcohol Intake
2.3 Use of Statin
2.4 Use of Hepatotoxic Drugs
2.5 Vaccination for Hepatitis A and B
3. NASH Market Forecast to 2027
4. NASH Market by Therapeutics: Market Forecast to 2027
4.1 Overview
4.2 GFT 505
4.2.1 Competitive Scenario
4.3 Obeticholic Acid (INT-747)
4.3.1 Competitive Scenario
4.4 Simtuzumab and Liraglutide (Victoza)
4.5.1 Competitive scenario
4.5 Vitamin E
4.5.1 Competitive Scenario
4.6 Pioglitazone
4.6.1 Competitive Scenario
4.7 Placebo
5. Regional NASH Market Forecasts to 2027
5.1 Regional NASH Market Forecast 2017-2027
5.2 North American NASH Market Forecast 2017-2027
5.2.1 USA NASH Market Forecast 2017-2027
5.2.2 Canada NASH Market Forecast 2017-2027
5.2.3 Mexico NASH Market Forecast 2017-2027
5.3 South American NASH Market Forecast 2017-2027
5.3.1 Brazil NASH Market Forecast 2017-2027
5.3.2 Argentina NASH Market Forecast 2017-2027
5.3.3 Paraguay NASH Market Forecast 2017-2027
5.3.4 Bolivia NASH Market Forecast 2017-2027
5.3.5 Rest of South America NASH Market Forecast 2017-2027
5.4 European NASH Market Forecast 2017-2027
5.4.1 France NASH Market Forecast 2017-2027
5.4.2 Germany NASH Market Forecast 2017-2027
5.4.3 UK NASH Market Forecast 2017-2027
5.4.4 Spain NASH Market Forecast 2017-2027
5.4.5 Italy NASH Market Forecast 2017-2027
5.4.6 Rest of Europe NASH Market Forecast 2017-2027
5.5 Asia-Pacific NASH Market Forecast 2017-2027
5.5.1 China NASH Market Forecast 2017-2027
5.5.2 Japan NASH Market Forecast 2017-2027
5.5.3 India NASH Market Forecast 2017-2027
5.5.4 Australia NASH Market Forecast 2017-2027
5.5.5 Thailand NASH Market Forecast 2017-2027
5.5.6 Rest of Asia-Pacific NASH Market Forecast 2017-2027
5.6 Rest of World NASH Market Forecast 2017-2027
5.6.1 Middle East NASH Market Forecast 2017-2027
5.6.2 Africa NASH Market Forecast 2017-2027
5.6.3 Other Countries NASH Market Forecast 2017-2027
6. NASH Market, Qualitative Analysis, 2017-2027
6.1 Porter’s Five Forces Analysis of the NASH Market
6.1.1 Bargaining Power of Buyers (Low)
6.1.2 Bargaining Power of Suppliers (Medium)
6.1.3 Threat of New Entrants (Low)
6.1.4 Threat of Substitute Products (Medium)
6.1.5 Intensity of Competitive Rivalry (Low)
6.2 Market Dynamics
6.3 Drivers
6.3.1 Rampant Growth Rate Of Obesity And Diabetes Globally
6.3.2 Acceleration in Initiatives For Research And Development Activities
6.4 Restraints
6.4.1 Slower Development Of Therapeutics for NASH
6.4.2 Blurred Understanding of Pathophysiology of NASH
6.4.3 Inefficient Diagnostic Technology for NASH
6.5 Opportunities
6.5.1 Biomarker technologies in diagnosis of NASH
7. Leading Companies in NASH Market
7.1 AstraZeneca Plc
7.1.1 AstraZeneca Plc: Company Overview
7.1.2 AstraZeneca Plc: Product Portfolio
7.2 Intercept Pharmaceuticals, Inc.
7.2.1 Intercept Pharmaceuticals, Inc.: Company Overview
7.2.2 Intercept Pharmaceuticals, Inc.: Recent Developments
7.3 GENFIT SA
7.3.1 GENFIT SA: Company Overview
7.3.2 GENFIT SA: Product Portfolio
7.4 Gilead Sciences, Inc.
7.4.1 Gilead Sciences, Inc.: Company Overview
7.4.2 Gilead Sciences, Inc.: Product Portfolio
7.4.3 Gilead Sciences, Inc.: Recent Developments
7.5 Merck & Co. Inc.
7.5.1 Merck & Co. Inc.: Company Overview
7.5.2 Merck & Co. Inc.: Product Portfolio
7.5.3 Merck & Co. Inc.: Recent Developments
7.6 Novartis AG
7.6.1 Novartis AG: Company Overview
7.6.2 Novartis AG: Product Portfolio
7.6.3 Novartis AG: Recent Developments
7.7 Bristol-Myers Squibb
7.7.1 Bristol-Myers Squibb: Company Overview
7.7.2 Bristol-Myers Squibb: Product Portfolio
7.8 Galmed Pharmaceuticals Ltd.
7.8.1 Galmed Pharmaceuticals Ltd.: Company Overview
7.8.2 Galmed Pharmaceuticals Ltd.: Recent Developments
7.9 Immuron Limited
7.9.1 Immuron Limited: Company Overview
7.10 Novo Nordisk AG
7.10.1 Novo Nordisk AG: Company Overview
7.10.2 Novo Nordisk AG: Product Portfolio
7.11 Other Companies of Interest in the NASH Market
8. Conclusions
8.1 Current Leading Segments
8.2 Leading Regional Markets
8.3 Emerging Markets
8.4 The Future of the Market?
9. Glossary
Associated Visiongain Reports
Visiongain Report Sales Order Form
Appendix A
About Visiongain
Appendix B
Visiongain report evaluation form
List of Figures
Figure 3.1 NASH Market, by Therapeutics, ($m), 2017-2027
Figure 4.1 NASH Market, by Therapeutics, Market Share (%), 2016
Figure 4.2 NASH Market, by Therapeutics, Forecast ($m) 2017-2027
Figure 4.3 Global GFT 505 for NASH Market Forecast, by Geography, ($m) 2017-2027
Figure 4.4 Global Obeticholic Acid (INT-747) for NASH Market Forecast, by Geography, ($m) 2017-2027
Figure 4.5 Global Simtuzumab and Liraglutide (Victoza) for NASH Market Forecast, by Geography, ($m) 2017-2027
Figure 4.6 Global Vitamin E for NASH Market Forecast, by Geography, ($m) 2017-2027
Figure 4.7 Global Pioglitazone for NASH Market Forecast, by Geography, ($m) 2017-2027
Figure 4.8 Global Placebo for NASH Market Forecast, by Geography, ($m) 2017-2027
Figure 5.1 Global NASH Market Forecast, by Geography, by Geography ($m) 2017-2027
Figure 5.2 Global NASH Market Forecast, by Geography, Market Share (%), 2016
Figure 5.3 North America NASH Market Forecast, by Country ($m) 2017-2027
Figure 5.4 North America NASH Market, by Country, Market Share (%), 2016
Figure 5.5 USA NASH Market Forecast ($m) 2017-2027
Figure 5.6 Canada NASH Market Forecast ($m) 2017-2027
Figure 5.7 Mexico NASH Market Forecast ($m) 2017-2027
Figure 5.8 South America NASH Market Forecast, by Country ($m) 2017-2027
Figure 5.9 South America NASH Market, by Country, Market Share (%), 2016
Figure 5.10 Brazil NASH Market Forecast ($m) 2017-2027
Figure 5.11 Argentina NASH Market Forecast ($m) 2017-2027
Figure 5.12 Paraguay NASH Market Forecast ($m) 2017-2027
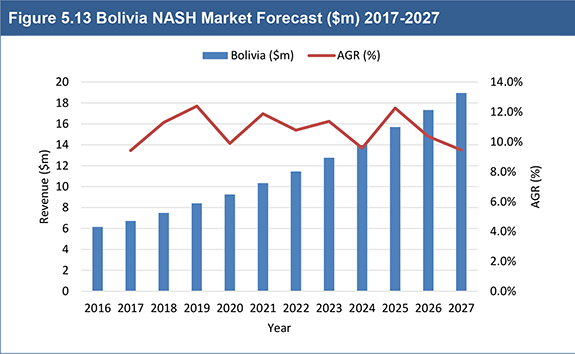
Figure 5.13 Bolivia NASH Market Forecast ($m) 2017-2027
Figure 5.14 Rest of South America NASH Market Forecast ($m) 2017-2027
Figure 5.15 Europe NASH Market Forecast, by Country ($m) 2017-2027
Figure 5.16 Europe NASH Market, by Country, Market Share (%), 2016
Figure 5.17 France NASH Market Forecast ($m) 2017-2027
Figure 5.18 Germany NASH Market Forecast ($m) 2017-2027
Figure 5.19 UK NASH Market Forecast ($m) 2017-2027
Figure 5.20 Spain NASH Market Forecast ($m) 2017-2027
Figure 5.21 Italy NASH Market Forecast ($m) 2017-2027
Figure 5.22 Rest of Europe NASH Market Forecast ($m) 2017-2027
Figure 5.23 Asia-Pacific NASH Market Forecast, by Country ($m) 2017-2027
Figure 5.24 Asia-Pacific NASH Market, Market Share (%), 2016
Figure 5.25 China NASH Market Forecast ($m) 2017-2027
Figure 5.26 Japan NASH Market Forecast ($m) 2017-2027
Figure 5.27 India NASH Market Forecast ($m) 2017-2027
Figure 5.28 Australia NASH Market Forecast ($m) 2017-2027
Figure 5.29 Thailand NASH Market Forecast ($m) 2017-2027
Figure 5.30 Rest of Asia-Pacific NASH Market Forecast ($m) 2017-2027
Figure 5.31 RoW NASH Market Forecast, by Country ($m) 2017-2027
Figure 5.32 Rest of World NASH Market, by Country, Market Share (%), 2016
Figure 5.33 Middle East NASH Market Forecast ($m) 2017-2027
Figure 5.34 Africa NASH Market Forecast ($m) 2017-2027
Figure 5.35 Other Countries NASH Market Forecast ($m) 2017-2027
Figure 6.1 Porter’s Five Forces Analysis of the NASH Market
Figure 6.2 Number of Incidences of Diabetes Globally, by Geography (2000, 2011 & 2030)
Figure 7.1 AstraZeneca Plc, Revenue, ($million), 2012-2016
Figure 7.2 AstraZeneca Plc, Product Segments Share (%), 2016
Figure 7.3 Intercept Pharmaceuticals, Inc., Revenue, ($million), 2012-2016
Figure 7.4 GENFIT SA, Revenue, ($million), 2012-2016
Figure 7.5 Gilead Sciences, Inc., Revenue, ($million), 2012-2016
Figure 7.6 Gilead Sciences, Inc., Product Segments Share (%), 2016
Figure 7.7 Gilead Sciences, Inc., Geographical Presence Share (%), 2016
Figure 7.8 Merck & Co. Inc., Revenue, ($million), 2012-2016
Figure 7.9 Merck & Co. Inc., Product Segments Share (%), 2016
Figure 7.10 Merck & Co. Inc., Geographical Presence Share (%), 2016
Figure 7.11 Novartis AG, Revenue, ($million), 2012-2016
Figure 7.12 Novartis AG, Product Segments Share (%), 2016
Figure 7.13 Novartis AG, Geographical Presence Share (%), 2016
Figure 7.14 Bristol-Myers Squibb, Revenue, ($million), 2012-2016
Figure 7.15 Bristol-Myers Squibb, Product Segments Share (%), 2016
Figure 7.16 Bristol-Myers Squibb, Geographical Presence Share (%), 2016
Figure 7.17 Novo Nordisk AG, Revenue, ($million), 2012-2016
Figure 8.1 World NASH, by Therapeutics, ($m), 2017-2027
Figure 8.2 World NASH, by Geography, ($m), 2017-2027
List of Tables
Table 3.1. NASH Market Forecast ($m, AGR%, CAGR%) 2017-2027
Table 4.1. NASH Market Forecast, by Therapeutics ($m, AGR%, CAGR%) 2017-2027
Table 4.2 Global GFT 505 for NASH Market Forecast, ($m, AGR%, CAGR%) 2017-2027
Table 4.3 Global GFT 505 for NASH Market Forecast, by Geography, ($m, AGR%, CAGR%) 2017-2027
Table 4.4 Global Obeticholic Acid (INT-747) for NASH Market Forecast, ($m, AGR%, CAGR%) 2017-2027
Table 4.5 Global Obeticholic Acid (INT-747) for NASH Market Forecast, by Geography ($m, AGR%, CAGR%) 2017-2027
Table 4.6 Global Simtuzumab and Liraglutide (Victoza) for NASH Market Forecast, ($m, AGR%, CAGR%) 2017-2027
Table 4.7 Global Simtuzumab and Liraglutide (Victoza) for NASH Market Forecast, by Geography ($m, AGR%, CAGR%) 2017-2027
Table 4.8 Global Vitamin E for NASH Market Forecast, ($m, AGR%, CAGR%) 2017-2027
Table 4.9 Global Vitamin E for NASH Market Forecast, by Geography ($m, AGR%, CAGR%) 2017-2027
Table 4.10 List of Key Pioglitazone Brands Available in the Market
Table 4.11 Global Pioglitazone for NASH Market Forecast, ($m, AGR%, CAGR%) 2017-2027
Table 4.12 Global Pioglitazone for NASH Market Forecast, by Geography ($m, AGR%, CAGR%) 2017-2027
Table 4.13 Global Placebo for NASH Market Forecast, ($m, AGR%, CAGR%) 2017-2027
Table 4.14 Global Placebo for NASH Market Forecast, by Geography ($m, AGR%, CAGR%) 2017-2027
Table 5.1 NASH Market Forecast, by Geography ($m, AGR%, CAGR%) 2017-2027
Table 5.2 North America NASH Market Forecast, by Country ($m, AGR%, CAGR%) 2017-2027
Table 5.3 USA NASH Market Forecast, ($m, AGR%, CAGR%) 2017-2027
Table 5.4 Canada NASH Market Forecast, ($m, AGR%, CAGR%) 2017-2027
Table 5.5 Mexico NASH Market Forecast, ($m, AGR%, CAGR%) 2017-2027
Table 5.6 South America NASH Market Forecast, by Country ($m, AGR%, CAGR%) 2017-2027
Table 5.7 Brazil NASH Market Forecast, ($m, AGR%, CAGR%) 2017-2027
Table 5.8 Argentina NASH Market Forecast, ($m, AGR%, CAGR%) 2017-2027
Table 5.9 Paraguay NASH Market Forecast, ($m, AGR%, CAGR%) 2017-2027
Table 5.10 Bolivia NASH Market Forecast, ($m, AGR%, CAGR%) 2017-2027
Table 5.11 Rest of South America NASH Market Forecast, ($m, AGR%, CAGR%) 2017-2027
Table 5.12 European NASH Market Forecast, by Country ($m, AGR%, CAGR%) 2017-2027
Table 5.13 France NASH Market Forecast, ($m, AGR%, CAGR%) 2017-2027
Table 5.14 Germany NASH Market Forecast, ($m, AGR%, CAGR%) 2017-2027
Table 5.15 UK NASH Market Forecast, ($m, AGR%, CAGR%) 2017-2027
Table 5.16 Spain NASH Market Forecast, ($m, AGR%, CAGR%) 2017-2027
Table 5.17 Italy NASH Market Forecast, ($m, AGR%, CAGR%) 2017-2027
Table 5.18 Rest of European NASH Market Forecast, ($m, AGR%, CAGR%) 2017-2027
Table 5.19 Asia-Pacific NASH Market Forecast, by Country ($m, AGR%, CAGR%) 2017-2027
Table 5.20 China NASH Market Forecast, ($m, AGR%, CAGR%) 2017-2027
Table 5.21 Japan NASH Market Forecast, ($m, AGR%, CAGR%) 2017-2027
Table 5.22 India NASH Market Forecast, ($m, AGR%, CAGR%) 2017-2027
Table 5.23 Australia NASH Market Forecast, ($m, AGR%, CAGR%) 2017-2027
Table 5.24 Thailand NASH Market Forecast, ($m, AGR%, CAGR%) 2017-2027
Table 5.25 Rest of Asia-Pacific NASH Market Forecast, ($m, AGR%, CAGR%) 2017-2027
Table 5.26 Rest of World NASH Market Forecast, by Country ($m, AGR%, CAGR%) 2017-2027
Table 5.27 Middle East NASH Market Forecast, ($m, AGR%, CAGR%) 2017-2027
Table 5.28 Africa NASH Market Forecast, ($m, AGR%, CAGR%) 2017-2027
Table 5.29 Other Countries NASH Market Forecast, ($m, AGR%, CAGR%) 2017-2027
Table 7.1 AstraZeneca Plc: Company Overview
Table 7.2 AstraZeneca Plc: Product Portfolio
Table 7.3 Intercept Pharmaceuticals, Inc.: Company Overview
Table 7.4 Intercept Pharmaceuticals, Inc.: Recent Developments
Table 7.5 GENFIT SA: Company Overview
Table 7.6 GENFIT SA: Product Portfolio
Table 7.7 Gilead Sciences, Inc.: Company Overview
Table 7.8 Gilead Sciences, Inc.: Product Portfolio
Table 7.9 Gilead Sciences, Inc.: Recent Developments
Table 7.10 Merck & Co. Inc.: Company Overview
Table 7.11 Merck & Co. Inc.: Product Portfolio
Table 7.12 Merck & Co. Inc.: Recent Developments
Table 7.13 Novartis AG: Company Overview
Table 7.14 Novartis AG: Product Portfolio
Table 7.15 Novartis AG: Recent Developments
Table 7.16 Bristol-Myers Squibb: Company Overview
Table 7.17 Bristol-Myers Squibb : Product Portfolio
Table 7.18 Galmed Pharmaceuticals Ltd.: Company Overview
Table 7.19 Galmed Pharmaceuticals Ltd.: Recent Developments
Table 7.20 Immuron Limited: Company Overview
Table 7.21 Novo Nordisk AG: Company Overview
Table 7.22 Novo Nordisk AG: Product Portfolio
Table 7.23 Other Companies of Interest in the NASH Market


